
Despite economic improvements in recent years — with rising median household income, falling unemployment, and a nearly complete recovery from the Great Recession by a number of measures — violent crime is on the rise. There were 17,250 murders in 2016, approximately 1,400 more than in 2015.
Just 25 cities accounted for nearly 1 in every 5 homicides last year. In these high-crime areas, increasing gang violence, drug trafficking, and domestic violence contributed to the uptick in homicides nationwide.
One city, however, was largely responsible for the increase in violent crime nationwide over the last year. In Chicago, there were 287 more murders in 2016 than in the year prior, increasing the city’s homicide rate from 18 murders per 100,000 residents to 28 incidents per 100,000. The uptick in murders in Chicago accounted for 21% of the total increase in homicides nationwide.
To identify America’s 25 murder capitals, 24/7 Wall St. reviewed data from the FBI’s Uniform Crime Reporting Program in 2016’s “Crime in the United States Report.” In the 25 cities with the highest homicide rate, there were more than 19 murders per 100,000 residents — nearly four times the national rate of 4.7 murders for every 100,000 Americans.
Click here to see the full list of America’s 25 murder capitals.
Click here to see our detailed findings and methodology.

Source: hanusst / iStock
25. Oakland, California
> Murder rate: 20.0 per 100,000
> No. of murders: 85
> Violent crime rate: 1,425.7 per 100,000
> Population: 424,998
Located in the San Francisco Bay Area, Oakland is the most dangerous city in California in terms of overall violent crime and among the most dangerous metros in the country. There were 1,426 violent crimes — murder, rape, robbery, and aggravated assault — reported per 100,000 residents in Oakland in 2016, the 10th most of any city. The high violent crime rate was largely driven by the high robbery and murder rates in the city. There were 20 murders per 100,000 residents in Oakland in 2016, far more than the U.S. homicide rate of 5 incidents per 100,000.
Oakland also has a relatively high property crime rate, which may be part of larger property crime problem affecting the San Francisco Bay Area as a whole. There were 5,636 property crimes per 100,000 residents in Oakland and 5,441 per 100,000 in San Francisco in 2016, each more than double the U.S. property crime rate. While property crime tends to fluctuate with poverty and Oakland’s poverty rate of 20.4% is far higher than the national rate of 15.5%, just 13.2% of San Francisco residents live in poverty — a relatively small share for the amount of property crime in the city.
[in-text-ad]

Source: Thinkstock
24. Washington, District of Columbia
> Murder rate: 20.3 per 100,000
> No. of murders: 138
> Violent crime rate: 1,132.0 per 100,000
> Population: 681,170
Washington, D.C. has some of the highest income inequality of any city. While 10.2% of households in the city earn less than $10,000 a year, 13.5% of households earn more than $200,000 — each some of the larger shares of any metro. Crime is often a symptom of poverty, and much of the violent crime in the nation’s capital is concentrated in the city’s poorest neighborhoods east of the Anacostia River. Across the city, there were 1,132 violent crimes per 100,000 D.C. residents in 2016, nearly three times the national rate. In total, there were 3,897 aggravated assaults, 3,149 robberies, 527 rapes, and 138 murders.
Adjusted for population, D.C. has more murders than nearly any other city. There were 20 homicides per 100,000 residents in 2016, four times the national rate.

Source: Thinkstock
23. Rochester, New York
> Murder rate: 20.5 per 100,000
> No. of murders: 43
> Violent crime rate: 880.1 per 100,000
> Population: 209,643
Rochester is one of the cities hit hardest by the manufacturing industry nationwide decline. While major employers such as Kodak, Xerox, and Bausch and Lomb, according to historian Dan Cody, once employed as many as 1 in 3 workers in Rochester in the 1980s, declining manufacturing revenues have since forced companies to downsize and lay off workers. This, in turn, has pushed many local residents into poverty. Today, some 33.5% of Rochester’s population lives in poverty, the 10th largest share of any city.
Crime has also become a major problem in Rochester, and the city has one of the highest homicide rates in the country. There were roughly 21 murders per 100,000 Rochester residents in 2016, far more than the national rate of 5 homicides per 100,000 Americans.

Source: Thinkstock
22. Baton Rouge, Louisiana
> Murder rate: 20.6 per 100,000
> No. of murders: 47
> Violent crime rate: 938.3 per 100,000
> Population: 228,389
There were 47 murders reported in Baton Rouge in 2016, a 22% decline from the year prior when 60 murders were reported in the city. Despite the decline, the murder rate remained one of the higher of U.S. metro areas. While the number of homicides fell, the number of total violent crimes — which also includes rape, robbery, and aggravated assault — increased 7%. There were approximately 140 more violent crimes in Baton Rouge in 2016 than in 2015, and the violent crime rate increased from 875 incidents per 100,000 residents to 938 per 100,000.
Baton Rouge is one of 12 cities slated to receive aid from the U.S. Justice Department in an effort to combat rising violent crime. The department will help Baton Rouge authorities study crime patterns and develop long-term plans to reduce gang and gun violence. As part of a separate initiative announced in October 2017, federal authorities plan to create a Violent Criminal Enterprises Strike Force in the city that will focus on deterring group violence, drug trafficking, and domestic violence.
[in-text-ad-2]
Source: SeanPavonePhoto / iStock
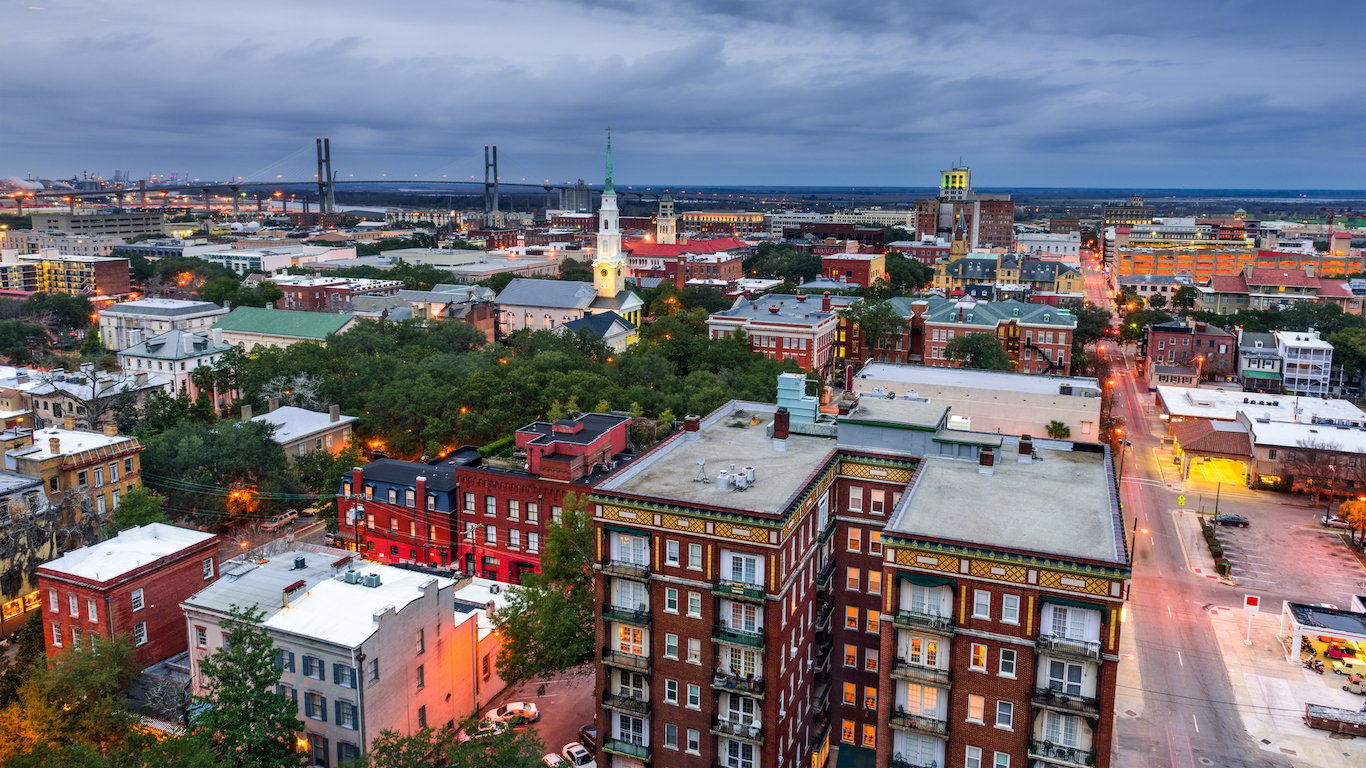
21. Savannah, Georgia
> Murder rate: 20.7 per 100,000
> No. of murders: 50
> Violent crime rate: 486.5 per 100,000
> Population: 241,296
The Savannah-Chatham Metropolitan Police Department reported 50 homicides in 2016, the second most of any city in Georgia and the 21st most of any city nationwide when adjusted for population. While Savannah has one of the highest murder rates of any city, overall violent crime in the city is relatively low. There were 487 violent crimes reported per 100,000 residents in Savannah in 2016, just about 100 more per 100,000 people than the U.S. violent crime rate of 387 incidents per 100,000 Americans.
Crime is often more prevalent in areas struggling with poverty and unemployment. In Savannah, 26.5% of residents live in poverty and 13.7% of households earn less than $10,000, each some of the largest shares of any city. Additionally, in 2016 some 5.8% of the workforce was unemployed, far higher than the annual average national unemployment rate of 4.9% .

Source: Thinkstock
20. Syracuse, New York
> Murder rate: 20.8 per 100,000
> No. of murders: 30
> Violent crime rate: 738.6 per 100,000
> Population: 143,925
Syracuse is one of several Rust Belt cities where the decline in manufacturing activity over the past several decades has coincided with an increase in poverty and violent crime. Today, 17.2% of Syracuse households earn less than $10,000 a year, and approximately 35% of Syracuse residents live in poverty, the 10th and seventh largest shares of any city.
While the city’s violent crime rate fell slightly over the last year — from 792 incidents per 100,000 residents in 2015 to 739 per 100,000 in 2016 — the incidence of murder increased. There were 30 homicides reported in Syracuse in 2016, a 36% increase from the year prior. As a result, Syracuse’s murder rate rose from 33rd highest in the country to 20th.
[in-text-ad]

Source: Thinkstock
19. Little Rock, Arkansas
> Murder rate: 21.1 per 100,000
> No. of murders: 42
> Violent crime rate: 1,531.2 per 100,000
> Population: 198,800
There were 21 murders reported per 100,000 residents in Little Rock in 2016, far more than the national rate of 5 homicides per 100,000 Americans. The city’s 2016 murder rate was also 31% higher than the 2015 rate. Little Rock’s homicide rate is now the 19th highest in the country, and the city ranks even higher in overall violent crime. There were 1,531 violent crimes — which also include rape, robbery, and aggravated assault — per 100,000 residents in the city last year, the ninth most of any U.S. metro.
As part of an effort to combat rising crime, Arkansas Gov. Asa Hutchinson announced in July 2017 the creation of an investigative joint task force that will assist the Little Rock Police Department respond to the uptick in criminal activity. The announcement came less than a week after a shootout at a nightclub in downtown Little Rock left 28 people injured, a shootout police believe was potentially gang related.
 24/7 Wall St.
Source: SeanPavonePhoto / iStock
18. Shreveport, Louisiana
> Murder rate: 21.4 per 100,000
> No. of murders: 42
> Violent crime rate: 949.3 per 100,000
> Population: 196,467
The number of homicides in Shreveport nearly doubled last year, from 22 in 2015 to 42 in 2016. In addition to an uptick in murder, there was a 23% increase in rape, 7% increase in robbery, and 16% increase in aggravated assault over the same period. In total, there were 949 violent crimes reported per 100,000 Shreveport residents in 2016, up 16% from 819 per 100,000 residents the year prior. By comparison, the national violent crime rate climbed 3% over the same period. While the prevalence of crime rose substantially in Shreveport last year, crime levels are still down substantially from their late-1980s peak, and 2014 was the least violent in about four decades.

Source: Thinkstock
17. Salinas, California
> Murder rate: 22.1 per 100,000
> No. of murders: 35
> Violent crime rate: 633.2 per 100,000
> Population: 158,729
There were 22 murders reported per 100,000 residents in Salinas in 2016, the most of any city in California other than San Bernardino. While violent crime is often most common in areas with widespread poverty and little personal wealth, just 4.6% of households in Salinas earn less than $10,000 a year, one of the smallest shares of any city.
According to Salinas Police Chief Kelly McMillin, gang activity in Salinas is on the high end compared to other cities in California and is responsible for much of the area’s violent crime. Witnesses in gang-related cases often fear retaliation and are reluctant to speak to police, and as a result many cases go unsolved. Just 13 arrests were made in the 40 homicides that occurred in the city in 2015. Others blame the high homicide rate on low police staffing levels, the result of budget cuts in recent years. Today, there are just 84 officers per 100,000 city residents, far fewer than the 123 per 100,000 in 2008 and a third of the national police-population ratio.
[in-text-ad-2]

Source: Thinkstock
16. Atlanta, Georgia
> Murder rate: 23.5 per 100,000
> No. of murders: 111
> Violent crime rate: 1,083.6 per 100,000
> Population: 472,579
Atlanta is one of many large cities that contributed the most to the increase in the national homicide rate over the past year. There were 111 murders in Atlanta in 2016, versus the 94 reported homicides in the city in 2015. The increase escalated Atlanta’s homicide rate from 17th highest in the country to 16th. While murders in the city increased in 2016, the number of violent crimes — which also includes rape, robbery, and aggravated assault — fell overall. There were 1,084 violent crimes reported per 100,000 residents in Atlanta in 2016, down from 1,120 incidents per 100,000 residents the year prior.
Crime is often more prevalent in areas with widespread poverty and high unemployment and Atlanta is one of the poorest major cities. Some 24.6% of Atlanta residents live in poverty, far more than the 15.5% of Americans. Additionally, 5.8% of the Atlanta workforce is unemployed, more than the national unemployment rate of 4.9%.

Source: Aneese / iStock
15. Milwaukee, Wisconsin
> Murder rate: 23.5 per 100,000
> No. of murders: 141
> Violent crime rate: 1533.0 per 100,000
> Population: 600,193
While the homicide rate nationwide increased 8% over the past year, there was a slight 3% decline in the number of murders reported per capita in Milwaukee. There were 23 murders reported per 100,000 residents in Milwaukee in 2016, a decrease from the 24 murders that were reported in the city per 100,000 residents in 2015. As a result, Wisconsin’s homicide rate fell from ninth highest in the country to 15th highest.
Despite the improvement, Milwaukee remains one of the most dangerous places in the country. Overall there were 1,533 violent crimes — which also includes rape, robbery, and aggravated assault — per 100,000 residents in 2016, nearly four times the national rate of 386 incidents per 100,000 residents and the eighth most of any city.
[in-text-ad]
Source: Thinkstock
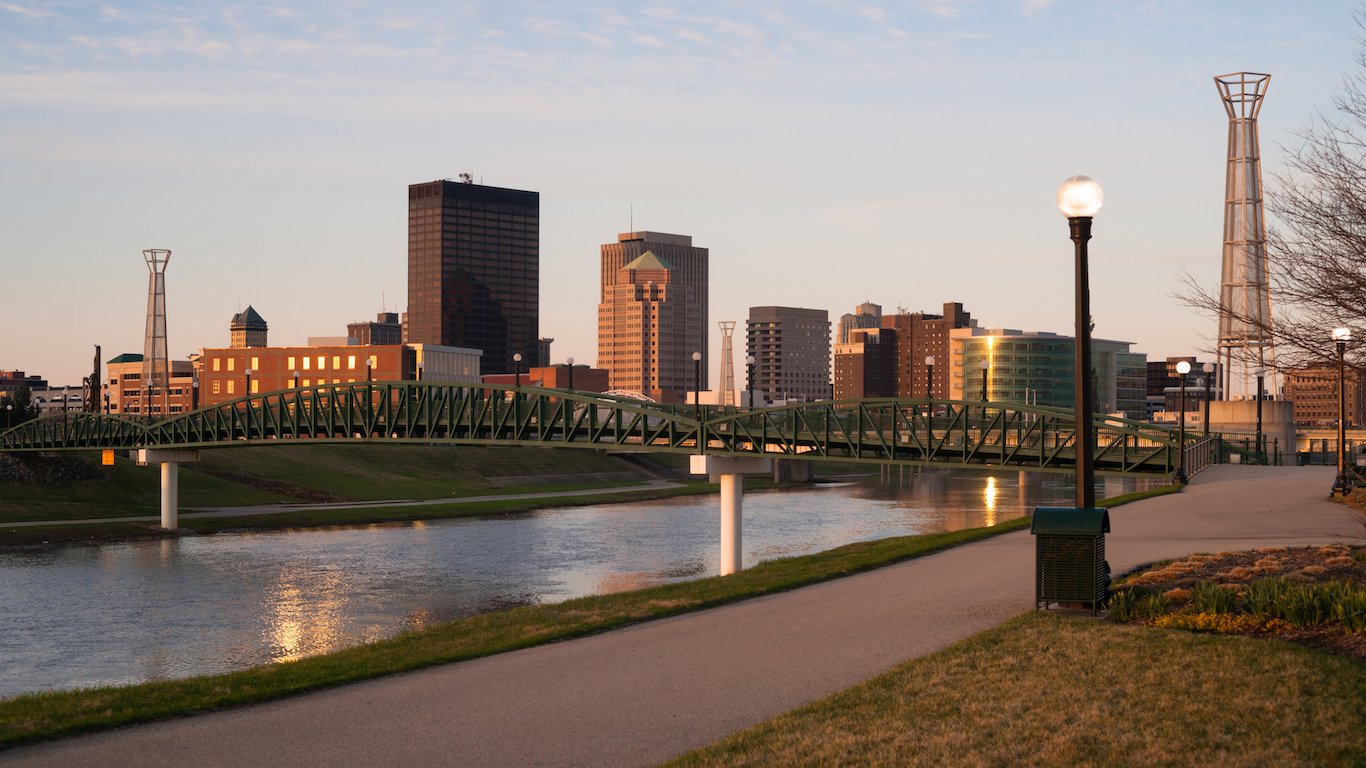
14. Dayton, Ohio
> Murder rate: 25.7 per 100,000
> No. of murders: 36
> Violent crime rate: 999.6 per 100,000
> Population: 140,260
There were 36 murders in Dayton in 2016, the second most of any city in Ohio when adjusted for population and 10 more murders than were reported in the city the year prior — pushing Dayton’s homicide rate from 19th highest in the country to 14th. There were also 133 rapes, 496 robberies, and 737 aggravated assaults. In total there were just about 1,000 violent crimes per 100,000 Dayton residents in 2016, close to three times the national rate of 386 violent crimes per 100,00 Americans.
Crime is frequently a symptom of poverty, and the poorest parts of the country often have the most criminal activity. In Dayton, some 19.7% of households earn less than $10,000 a year, and 35.5% of residents live in poverty, the sixth and fourth largest shares of any U.S. city.

Source: Thinkstock
13. Kansas City, Missouri
> Murder rate: 27.0 per 100,000
> No. of murders: 129
> Violent crime rate: 1,654.6 per 100,000
> Population: 478,364
There were 129 homicides reported in Kansas City in 2016, 20 more than in the year prior. Adjusted for population, the incidence of homicide rose 17% from 23 murders per 100,000 residents in 2015 to 27 murders per 100,000 in 2016 — more than twice the 8% increase nationwide. There was also an 11% increase in the number of rapes and robberies, and a 21% increase in aggravated assaults over the same period. In total, there were 1,655 violent crimes in Kansas City per 100,000 residents last year, a considerable increase from the 2015 rate of 1,417 incidents per 100,000 residents and the sixth most of any U.S. city.
Kansas City is one of 12 cities slated to receive aid from the U.S. Justice Department in combating the upward trend in violent crime. According to the June 2017 announcement introducing the program, the partnership will focus on fighting gun crime, drug trafficking, and gang violence.

Source: shipfactory / Shutterstock.com
12. Chicago, Illinois
> Murder rate: 28.1 per 100,000
> No. of murders: 765
> Violent crime rate: 1,105.5 per 100,000
> Population: 2,725,153
No city contributed more to the increase in the national homicide rate last year than Chicago. There were 287 more murders in Chicago in 2016 than there were in 2015, a 60% increase. In total, the city’s homicide rate of 29 murders per 100,000 residents last year was nearly six times the national rate of 5 homicides per 100,000 Americans.
Chicago’s spiraling crime rate has prompted analysis from sociologists and other experts, yet there is little consensus as to what is causing the spike in violence. One factor contributing to the high homicide rate in Chicago is gun violence. While the homicide rate in Chicago when guns are not involved is roughly similar to the rate in similar cities like New York, the city’s firearm-related homicide rate is one of the highest in the country. Chicago currently has more lenient firearm sentencing laws than New York. Illegal gun possession carries a one-year minimum sentence in Chicago, compared to 3.5 years in New York.
[in-text-ad-2]

Source: Thinkstock
11. San Bernardino, California
> Murder rate: 28.5 per 100,000
> No. of murders: 62
> Violent crime rate: 1,324.4 per 100,000
> Population: 217,303
San Bernardino was one of many large cities that contributed the most to the increase in the U.S. murder rate over the past year. There were 62 homicides reported in San Bernardino in 2016, a 41% increase from the 44 murders reported the year before — which included the December 2, 2015 mass shooting that claimed 14 lives and seriously injured 22 others.
The surge in homicide in San Bernardino last year is the largest percentage increase in murder in the area since 2012, when the city was forced to declare bankruptcy and cut funding for municipal services such as parks, libraries, and police. The San Bernardino Police Department has yet to rebuild its force. Today, there are 99 sworn officers per 100,000 San Bernardino residents, a considerably decline from the 171 officers per 100,000 the city had in 2008.

Source: Thinkstock
10. North Charleston, South Carolina
> Murder rate: 29.0 per 100,000
> No. of murders: 32
> Violent crime rate: 898.7 per 100,000
> Population: 110,490
While Charleston is a relatively safe city and is often named one of the most popular tourist destinations in the country, North Charleston, a city of roughly 110,000 residents located 5 miles to the north, is one of the most dangerous cities. There were 29 homicides reported per 100,000 North Charleston residents in 2015, more than three times the murder rate for Charleston proper and the 10th most of any U.S. city.
One factor contributing to the difference in violent crime prevalence between the two cities may be the large disparity in poverty and unemployment between them. While 22.7% of North Charleston residents live in poverty, only 17.8% of Charleston residents do. Similarly, some 4.5% of the North Charleston workforce is unemployed, far more than the 3.8% unemployment rate in Charleston.
[in-text-ad]

Source: Thinkstock
9. Memphis, Tennessee
> Murder rate: 29.9 per 100,000
> No. of murders: 196
> Violent crime rate: 1,820.0 per 100,000
> Population: 656,434
Barely any city contributed more to the increase in the national homicide rate last year than Memphis. There were 61 more murders in Memphis in 2016 than the year prior, the largest increase of any city other than Chicago. In total, there were 30 murders reported for every 100,000 city residents, compared to 21 murders per 100,000 in 2015. While the number of murders in the city rose 45% year-over-year, other violent crimes — rape, robbery and aggravated assault — were largely unchanged. According to the Memphis Police Department, there were five incidents with two homicide victims, and two incidents with three victims in 2016.
 24/7 Wall St.
Source: Thinkstock
8. Orlando, Florida
> Murder rate: 30.2 per 100,000
> No. of murders: 84
> Violent crime rate: 838.3 per 100,000
> Population: 277,719
There were 84 homicides in Orlando in 2016, an increase of 52 murders from the year prior. The city’s homicide rate nearly tripled, rising from 12 murders per 100,000 residents in 2015 to 30 incidents per 100,000 residents in 2016. The increase was largely due to the mass shooting at Pulse nightclub, which claimed 49 lives and wounded 58 others. The Pulse nightclub shooting is currently the second deadliest mass shooting in U.S. history. Excluding the casualties from the nightclub shooting, Orlando’s homicide rate would have remained largely unchanged from 2015 to 2016.
While the nightclub shooting drove Orlando’s homicide rate to the eighth highest of any city, the metro’s overall violent crime rate — which includes rape, robbery, and aggravated assault — lies outside of the top 60. There were 838 violent crimes per 100,000 Orlando residents in 2016, double the national rate yet the lowest of any city with more than 23 murders per 100,000 residents.

Source: Thinkstock
7. Jackson, Mississippi
> Murder rate: 34.1 per 100,000
> No. of murders: 58
> Violent crime rate: 853.2 per 100,000
> Population: 170,070
There were 34 violent crimes per 100,000 residents in Jackson in 2016, far more than the national rate and the seventh most of any U.S. city. Crime is often most common in areas with limited economic opportunity. In Jackson, 5.8% of the workforce is unemployed, far more than the national unemployment rate of 4.9%. Some 16.0% of households in Jackson earn less than $10,000 a year, and 30.9% of residents live in poverty — each some of the largest shares of any city.
Jackson is one of 12 cities slated to receive aid from the U.S. Justice Department in an effort to curb violent crime in the metro. According to the June 2017 announcement introducing the program, the partnership will focus on fighting gun crime, drug trafficking, and gang violence.
[in-text-ad-2]

Source: Thinkstock
6. Cleveland, Ohio
> Murder rate: 35.0 per 100,000
> No. of murders: 135
> Violent crime rate: 1,630.9 per 100,000
> Population: 386,227
There were 35 murders per 100,000 residents in Cleveland in 2016, seven times the national homicide rate of 5 murders per 100,000 Americans. Crime is often more prevalent in areas with widespread poverty and little personal wealth. Some 20.6% of Cleveland households earn less than $10,000 a year, and 36.2% of residents live in poverty — the third and fourth largest shares of any city.
One factor that can affect crime levels is the quality of the relationship between local police and the community. In 2014, the U.S. Department of Justice almost sued the Cleveland Division of Police after an investigative report found that the department had used excessive force against citizens, violated constitutional rights, and had inadequately policed its own officers. In May 2015, the Justice Department and Cleveland Division of Police entered into a court enforceable agreement that will force the department to introduce a number of reforms that will focus on building community trust and increasing police accountability.

Source: Thinkstock
5. Newark, New Jersey
> Murder rate: 35.5 per 100,000
> No. of murders: 100
> Violent crime rate: 936.9 per 100,000
> Population: 281,450
There were 36 murders per 100,000 Newark residents in 2016, nearly three times as many as any other city in New Jersey and the fifth most of any U.S. metro areas. While the relationship is complex, crime is often highest in cities with limited economic opportunity. In Newark, 7.9% of the workforce is unemployed, and 29.7% of residents live in poverty — far higher than the respective 4.9% and 15.5% national rates.
Like most large cities, much of Newark’s violent crime is concentrated in its poorest areas. According to a 2016 report by the Safer Newark Council, most violent crime in Newark occurs on just 20% of city streets, primarily in the city’s West and South Wards. The report also found that a vast majority of homicide in the city — approximately 75% — is gang or drug related.
[in-text-ad]

Source: Thinkstock
4. New Orleans, Louisiana
> Murder rate: 43.8 per 100,000
> No. of murders: 174
> Violent crime rate: 1,069.7 per 100,000
> Population: 397,208
New Orleans has the highest homicide rate in the South and the fourth highest homicide rate of any city in the nation. There were 44 murders per 100,000 residents in New Orleans in 2016, about nine times the national rate and a slight uptick from the 41 murders per 100,000 residents reported the year prior.
One factor that may keep crime rates high in New Orleans is the city’s understaffed police department. While the city’s population rose 41% from 2008 to 2016 — the sixth highest growth rate of any city — the number of sworn police officers fell by nearly 300. There are currently 295 officers per 100,000 residents in New Orleans, down from 514 officers per 100,000 residents in 2008.

Source: Thinkstock
3. Detroit, Michigan
> Murder rate: 45.2 per 100,000
> No. of murders: 303
> Violent crime rate: 2,046.5 per 100,000
> Population: 669,673
Detroit is one of the several major metropolitan areas that largely contributed to the increase in violent crime nationwide last year. As the number of violent crimes in Detroit rose 15.7% from 2015 to 2016 — far more than the 4.1% national increase and one of the sharpest spikes of any U.S. city — Detroit surpassed St. Louis as the most dangerous city in America. There are 2,047 violent crimes for every 100,000 Detroit residents, the most of any city and far more than the national rate of 386 violent crimes per 100,000 Americans. The increase was partially driven by a rise in homicide. There were 303 murders in Detroit in 2016, eight more than the year prior and the third most of any city when adjusted for population.

Source: Thinkstock
2. Baltimore, Maryland
> Murder rate: 51.4 per 100,000
> No. of murders: 318
> Violent crime rate: 1,780.4 per 100,000
> Population: 618,385
There were 51 murders in Baltimore per 100,000 residents in 2016, the most of any city other than St. Louis and more than 10 times the national rate of 5 homicides per 100,000 Americans. Baltimore also has a high prevalence of robberies. There were 857 robberies per 100,000 Baltimore residents in 2016, the most of any U.S. city.
Like many large metro areas, most of the gun violence in Baltimore is concentrated in the city’s poorest areas. According to a Baltimore Sun investigation, some 80% of gun-related homicides in Baltimore since 2011 have occurred in just 25% of the city’s neighborhoods.
[in-text-ad-2]

Source: Thinkstock
1. St. Louis, Missouri
> Murder rate: 59.8 per 100,000
> No. of murders: 188
> Violent crime rate: 1,913.2 per 100,000
> Population: 314,507
There were 60 homicides per 100,000 St. Louis residents in 2016, by far the most of any city. While the number of murders per capita in the city leveled off in 2016, the St. Louis homicide rate has risen in recent years, even as gun violence in other high-crime cities leveled off. One difference between St. Louis and similar areas is the city’s relatively tolerant gun control legislation. For example, individuals in St. Louis are allowed to carry a gun in a car without a permit, an illegal act in Chicago, Detroit, Baltimore, and New York City, according to state laws.
St. Louis also struggles with a high prevalence of rape, robbery, and aggravated assault. In total, there were 1,913 violent crimes per 100,000 St. Louis residents in 2016, the second most of any city.
Detailed Findings & Methodology
In some cities, the increase in the homicide rate may have resulted from a singular event. In Orlando, for example, the homicide rate nearly tripled from 12 murders per 100,000 residents in 2015 to 30 per 100,000 in 2016. The increase was largely due to the mass shooting at Pulse nightclub, which claimed 49 lives and wounded 58 others and was the deadliest mass shooting in U.S. history at the time it occurred. Excluding the casualties from the nightclub shooting, Orlando’s homicide rate would have remained largely unchanged.
Firearms are by far the most common murder weapon. Nationwide, 73% of homicides were gun related in 2016. One major difference between cities with high gun-related homicide rates and those without may be the varying strictness of gun control legislation. In Chicago, for example, illegal gun possession carries a one-year minimum sentence, compared to 3.5 years in New York City. In St. Louis, which has the highest homicide rate of any city, individuals are allowed to carry a gun in a car without a permit. This is illegal in Detroit, Baltimore, and New York City, according to state laws.
Many of the cities with high crime rates were hit hard by the Great Recession. As a result, the tax bases of many high-crime cities has shrunk over the past decade, and many cities have had to downsize their police departments. While a larger police force does not necessarily help reduce crime on its own, police chiefs in many cities with high murder rates have identified the low staffing levels in their departments as obstacles to curbing crime. In 18 of the 25 cities with the most murders per capita, the number of sworn police officers fell from 2008 to 2016.
Many police departments have implemented new initiatives in recent years aimed at reducing the homicide rate. Common measures include targeting policing efforts in areas where the likelihood of crime is the highest, as well as community policing efforts that attempt to solidify the bond of trust between community members and police officers.
The quality of the community-police relationship may be one of the most important variables in fighting crime. In an interview in September with 24/7 Wall St., John Roman, a senior fellow with the non-partisan research organization NORC at the University of Chicago, said, “[In] a community that has demonstrated in the streets, that doesn’t trust the police the way it used to” — places like Chicago, Baltimore, and San Bernardino — “… people won’t come forward as witnesses, they won’t talk to the police about why the violence is occurring.” In such conditions, Roman explained, crime tends to escalate.
While gun control legislation and policing efforts may have an effect on crime, the largest determinant of crime is the economy. Although the relationship is complex, crime is often the most prevalent in cities with poorer economies that offer limited opportunities. In each of the 25 cities with the highest homicide rates, the poverty rate is greater than the nationwide rate of 15.5%. In 23 of the 25 murder capitals of America, the share of residents earning less than $10,000 a year is larger than the national share of 7.2%. Similarly, the unemployment rate in 20 of the 25 cities with the most murders per capita is higher than the national jobless rate of 4.9%.
To identify the cities with the highest murder rates, 24/7 Wall St. reviewed data from the FBI’s Uniform Crime Reporting Program in 2016’s “Crime in the United States Report.” Homicide figures, also referred to as murder or nonnegligent manslaughter, generally refer to deaths that occur as the result of a fight, assault, or commission of a crime. Cities were ranked by their murder rate: the total number of murders for every 100,000 residents. Poverty rates are for 2016 and came from the Census Bureau’s American Community Survey. Unemployment rates are annualized for 2016 and came from the Bureau of Labor Statistics.
Take This Retirement Quiz To Get Matched With A Financial Advisor (Sponsored)
Take the quiz below to get matched with a financial advisor today.
Each advisor has been vetted by SmartAsset and is held to a fiduciary standard to act in your best interests.
Here’s how it works:
1. Answer SmartAsset advisor match quiz
2. Review your pre-screened matches at your leisure. Check out the
advisors’ profiles.
3. Speak with advisors at no cost to you. Have an introductory call on the phone or introduction in person and choose whom to work with in the future
Take the retirement quiz right here.
Thank you for reading! Have some feedback for us?
Contact the 24/7 Wall St. editorial team.
Editors' Picks

