
Highlights
- Rochester, NY was the country’s hottest housing market in March for the second month in a row.
- The top 20 hottest markets are spread out across 9 states, with five metros in both Ohio and Wisconsin.
- As price growth continues to slow nationwide, affordability remains a feature of 16 of March’s hottest markets.
- Only the Northeast and the Midwest were represented on this month’s hottest market list. Both the Northeast and the Midwest had 11 markets on the list (three-way tie for spot 20) .
- The Chicago metro area saw the largest increase in its hotness ranking among larger metros compared to last year, climbing 149 spots to rank as the 106th hottest US market in March.
Rochester, NY ranked as March’s hottest housing market. This is the 7th time in the metro’s history and the second month in a row that Rochester has ranked as the nation’s hottest market.
Realtor.com’s Market Hotness rankings take into account two aspects of the housing market: 1) market demand, as measured by unique views per property on Realtor.com, and 2) the pace of the market as measured by the number of days a listing remains active on Realtor.com.
Affordability Remains Important for Constrained Buyers
Overall, 16 of March’s hottest markets had median listing prices below the national median. The lowest priced market, Akron, Ohio, had a median listing price of $179,000, 57.8% lower than the country’s March median. The average listing price for the 20 hottest markets fell compared to last month as pricey western markets vacated the list. The average listing price of the top 20 markets was $384,000 in March, 9.6% lower than the national median.
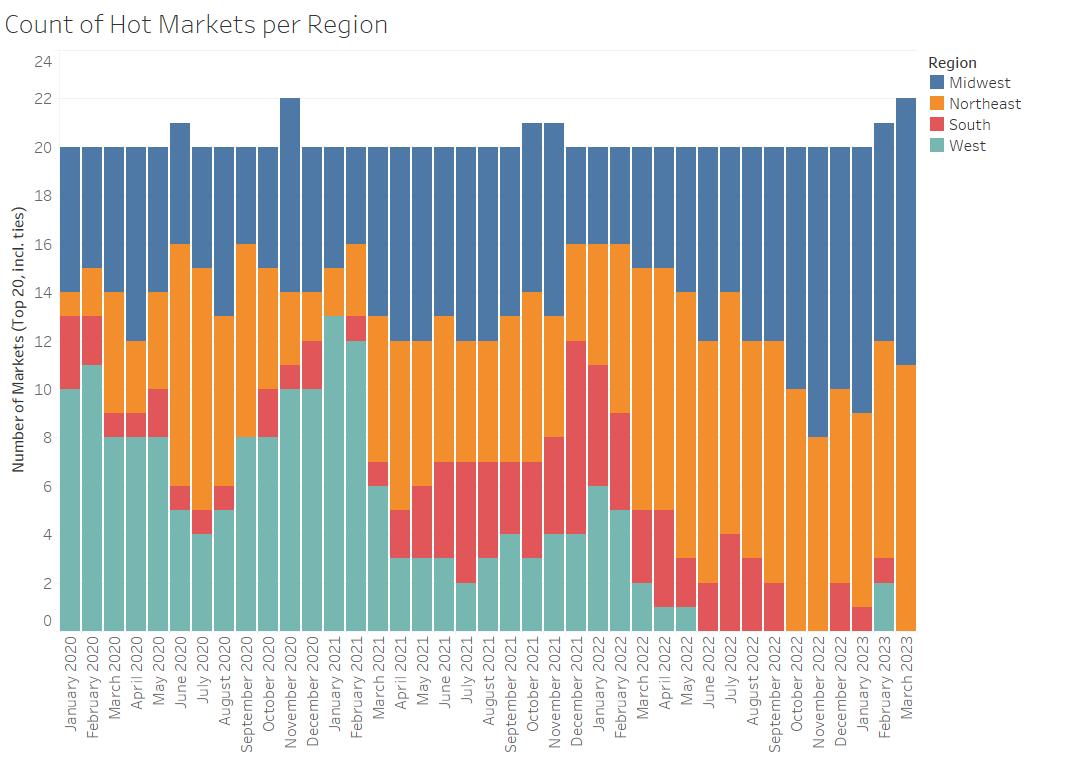
The Northeast and Midwest both had a very hot month, holding 11 spots each on March’s list. Northeast metros garnered an average 2.5 times the number of views per property as the typical US home while hot Midwest metro listings received twice the number of listings as was typical in the US. The hottest markets included five locales from Ohio and Wisconsin, three from Massachusetts, and two each from Pennsylvania, New Hampshire and Connecticut. One metros was featured from each Rhode Island, New York and Indiana.The oft-featured Hartford, CT, Worcester, MA and Toledo, OH metros stand out as these markets are also featured on the Top Markets Forecast for 2023.
The Manchester-Nashua, Springfield and Worcester metro areas all surround the Boston metro area, which is also on this month’s list, emphasizing the demand to be near this Northeast hub. These metros have been within the top twenty hottest markets for each of the last 14 months as the area surrounding Boston sees sustained demand. The number of listings in each of these metros has improved year-over-year, but is still significantly lower than pre-pandemic, and lags nationwide inventory recovery. This lack of inventory contributes to a quick pace of sale and high demand.
Affordable Midwest metros held 11 spots on this month’s list. The average listing price for these midwestern markets was $304,000, 18.4% below the national median, but an average 15.7% higher than one year ago for the markets included. Ohio boasts 5 markets on this month’s list, while Wisconsin is represented by 5 and Indiana by 1. The Midwestern markets on the list were all priced below the national median and garnered an average 2.0 times the number of views as the typical US listing. On average, homes in these Midwestern markets spent more than 2 weeks fewer on the market than was typical in March in the US.
The states featured in our top 20 list this month are: Connecticut, Indiana, Massachusetts, New Hampshire, New York, Ohio, Pennsylvania, Rhode Island and Wisconsin.
Our Hottest Housing Markets, by design, are the areas where homes sell fastest and have lots of potential buyers checking out each listing, suggesting relatively favorable conditions for sellers. As a group, Realtor.com’s 20 Hottest Housing Markets received 1.5 to 3.8 times the number of viewers per home for sale compared to the national rate. These markets are seeing homes-for-sale move up to 28 days more quickly than the typical property in the United States. Because homes in the hottest markets move fast, shoppers in these areas should be aware of conditions and have their finances in order, including a mortgage pre-approval, so that they can submit an offer quickly if they find a home that is a good fit.
High Demand and Climbing Prices in Hottest Markets
Listing viewership in the hottest markets was an average of 2.3 times the typical level in the US in March, emphasizing the sustained popularity of these hot markets relative to the full US market. Homes in the hottest markets attract a greater-than-typical number of home shoppers, with a larger difference between the national market and the hottest market than was common in the years before the pandemic. The key takeaway for buyers and sellers here is that while national real estate trends are an important context, these trends can drive activity towards or away from certain markets, so local demand may be quite different from national demand.
While inventory has increased 45.9% relative to last March at the US-level, all of the hottest markets have seen either slower inventory growth or even inventory decline. On the low side, Milwaukee has seen inventory decrease 18.0% year-over year. Dayton, OH saw the largest increase in listings among the hot markets in March, increasing 36.5% in March, still lagging US inventory growth by more than 10 percentage points. This relatively low inventory growth is a product of high demand and leads to short time on market, driving hot market status.
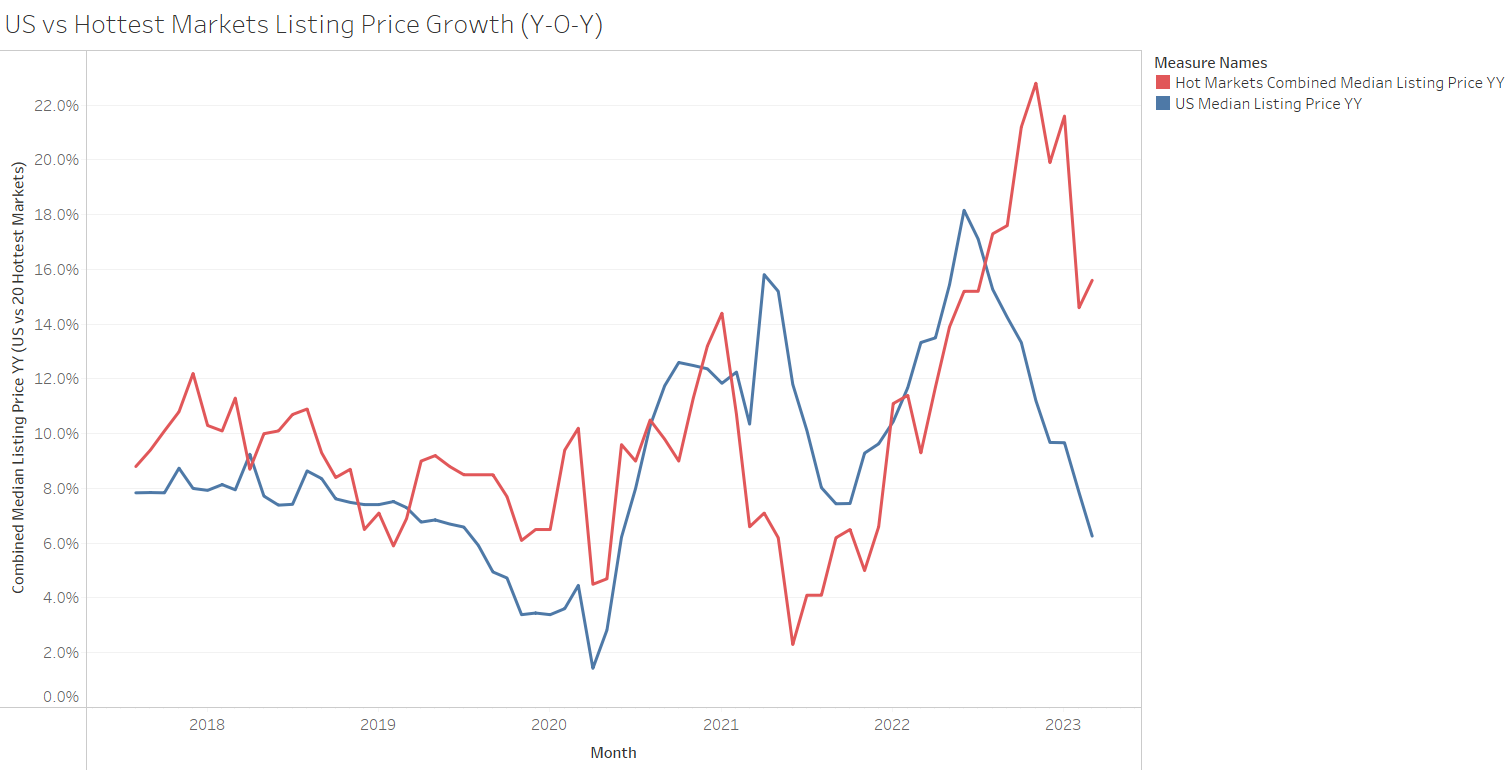
The median national home price for active listings climbed to $424,000 in March, with price growth slowing to 6.3% year-on-year. The majority of March’s hottest markets are relatively affordable markets that fall below the national median price, despite seeing price growth that outpaces the national rate. On average, these hot markets have seen prices increase by 15.6% year-over-year, more than doubling the national rate of 6.3%. March is the eighth month in a row that the average hottest markets’ price growth climbed beyond US price growth, which has been falling since June. The wide-ranging search for affordability is driving relatively high price growth in otherwise affordable locales, a trend consistent with greater interstate home shopping observed in the Realtor.com Q4-2022 Cross Market Demand Report.
Price per square foot growth mirrored the median listing price trends in the hottest markets. Price per square foot growth in this month’s hot markets outpaced US growth, though the price was lower than the US median. The average hot market price per square foot was 6.8% lower than the typical US price in March, up 8.5% compared to last March, outpacing the US’ 3.0% price per square foot growth.
March 2023 – Top 20 Hottest Housing Markets
| Hottest Metros | Hotness Rank | Hotness Rank YoY | Viewers per Property vs US | Median Days On Market | Days on Market YoY | Median Listing Price If Active Within Period |
| Rochester, N.Y. | 1 | -2 | 2.7 | 26 | 15 | $257,000 |
| Manchester-Nashua, N.H. | 2 | 1 | 3.1 | 31 | 22 | $550,000 |
| Hartford-West Hartford-East Hartford, Conn. | 3 | -19 | 3.8 | 36 | 10 | $403,000 |
| Columbus, Ohio | 4 | -1 | 2.5 | 32 | 16 | $375,000 |
| New Haven-Milford, Conn. | 5 | -5 | 2.5 | 33 | 12 | $399,000 |
| Worcester, Mass.-Conn. | 6 | -1 | 2.5 | 33 | 16 | $493,000 |
| Concord, N.H. | 7 | 5 | 3.3 | 37 | 22 | $510,000 |
| Springfield, Mass. | 8 | -8 | 2.5 | 37 | 13 | $346,000 |
| Boston-Cambridge-Newton, Mass.-N.H. | 9 | -6 | 1.8 | 30 | 12 | $824,000 |
| Janesville-Beloit, Wis. | 10 | -13 | 2.4 | 38 | 14 | $331,000 |
| Dayton, Ohio | 11 | -6 | 2.1 | 37 | 15 | $225,000 |
| Lafayette-West Lafayette, Ind. | 12 | -56 | 2.1 | 39 | 10 | $289,000 |
| La Crosse-Onalaska, Wis.-Minn. | 13 | 7 | 1.7 | 31 | 17 | $334,000 |
| State College, Pa. | 14 | -46 | 2 | 39 | 7 | $421,000 |
| Akron, Ohio | 15 | -91 | 1.9 | 39 | 3 | $179,000 |
| Canton-Massillon, Ohio | 16 | -71 | 1.7 | 34 | 3 | $202,000 |
| Toledo, Ohio | 17 | -51 | 1.8 | 38 | 7 | $209,000 |
| Providence-Warwick, R.I.-Mass. | 18 | -31 | 2 | 42 | 11 | $513,000 |
| Milwaukee-Waukesha-West Allis, Wis. | 19 | -90 | 1.5 | 33 | 4 | $366,000 |
| Allentown-Bethlehem-Easton, Pa.-N.J. | 20 | 0 | 1.8 | 40 | 19 | $375,000 |
| Madison, Wis. | 20 | -29 | 2 | 43 | 11 | $465,000 |
| Oshkosh-Neenah, Wis. | 20 | -80 | 2.8 | 46 | 3 | $373,000 |
Northeast Hotspot Takes the Crown
The Rochester, NY metro area was the country’s hottest market this month. This market saw high demand and a quick market pace. Rochester was red-hot due to its quick market pace of just 26 days on average, a month less than the national median.
The median listing price of homes in the Rochester metro area was $257,000 in March, up a sizable 17.1% year-over-year, faster than the 6.3% advance in the national median listing price in the same period. This is the third highest median listing price for Rochester in the data’s history. The typical home listing in Rochester is priced 39.4% below the national median price of $424,000.
Home prices grew year-over-year in Rochester due to both general price growth and a shift in home size. The median for-sale home size in Rochester increased by 2.2% compared to March 2022. Controlling for home size, the median listing price per square foot increased by 10.1% compared to the previous year, indicating some of the overall listing price growth is due to the larger homes being sold in this area compared to the previous year.
Most Improved Large Markets
Larger urban markets heated up this month, with the largest 40 markets across the country getting 12 ranks hotter, on average, since March 2022.
In line with overall hottest market trends, all five of the most-improved large housing markets were in the Midwest: Chicago, IL (+149 spots), Cleveland, OH (+111 spots), Cincinnati, OH (+105 spots), Minneapolis, MN (+95 spots) and Milwaukee, WI (+90 spots). Most of these markets offered highly sought-after affordability, with listing prices as much as $213,000 below the national median in Cleveland. Minneapolis, however, was priced above the national median.
The Chicago, IL housing market saw the fastest year-over-year hotness growth in the metro’s data history, earning it the position of fastest-rising large market in March. In the fourth quarter of 2022, this metro received almost 80% of its attention from viewers within the Chicago metro according to Realtor.com Cross-Market Demand data. In March, the Chicago area rose 149 spots in hotness rank compared to last year. The metro area clocked in as the 106th hottest metro in the US. Homes in Chicago typically spent 42 days on the market in March, 12 days fewer than the typical US home. On the demand side, properties in the metro garnered roughly the same number of viewers as the typical US property.
On the supply side, the five most-improved large markets saw inventory spend 41 days on the market, roughly a week more than last March and an average of 12 days faster than the typical US home. In comparison, the largest 40 markets overall saw properties spend roughly 17 days more time on the market than last year, on average.
Markets Seeing the Largest Jump in Rankings (March 2023)
| Metro | Hotness Rank | Hotness Rank YoY | Viewers per Property vs US | Median Days On Market | Days on Market YoY | Median Days On Market Vs Us |
| Chicago-Naperville-Elgin, Ill.-Ind.-Wis. | 106 | -149 | 0.98 | 42 | 6 | -12 |
| Cleveland-Elyria, Ohio | 51 | -111 | 1.65 | 47 | 5 | -7 |
| Cincinnati, Ohio-Ky.-Ind. | 35 | -105 | 1.63 | 43 | 8 | -10 |
| Minneapolis-St. Paul-Bloomington, Minn.-Wis. | 79 | -95 | 1.05 | 40 | 11 | -14 |
| Milwaukee, WI | 19 | -90 | 1.54 | 33 | 4 | -21 |
Note: With the release of its February 2023 Housing Report and Data, Realtor.com® incorporated a new and improved methodology for capturing and reporting housing inventory trends and metrics. As a result of these changes, this release is not directly comparable with previous data releases and reports. However, future data releases, including historical data, will consistently apply the new methodology.