A reader requests that we update some of the charts we’ve used to track U.S. energy expenditures.
 |
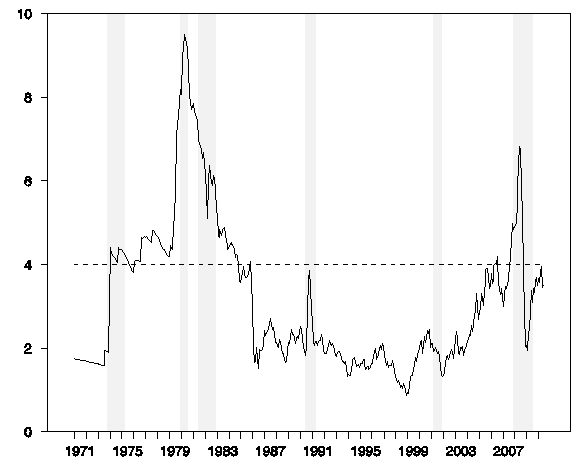
The above graph is an adaptation of Steve Kopits’ portrayal of the rough monthly value of U.S. crude oil purchases as a percentage of GDP. We came near what Steve suggests is a critical 4% threshold in the spring, but oil price declines since then have brought the share back down a bit.
 |
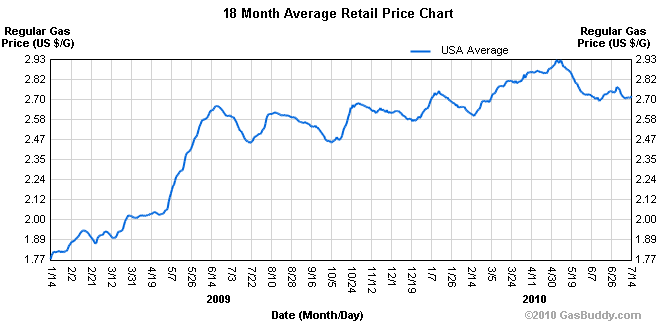
U.S. retail gasoline prices have also eased somewhat from their April peak.
 |
Another measure I look at is consumption expenditures on energy goods and services as a percentage of total personal consumption spending. Here is an update of that graph that includes figures for May.
 |
My view when I reviewed these data last April was that oil prices were exerting a moderate drag on the economy, but would not be enough to derail the recovery, and that is how I continue to see the situation. I expect disappointing, but nonetheless still positive, real GDP growth for the second half of 2010.
It should be worth keeping an eye on this for the next little while. I follow this closely and my numbers show crude consumption is starting to push back up to 2006 and 2007 levels. Mind you, this is summer driving season, so it might not persist, plus my numbers include some industrial consumption where I suspect there might be some temporarily elevated activities. (No indication of a double dip that I can see here.)
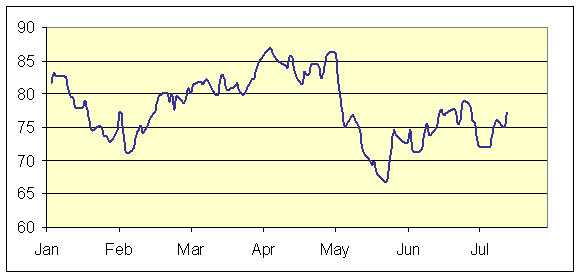
With inventories still at high levels and expectations of global demand easing, prices have remained stable. But, if this consumption persists and prices do rise, then you will be getting a good test of your hypothesis. It appears consumers have largely adapted to crude in the $70-$80 range. How will they respond if it moves to $90 or higher?
Thanks for the updated graphs!
Is there any way to get an Econbrowser RSS feed with just Hamilton’s posts? I don’t want to have to filter out Chinn’s posts, but I do want to read Hamilton’s.
As a criticism, the x axis is hard to read. You don’t even make the labeled year points larger or bolder so you have to guess which year is which. The graph of this data is one of my favorites so you should consider expanding it to show, for example, presidential terms – which you could show with dashed lines extending vertically or with colors. I would also show the embargoes but that’s not as important. The belabored (benighted) Carter Presidency then stands out as beleaguered by the energy jump. I can’t fit more “be-something” words in that sentence.
And my suggestion to the commenter above’s issue is an RSS feed that sends him Paul Krugman’s blog.
Although I wasn’t the reader who made the request, thanks very much for this!
jonathan:
I’m not sure I follow. I wish to read Krugman even less than I wish to read Chinn. In other words, I want to read neither Chinn nor Krugman. Only Hamilton.
Or did I miss a joke?
@JohnW :
Yes, you missed a joke. Indeed.
And the text of all comments is strictly bound to the left side of your browser’s page. Have you got it ?
Anyway, JDH is worth to read.
That’s helpful that you broke out oil expenditures from total energy expenditures. However, total energy expenditures of GDP is yet another way to debunk the now all too common notion that “energy is no longer a big portion of US GDP.
Do you think your readers understand you are breaking out just oil, and not energy, expenditure? When I do posts such as these (see Total Energy expenditures as a percentage of GDP) , I find that overstatement or over-clarification is never a problem.
G
Gregor: first graph is just oil; last graph is all energy
@Johannes:
The problem for me is that lately the ratio of Chinn posts to Hamilton posts on Econbrowser has been about 2 or 3 to 1. If I cannot get only Hamilton posts, I am considering dropping the Econbrowser RSS feed.
JohnW: I don’t know technically how to separate RSS, so please drop this thread, and, if you wish, the feed as well.
Thank you very much, Professor. This post is very interesting.
I have one question on the graph of the monthly value of oil purchases as a percentage of GDP. Does the ratio shoot up because of high oil price or low GDP figure or both?
GDP lowers at the time of recession. So, even if oil price doesn’t climb, the ratio of oil purchases as a percentage of GDP goes up in recession.
I have no idea on whether high oil price causes recession or not.
Have you seen the Baltic Dry Index recently?
It’s interesting to see that energy expenditures were above 6% in terms of total PCE during the 1959-1969 period – apparently that didn’t seem to have an adverse affect on the US economy.
Of course, the most important question is how severe the consequences will be when global oil production falls off its current plateau and begins to decline – likely within a few years.
SecondLook
The downward trend over 1959-69 may however also be of interest. The trend might be as important as the level.
Note the US did have a recession in 1959-60 that’s how Nixon lost the election to Kennedy.
valuethinker,
The downward trend is of note; but, that can be easily explained by the fact that crude oil prices were fairly static during the period (fluctuating between $2.85 and $3.35), and household incomes in terms of real purchasing power was steadily increasing.
However, the fact remains that the percent of income spent on energy was still higher than what is suggested as a critical threshold.
I would speculate that threshold has more validity in the context of slowly rising to stagnant incomes versus a steady increase in the cost of energy. The condition of the last decade.
SecondLook
Energy prices include electricity and home heating costs.
My guess is electricity prices, being regulated, rose very little– perhaps not even with inflation. It was an era of soaring electricity demand so perhaps even falling real prices. Home heating was a mix of coal, oil and some gas- -don’t know there. The switch to gas (which was large about then, I think) probably did have a significant impact on energy expenditure.
Agree if prices of energy are fairly stable, and incomes are rising, it’s of less significance to the economy (1950s) as opposed to rising prices and flat real incomes (2000s).