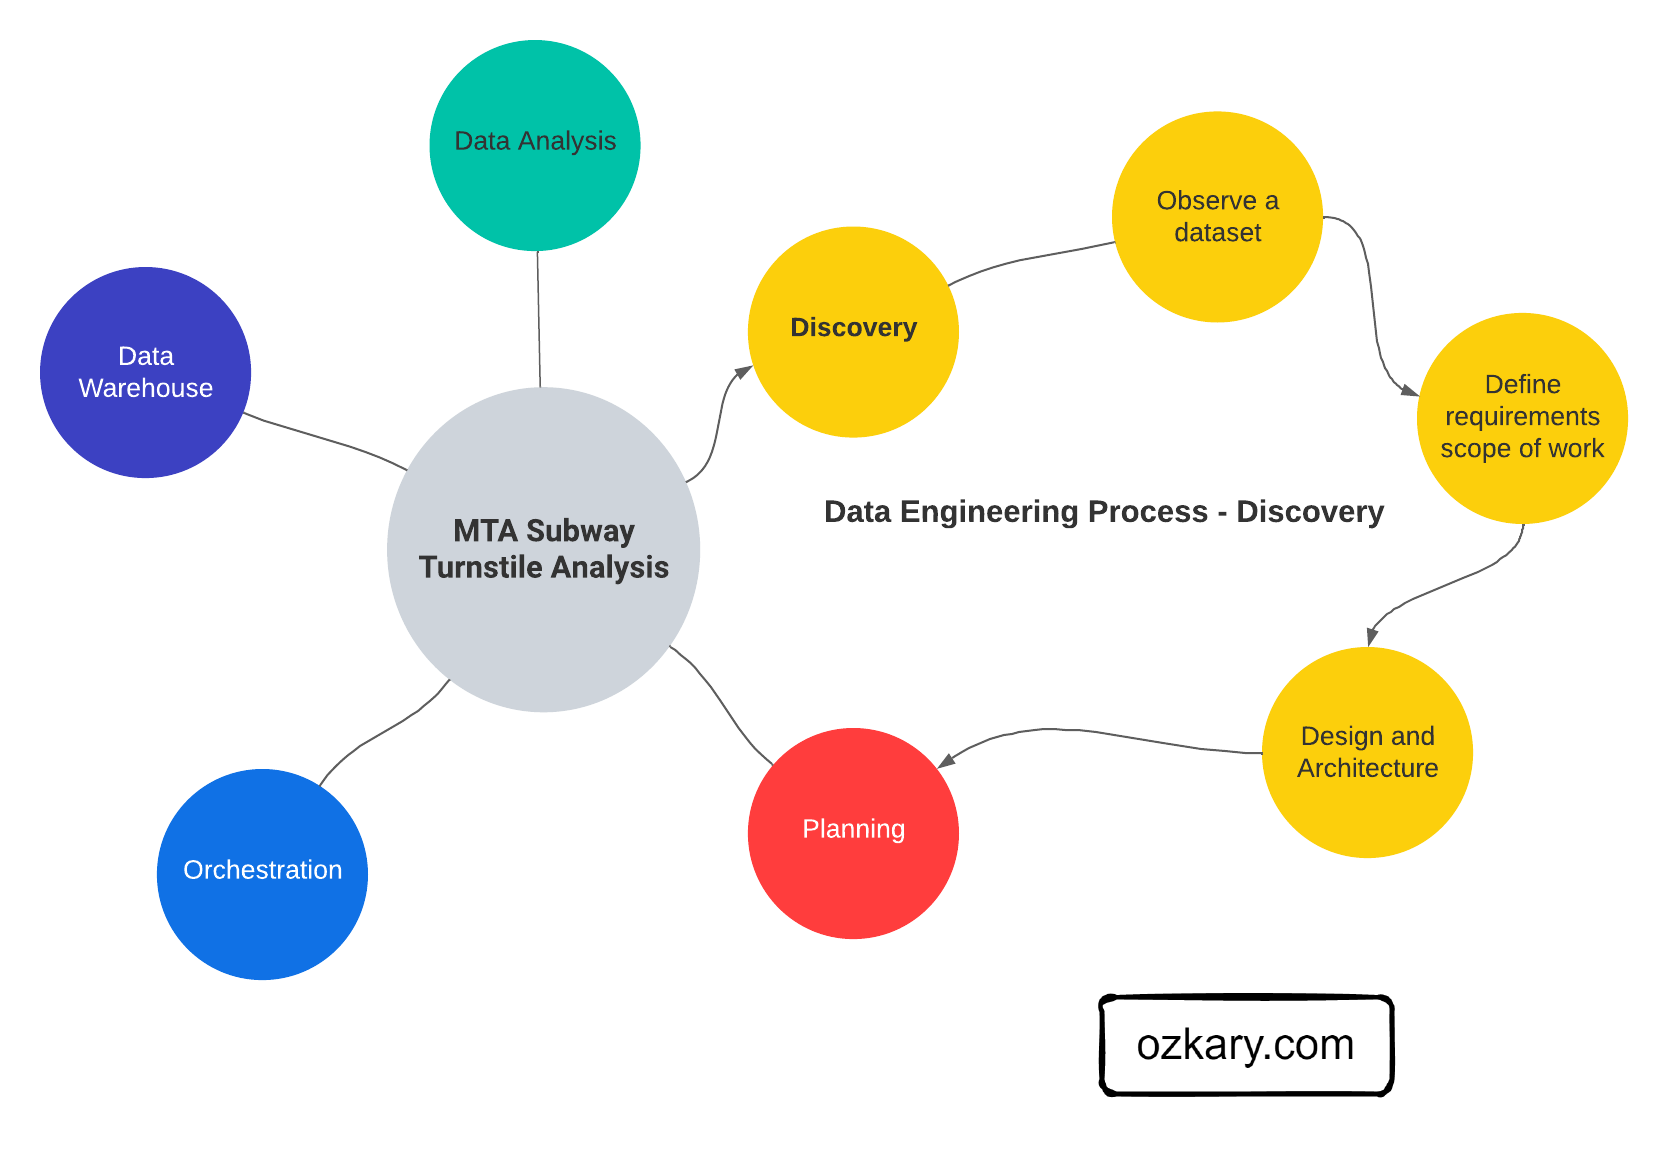
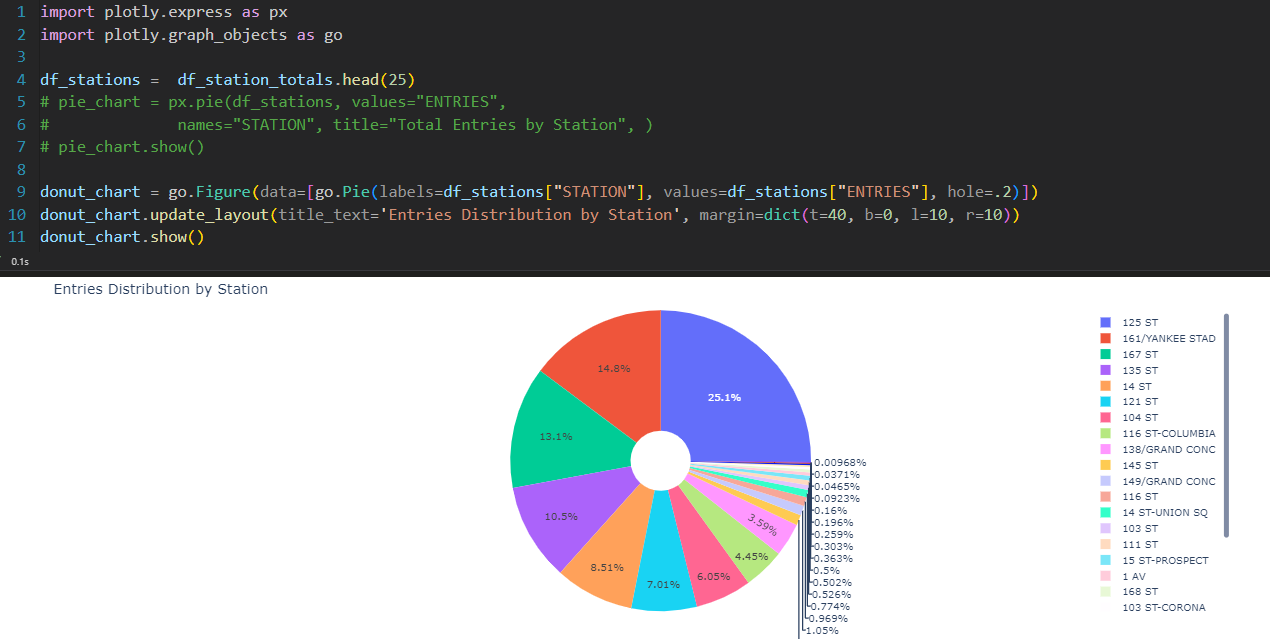
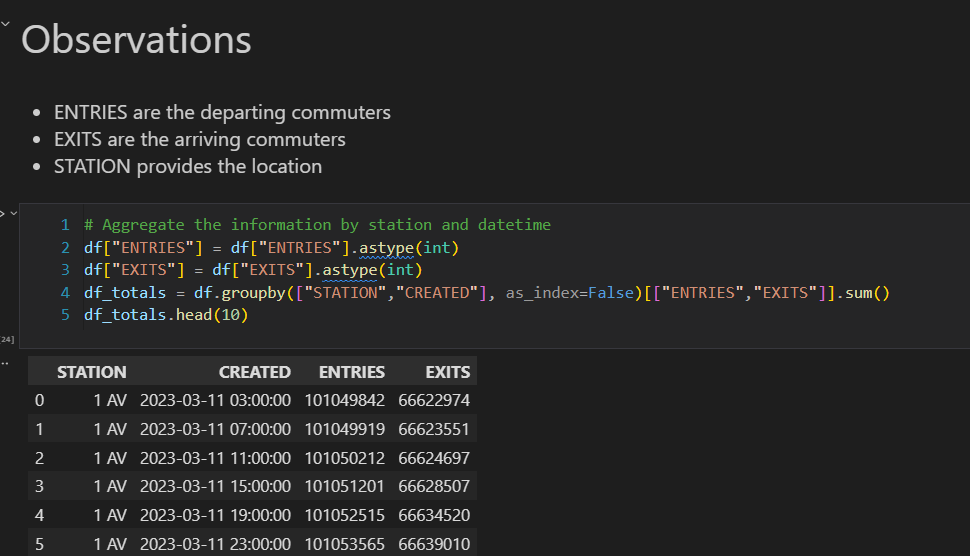
4/3/24

Architecting Insights: Data Modeling and Analytical Foundations - Data Engineering Process Fundamentals

Overview

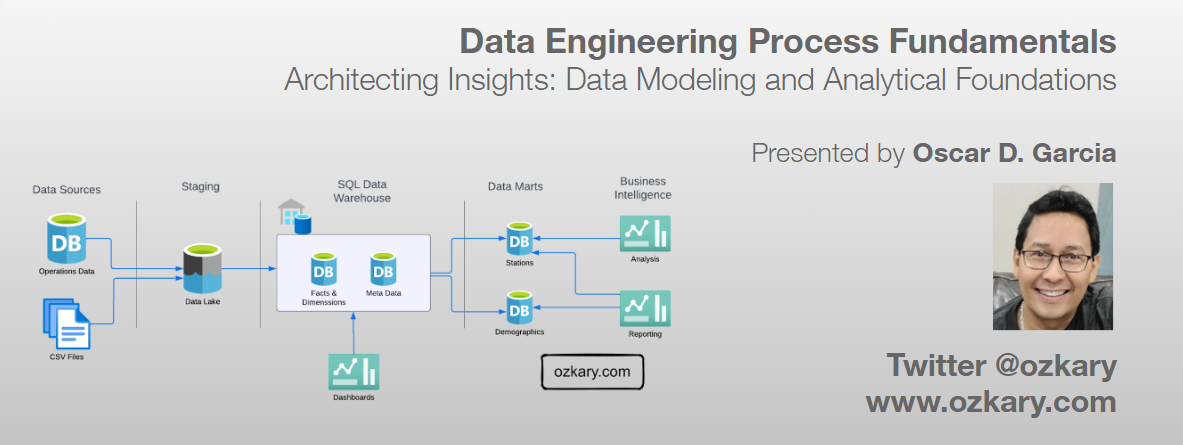
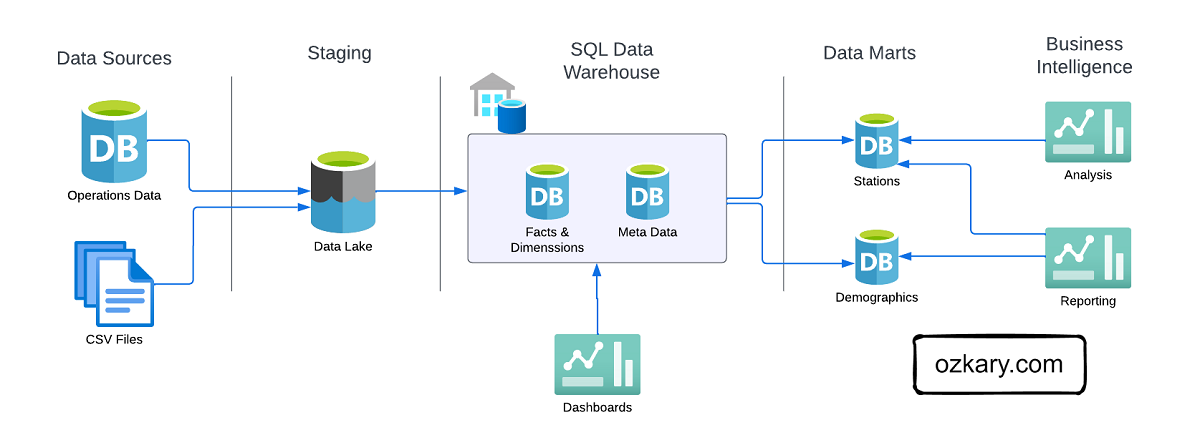
A Data Warehouse is an OLAP system, which serves as the central data repository for historical and aggregated data. A data warehouse is designed to support complex analytical queries, reporting, and data analysis for Big Data use cases. It typically adopts a denormalized entity structure, such as a star schema or snowflake schema, to facilitate efficient querying and aggregations. Data from various OLTP sources is extracted, loaded and transformed (ELT) into the data warehouse to enable analytics and business intelligence. The data warehouse acts as a single source of truth for business users to obtain insights from historical data.

In this technical presentation, we embark on the next chapter of our data journey, delving into data modeling and building our data warehouse.

Data Engineering Process Fundamentals - Data Warehouse Design

  • Follow this GitHub repo during the presentation: (Give it a star)

👉 https://github.com/ozkary/data-engineering-mta-turnstile

  • Read more information on my blog at:

👉 https://www.ozkary.com/2023/03/data-engineering-process-fundamentals.html

YouTube Video

Video Agenda

Building on our previous exploration of data pipelines and orchestration, we now delve into the pivotal phase of data modeling and analytics. In this continuation of our data engineering process series, we focus on architecting insights by designing and implementing data warehouses, constructing logical and physical models, and optimizing tables for efficient analysis. Let's uncover the foundational principles driving effective data modeling and analytics.

Agenda:

  • Operational Data Concepts:

    • Explanation of operational data and its characteristics.
    • Discussion on data storage options, including relational databases and NoSQL databases.
  • Data Lake for Data Staging:

    • Introduction to the concept of a data lake as a central repository for raw, unstructured, and semi-structured data.
    • Explanation of data staging within a data lake for ingesting, storing, and preparing data for downstream processing.
    • Discussion on the advantages of using a data lake for data staging, such as scalability and flexibility.
  • Data Warehouse for Analytical Data:

    • Overview of the role of a data warehouse in storing and organizing structured data for analytics and reporting purposes.
    • Discussion on the benefits of using a data warehouse for analytical queries and business intelligence.
  • Data Warehouse Design and Implementation:

    • Introduction to data warehouse design principles and methodologies.
    • Explanation of logical models for designing a data warehouse schema, including conceptual and dimensional modeling.
  • Star Schema:

    • Explanation of the star schema design pattern for organizing data in a data warehouse.
    • Discussion on fact tables, dimension tables, and their relationships within a star schema.
    • Explanation of the advantages of using a star schema for analytical querying and reporting.
  • Logical Models:

    • Discussion on logical models in data warehouse design.
    • Explanation of conceptual modeling and entity-relationship diagrams (ERDs).
  • Physical Models - Table Construction:

    • Discussion on constructing tables from the logical model, including entity mapping and data normalization.
    • Explanation of primary and foreign key relationships and their implementation in physical tables.
  • Table Optimization Index and Partitions:

    • Introduction to table optimization techniques for improving query performance.
    • Explanation of index creation and usage for speeding up data retrieval.
    • Discussion on partitioning strategies for managing large datasets and enhancing query efficiency.
  • Incremental Strategy:

    • Introduction to incremental loading techniques for efficiently updating data warehouses.
    • Explanation of delta processing.
    • Discussion on the benefits of incremental loading in reducing processing time and resource usage.
  • Orchestration and Operations:

    • Tools and frameworks for orchestrating data pipelines, such as dbt.
    • Discussion on the importance of orchestration and monitoring the data processing tasks.
    • Policies to archive data in blob storage.

Why join this session?

  • Learn analytical data modeling essentials.
  • Explore schema design patterns like star and snowflake.
  • Optimize large dataset management and query efficiency.
  • Understand logical and physical modeling strategies.
  • Gain practical insights and best practices.
  • Engage in discussions with experts.
  • Advance your data engineering skills.
  • Architect insights for data-driven decisions.

Presentation

Data Engineering Overview

A Data Engineering Process involves executing steps to understand the problem, scope, design, and architecture for creating a solution. This enables ongoing big data analysis using analytical and visualization tools.

Data Engineering Process Fundamentals - Operational Data

Topics

  • Operational Data
  • Data Lake
  • Data Warehouse
  • Schema and Data Modeling
  • Data Strategy and Optimization
  • Orchestration and Operations

Follow this project: Star/Follow the project

👉 Data Engineering Process Fundamentals

Operational Data

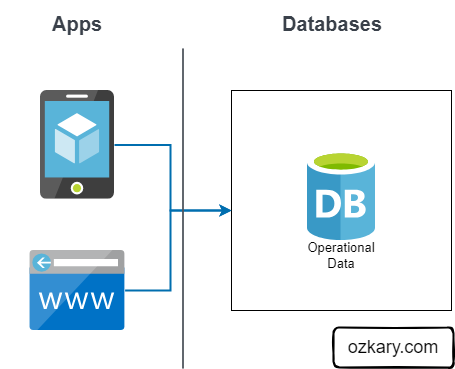
Operational data (OLTP) is often generated by applications, and it is stored in transactional relational databases like SQL Server, Oracle and NoSQL (JSON) databases like CosmosDB, Firebase. This is the data that is created after an application saves a user transaction like contact information, a purchase or other activities that are available from the application.

Features

  • Application support and transactions
  • Relational data structure and SQL or document structure NoSQL
  • Small queries for case analysis

Not Best For:

  • Reporting and analytical systems (OLAP)
  • Large queries
  • Centralized Big Data system

Data Engineering Process Fundamentals - Operational Data

Data Lake - From Ops to Analytical Data Staging

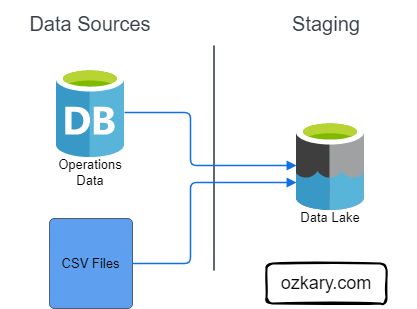
A Data Lake is an optimized storage system for Big Data scenarios. The primary function is to store the data in its raw format without any transformation. Analytical data is the transaction data that has been extracted from a source system via a data pipeline as part of the staging data process.

Features:

  • Store the data in its raw format without any transformation
  • This can include structure data like CSV files, unstructured data like JSON and XML documents, or column-base data like parquet files
  • Low Cost for massive storage power
  • Not Designed for querying or data analysis
  • It is used as external tables by most systems

Data Engineering Process Fundamentals - Data Lake for Staging the data

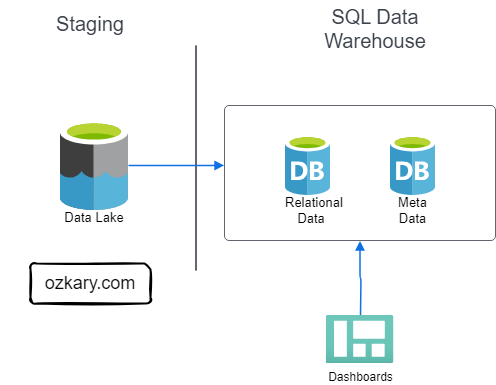
Data Warehouse - Staging to Analytical Data

A Data Warehouse, OLAP system, is a centralized storage system that stores integrated data from multiple sources. The system is designed to host and serve Big Data scenarios with lower operational cost than transaction databases, but higher costs than a Data Lake.

Features:

  • Stores historical data in relational tables with an optimized schema, which enables the data analysis process
  • Provides SQL support to query and transform the data
  • Integrates external resources on Data Lakes as external tables
  • The system is designed to host and serve Big Data scenarios.
  • Storage is more expensive
  • Offloads archived data to Data Lakes

Data Engineering Process Fundamentals - Data Warehouse Analytical Data

Data Warehouse - Design and Implementation

In the design phase, we lay the groundwork by defining the database system, schema model, logical data models, and technology stack (SQL, Python, frameworks and tools) required to support the data warehouse’s implementation and operations.

In the implementation phase, we focus on converting logical data models into a functional system. By creating concrete structures like dimension and fact tables and performing data transformation tasks, including data cleansing, integration, and scheduled batch loading, we ensure that raw data is processed and unified for analysis.

Data Engineering Process Fundamentals - Data Warehouse Design

Design - Schema Modeling

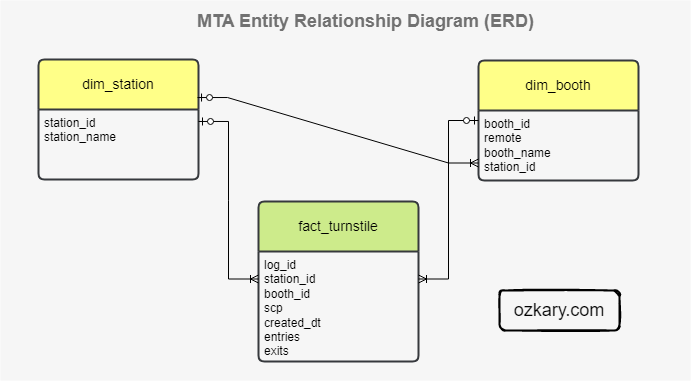
The Star and Snowflake Schemas are two common data warehouse modeling techniques. The Star Schema consist of a central fact table is connected to multiple dimension tables via foreign key relationships. The Snowflake Schema is a variation of the Star Schema, but with dimension tables that are further divided into multiple related tables.

What to use:

  • Use the Star Schema when query performance is a primary concern, and data model simplicity is essential

  • Use the Snowflake Schema when storage optimization is crucial, and the data model involves high-cardinality dimension attributes with potential data redundancy

Data Engineering Process Fundamentals - Data Warehouse Schema Model

Data Modeling

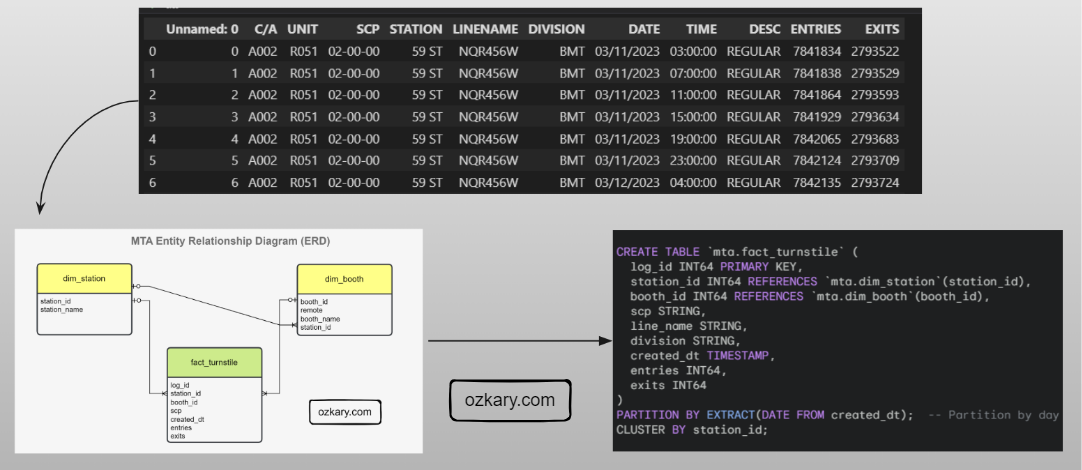
Data modeling lays the foundation for a data warehouse. It starts with modeling raw data into a logical model outlining the data and its relationships, with a focus based on data requirements. This model is then translated, using DDL, into the specific views, tables, columns (data types), and keys that make up the physical model of the data warehouse, with a focus on technical requirements.

Data Engineering Process Fundamentals - Data Warehouse Data Model

Data Optimization to Deliver Performance

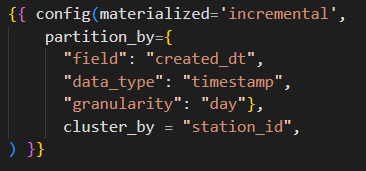
To achieve faster queries, improve performance and reduce resource cost, we need to efficiently organize our data. Two key techniques for accomplishing this are data partitioning and data clustering.

  • Data Partitioning: Imagine dividing your data table into smaller, self-contained segments based on a specific column (e.g., date). This allows the DW to quickly locate and retrieve only the relevant data for your queries, significantly reducing scan times.

  • Data Clustering: Allows us to organize the data within each partition based on another column (e.g., Station). This groups frequently accessed data together physically, leading to faster query execution, especially for aggregations or filtering based on the clustered column.

Data Engineering Process Fundamentals - Data Warehouse DDL Script

Data Transformation and Incremental Strategy

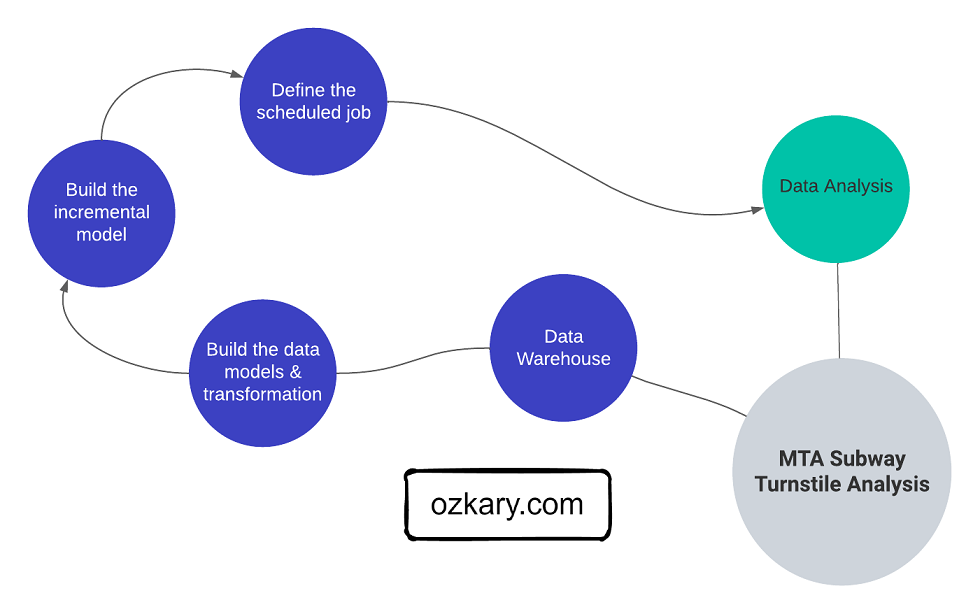
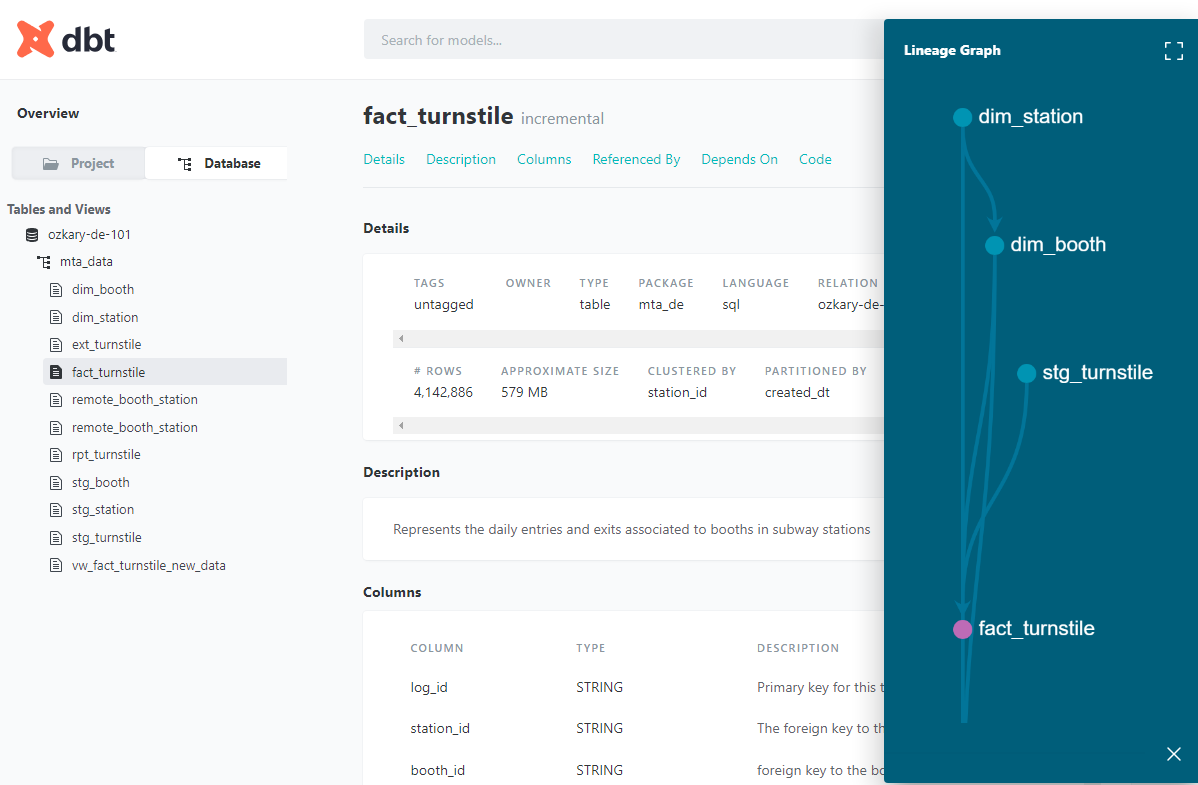
The data transformation phase is a critical stage in a data warehouse project. This phase involves several key steps, including data extraction, cleaning, loading, data type casting, use of naming conventions, and implementing incremental loads to continuously insert the new information since the last update via batch processes.

Data Engineering Process Fundamentals - Data Warehouse Data Lineage

  • Data Lineage: Tracks the flow of data from its origin to its destination, including all the intermediate processes and transformations that it undergoes.

Orchestration and Operations

Effective orchestration and operation are the keys of a reliable and efficient data project. They streamline data pipelines, ensure data quality, and minimize human intervention. This translates to faster development cycles, reduced errors, and improved overall data management.

  • Version Control and CI/CD with GitHub: Enables development, automated testing, and seamless deployment of data pipelines.

  • Documentation: Maintain clear and comprehensive documentation covering data pipelines, data quality checks, scheduling, data archiving policies

  • Scheduling and Automation: Automates repetitive tasks, such as data ingestion, transformation, and archiving processes,

  • Monitoring and Notification: Provides real-time insights into pipeline health, data quality, and archiving success

Data Engineering Process Fundamentals - Data Warehouse Data Lineage

Summary

Before we can move data into a data warehouse system, we explore two pivotal phases for our data warehouse solution: design and implementation. In the design phase, we lay the groundwork by defining the database system, schema and data model, and technology stack required to support the data warehouse’s implementation and operations. This stage ensures a solid infrastructure for data storage and management.

In the implementation phase, we focus on converting conceptual data models into a functional system. By creating concrete structures like dimension and fact tables and performing data transformation tasks, including data cleansing, integration, and scheduled batch loading, we ensure that raw data is processed and unified for analysis.

Thanks for reading.

Send question or comment at Twitter @ozkary

👍 Originally published by ozkary.com

3/7/24

Coupling Data Flows: Data Pipelines and Orchestration - Data Engineering Process Fundamentals

Overview

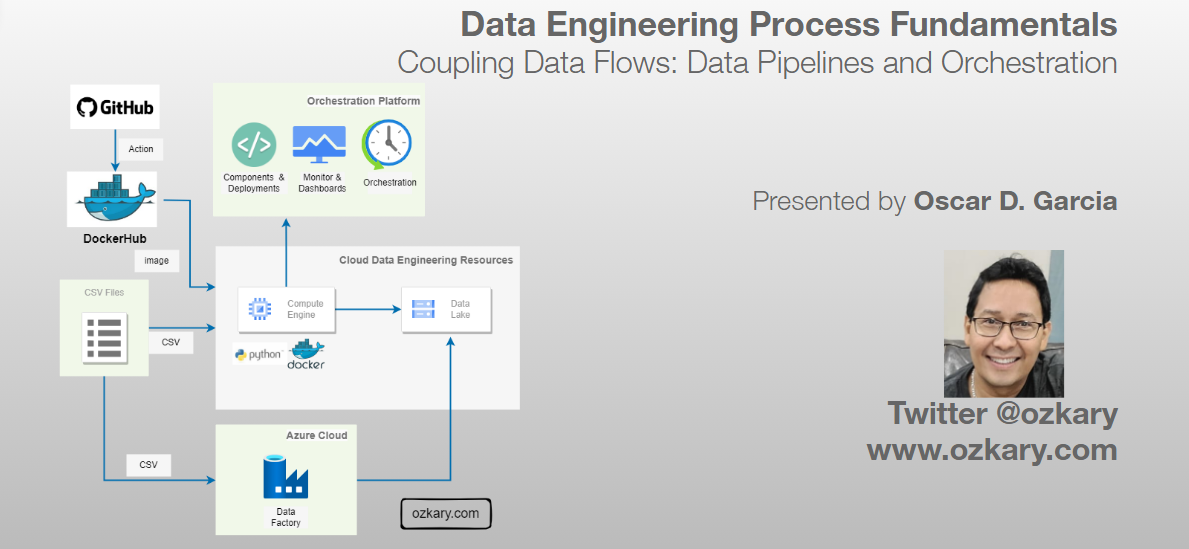
A data pipeline refers to a series of connected tasks that handles the extract, transform and load (ETL) as well as the extract, load and transform (ELT) operations and integration from a source to a target storage like a data lake or data warehouse. Properly designed pipelines ensure data integrity, quality, and consistency throughout the system.

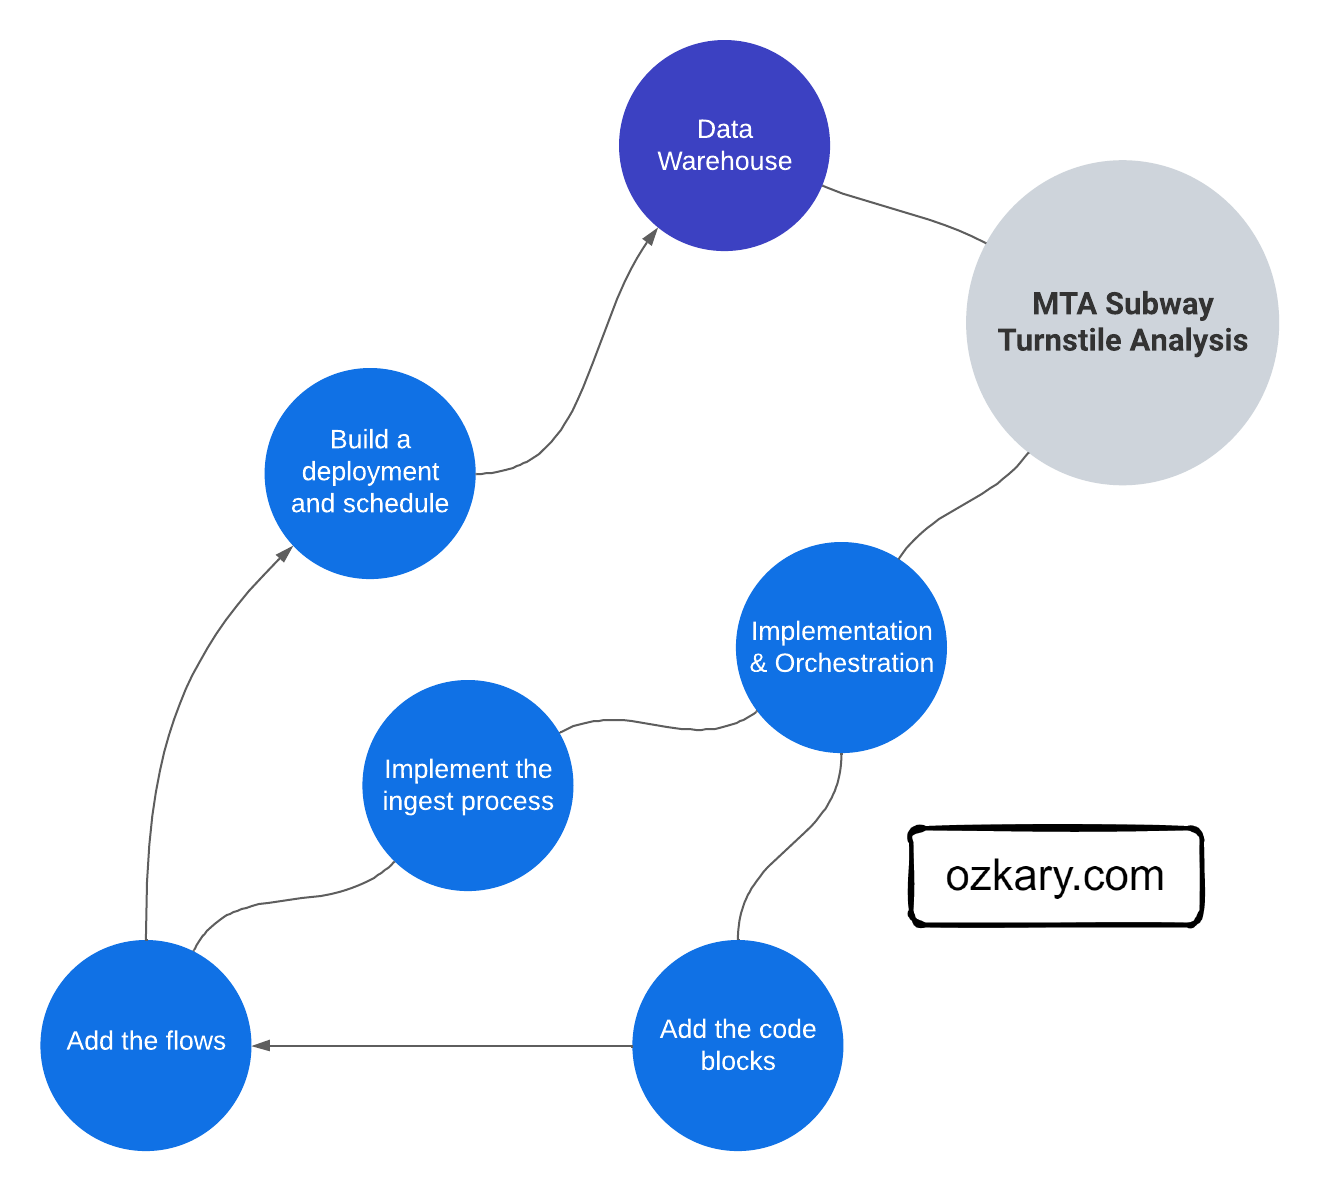
In this technical presentation, we embark on the next chapter of our data journey, delving into building a pipeline with orchestration for ongoing development and operational support.

Data Engineering Process Fundamentals - Data Pipelines

  • Follow this GitHub repo during the presentation: (Give it a star)

👉 https://github.com/ozkary/data-engineering-mta-turnstile

  • Read more information on my blog at:

👉 https://www.ozkary.com/2023/03/data-engineering-process-fundamentals.html

YouTube Video

Video Agenda

  • *Understanding Data Pipelines:"

    • Delve into the concept of data pipelines and their significance in modern data engineering.
  • Implementation Options:

    • Explore different approaches to implementing data pipelines, including code-centric and low-code tools.
  • Pipeline Orchestration:

    • Learn about the role of orchestration in managing complex data workflows and the tools available, such as Apache Airflow, Apache Spark, Prefect, and Azure Data Factory.
  • Cloud Resources:

    • Identify the necessary cloud resources for staging environments and data lakes to support efficient data pipeline deployment.
  • Implementing Flows:

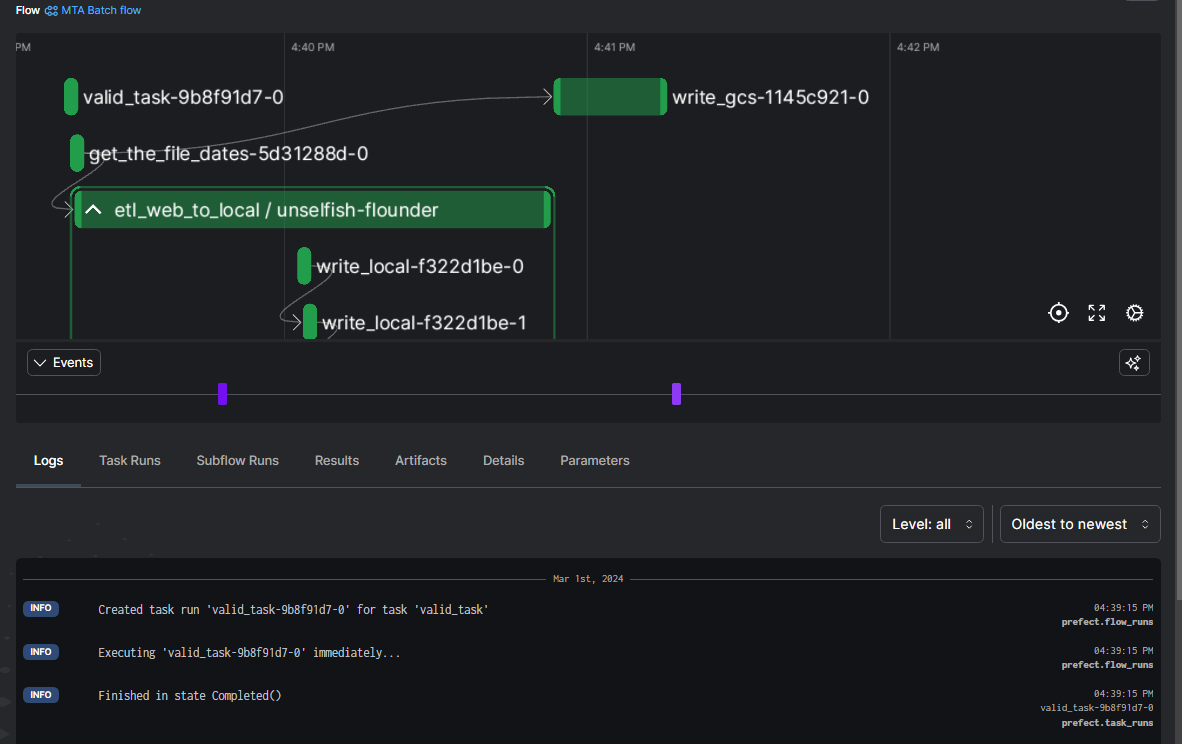
    • Examine the process of building data pipelines, including defining tasks, components, and logging mechanisms.
  • Deployment with Docker:

    • Discover how Docker containers can be used to isolate data pipeline environments and streamline deployment processes.
  • Monitor and Operations:

    • Manage operational concerns related to data pipeline performance, reliability, and scalability.

Key Takeaways:

  • Gain practical insights into building and managing data pipelines.

  • Learn coding techniques with Python for efficient data pipeline development.

  • Discover the benefits of Docker deployments for data pipeline management.

  • Understand the significance of data orchestration in the data engineering process.

  • Connect with industry professionals and expand your network.

  • Stay updated on the latest trends and advancements in data pipeline architecture and orchestration.

Some of the technologies that we will be covering:

  • Cloud Infrastructure
  • Data Pipelines
  • GitHub
  • VSCode
  • Docker and Docker Hub

Presentation

Data Engineering Overview

A Data Engineering Process involves executing steps to understand the problem, scope, design, and architecture for creating a solution. This enables ongoing big data analysis using analytical and visualization tools.

Topics

  • Understanding Data pipelines
  • Implementation Options
  • Pipeline Orchestration
  • Cloud Resources
  • Implementing Code-Centric Flows
  • Deployment with Docker
  • Monitor and Operations

Follow this project: Star/Follow the project

👉 Data Engineering Process Fundamentals

Understanding Data Pipelines

A data pipeline refers to a series of connected tasks that handles the extract, transform and load (ETL) as well as the extract, load and transform (ELT) operations and integration from a source to a target storage like a data lake or data warehouse

Foundational Areas

  • Data Ingestion and Transformation
  • Code-Centric vs. Low-Code Options
  • Orchestration
  • Cloud Resources
  • Implementing flows, tasks, components and logging
  • Deployment
  • Monitoring and Operations

Data Engineering Process Fundamentals - Data Pipeline and Orchestration

Data Ingestion and Transformation

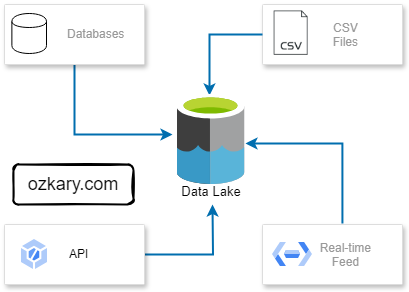
Data ingestion is the process of bringing data in from various sources, such as databases, APIs, data streams and files, into a staging area. Once the data is ingested, we can transform it to match our requirements.

Key Areas:

  • Identify methods for extracting data from various sources (databases, APIs, Data Streams, files, etc.).
  • Choose between batch or streaming ingestion based on data needs and use cases
  • Data cleansing and standardization ensure quality and consistency.
  • Data enrichment adds context and value.
  • Formatting into the required data models for analysis.

Data Engineering Process Fundamentals - Data Pipeline Sources

Implementation Options

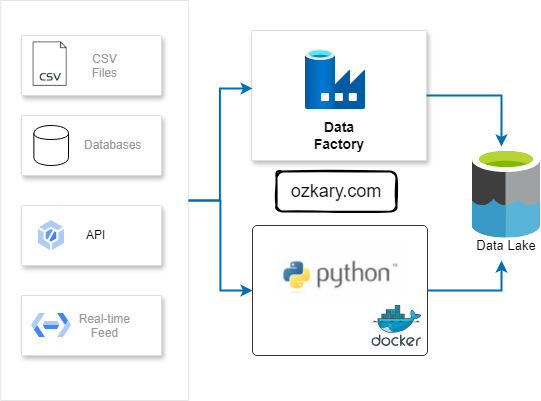
The implementation of a pipeline refers to the designing and/or coding of each task in the pipeline. A task can be implemented using a programming languages like Python or SQL. It can also be implemented using a low-code tool with zero or some code snippet.

Options:

  • Code-centric: Provides flexibility, customization, and full control (Python, SQL, etc.). Ideal for complex pipelines with specific requirements. Requires programming expertise.

  • Low-code: Offers visual drag-and-drop interfaces that allow the engineer to connect to APIs, databases, data lakes and other sources that provide access via API, enabling faster development. (Azure Data Factory, GCP Cloud Dataflow)

Data Engineering Process Fundamentals - Data Pipeline Integration

Pipeline Orchestration

Orchestration is the automation, management and coordination of the data pipeline tasks. It involves the scheduling, workflows, monitoring and recovery of those tasks. The orchestration handles the execution, error handling, retry and the alerting of problems in the pipeline.

Orchestration Tools:

  • Apache Airflow: Offers flexible and customizable workflow creation for engineers using Python code, ideal for complex pipelines.
  • Apache Spark: Excels at large-scale batch processing tasks involving API calls and file downloads with Python. Its distributed framework efficiently handles data processing and analysis.
  • Prefect: This open-source workflow management system allows defining and managing data pipelines as code, providing a familiar Python API.
  • Cloud-based Services: Tools like Azure Data Factory and GCP Cloud Dataflow provide a visual interface for building and orchestrating data pipelines, simplifying development. They also handle logging and alerting.

Data Engineering Process Fundamentals - Data Pipeline Architecture

Cloud Resources

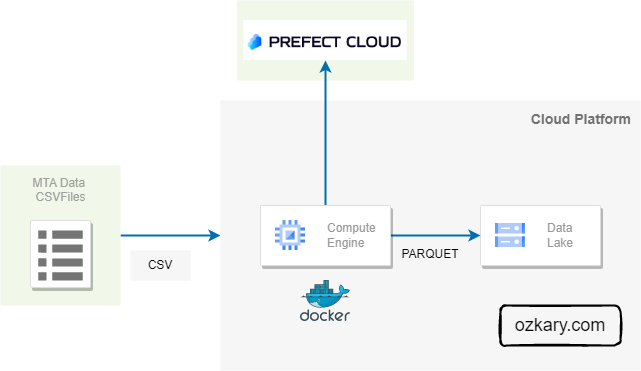
Cloud resources are critical for data pipelines. Virtual machines (VMs) offer processing power for code-centric pipelines, while data lakes serve as central repositories for raw data. Data warehouses, optimized for structured data analysis, often integrate with data lakes to enable deeper insights.

Resources:

  • Code-centric pipelines: VMs are used for executing workflows, managing orchestration, and providing resources for data processing and transformation. Often, code runs within Docker containers.

  • Data Storage: Data lakes act as central repositories for storing vast amounts of raw and unprocessed data. They offer scalable and cost-effective solutions for capturing and storing data from diverse sources.

  • Low-code tools: typically have their own infrastructure needs specified by the platform provider. Provisioning might not be necessary, and the tool might be serverless or run on pre-defined infrastructure.

Data Engineering Process Fundamentals - Data Pipeline Resources

Implementing Code-Centric Flows

In a data pipeline, orchestrated flows define the overall sequence of steps. These flows consist of tasks, which represent specific actions within the pipeline. For modularity and reusability, a task should use components to encapsulate common concerns like security and data lake access.

Pipeline Structure:

  • Flows: Are coordinators that define the overall structure and sequence of the data pipeline. They are responsible for orchestrating the execution of other flows or tasks in a specific order.

  • Tasks: Are operators for each individual units of work within the pipeline. Each task represents a specific action or function performed on the data, such as data extraction, transformation, or loading. They manipulate the data according to the flow's instructions.

  • Components: These are reusable code blocks that encapsulate functionalities common across different tasks. They act as utilities, providing shared functionality like security checks, data lake access, logging, or error handling.

Data Engineering Process Fundamentals - Data Pipeline Monitor

Deployment with Docker and Docker Hub

Docker proves invaluable for our data pipelines by providing self-contained environments with all necessary dependencies. With Docker Hub, we can effortlessly distribute pipeline images, facilitating swift and reliable provisioning of new environments.

  • Docker containers streamline the deployment process by encapsulating application and dependency configurations, reducing runtime errors.

  • Containerizing data pipelines ensures reliability and portability by packaging all necessary components within a single container image.

  • Docker Hub serves as a centralized container registry, enabling seamless image storage and distribution for streamlined environment provisioning and scalability.

Data Engineering Process Fundamentals - Data Pipeline Containers

Monitor and Operations

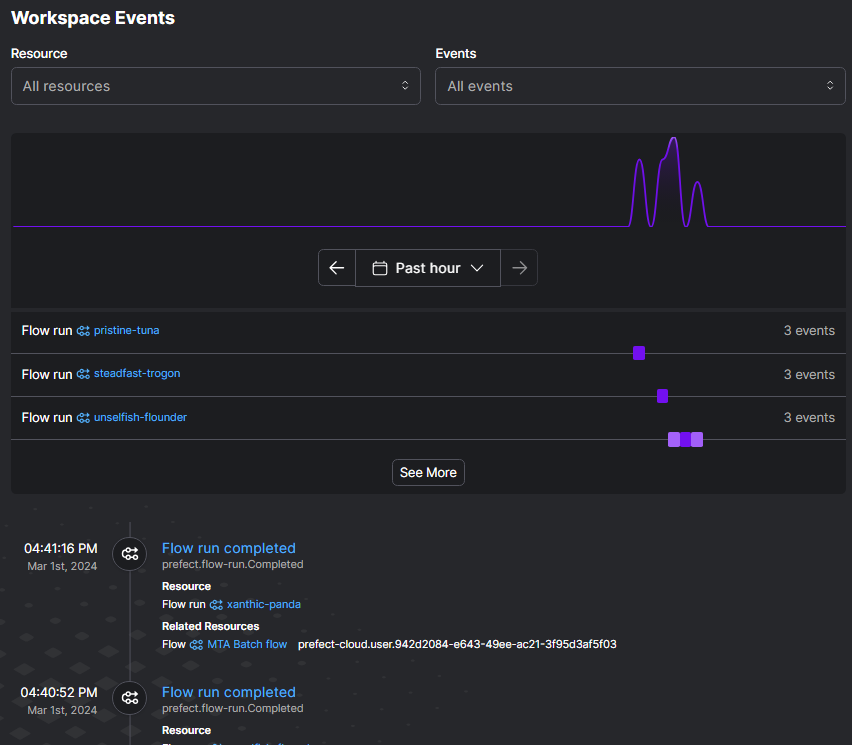
Monitoring your data pipeline's performance with telemetry data is key to smooth operations. This enables the operations team to proactively identify and address issues, ensuring efficient data delivery.

Key Components:

  • Telemetry Tracing: Tracks the execution of flows and tasks, providing detailed information about their performance, such as execution time, resource utilization, and error messages.

  • Monitor and Dashboards: Visualize key performance indicators (KPIs) through user-friendly dashboards, offering real-time insights into overall pipeline health and facilitating anomaly detection.

  • Notifications to Support: Timely alerts are essential for the operations team to be notified of any critical issues or performance deviations, enabling them to take necessary actions.

Data Engineering Process Fundamentals - Data Pipeline Dashboard

Summary

A data pipeline is basically a workflow of tasks that can be executed in Docker containers. The execution, scheduling, managing and monitoring of the pipeline is referred as orchestration. In order to support the operations of the pipeline and its orchestration, we need to provision a VM and data lake cloud resources, which we can also automate with Terraform. By selecting the appropriate programming language and orchestration tools, we can construct resilient pipelines capable of scaling and meeting evolving data demands effectively.

Thanks for reading.

Send question or comment at Twitter @ozkary 👍 Originally published by ozkary.com

2/14/24

Unlock the Blueprint: Design and Planning Phase - Data Engineering Process Fundamentals

Overview

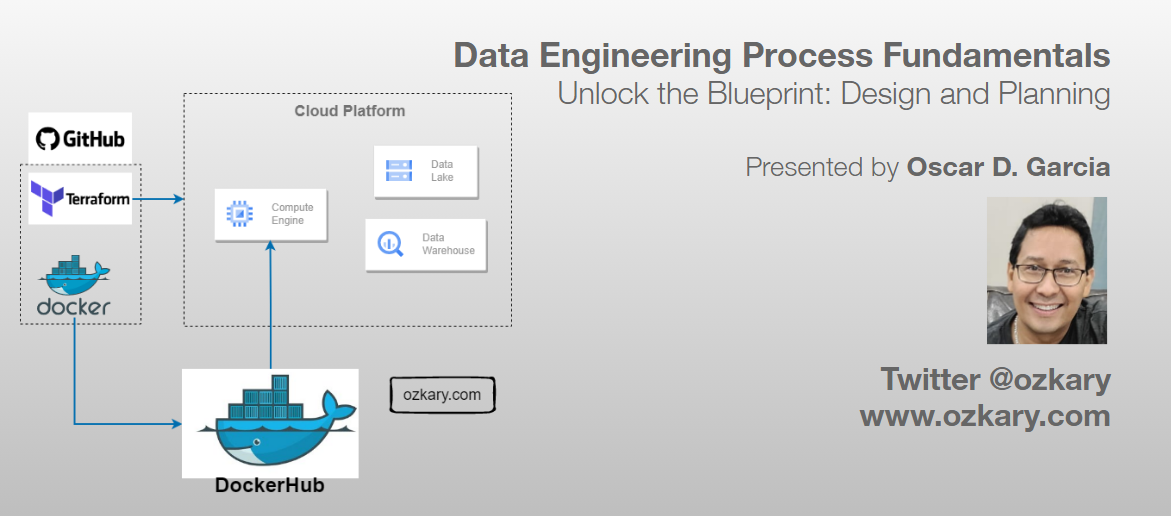
The design and planning phase of a data engineering project is crucial for laying out the foundation of a successful and scalable solution. This phase ensures that the architecture is strategically aligned with business objectives, optimizes resource utilization, and mitigates potential risks.

In this technical presentation, we embark on the next chapter of our data journey, delving into the critical Design and Planning Phase.

Data Engineering Process Fundamentals

  • Follow this GitHub repo during the presentation: (Give it a star)

👉 https://github.com/ozkary/data-engineering-mta-turnstile

  • Read more information on my blog at:

👉 https://www.ozkary.com/2023/03/data-engineering-process-fundamentals.html

YouTube Video

Video Agenda

System Design and Architecture:

  • Understanding the foundational principles that shape a robust and scalable data system.

    Data Pipeline and Orchestration:

  • Uncovering the essentials of designing an efficient data pipeline and orchestrating seamless data flows.

    Source Control and Deployment:

  • Navigating the best practices for source control, versioning, and deployment strategies.

    CI/CD in Data Engineering:

  • Implementing Continuous Integration and Continuous Deployment (CI/CD) practices for agility and reliability.

    Docker Container and Docker Hub:

  • Harnessing the power of Docker containers and Docker Hub for containerized deployments.

    Cloud Infrastructure with IaC:

  • Exploring technologies for building out cloud infrastructure using Infrastructure as Code (IaC), ensuring efficiency and consistency.

Key Takeaways:

  • Gain insights into designing scalable and efficient data systems.

  • Learn best practices for cloud infrastructure and IaC.

  • Discover the importance of data pipeline orchestration and source control.

  • Explore the world of CI/CD in the context of data engineering.

  • Unlock the potential of Docker containers for your data workflows.

Some of the technologies that we will be covering:

  • Cloud Infrastructure
  • Data Pipelines
  • GitHub and Actions
  • VC Code
  • Docker and Docker Hub
  • Terraform

Presentation

Data Engineering Overview

A Data Engineering Process involves executing steps to understand the problem, scope, design, and architecture for creating a solution. This enables ongoing big data analysis using analytical and visualization tools.

Topics

  • Importance of Design and Planning
  • System Design and Architecture
  • Data Pipeline and Orchestration
  • Source Control and CI/CD
  • Docker Containers
  • Cloud Infrastructure with IaC

Follow this project: Give a star

👉 Data Engineering Process Fundamentals

Importance of Design and Planning

The design and planning phase of a data engineering project is crucial for laying out the foundation of a successful and scalable solution. This phase ensures that the architecture is strategically aligned with business objectives, optimizes resource utilization, and mitigates potential risks.

Foundational Areas

  • Designing the data pipeline and technology specifications like flows, coding language, data governance and tools
  • Define the system architecture like cloud services for scalability, data platform
  • Source control and deployment automation with CI/CD
  • Using Docker containers for environment isolation to avoid deployment issues
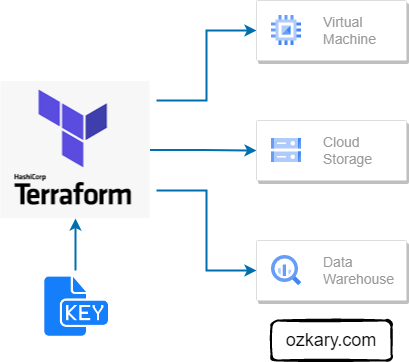
  • Infrastructure automation with Terraform or cloud CLI tools
  • System monitor, notification and recovery

Data Engineering Process Fundamentals - Design and Planning

System Design and Architecture

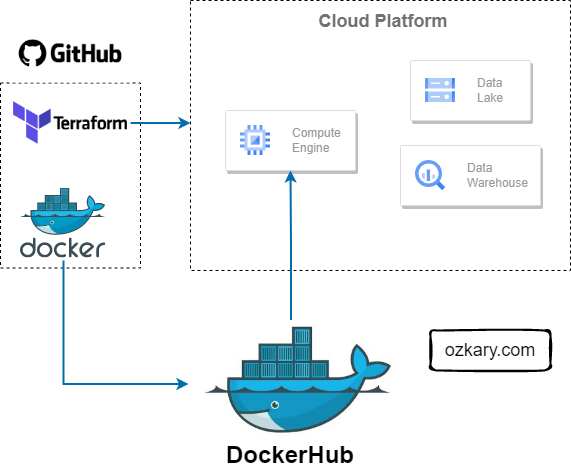
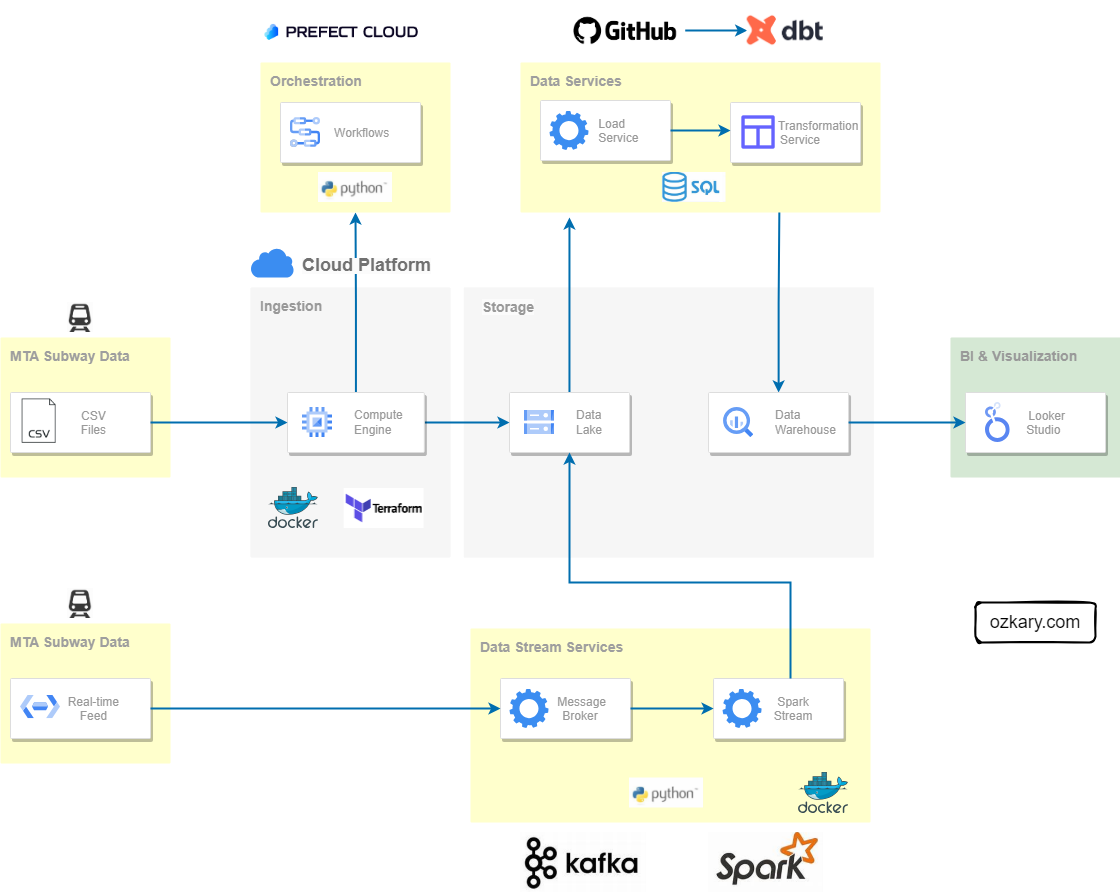
In a system design, we need to clearly define the different technologies that should be used for each area of the solution. It includes the high-level system architecture, which defines the different components and their integration.

  • The design outlines the technical solution, including system architecture, data integration, flow orchestration, storage platforms, and data processing tools. It focuses on defining technologies for each component to ensure a cohesive and efficient solution.

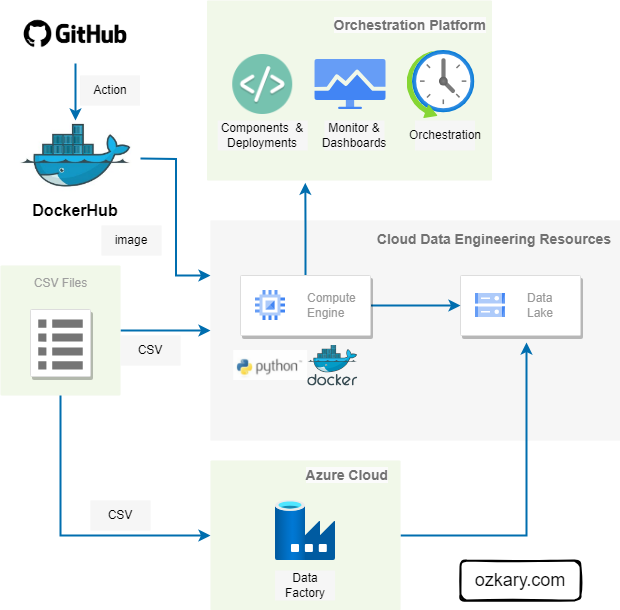
  • A system architecture is a critical high-level design encompassing various components such as data sources, ingestion resources, workflow orchestration, storage, transformation services, continuous ingestion, validation mechanisms, and analytics tools.

Data Engineering Process Fundamentals - System Architecture

Data Pipeline and Orchestration

A data pipeline is basically a workflow of tasks that can be executed in Docker containers. The execution, scheduling, managing and monitoring of the pipeline is referred to as orchestration. In order to support the operations of the pipeline and its orchestration, we need to provision a VM and data lake, and monitor cloud resources.

  • This can be code-centric, leveraging languages like Python, SQL
  • Or a low-code approach, utilizing tools such as Azure Data Factory, which provides a turn-key solution
  • Monitor services enable us to track telemetry data to support operational requirements
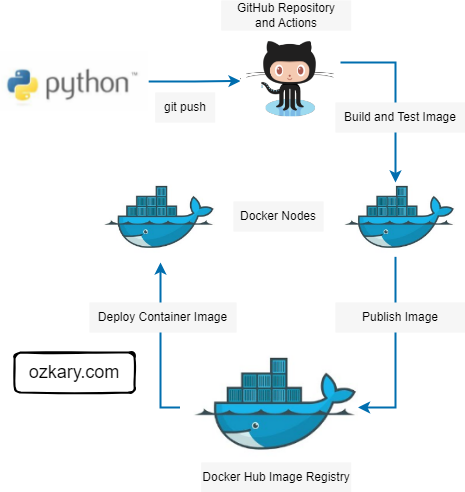
  • Docker Hub, GitHub can be used for the CI/CD process and deployed our code-centric solutions
  • Scheduling, recovering from failures and dashboards are essentials for orchestration
  • Low-code solutions , like data factory, can also be used

Data Engineering Process Fundamentals - Data Pipeline

Source Control - CI/CD

Implementing source control practices alongside Continuous Integration and Continuous Delivery (CI/CD) pipelines is vital for facilitating agile development. This ensures efficient collaboration, change tracking, and seamless code deployment, crucial for addressing ongoing feature changes, bug fixes, and new environment deployments.

  • Systems like Git facilitates effective code and configuration file management, enabling collaboration and change tracking.
  • Platforms such as GitHub enhance collaboration by providing a remote repository for sharing code.
  • CI involves integrating code changes into a central repository, followed by automated build and test processes to validate changes and provide feedback.
  • CD automates the deployment of code builds to various environments, such as staging and production, streamlining the release process and ensuring consistency across environments.

Data Engineering Process Fundamentals - GitHub CI/CD

Docker Container and Docker Hub

Docker proves invaluable for our data pipelines by providing self-contained environments with all necessary dependencies. With Docker Hub, we can effortlessly distribute pipeline images, facilitating swift and reliable provisioning of new environments.

  • Docker containers streamline the deployment process by encapsulating application and dependency configurations, reducing runtime errors.
  • Containerizing data pipelines ensures reliability and portability by packaging all necessary components within a single container image.
  • Docker Hub serves as a centralized container registry, enabling seamless image storage and distribution for streamlined environment provisioning and scalability.

Data Engineering Process Fundamentals - Docker

Cloud Infrastructure with IaC

Infrastructure automation is crucial for maintaining consistency, scalability, and reliability across environments. By defining infrastructure as code (IaC), organizations can efficiently provision and modify cloud resources, mitigating manual errors.

  • Define infrastructure configurations as code, ensuring consistency across environments.
  • Easily scale resources up or down to meet changing demands with code-defined infrastructure.
  • Reduce manual errors and ensure reproducibility by automating resource provisioning and management.
  • Track infrastructure changes under version control, enabling collaboration and ensuring auditability.
  • Track infrastructure state, allowing for precise updates and minimizing drift between desired and actual configurations.

Data Engineering Process Fundamentals - Terraform

Summary

The design and planning phase of a data engineering project sets the stage for success. From designing the system architecture and data pipelines to implementing source control, CI/CD, Docker, and infrastructure automation with Terraform, every aspect contributes to efficient and reliable deployment. Infrastructure automation, in particular, plays a critical role by simplifying provisioning of cloud resources, ensuring consistency, and enabling scalability, ultimately leading to a robust and manageable data engineering system.

Thanks for reading.

Send question or comment at Twitter @ozkary

👍 Originally published by ozkary.com

1/31/24

Decoding Data: A Journey into the Discovery Phase - Data Engineering Process Fundamentals

Overview

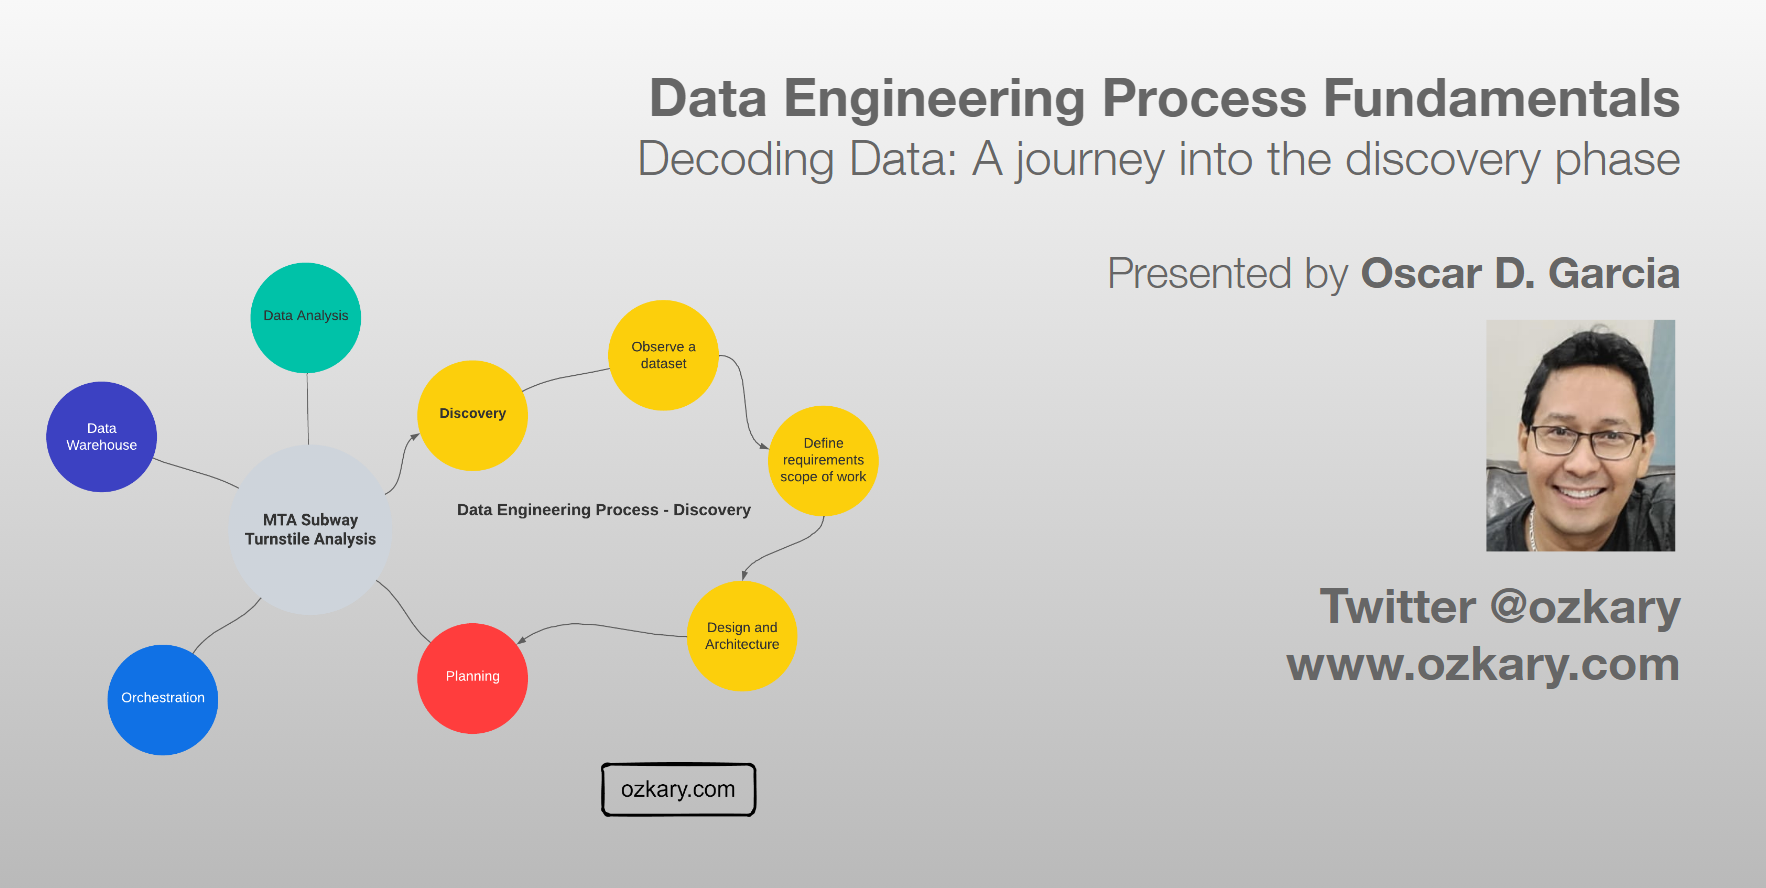
The discovery process involves identifying the problem, analyzing data sources, defining project requirements, establishing the project scope, and designing an effective architecture to address the identified challenges.

In this session, we will delve into the essential building blocks of data engineering, placing a spotlight on the discovery process. From framing the problem statement to navigating the intricacies of exploratory data analysis (EDA) using Python, VSCode, Jupyter Notebooks, and GitHub, you'll gain a solid understanding of the fundamental aspects that drive effective data engineering projects.

Data Engineering Process Fundamentals - Discovery Phase

  • Follow this GitHub repo during the presentation: (Give it a star)

👉 https://github.com/ozkary/data-engineering-mta-turnstile

  • Read more information on my blog at:

👉 https://www.ozkary.com/2023/03/data-engineering-process-fundamentals.html

YouTube Video

Video Agenda

  1. Introduction:

    • Unveiling the importance of the discovery process in data engineering.

    • Setting the stage with a real-world problem statement that will guide our exploration.

  2. Setting the Stage:

    • Downloading and comprehending sample data to kickstart our discovery journey.

    • Configuring the development environment with VSCode and Jupyter Notebooks.

  3. Exploratory Data Analysis (EDA):

    • Delving deep into EDA techniques with a focus on the discovery phase.

    • Demonstrating practical approaches using Python to uncover insights within the data.

  4. Code-Centric Approach:

    • Advocating the significance of a code-centric approach during the discovery process.

    • Showcasing how a code-centric mindset enhances collaboration, repeatability, and efficiency.

  5. Version Control with GitHub:

    • Integrating GitHub seamlessly into our workflow for version control and collaboration.

    • Managing changes effectively to ensure a streamlined data engineering discovery process.

  6. Real-World Application:

    • Applying insights gained from EDA to address the initial problem statement.

    • Discussing practical solutions and strategies derived from the discovery process.

Key Takeaways:

  • Mastery of the foundational aspects of data engineering.

  • Hands-on experience with EDA techniques, emphasizing the discovery phase.

  • Appreciation for the value of a code-centric approach in the data engineering discovery process.

Some of the technologies that we will be covering:

  • Python
  • Data Analysis and Visualization
  • Jupyter Notebook
  • Visual Studio Code

Presentation

Data Engineering Overview

A Data Engineering Process involves executing steps to understand the problem, scope, design, and architecture for creating a solution. This enables ongoing big data analysis using analytical and visualization tools.

Topics

  • Importance of the Discovery Process
  • Setting the Stage - Technologies
  • Exploratory Data Analysis (EDA)
  • Code-Centric Approach
  • Version Control
  • Real-World Use Case

Follow this project: Give a star

👉 Data Engineering Process Fundamentals

Importance of the Discovery Process

The discovery process involves identifying the problem, analyzing data sources, defining project requirements, establishing the project scope, and designing an effective architecture to address the identified challenges.

  • Clearly document the problem statement to understand the challenges the project aims to address.
  • Make observations about the data, its structure, and sources during the discovery process.
  • Define project requirements based on the observations, enabling the team to understand the scope and goals.
  • Clearly outline the scope of the project, ensuring a focused and well-defined set of objectives.
  • Use insights from the discovery phase to inform the design of the solution, including data architecture.
  • Develop a robust project architecture that aligns with the defined requirements and scope.

Data Engineering Process Fundamentals - Discovery Process

Setting the Stage - Technologies

To set the stage, we need to identify and select the tools that can facilitate the analysis and documentation of the data. Here are key technologies that play a crucial role in this stage:

  • Python: A versatile programming language with rich libraries for data manipulation, analysis, and scripting.

Use Cases: Data download, cleaning, exploration, and scripting for automation.

  • Jupyter Notebooks: An interactive tool for creating and sharing documents containing live code, visualizations, and narrative text.

Use Cases: Exploratory data analysis, documentation, and code collaboration.

  • Visual Studio Code: A lightweight, extensible code editor with powerful features for source code editing and debugging.

Use Cases: Writing and debugging code, integrating with version control systems like GitHub.

  • SQL (Structured Query Language): A domain-specific language for managing and manipulating relational databases.

Use Cases: Querying databases, data extraction, and transformation.

Data Engineering Process Fundamentals - Discovery Tools

Exploratory Data Analysis (EDA)

EDA is our go-to method for downloading, analyzing, understanding and documenting the intricacies of the datasets. It's like peeling back the layers of information to reveal the stories hidden within the data. Here's what EDA is all about:

  • EDA is the process of analyzing data to identify patterns, relationships, and anomalies, guiding the project's direction.

  • Python and Jupyter Notebook collaboratively empower us to download, describe, and transform data through live queries.

  • Insights gained from EDA set the foundation for informed decision-making in subsequent data engineering steps.

  • Code written on Jupyter Notebook can be exported and used as the starting point for components for the data pipeline and transformation services.

Data Engineering Process Fundamentals - Discovery Pie Chart

Code-Centric Approach

A code-centric approach, using programming languages and tools in EDA, helps us understand the coding methodology for building data structures, defining schemas, and establishing relationships. This robust understanding seamlessly guides project implementation.

  • Code delves deep into data intricacies, revealing integration and transformation challenges often unclear with visual tools.

  • Using code taps into Pandas and Numpy libraries, empowering robust manipulation of data frames, establishment of loading schemas, and addressing transformation needs.

  • Code-centricity enables sophisticated analyses, covering aggregation, distribution, and in-depth examinations of the data.

  • While visual tools have their merits, a code-centric approach excels in hands-on, detailed data exploration, uncovering subtle nuances and potential challenges.

Data Engineering Process Fundamentals - Discovery Pie Chart

Version Control

Using a tool like GitHub is essential for effective version control and collaboration in our discovery process. GitHub enables us to track our exploratory code and Jupyter Notebooks, fostering collaboration, documentation, and comprehensive project management. Here's how GitHub enhances our process:

  • Centralized Tracking: GitHub centralizes tracking and managing our exploratory code and Jupyter Notebooks, ensuring a transparent and organized record of our data exploration.

  • Sharing: Easily share code and Notebooks with team members on GitHub, fostering seamless collaboration and knowledge sharing.

  • Documentation: GitHub supports Markdown, enabling comprehensive documentation of processes, findings, and insights within the same repository.

  • Project Management: GitHub acts as a project management hub, facilitating CI/CD pipeline integration for smooth and automated delivery of data engineering projects.

Data Engineering Process Fundamentals - Discovery Problem Statement

Summary

The data engineering discovery process involves defining the problem statement, gathering requirements, and determining the scope of work. It also includes a data analysis exercise utilizing Python and Jupyter Notebooks or other tools to extract valuable insights from the data. These steps collectively lay the foundation for successful data engineering endeavors.

Thanks for reading.

Send question or comment at Twitter @ozkary

👍 Originally published by ozkary.com

12/2/23

AI - A Learning Based Approach For Predicting Heart Disease

Abstract

Heart disease is a leading cause of mortality worldwide, and its early identification and risk assessment are critical for effective prevention and intervention. With the help of electronic health records (EHR) and a wealth of health-related data, there is a significant opportunity to leverage machine learning techniques for predicting and assessing the risk of heart disease in individuals.

ozkary-ai-engineering-heart-disease

The United States Centers for Disease Control and Prevention (CDC) has been collecting a vast array of data on demographics, lifestyle, medical history, and clinical parameters. This data repository offers a valuable resource to develop predictive models that can help identify those at risk of heart disease before symptoms manifest.

This study aims to use machine learning models to predict an individual's likelihood of developing heart disease based on CDC data. By employing advanced algorithms and data analysis, we seek to create a predictive model that factors in various attributes such as age, gender, cholesterol levels, blood pressure, smoking habits, and other relevant health indicators. The solution could assist healthcare professionals in evaluating an individual's risk profile for heart disease.

Key Objectives

Key objectives of this study include:

  1. Developing a robust machine learning model capable of accurately predicting the risk of heart disease using CDC data.
  2. Identifying the most influential risk factors and parameters contributing to heart disease prediction.
  3. Compare model performance:
    • Logistic Regression
    • Decision Tree
    • Random Forest
    • XGBoost Classification
  4. Evaluating the following metrics
    • Accuracy
    • Precision,
    • F1
    • Recall
  5. Providing an API, so tools can integrate and make a risk analysis.
    • Build a local app
    • Build an Azure function for cloud deployment

The successful implementation of this study will lead to a transformative impact on public health by enabling timely preventive measures and tailored interventions for individuals at risk of heart disease.

Conclusion

This study was conducted by using four different Machine Learning algorithm. After comparing the performance of all these models, we concluded that the XGBoost Model has a relatively balanced precision and recall metrics, indicating that it's better at identifying true positives while keeping false positives in check. Based on this analysis, we choose XGBoost as the best performing model for this type of analysis.

Machine Learning Engineering Process

In order to execute this project, we follow a series of steps for discovery and data analysis, data processing and model selection. This process is done using jupyter notebooks for the experimental phase, and python files for the implementation and delivery phase.

Experimental Phase Notebooks

👉 The data files for this study can be found in the same GitHub project as the Jupyter Notebook files.

Data Analysis - Exploratory Data Analysis (EDA)

These are the steps to analysis the data:

  • Load the data/2020/heart_2020_cleaned.csv
  • Fill in the missing values with zero
  • Review the data
    • Rename the columns to lowercase
    • Check the data types
    • Preview the data
  • Identify the features
    • Identify the categorical and numeric features
    • Identify the target variables
  • Remove duplicates
  • Identify categorical features that can be converted into binary
  • Check the class balance in the data
    • Check for Y/N labels for heart disease identification

Features

Based on the dataset, we have a mix of categorical and numerical features. We consider the following for encoding:

  1. Categorical Features:

    • 'heartdisease': This is the target variable. We remove this feature for the model training.
    • 'smoking', 'alcoholdrinking', 'stroke', 'sex', 'agecategory', 'race', 'diabetic', 'physicalactivity', 'genhealth', 'sleeptime', 'asthma', 'kidneydisease', 'skincancer': These are categorical features. We can consider one-hot encoding these features.
  2. Numerical Features:

    • 'bmi', 'physicalhealth', 'mentalhealth', 'diffwalking': These are already numerical features, so there's no need to encode them.
# get a list of numeric features
features_numeric = list(df.select_dtypes(include=[np.number]).columns)

# get a list of object features and exclude the target feature 'heartdisease'
features_category = list(df.select_dtypes(include=['object']).columns)

# remove the target feature from the list of categorical features
target = 'heartdisease'

features_category.remove(target)

print('Categorical features',features_category)
print('Numerical features',features_numeric)

Data Validation and Class Balance

The data shows imbalance for the Y/N classes. There are less cases of heart disease, as expected, than the rest of the population. This can result in low performing models as there is way more negatives cases (N). To account for that, we can use techniques like down sampling the negative cases.

Heart Disease Distribution

# plot a distribution of the target variable set labels for each bar chart and show the count
print(df[target].value_counts(normalize=True).round(2))

# plot the distribution of the target variable
df[target].value_counts().plot(kind='bar', rot=0)
plt.xlabel('Heart disease')
plt.ylabel('Count')
# add a count label to each bar
for i, count in enumerate(df[target].value_counts()):
    plt.text(i, count-50, count, ha='center', va='top', fontweight='bold')

plt.show()

# # get the percentage of people with heart disease on a pie chart
df[target].value_counts(normalize=True).plot(kind='pie', labels=['No heart disease', 'Heart disease'], autopct='%1.1f%%', startangle=90)
plt.ylabel('')
plt.show()

👉 No 91% Yes 9%
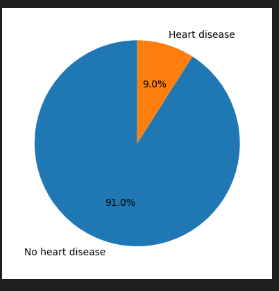
Heart Disease Class Balance

Data Processing

For data processing, we should follow these steps:

  • Load the data/2020/heart_2020_eda.csv
  • Process the values
    • Convert Yes/No features to binary (1/0)
    • Cast all the numeric values to int to avoid float problems
  • Process the features
    • Set the categorical features names
    • Set the numeric features names
    • Set the target variable
  • Feature importance analysis
    • Use statistical analysis to get the metrics like risk and ratio
    • Mutual Information score

Feature Analysis

The purpose of feature analysis in heart disease study is to uncover the relationships and associations between various patient characteristics (features) and the occurrence of heart disease. By examining factors such as lifestyle, medical history, demographics, and more, we aim to identify which specific attributes or combinations of attributes are most strongly correlated with heart disease. Feature analysis allows for the discovery of risk factors and insights that can inform prevention and early detection strategies.

# Calculate the mean and count of heart disease occurrences per feature value
feature_importance = []

# Create a dataframe for the analysis
results = pd.DataFrame(columns=['Feature', 'Value', 'Percentage'])

for feature in all_features:    
    grouped = df.groupby(feature)[target].mean().reset_index()
    grouped.columns = ['Value', 'Percentage']
    grouped['Feature'] = feature
    results = pd.concat([results, grouped], axis=0)

# Sort the results by percentage in descending order and get the top 10
results = results.sort_values(by='Percentage', ascending=False).head(15)

# get the overall heart diease occurrence rate
overall_rate = df[target].mean()
print('Overall Rate',overall_rate)

# calculate the difference between the feature value percentage and the overall rate
results['Difference'] = results['Percentage'] - overall_rate

# calculate the ratio of the difference to the overall rate
results['Ratio'] = results['Difference'] / overall_rate

# calculate the risk of heart disease occurrence for each feature value
results['Risk'] = results['Percentage'] / overall_rate

# sort the results by ratio in descending order
results = results.sort_values(by='Risk', ascending=False)

print(results)

# Visualize the rankings (e.g., create a bar plot)
import matplotlib.pyplot as plt
import seaborn as sns

plt.figure(figsize=(12, 6))
sns.barplot(data=results, x='Percentage', y='Value', hue='Feature')
plt.xlabel('Percentage of Heart Disease Occurrences')
plt.ylabel('Feature Value')
plt.title('Top 15 Ranking of Feature Values by Heart Disease Occurrence')
plt.show()

Overall Rate 0.09035
           Feature Value  Percentage  Difference     Ratio      Risk
65             bmi    77    0.400000    0.309647  3.427086  4.427086
1           stroke     1    0.363810    0.273457  3.026542  4.026542
3        genhealth  Poor    0.341131    0.250778  2.775537  3.775537
68             bmi    80    0.333333    0.242980  2.689239  3.689239
18       sleeptime    19    0.333333    0.242980  2.689239  3.689239
71             bmi    83    0.333333    0.242980  2.689239  3.689239
21       sleeptime    22    0.333333    0.242980  2.689239  3.689239
1    kidneydisease     1    0.293308    0.202956  2.246254  3.246254
29  physicalhealth    29    0.289216    0.198863  2.200957  3.200957
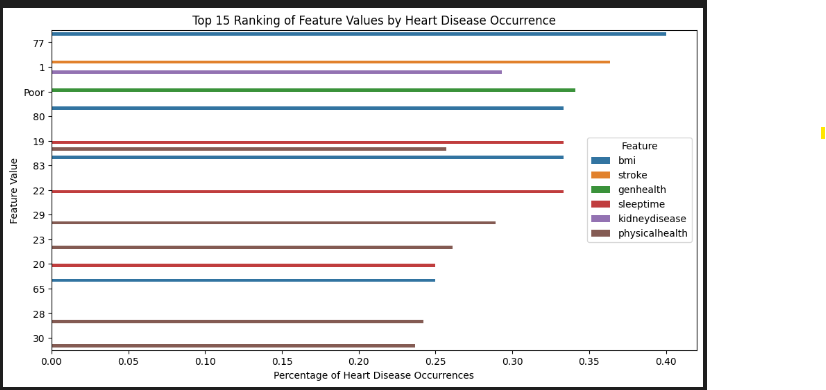
Heart Disease Feature Importance

  1. Overall Rate: This is the overall rate of heart disease occurrence in the dataset. It represents the proportion of individuals with heart disease (target='Yes') in the dataset. For example, if the overall rate is 0.2, it means that 20% of the individuals in the dataset have heart disease.

  2. Difference: This value represents the difference between the percentage of heart disease occurrence for a specific feature value and the overall rate. It tells us how much more or less likely individuals with a particular feature value are to have heart disease compared to the overall population. A positive difference indicates a higher likelihood, while a negative difference indicates a lower likelihood.

  3. Ratio: The ratio represents the difference relative to the overall rate. It quantifies how much the heart disease occurrence for a specific feature value deviates from the overall rate, considering the overall rate as the baseline. A ratio greater than 1 indicates a higher risk compared to the overall population, while a ratio less than 1 indicates a lower risk.

  4. Risk: This metric directly quantifies the likelihood of an event happening for a specific feature value, expressed as a percentage. It's easier to interpret as it directly answers the question: "What is the likelihood of heart disease for individuals with this feature value?"

These values help us understand the relationship between different features and heart disease. Positive differences, ratios greater than 1, and risk values greater than 100% suggest a higher risk associated with a particular feature value, while negative differences, ratios less than 1, and risk values less than 100% suggest a lower risk. This information can be used to identify factors that may increase or decrease the risk of heart disease within the dataset.

Mutual Information Score

The mutual information score measures the dependency between a feature and the target variable. Higher scores indicate stronger dependency, while lower scores indicate weaker dependency. A higher score suggests that the feature is more informative when predicting the target variable.

# Compute mutual information scores for each feature
X = df[cat_features]
y = df[target]

def mutual_info_heart_disease_score(series):
    return mutual_info_score(series, y)

mi_scores = X.apply(mutual_info_heart_disease_score)
mi_ranking = pd.Series(mi_scores, index=X.columns).sort_values(ascending=False)

print(mi_ranking)
# Visualize the rankings
plt.figure(figsize=(12, 6))
sns.barplot(x=mi_ranking.values, y=mi_ranking.index)
plt.xlabel('Mutual Information Scores')
plt.ylabel('Feature')
plt.title('Feature Importance Ranking via Mutual Information Scores')
agecategory    0.033523
genhealth      0.027151
diabetic       0.012960
sex            0.002771
race           0.001976
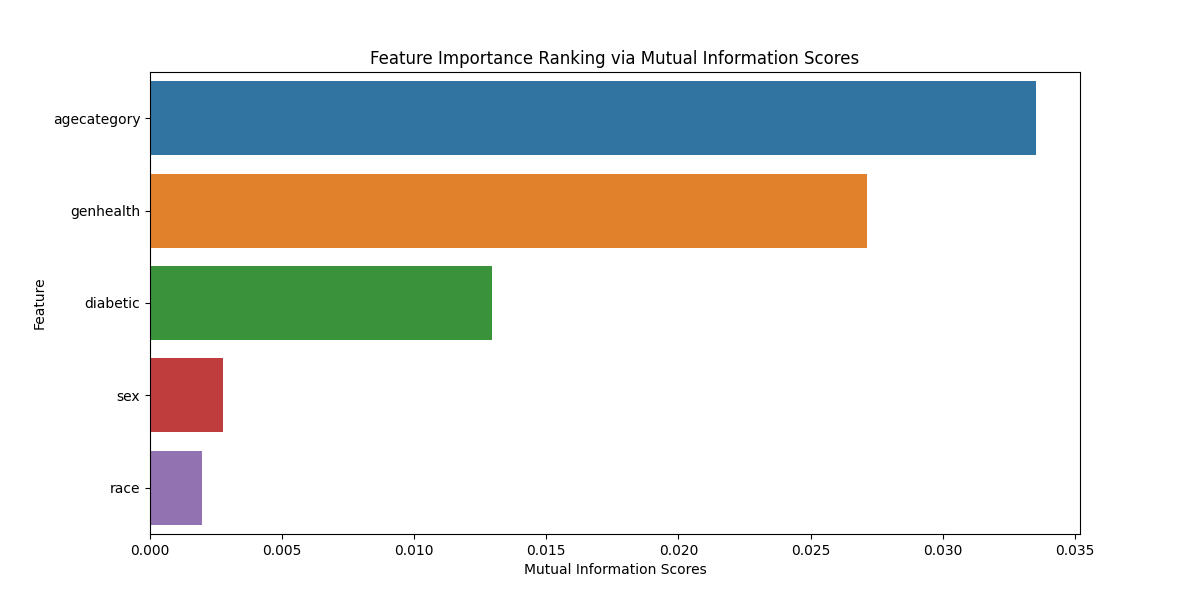
Heart Disease Feature Importance

Machine Learning Training and Model Selection

  • Load the data/2020/heart_2020_processed.csv
  • Process the features
    • Set the categorical features names
    • Set the numeric features names
    • Set the target variable
  • Split the data
    • train/validation/test split with 60%/20%/20% distribution.
    • Random_state 42
    • Use strategy = y to deal with the class imbalanced problem
  • Train the model
    • LogisticRegression
    • RandomForestClassifier
    • XGBClassifier
    • DecisionTreeClassifier
  • Evaluate the models and compare them
    • accuracy_score
    • precision_score
    • recall_score
    • f1_score
  • Confusion Matrix

Data Split

  • Use a 60/20/20 distribution fir train/val/test
  • Random_state 42 to shuffle the data
  • Use strategy = y when there is a class imbalance in the dataset. It helps ensure that the class distribution in both the training and validation (or test) sets closely resembles the original dataset's class distribution
def split_data(self, test_size=0.2, random_state=42):
        """
        Split the data into training and validation sets
        """
        # split the data in train/val/test sets, with 60%/20%/20% distribution with seed 1
        X = self.df[self.all_features]
        y = self.df[self.target_variable]
        X_full_train, X_test, y_full_train, y_test = train_test_split(X, y, test_size=test_size, random_state=random_state, stratify=y)

        # .25 splits the 80% train into 60% train and 20% val
        X_train, X_val, y_train, y_val  = train_test_split(X_full_train, y_full_train, test_size=0.25, random_state=random_state)

        X_train = X_train.reset_index(drop=True)
        X_val = X_val.reset_index(drop=True)
        y_train = y_train.reset_index(drop=True)
        y_val = y_val.reset_index(drop=True)
        X_test = X_test.reset_index(drop=True)
        y_test = y_test.reset_index(drop=True)

        # print the shape of all the data splits
        print('X_train shape', X_train.shape)
        print('X_val shape', X_val.shape)
        print('X_test shape', X_test.shape)
        print('y_train shape', y_train.shape)
        print('y_val shape', y_val.shape)
        print('y_test shape', y_test.shape)

        return X_train, X_val, y_train, y_val, X_test, y_test

X_train, X_val, y_train, y_val, X_test, y_test = train_data.split_data(test_size=0.2, random_state=42)

The split_data call is a method that splits a dataset into training, validation, and test sets. Here's a breakdown of the returned values:

  • X_train: This represents the features (input variables) of the training set. The model will be trained on this data.

  • y_train: This corresponds to the labels (output variable) for the training set. It contains the correct outcomes corresponding to the features in X_train.

  • X_val: These are the features of the validation set. The model's performance is often assessed on this set during training to ensure it generalizes well to new, unseen data.

  • y_val: These are the labels for the validation set. They serve as the correct outcomes for the features in X_val during the evaluation of the model's performance.

  • X_test: These are the features of the test set. The model's final evaluation is typically done on this set to assess its performance on completely unseen data.

  • y_test: Similar to y_val, this contains the labels for the test set. It represents the correct outcomes for the features in X_test during the final evaluation of the model.

Model Training

For model training, we first pre-process the data by taking these steps:

  • preprocess_data
    • The input features X are converted to a dictionary format using the to_dict method with the orientation set to records. This is a common step when working with scikit-learn transformers, as they often expect input data in this format.
    • If is_training is True, it fits a transformer (self.encoder) on the data using the fit_transform method. If False, it transforms the data using the previously fitted transformer (self.encoder.transform). The standardized features are then returned.

We then train the different models:

  • train -This method takes X_train (training features) and y_train (training labels) as parameters. -If the models attribute of the class is None, it initializes a dictionary of machine learning models including logistic regression, random forest, XGBoost, and decision tree classifiers.
def preprocess_data(self, X, is_training=True):      
        """
        Preprocess the data for training or validation
        """  
        X_dict = X.to_dict(orient='records')        

        if is_training:
            X_std = self.encoder.fit_transform(X_dict)            
        else:
            X_std = self.encoder.transform(X_dict)

        # Return the standardized features and target variable
        return X_std

def train(self, X_train, y_train):

      if self.models is None:
          self.models = {
              'logistic_regression': LogisticRegression(C=10, max_iter=1000, random_state=42),
              'random_forest': RandomForestClassifier(n_estimators=100, max_depth=5, random_state=42, n_jobs=-1),
              'xgboost': XGBClassifier(n_estimators=100, max_depth=5, random_state=42, n_jobs=-1),                
              'decision_tree': DecisionTreeClassifier(max_depth=5, random_state=42)
          }

      for model in self.models.keys():
          print('Training model', model)
          self.models[model].fit(X_train, y_train) 

# hot encode the categorical features for the train data
model_factory = HeartDiseaseModelFactory(cat_features, num_features)
X_train_std = model_factory.preprocess_data(X_train[cat_features + num_features], True)

# hot encode the categorical features for the validation data
X_val_std = model_factory.preprocess_data(X_val[cat_features + num_features], False)

# Train the model
model_factory.train(X_train_std, y_train)

Model Evaluation

For the model evaluation, we calculate the following metrics:

  1. Accuracy tells us how often your model is correct. It's the percentage of all predictions that are accurate. For example, an accuracy of 92% is great, while 70% is not good.

  2. Precision is about being precise, not making many mistakes. It's the percentage of positive predictions that were actually correct. For instance, a precision of 90% is great, while 50% is not good.

  3. Recall is about not missing any positive instances. It's the percentage of actual positives that were correctly predicted. A recall of 85% is great, while 30% is not good.

  4. F1 Score is a balance between precision and recall. It's like having the best of both worlds. For example, an F1 score of 80% is great, while 45% is not good.


def evaluate(self, X_val, y_val, threshold=0.5):
        """
        Evaluate the model on the validation data set and return the predictions
        """

        # create a dataframe to store the metrics
        df_metrics = pd.DataFrame(columns=['model', 'accuracy', 'precision', 'recall', 'f1', 'y_pred'])

        # define the metrics to be calculated
        fn_metrics = { 'accuracy': accuracy_score,'precision': precision_score,'recall': recall_score,'f1': f1_score}

        # loop through the models and get its metrics
        for model_name in self.models.keys():

            model = self.models[model_name]

            # The first column (y_pred_proba[:, 0]) is for class 0 ("N")
            # The second column (y_pred_proba[:, 1]) is for class 1 ("Y")            
            y_pred = model.predict_proba(X_val)[:,1]
            # get the binary predictions
            y_pred_binary = np.where(y_pred > threshold, 1, 0)

            # add a new row to the dataframe for each model            
            df_metrics.loc[len(df_metrics)] = [model_name, 0, 0, 0, 0, y_pred_binary]

            # get the row index
            row_index = len(df_metrics)-1

            # Evaluate the model metrics
            for metric in fn_metrics.keys():
                score = fn_metrics[metric](y_val, y_pred_binary)
                df_metrics.at[row_index,metric] = score

        return df_metrics

Model Performance Metrics:

Model Accuracy Precision Recall F1
Logistic Regression 0.9097 0.509 0.0987 0.1654
Random Forest 0.9095 0.6957 0.0029 0.0058
XGBoost 0.9099 0.5154 0.098 0.1647
Decision Tree 0.9097 0.5197 0.0556 0.1004

These metrics provide insights into the performance of each model, helping us understand their strengths and areas for improvement.

Analysis:

  • XGBoost Model:

    • Accuracy: 90.99
    • Precision: 51.54%
    • Recall: 9.80%
    • F1 Score: 16.47%
  • Decision Tree Model:

    • Accuracy: 90.97%
    • Precision: 51.97%
    • Recall: 5.56%
    • F1 Score: 10.04%
  • Logistic Regression Model:

    • Accuracy: 90.97%
    • Precision: 50.90%
    • Recall: 9.87%
    • F1 Score: 16.54%
  • Random Forest Model:

    • Accuracy: 90.95%
    • Precision: 69.57%
    • Recall: 0.29%
    • F1 Score: 0.58%
  • XGBoost Model has a relatively balanced precision and recall, indicating it's better at identifying true positives while keeping false positives in check.

  • Decision Tree Model has the lowest recall, suggesting that it may miss some positive cases.

  • Logistic Regression Model has a good balance of precision and recall similar to the XGBoost Model.

  • Random Forest Model has high precision but an extremely low recall, meaning it's cautious in predicting positive cases but may miss many of them.

Based on this analysis, we will choose XGBoost as our API model
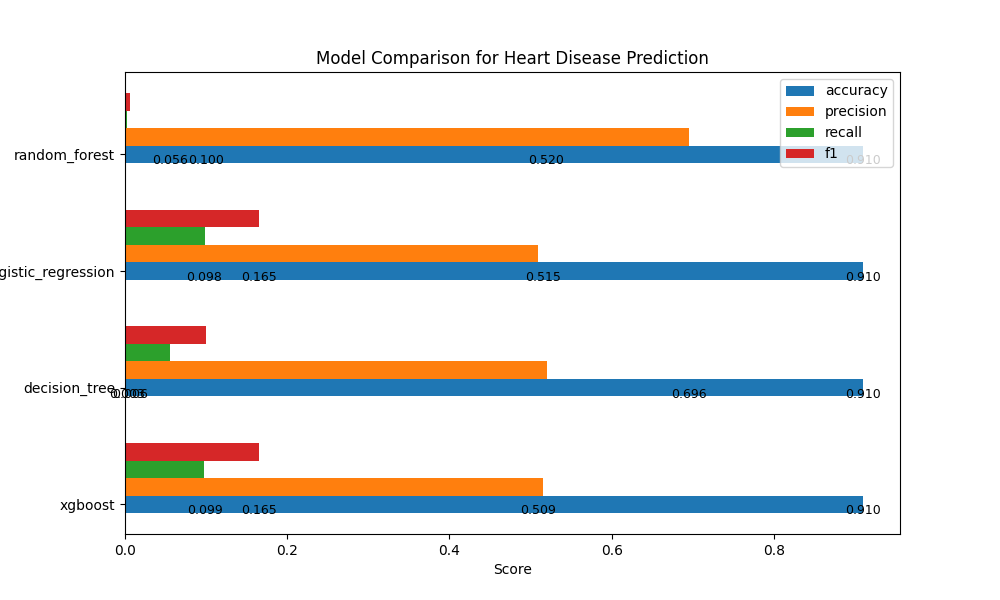
Heart Disease Model Evaluation

Confusion Matrix:

The confusion matrix is a valuable tool for evaluating the performance of classification models, especially for a binary classification problem like predicting heart disease (where the target variable has two classes: 0 for "No" and 1 for "Yes"). Let's analyze what the confusion matrix represents for heart disease prediction using the four models.

For this analysis, we'll consider the following terms:

  • True Positives (TP): The model correctly predicted "Yes" (heart disease) when the actual label was also "Yes."

  • True Negatives (TN): The model correctly predicted "No" (no heart disease) when the actual label was also "No."

  • False Positives (FP): The model incorrectly predicted "Yes" when the actual label was "No." (Type I error)

  • False Negatives (FN): The model incorrectly predicted "No" when the actual label was "Yes." (Type II error)

from sklearn.metrics import confusion_matrix
import seaborn as sns
import matplotlib.pyplot as plt

cms = []
model_names = []
total_samples = []

for model_name in df_metrics['model']:
    model_y_pred = df_metrics[df_metrics['model'] == model_name]['y_pred'].iloc[0]

    # Compute the confusion matrix
    cm = confusion_matrix(y_val, model_y_pred)    
    cms.append(cm)
    model_names.append(model_name)
    total_samples.append(np.sum(cm))    

# Create a 2x2 grid of subplots
fig, axes = plt.subplots(2, 2, figsize=(10, 10))

# Loop through the subplots and plot the confusion matrices
for i, ax in enumerate(axes.flat):
    cm = cms[i]    
    im = ax.imshow(cm, interpolation='nearest', cmap=plt.cm.Blues)
    ax.figure.colorbar(im, ax=ax, shrink=0.6)

    # Set labels, title, and value in the center of the heatmap
    ax.set(xticks=np.arange(cm.shape[1]), yticks=np.arange(cm.shape[0]), 
           xticklabels=["No Heart Disease", "Heart Disease"], yticklabels=["No Heart Disease", "Heart Disease"],
           title=f'{model_names[i]} (n={total_samples[i]})\n')

    # Loop to annotate each quadrant with its count
    for i in range(cm.shape[0]):
        for j in range(cm.shape[1]):
            ax.text(j, i, str(cm[i, j]), ha="center", va="center", color="gray")

    ax.title.set_fontsize(12)
    ax.set_xlabel('Predicted', fontsize=10)
    ax.set_ylabel('Actual', fontsize=10)
    ax.xaxis.set_label_position('top')

# Adjust the layout
plt.tight_layout()

Let's examine the confusion matrices for each model:
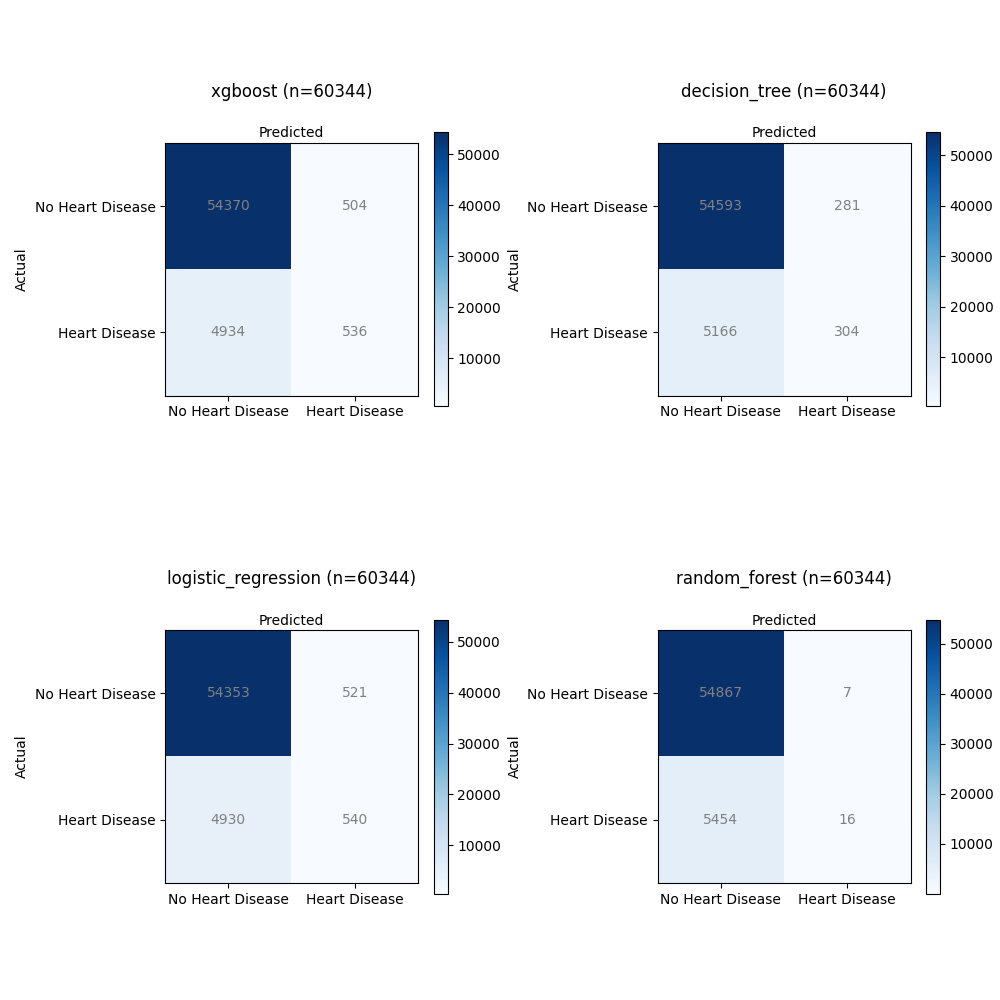
Heart Disease Model Confusion Matrix

  • XGBoost:

    • Total Samples: 60,344
    • Confusion Matrix Total:
      • True Positives (TP): 536
      • True Negatives (TN): 54,370
      • False Positives (FP): 504
      • False Negatives (FN): 4,934
  • Decision Tree:

    • Total Samples: 60,344
    • Confusion Matrix Total:
      • True Positives (TP): 304
      • True Negatives (TN): 54,593
      • False Positives (FP): 281
      • False Negatives (FN): 5,166
  • Logistic Regression:

    • Total Samples: 60,344
    • Confusion Matrix Total:
      • True Positives (TP): 540
      • True Negatives (TN): 54,353
      • False Positives (FP): 521
      • False Negatives (FN): 4,930
  • Random Forest:

    • Total Samples: 60,344
    • Confusion Matrix Total:
      • True Positives (TP): 16
      • True Negatives (TN): 54,867
      • False Positives (FP): 7
      • False Negatives (FN): 5,454

XGBoost:

  • This model achieved a relatively high number of True Positives (TP) with 536 cases correctly predicted as having heart disease.
  • It also had a significant number of True Negatives (TN), indicating correct predictions of no heart disease (54,370).
  • However, there were 504 False Positives (FP), where it incorrectly predicted heart disease.
  • It had 4,934 False Negatives (FN), suggesting instances where actual heart disease cases were incorrectly predicted as non-disease.

Decision Tree:

  • The Decision Tree model achieved 304 True Positives (TP), correctly identifying heart disease cases.
  • It also had 54,593 True Negatives (TN), showing accurate predictions of no heart disease.
  • There were 281 False Positives (FP), indicating instances where the model incorrectly predicted heart disease.
  • It had 5,166 False Negatives (FN), meaning it missed identifying heart disease in these cases.

Logistic Regression:

  • The Logistic Regression model achieved 540 True Positives (TP), correctly identifying cases with heart disease.
  • It had a high number of True Negatives (TN) with 54,353 correctly predicted non-disease cases.
  • However, there were 521 False Positives (FP), where the model incorrectly predicted heart disease.
  • It also had 4,930 False Negatives (FN), indicating missed predictions of heart disease.

Random Forest:

  • The Random Forest model achieved a relatively low number of True Positives (TP) with 16 cases correctly predicted as having heart disease.
  • It had a high number of True Negatives (TN) with 54,867 correctly predicted non-disease cases.
  • There were only 7 False Positives (FP), suggesting rare incorrect predictions of heart disease.
  • However, it also had 5,454 False Negatives (FN), indicating a substantial number of missed predictions of heart disease.

All models achieved a good number of True Negatives, suggesting their ability to correctly predict non-disease cases. However, there were variations in True Positives, False Positives, and False Negatives. The XGBoost model achieved the highest True Positives but also had a significant number of False Positives. The Decision Tree and Logistic Regression models showed similar TP and FP counts, while the Random Forest model had the lowest TP count. The trade-off between these metrics is essential for assessing the model's performance in detecting heart disease accurately.

Summary

In the quest to find the best solution for predicting heart disease, it's crucial to evaluate various models. However, it's not just about picking a model and hoping for the best. We need to be mindful of class imbalances – situations where one group has more examples than the other. This imbalance can throw our predictions off balance.

To fine-tune our models, we also need to adjust the hyperparameters. Think of it as finding the perfect settings to make our models have a better performance. By addressing class imbalances and tweaking those hyperparameters, we ensure our models perform accurately.

By using the correct data features and evaluating the performance of our models, we can build solutions that could assist healthcare professionals in evaluating an individual's risk profile for heart disease.

Thanks for reading.

Send question or comment at Twitter @ozkary Originally published by ozkary.com