There really isn’t an adequate way to encapsulate what the Bureau of Labor and Statistics has done with their reported January jobs result [Main Data Here]. If you want a deep weeds review of the actuarial scheme deployed READ THIS ARTICLE.
In my lifetime of reviewing data and analytics, I have never reviewed a level of statistical manipulation that even comes close to this. Well, at least not since the 1980’s junk bond valuations used for corporate restructuring and asset removal. What the BLS produced today will likely go down in the annals of actuarial history as one of the most comprehensively fraudulent manipulations of labor and statistics in history.
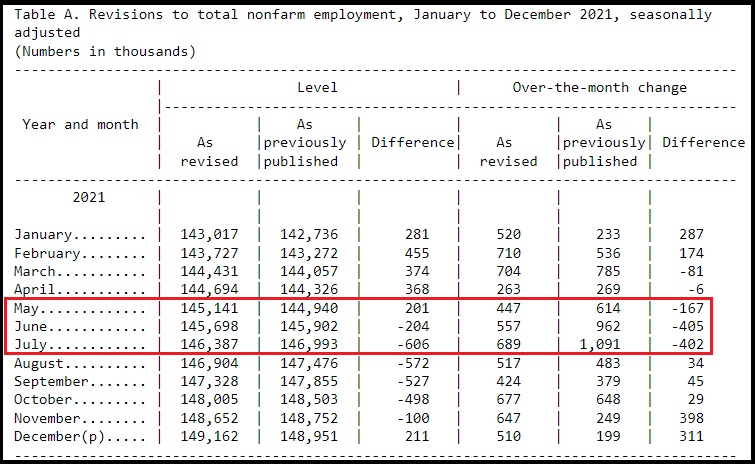
In order to get to a point of being able to claim 467,000 job gains last month, the BLS needed to revise four years’ worth of claimed jobs and population data. By subtracting over a million prior jobs from 2021, essentially wiping out the COVID pandemic monthly impact, and by changing the workforce population over the same number of years, the BLS was able to recalculate the current number of people in the workforce and claim 467,000 jobs were recently created.
Again, to unpack this effort would require a week of intensive education on statistics. {Summary Here}
To avoid that complexity, just think of the big picture this way:
In order to claim a nonexistent gain today, you have to change what took place before.
Ex. Your home is worth $1.4 million as of this morning. Your home is worth $400,000 more today alone. Why? Because your appreciation was stopped for the past year, and you are now comparing January 2022 to December 2020 when your home was worth $1 million. You need to pretend the $33,000 your home was gaining in value each month never existed. Instead, your home went from $1 million to 1.4 million in one day, today.
This is, essentially, the methodologic mindset behind the statistical manipulation.
Additionally, again using this actuary example, to justify your current home valuation to a quizzical audience (a potential buyer), the appraiser (BLS) would have to change every previously appraised value of the entire neighborhood – for every comparable that took place in the prior year. This is akin to changing the population in the workforce statistics.
The problem becomes that once you set this numerical foundation (the number of people working), all subsequent job reports will have to reflect a new position against a higher base. Without expanded economic activity to support it, future job gains will be lowered because they are going up against a higher baseline, because the entire population of workers has been changed.
We also know that U.S. economic activity is not expanding.
The value of this January BLS report is essentially nil.
All of that said, there is still a macro BLS data point that deserves emphasis. Remember the timeline CTH shared previously about the economy and employment changing in May and June of 2021? That date corresponded with the 2021 massive jump in inflation; yet, none of the data being assembled seemed to show it?
Look at the specific timeframe BLS used to drop the majority of their 2021 employment numbers:
It is not coincidental the BLS used the last half of the year to remove 2.5 million claimed workers (subsequently the jobs they held). The COVID excuse, Delta and Omicron waves, are the cover story for this revision. The BLS now position the workforce as 149.16 million in December – an increase of roughly 6 million workers from the revised 143.0 million in January.
As one person put it, “there’s cooking numbers, and then there’s cast iron skillet deep frying numbers.”
Yup, the BLS has compiled a burnt offering – upon the altar of sacrificing their credibility.

As soon as I heard these numbers I knew it was B.S. I have been reporting monthly to BLS for my company for the last 3 to 4 years. It’s voluntary. I think my industry (unskilled temporary staffing) is a true reflection of jobs in the country and thought I was actually doing a worthy service for one of the last areas of government that had value. That’s obviously a time gone past. I think it’s time for me to tell BLS and the Biden Crime Syndicate to flake off.
Same here. The numbers were jarring in their contrast to the ADP report and to the pattern preceding them. I knew immediately they were manipulated. No analyst-even those who back FJB – predicted this level of employment. Sundance showed the numbers used and clearly demonstrated that months of lockdowns were ignored and retro actively altered to get this astonishing jump in job numbers. The clue is in FJB immediately being wheeled out with a chart to sing praises to himself while not saying what he actually did. Neither is is economic adviser saying what they actually did. And like Sundance said the new artificially created baseline will create problems for FJB going forward. Word will spread the numbers were Jimmied and FJB will sink lower. This was a Gail Mary move by a corrupt DC beaurocacy.
one thing GOOD about it, if it happens: problems for FJB going forward. These TREASONOUS, LYING CROOKS NEED TRILLIONS OF PROBLEMS, like the trillions of dollars they STEAL FROM AMERICA.
More on Today’s Bogus Job Numbers from the BLS – “There’s Never Been a January Seasonal Adjustment of This Magnitude”
The overall theme is that the BLS apparently is now saying that they way overstated jobs this past summer and decided to move those overstatements to January.
https://www.thegatewaypundit.com/2022/02/todays-bogus-job-numbers-bls-never-january-seasonal-adjustment-magnitude/?utm_source=Twitter&utm_medium=PostSideSharingButtons&utm_campaign=websitesharingbuttons
Does anyone else find Kim Jung Un’s NK economic data, not to mention Enron, more reliable at this point?
Rhetorical question!
So, now the BLS is a department of the Democrat Party along with the FBI, DOJ, CIA, NIH, FDA, CDC and OSHA!
It would probably be easier to ask what federal agency isn’t a department of the Democrat Party?
Stealing your words to share. Was thinking same for awhile now…this Country Totally subverted. Time for Tea Party.
I think at this point BLS needs a name change to BS
Office of Bullsh!t Statistics..
or bureaucrap labor shi*istics
And you expected otherwise when there are 13 registered Democrats for everyone one registered Republican in DC? Every agency of the administrative state (technically part of the executive branch and therefore, presumably, subject to Republican influence when there is a Republican president) is going to be infested with leftists pushing their agenda. And there are few to push back against the narrative that the left pushes whose voices will be heard.
Didn’t they manipulate the data for Obama also? They always had is unemployment numbers lower that they really were.
“Yup, the BLS has compiled a burnt offering – upon the altar of sacrificing their credibility”
Imagine my shock 🙄 when I read that “report” this morning on Fox. I’d say another one bites the dust, but they’re really just wallowing in the sty with all the other animals 🐷
Don’t insult the animals. my dogs are 100% trust worthy
RIGHT. Animals are better than these trash. Insects are better, too, which is why I call them SUB-INSECTS, lower than sub-humans.
This gimmick was borrowed from NOAA that had to roll back (adjust downward) decades of temperature records to claim that global warming was upon us.
As one person put it, “there’s cooking numbers, and then there’s cast iron skillet deep frying numbers.”
“Yup, the BLS has compiled a burnt offering – upon the altar of sacrificing their credibility.”
This is really funny. Just wish the comments weren’t because of governmental funny business.
Nessie, I think I will use the burnt offering reference when I submit my next report to BLS for the February report. I’ll also be notifying them that this will be the last report I’ll be submitting. They do try to strong arm companies into complying with the request to participate but it’s a voluntary service.
Gives flashbacks to the old “jobs saved or created” days… now what administration was that again?
must be the obama defilement.
I wonder … aren’t the two tables here exactly the same?
Lies, damned lies, and Bureau of Labor and Statistics.
Figures don’t lie but liars can figure!
Heads need to roll, literally.
way, way, way OVERDUE. Power-abusing TREASON IS THE WORST CRIME THERE IS.
No one has a good enough memory, to be a truly succesful liar.
“An expert is someone who is more than 10 miles from home.” said in the days of the horse, if you were 10 miles from home, nobody KNEW you, hence you could claim expert status.
As pointed out, this cooking the books, for short term ‘benefit’ (to the fraudsters) will inevitably “bite them in the ass”, as it will makexall future #’s look worse.
This is clearly an act of desperation. SEE it as such!
It is exactly the equivalent of an animal, caught in a steel trap, chewing its own leg off.
It gets them out of the trap (in this case, of their own making!) but,…TO WHAT END?
SO, while this IS horrible news for Americans and our economy, its actually great news, from the point of the fight for liberty.
More broadly, the enemy have, similarly been shredding their credibility (inevitably hurting themselves in the LONG term) for short term gains.
The recent announcement by the Ottowa Police chief is of the same vein; the enemy forces are COLLAPSING on numerous fronts.
This is NO TIME for disparaging and dispirited comments, or defeatist attitiude.
WE are winning, HOLD THE LINE!
When they challenge our lines, send in reinforcements!
They cut off our supply lines? Go thru or around THIER blockades.
The collapse of the Government forces will happen quickly, when it happens, much like an avalanche or a bankruptcy;
very slowly, then all at once.
“much like an avalanche or a bankruptcy; very slowly, then all at once.”
I said as much to another poster just yesterday. The thing about avalanches is that they are rarely one big event. It is usually a series of small events that culminates in the big one. The demonic cabal will fall. It will fall hard.
There are a whole bunch of sheep who one day say how did we miss this
They miss it BECAUSE THEY HATE TRUTH. Like the communist traitors, ALL THEY CARE ABOUT IS THEIR AGENDA. If the truth doesn’t fit their agenda, they discard the truth in order to keep their agenda.
Amen dutch, the only problem is the second the figures were revealed EVERYBODY screamed bull s1ht
It is exactly the equivalent of an animal, caught in a steel trap, chewing its own leg off.
[BEAUTIFUL WORD PICTURE happening to them. THANKS!]
the enemy forces are COLLAPSING on numerous fronts.
[In many ways, they are, such as their “credibility”, EVEN LOWER, NOW. But a way they haven’t collapsed, is BEING REMOVED FROM POWER, AND PROSECUTED FOR TREASON AND THEIR OTHER NUMEROUS CRIMES.]
WE are winning, HOLD THE LINE!
Go thru or around THIER blockades.
[YES. We have to MATERIALIZE THE WIN, not just recognize their absurdity.]
The collapse of the Government forces will happen quickly, when it happens, much like an avalanche or a bankruptcy;
very slowly, then all at once.
[What will defeat their military, though? Governor DeSantis idea might do it: Our own Florida State military. Texas is also using its own forces to deal with the BORDER TREASONS OF THE U.S. FEDERAL GOVSCUM.]
Nothing but steamy froth rising from a cooking cauldron of evil minds, corrupted hearts, and wicked souls.
And people thought Pravda was bad. Lying liars and the lying lies they tell.
Pravda was the inspiration for these more creative and bold in-your-face liars.
Was Pravda ever so TREASONOUS and DISHONEST?
I knew it right away. They were expecting 150K loss. that is some kind of miracle.
This administration has corrupted every government agency including the Justice and FBI.
And the ADP report showed a loss of 301,000 jobs the day before.
Then it’s good to have ADP to EXPOSE THE GOVT. LIARS!
Making up fake stats doesn’t convince the victims of Bidenomics to vote D. So good job, BLS, keeping the MSM happy, continued, D voters.
Desperate people do desperate things.
No one should be surprised that another government agency is corrupted by their ideologically alignment with the Joebama regime after witnessing the government apparatus, FBI, DOJ, DOD and State Dept.attack and attempt to bring down the Trump administration and the entire two year covid-19 response by our healthcare institutions. I have zero trust in any and all government institutions.
I AGREE THE SAME ABOUT THEM. And I wonder if they’ll be able to RUIN THE HEALTHCARE PROFESSION, as they were doing during the obama defilement, and again now. Mike Adams/Brighteon/Natural News/Health Ranger said recently, that he thinks it will be the health profession that starts a turn AWAY FROM ABSURDITY AND TOWARD TRUTH AND COMMON SENSE. {I can believe that because I think of all professions, health professionals dedicated themselves to HELPING PEOPLE, and know that the LYING SCAMS OF GOVT. HURT PEOPLE.}
There are often discrepancies between the ADP jobs numbers and the BLS jobs numbers, but not like this week. The BLS numbers are bogus. And what gets me about the jobs numbers and the GDP number is that these tricks they are using to make them look better will only work temporarily, and will actually make things look even worse later on. If you are a Biden staffer, this is a dumb move because the election is 9 months away.
Think of the disaster this economy will be in 6 months , what will Jenny from the hood say about the collapse of the economy
Faux Business News was disappointing to listen to. It was hard to tell if Maria Bartiromo was being facetious through all of this or whether she was honestly giddy over the numbers. But leave it to Faux, “No disparaging or questioning of the official numbers. Just call it ‘a very very strong number.”
https://www.thegatewaypundit.com/2022/02/labor-dept-jobless-numbers-leave-experts-gobsmacked-150k-expected-adp-showed-loss-300k-biden-labor-dept-reports-467k-created/
Good point. I saw how she and her guests TOTALLY BELIEVED IT. Faux has a lot of seemingly good lines. But in some ways, they seem to miss the boat. (Maybe on purpose) To me, their WEAKEST LINE is EVERY ONE OF THEIR HOSTS SAYING, “I’m for vaccine, but not vaccine mandate.” And some of them admit to getting vaxed. I wouldn’t trust the scamming traitor govt. for 1 second of their “vaccine”. WHY TRUST PERPETUAL LIARS? {Remember how much they INCREASED THEIR HYPE TO GET FLU SHOTS? They were untrustworthy with that, and now all the more with their vax scam.}
I am retired for 10 years now and even this lil ole lady KNEW with Certainty that those numbers were just another made up figger so this made up white house occupant could lie some more to anyone who will listen to him.
People have to be smart enough to know,(just by living their day-to-day life), that there was no where near 467,000 jobs created in the month of January.
Just like people are smart enough to know that the fraudulent white house occupant did NOT get 81 million votes…no how, no way.
Lies, lies and more lies.
Cook the Books
idiomatic phrase
informal
: to alter official accounting records in order to deceive or mislead.
//The Bureau of Labor and Statistics (BLS) needed to revise four years’ worth of claimed jobs and population data. By subtracting over a million prior jobs from 2021, essentially wiping out the COVID pandemic monthly impact, and by changing the workforce population over the same number of years, the BLS was able to recalculate the current number of people in the workforce and claim 467,000 jobs were recently created.
467,000 Recently fired people decided to , at the last minute, get vaccinated and get back on the job.?
We all know this whole government and administration is a worthless collection of liars and thieves .
They’ve been producing generations of non critical, uninformed fools. They know nothing.
This is the decadent class talking amongst themselves!
This is no surprise. These people are all serving the father of all lies.
it is interesting even Maria B. did not pick up and report this.
Baked Potato
heh! They’ve been doing this in the Global Warming Scam for decades now.
They keep revising old temperature numbers down, to show the current temperature numbers as high comparatively (This scam is called ‘homogenization’)
Drop the 1900 to 1920 numbers down by say, 0.2 DegC and voila’ the current temperature is up by 0.2 DegC.
Anyone else get this error ?
https://www.zerohedge.com/
We’re sorry, there was an unexpected error loading this page. Please try again later.
Poor Joe doesn’t understand either. We were watching and laughing at lunch today and it appeared Biden really believed the outrageous lies he was spreading.
It will be interesting to see how they reconcile this information with the Fed actions in March. If these numbers were true (and I think even the most ardent Biden supporter must have smelled a rat somewhere in the statistics) then the Fed would have to move more aggressively. But I’m sure they have some other scheme planned for the rate hike that is needed.
The stock market went up on this news (the people on Wall St. are not morons). It also went up a few days back after the “fed” said they would be raising interest rates numerous times this year. The only conclusion I can draw from this is that tax money from these stimulus packages is being used to prop up the stock market. They can only play these games for so long before it all comes crashing down. When it crashes it will be off the charts!
It will be hidden until it is catastrophic, aka a crisis to be exploited for social engineering purposes. Meanwhile Main Street will suffer greatly in their eyes. But we know how to survive and thrive in hard times.
Consistent with a guy who claimed 81 million votes.
No one believed these numbers this morning. Peppermint Patty spent a substantial amount of time at her press briefing Monday telling people about all the anomalies that occurred with the sampling as an excuse for the numbers this week. They knew Monday they were going to be horrible. I’m guessing Ron Klain had a long talk with someone at BLS to ensure in the ensuing 5 days they cooked these numbers. But I guess coming from an administration who claims to have gotten 81 million votes and to be “the most popular president in American history”, what else would you expect?
so cooked numbers will be the justification and trigger for the fed to immediately raise the lending rates .50%…
as all the ‘pundits’ were saying when they all got faked out when the news broke.
Thanks for that. I noticed the MSM story was wildly different from the prior numbers but hadn’t gotten around to researching it yet.
Can I do this with my tax deductions?
HEYYY! That’s what happened at 3:15 am on November 4, 2020 too! We may be on a trail here.
If we only had a curious and honest media.
They do the same thing with temperature records to create “global warming”. All of the measured temperature anomaly increase during the industrial era has been the result of “corrections” of the historical temperature record.
If you look at the raw data with no corrections, there is no increase in temperature anomalies at all and depending on the dataset you use, in same cases there’s a decrease.
Manipulating data to support a narrative is a common (otherwise know as propaganda) is a common tactic of the left.
More on Today’s Bogus Job Numbers from the BLS – “There’s Never Been a January Seasonal Adjustment of This Magnitude”
The overall theme is that the BLS apparently is now saying that they way overstated jobs this past summer and decided to move those overstatements to January.
https://www.thegatewaypundit.com/2022/02/todays-bogus-job-numbers-bls-never-january-seasonal-adjustment-magnitude/?utm_source=Twitter&utm_medium=PostSideSharingButtons&utm_campaign=websitesharingbuttons
More BS from our own government. What a bunch of criminal liars. Par for the course with the (D) party.
Well, there numbers may not be as off as we think. They imported 2M illegals this year.
Is anyone addressing the odd comments that Peppermint Patty uttered on Monday Jan 31, 2022 that seemed to prepare us for a disappointing jobs report? Her comments were in line with the ADP estimates of -301,000, the the BLS prints this blow-out number. This whole episode is surreal.