In Search of the Rivers that Carry Plastic into the Ocean
Back to updates- 1000 rivers account for nearly 80% of global riverine plastic emissions into the ocean, according to our study, published in Science Advances.
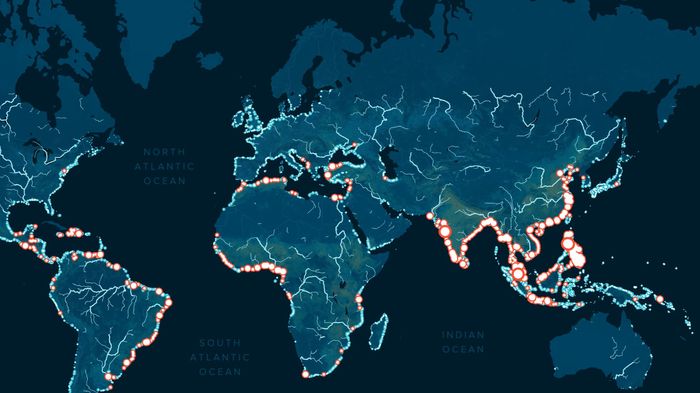
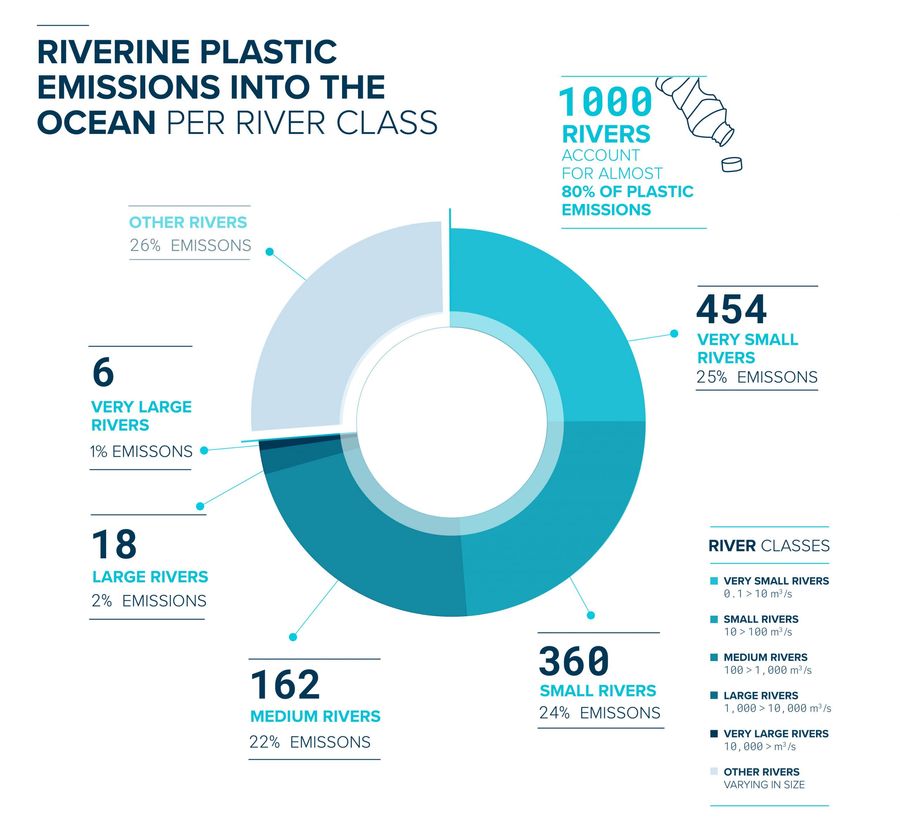
- Our model suggests that instead of a handful of large continental rivers contributing the most emissions, a high number of small and medium-sized rivers play a significant role in the influx of plastic from rivers to the ocean.
- These 1000 rivers can present very different characteristics, including river width, flow dynamics, marine traffic, and urbanization.
- A wide range of mitigation measures must be applied to these rivers across the globe to substantially decrease the amount of waste entering our oceans from rivers.
- Our study results are accessible in this interactive map, where you can find and help to address your nearest polluting river.
To substantially decrease riverine plastic emissions into the ocean, in how many rivers do we need to implement mitigation measures, where are these rivers located, and what are the characteristics of these rivers? For the last three years, researchers at The Ocean Cleanup have been working on answering these questions to effectively reduce oceanic plastic pollution. Our study – published today in Science Advances – estimates that 1000 rivers account for nearly 80% of global riverine plastic emissions into the ocean, made up of a high number of small and medium-sized rivers. While this number is much higher than previous estimations (100 times), it is only 1% of rivers worldwide, which means solving the problem is feasible. By collectively taking a global approach with various technologies to target these most polluting rivers, we can drastically reduce the influx of plastic into the ocean.
These high-resolution data allow for The Ocean Cleanup and other organizations worldwide to develop focused mitigation strategies and technologies to reduce riverine plastic emissions. In 2019, The Ocean Cleanup launched our river cleanup technology, the Interceptor, and have been using this data as a compass to find suitable locations to deploy Interceptor solutions. With this study now accepted, The Ocean Cleanup can use its findings to further support and accelerate global plastic extraction initiatives, policy, and consumer changes and awareness.
MODELING GLOBAL RIVERINE PLASTIC EMISSIONS
The Ocean Cleanup’s mission is to rid the world’s oceans of plastic. Decreasing the inflow of plastics into the ocean is one part of our solution to solve the problem of plastic accumulating in our oceans. But how are plastic emissions distributed over the 100,000 rivers, creeks, and canals that exist worldwide? Two previous studies (2017) gathered data on mismanaged plastic waste generated within a river basin and applied a correction factor to estimate the river’s plastic emission. These studies predicted that as little as 5 or 47 rivers account for 80% of riverine plastic emissions.
Since 2017 more data on macroplastics in rivers became available from several research groups, including The Ocean Cleanup. These data, and new insights, suggested that global riverine plastic emissions could be more widespread than previously thought. Therefore, to effectively impact pollution in rivers and oceans, we needed to update our global river plastic emissions model by including more details on plastic transport dynamics and data at a higher spatial resolution.
In collaboration with researchers from various institutions and organizations, we created a new model framework and included data from 136 field measurements, representing 67 rivers in 14 countries of 3 different continents, collected between 2017 and 2020 to calibrate and validate our model. We used analogous research and insights from field campaigns to conceptualize plastic transport and worked with 60 earth science and plastic experts to parametrize our probabilistic model. Our updated model now suggests that 1000 rivers account for nearly 80% of global annual emissions, ranging between 0.8 million and 2.7 million metric tons per year, with small urban rivers among the most polluting.
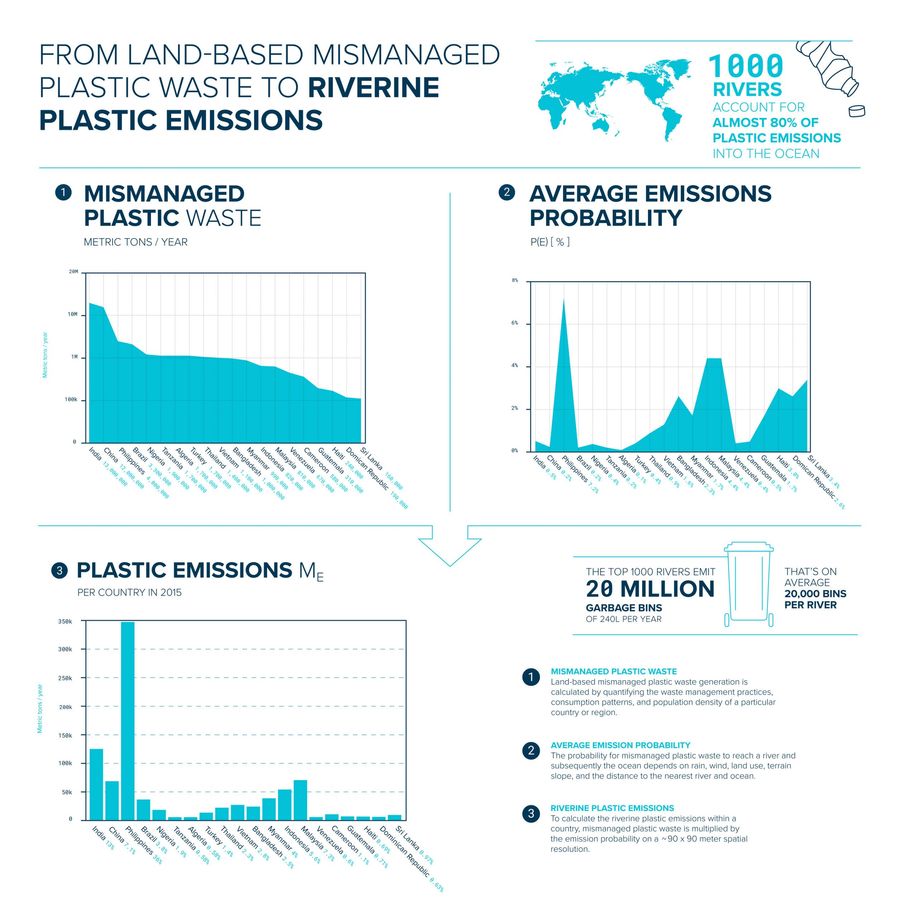
To build a model that simulates global riverine plastic transport, we needed global data sets. By utilizing data on terrain slope, elevation (DEM), flow direction (HydroSHEDS), runoff data (GRUN), land use data (GLC2000), precipitation and wind data (WorldClim2), we calculated a global river network, river classes, terrain characteristics, the distance from every location on Earth towards the nearest river and ocean, and the corresponding mobilization and transport probabilities. We then figured the probability for mismanaged plastic waste to reach the ocean for each grid cell. This plastic emission probability is then multiplied with the corresponding mismanaged plastic waste and accumulation within a river basin, resulting in the annual plastic emissions per river mouth.
As with any model estimations of this magnitude , it is possible that the load of a specific river might differ from the predictions in the model. Reasons for this could be that actuals vary from dataset inputs, physical structures near the mouth of the river are unaccounted for in the river, timings of measurements (for example after an extreme rain event or a long dry spell), or mitigation measures are already in place. For future research, we recommend including higher temporal resolution to address seasonality and temporal variability of the plastic transport.
THE CONCEPTUAL FRAMEWORK, AND HOW IT IS DIFFERENT FROM PREVIOUS STUDIES
The journey of plastic towards the ocean may be a chaotic, non-linear one, with repeated cycles of stranding and remobilization along rivers. To forecast this path, we must consider many factors. In this study, we sought to simulate the plastic journey, from the location where it is (inadequately) disposed of as litter, to the river it feeds into, and finally, how it ends up in the ocean. Previous studies have estimated these riverine outputs but, with the availability of new data and fieldwork and the inclusion of new parameters, we have been able to develop an improved model for this plastic journey.
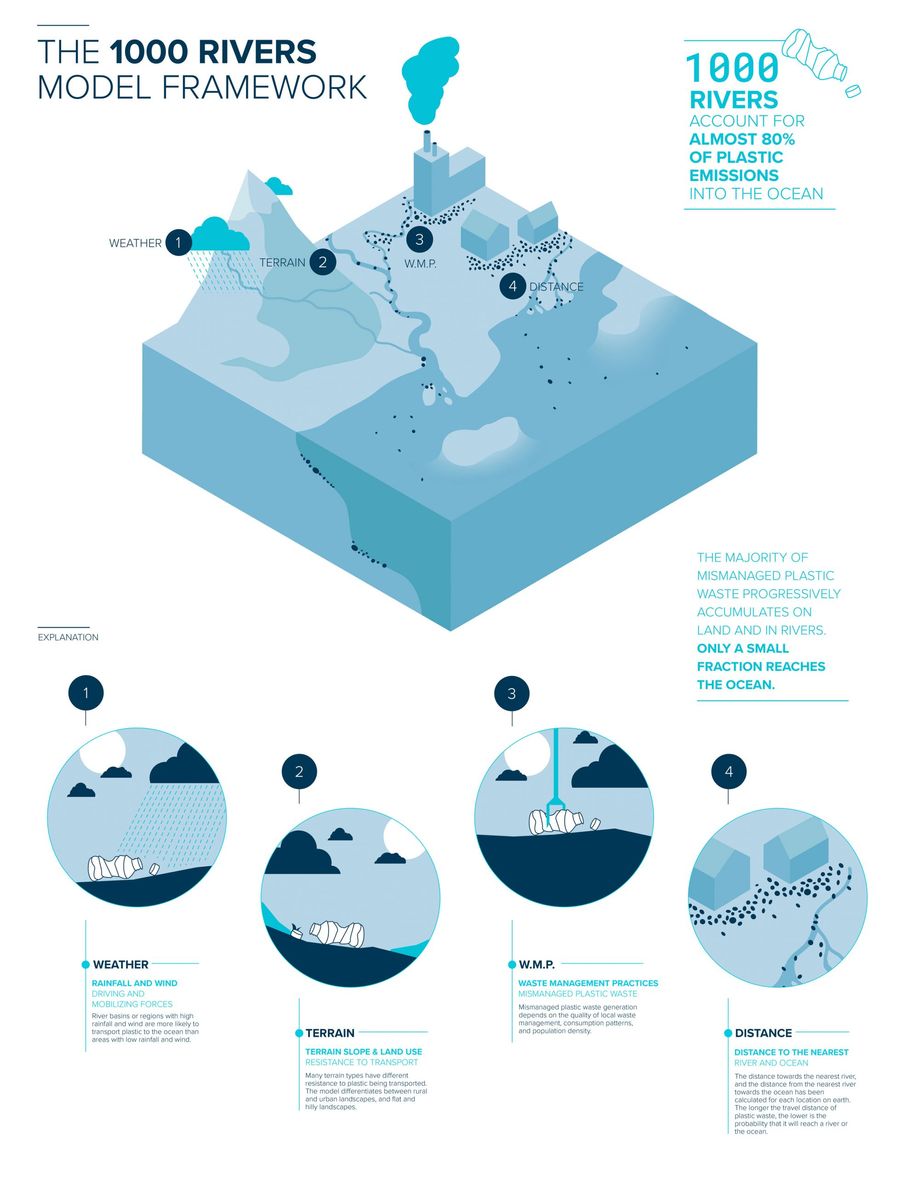
To update this model, we considered that the mobilization forces for plastic litter were rainfall, wind, and anthropogenic drivers . The latter was included in the mismanaged plastic waste distribution dataset, which was calculated into the model. Therefore, we included rainfall and wind as additional driving forces. These two new parameters made the results more robust as it would differentiate between river basins with varying climates.
The terrain characteristics over which plastic needs to be transported play an important role in the plastic journey as well. Paved urban areas with drainage channels move plastic with less effort than densely vegetated areas and gravitational transport downhill allows for easier transport of plastic waste. We, therefore, included land use and terrain slope to differentiate between different landscapes. In addition, we considered the size of the river, and the size of the downstream trajectory of the river, as larger rivers tend to facilitate plastic transport more than smaller, shallower rivers. Furthermore, we incorporated the location of mismanaged plastic generation in relation to the nearest river and the distance that plastic would need to travel downstream from its entry point to the ocean at the river mouth.
Supported by analogies in literature , expert elicitation, and calibration, we approximated the probability for plastic to travel 1 km through a certain landscape or downstream in a river. As a result, we found that the likelihood for waste to reach a river decreases with a greater distance to the river. Plastic that enters a river far upstream is less likely to reach the river mouth and the ocean, and vice versa. When combining all probabilities, areas with high rainfall and wind rates, paved surfaces, and urban landscapes situated near rivers and coasts have relatively high emission probabilities. Areas far inland with little driving force and rural landscapes have lower chances. With this understanding, we must consider how much plastic waste is generated in a river basin, where, and what conditions transported it within the river basin. This approach builds upon but refines previous methods, where the sum of mismanaged plastic waste produced in a river basin was the primary driver for riverine plastic waste emissions.
WHY SOME COUNTRIES AND RIVERS ARE MORE LIKELY TO EMIT PLASTIC INTO THE OCEAN THAN OTHERS
All plastic emissions from the rivers within a country can be explained by looking at the region’s cumulative mismanaged plastic waste production and the average probability of it reaching the ocean. It is worth noting that mismanaged plastic waste generation and plastic consumption are not the same things. There are countries with relatively high plastic use rates and suitable waste management practices, and therefore their amounts of mismanaged trash can be lower. If a land-locked or continental country produces large quantities of mismanaged plastic waste, the likelihood of the debris reaching the ocean is low. On the other hand, if an island-nation generates little or moderate amounts of mismanaged plastic waste, it is more likely to reach the ocean.
For example, the total mismanaged plastic waste generated in the Philippines is an order of magnitude lower than China; yet the amount of plastic that is emitted into the ocean is higher. The chances that plastic will reach the ocean in the Philippines is greater in China, so the fraction of mismanaged plastic waste that enters the ocean is higher in the Philippines. This all has to do with the geography (distance to the nearest river/ocean and size of the river), the population density, and the climate of the archipelago (rainfall rates). Essentially, if a significant fraction of plastic waste is produced near rivers and coasts, it is more likely to reach the ocean compared to continental or land-locked countries.
The top five plastic emitting countries are all located in Asia (the Philippines, India, Malaysia, China, and Indonesia), which is the continent that contributes most riverine plastic with 79.7% of emissions. Interestingly, Asia accounts for approximately 60% of the global population, with archipelagos like Indonesia, the Philippines, and Malaysia being the countries with higher probabilities to emit plastic into the ocean. These countries have very long coastlines compared to their landmass and high rainfall rates, resulting in a significant fraction of the population living near rivers and coastlines.
GLOBAL ACTION WITH A RANGE OF SOLUTIONS IS REQUIRED
These 1000 most-polluting rivers have varying characteristics and are spread across our planet. Some of them are renowned for their immense sizes, such as the Amazon and the Congo; however, the larger fraction of contributing rivers are small and medium-sized rivers. The high number and geographical spread of these rivers require countries, governments, and organizations to take action. At the same time, the variability in river types should involve a wide range of technologies and initiatives to prevent plastic from entering rivers and oceans.
The Ocean Cleanup’s Interceptor solutions can extract substantial amounts of waste from rivers and be deployed in several waterway types. However, these results suggest there is no one-size-fits-all solution; rather a combination of measures is needed to reduce plastic emissions. Stopping plastics at the river mouth with log booms and barriers could complement riverbank cleanups that include active plastic skimming and other measures such as trash racks and nets. Therefore, The Ocean Cleanup is adopting other technologies to add to the Interceptor range of solutions to extract plastic waste from rivers based on their specific characteristics.
While it is encouraging to see that the number of groups and individuals targeting marine plastic has been rapidly growing since 2003, our results suggest that only 1.5% of mismanaged plastic waste reaches the ocean, while the other 98.5% progressively accumulates and pollutes inland (aquatic) ecosystems. Therefore, land-based solutions such as improved regulatory frameworks, sustainable product design, circular consumption patterns, and more advanced waste management are essential to help target plastic pollution at the source.