The importance of groundwater for riverine fish faunas in a region of shale gas development in northern Australia
 Jenny Davis1*
  Erica A. Garcia1
  Karen S. Gibb1
  Mark J. Kennard2
  Alea Rose1
  Nicola Stromsoe1
  Dion Wedd1
- 1Research Institute for Environment and Livelihoods, College of Engineering, IT and Environment, Charles Darwin University, Casuarina, NT, Australia
- 2Australian Rivers Institute, Griffith University, Nathan, QLD, Australia
Northern Australia contains the continent’s largest number of intact river systems, but these are facing increasing pressure as the proposed development of multiple and large-scale industries, including onshore gas, mining, horticulture, and agriculture, accelerates. These developments will require the diversion or extraction of large amounts of water and increase the risk of contamination by industrial and agricultural chemicals. There is an urgent need to collect baseline biophysical information on these aquatic systems before major developments proceed. Much community concern has been expressed about the potential environmental impacts of a developing shale gas industry (fracking) in the Beetaloo Sub-basin and upper Roper River region of the Northern Territory. Here we describe the first major survey of the freshwater fish fauna of this region and an assessment of the importance of groundwater in supporting fish biodiversity. This region is remote from major human settlements and the waterbodies are often difficult to access. Accordingly, we maximised the information we collected from limited sampling sessions by using both traditional fish survey methods (netting and electrofishing) and eDNA analysis of water and benthic sediment samples. Water column eDNA doubled the number of species recorded to those obtained from traditional survey methods alone. We found that the fish fauna was richest at sites on northward-flowing groundwater-dependent rivers. More work is needed to fully understand the dependence of individual species on groundwater inflows. However, it is evident that conserving freshwater fish biodiversity in these rivers will require protection of the groundwater resources to ensure baseflows and aquatic refuges persist through the most extended of dry seasons.
1 Introduction
The rivers of northern Australia are known for their important environmental, recreational and Indigenous cultural values (Pusey, 2011; Jackson et al., 2014). The remoteness of the region from the more densely populated eastern and southern coastal areas of Australia means that freshwater systems are largely undisturbed, and most are in good condition. However, despite the low population density and the lack of major infrastructure (such as transport systems) the momentum for economic development within this region is building. A recent Commonwealth government report (Department of Prime Minister and Cabinet, 2015) provided a long-term vision for sustainable economic development across the north. The report highlighted the importance of water availability for key industries, including agriculture, aquaculture, mining, energy, and tourism, but also noted the substantial knowledge gaps that exist around northern Australian surface water and groundwater systems.
Northern Australia is characterised by gradients in rainfall, temperatures and evapotranspiration from the tropical coastal areas to the arid interior, with an annual water deficit across the entire region (Pusey, 2011). Much community concern has arisen over the potentially negative environmental impacts of the emerging shale gas industry in the Beetaloo Sub-basin, a region covering approximately 30,000 km2, located 500 + km south of Darwin, the capital of the Northern Territory (NT). The land use in the area is primarily cattle grazing on native pasture. Although the impacts of stock on waterways are evident, including damage to riparian vegetation from stock accessing water points, trampling causing bank erosion and cattle defaecating in waterholes causing eutrophication, major land clearing, and the environmental impacts associated with land clearing, have not occurred. No petroleum resource development has previously occurred here, so the Beetaloo Sub-basin shale gas field is a greenfield site (Huddlestone-Holmes et al., 2020). To address community concerns, the Northern Territory (NT) government commissioned a scientific enquiry into hydraulic fracturing (fracking) activities in the region (Pepper et al., 2018). This enquiry further highlighted the lack of knowledge of the aquatic ecology and biodiversity of the region’s water resources and recommended that baseline environmental surveys be undertaken to address this major knowledge gap.
Here we describe the findings of the first major survey of the freshwater fish fauna in waterbodies in the Beetaloo Sub-basin and upper Roper River regions, where environmental impacts associated with the emerging shale gas industry may occur. Given that groundwater accounts for 90% of the water used for domestic, agricultural and industrial purposes within the NT (Pepper et al., 2018) and the perceived unacceptably high risk of groundwater contamination that fracking poses, we sought to consider the likely importance of groundwater inflows in supporting freshwater fish communities within this region. Recognising the recently identified importance of groundwater in supporting baseflows in the upper Roper River (see Lamontagne et al., 2021), and the rainfall gradient that extends across the Beetaloo Sub-basin from the higher rainfall northern region to the semi-arid south, we predicted that the richest fish fauna would be present in the northernmost waterbodies. This difference in diversity would also be influenced by the connectivity between freshwater and coastal systems in the northward flowing rivers compared to the lack of marine influence on the internally draining southward flowing systems.
2 Materials and methods
2.1 The study area
The Geological and Bioregional Assessments (GBA) program was an Australian government initiative to provide independent advice on the potential environmental impacts of onshore gas development. The Beetaloo Sub-basin was the focus of the GBA program in the NT. The Sub-basin contains significant shale and tight gas reserves and is subject to much exploration activity. The focus of this study was the Beetaloo Extended Survey Area (BESA) (Figure 1) as represented by Huddlestone-Holmes et al. (2020). The BESA extends the Beetaloo GBA region to ensure that potential environmental and hydrological impacts from hydraulic fracturing are investigated in the areas adjacent to the gas extraction region. The BESA spans a north-south climatic gradient from tropical savanna in the north to hot, semi-arid landscapes in the south. The monsoon-influenced rainfall gradient results in a wet season (when most of the rain falls) from November to March, and a dry season, from April to October. Interannual variability in rainfall in this region is high and increases with latitude.
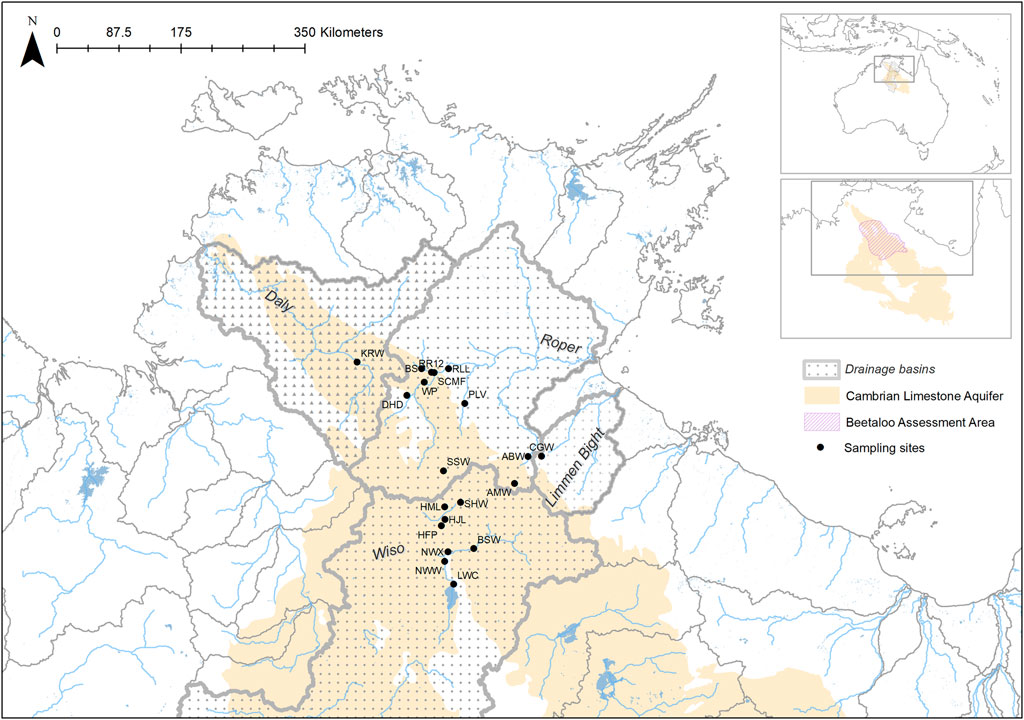
FIGURE 1. The location of sampling sites, drainage basins, underlying aquifers and the Beetaloo Extended Survey Area (BESA) in northern Australia.
The Cambrian Limestone Aquifer (CLA) is the major groundwater resource within the region, with typical electrical conductivity (EC) < 1.5 ms/cm providing freshwater suitable for domestic, cultural, agricultural and industrial uses. The hydrogeology of the CLA is complex, with distinct geological basins (the Wiso, Daly and Georgina), extensive karst features, partial confinement, and the potential for vertical hydraulic connectivity with underlying geological units (Lamontagne et al., 2021). The regional groundwater flow in the BESA is from the south to the north-west into the Daly Basin, discharging at springs in the upper Roper and Daly Rivers. Groundwater flow on local scales is poorly defined, although recent studies have indicated that local recharge is important (Lamontagne et al., 2021). Two nationally important wetlands, Mataranka Thermal Pools and Lake Woods, occur within the BESA. The former show evidence of groundwater connectivity, and the latter surface water connectivity, to areas likely to be subject to hydraulic fracturing (Huddlestone-Holmes et al., 2020).
2.2 Selection of sampling sites
Aquatic sampling sites were chosen using remotely sensed datasets because of the lack of prior knowledge of BESA surface water systems, and their biodiversity, and the prevailing dry conditions caused by poor wet seasons in the 2 years (2018 and 2019) preceding this study. These datasets included: i) the DD7 Water Body Count based on Landsat 5 and 7 imagery from 1987 to 2014; ii) Water Observations from Space based on Landsat 5 and 7 imagery from 1987 to 2012; and iii) Maximum Extent Water Bodies based on Landsat 5 and 8 imagery acquired from 1987 to 2018. Datasets were sourced from the Commonwealth of Australia (Geoscience Australia) and used under Creative Commons Attribution 4.0 Public Licensing. The locations of the sites chosen for sampling are indicated in Figure 1 and their coordinates, site codes and other characteristics are provided in Table 1.
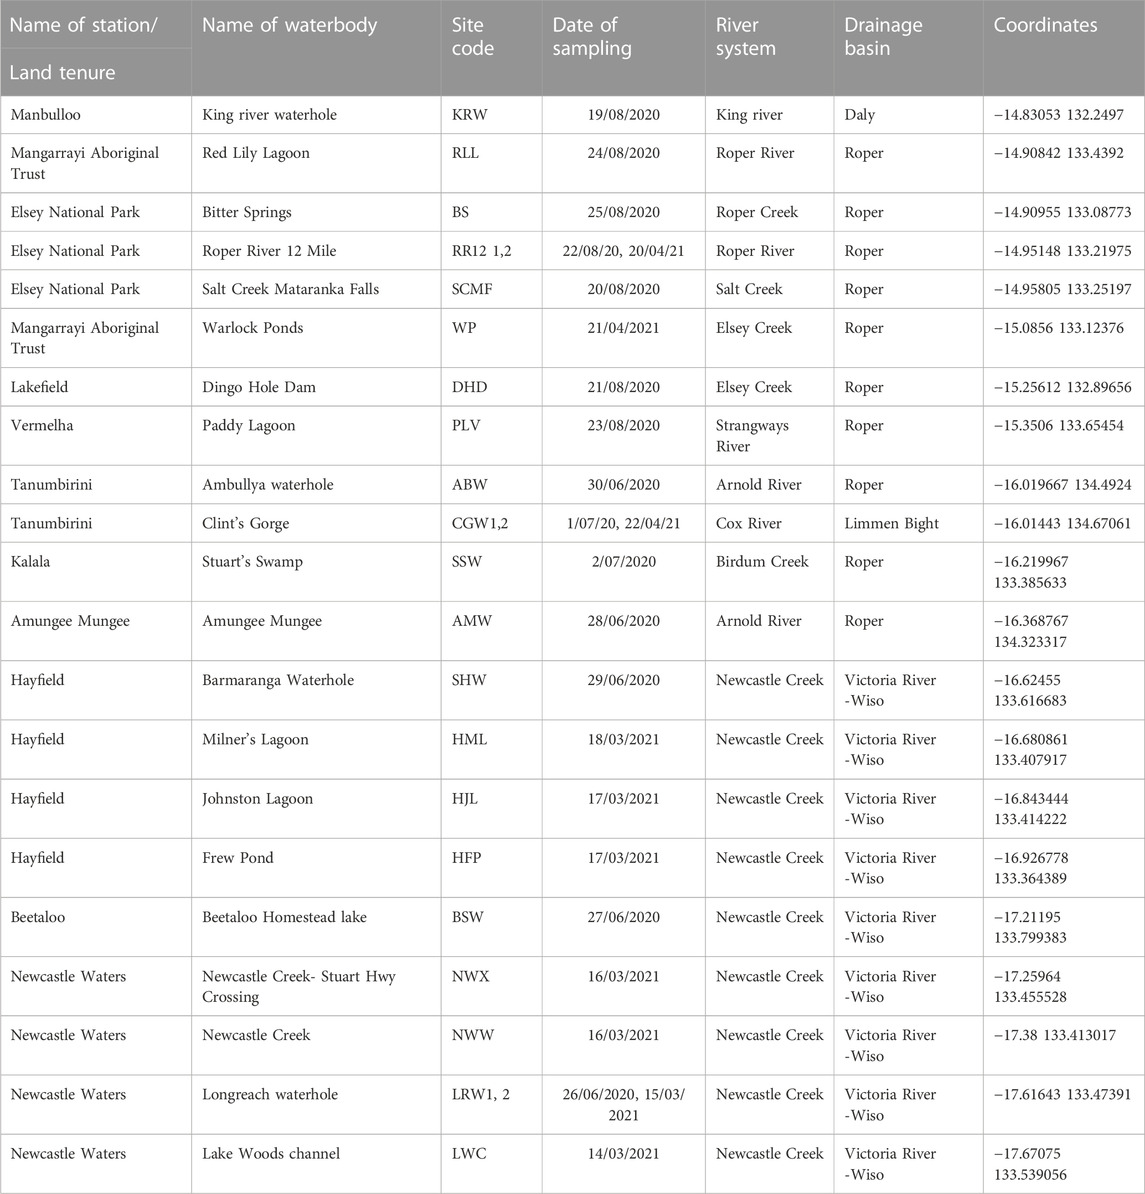
TABLE 1. Surface waterbodies sampled in the BESA in 2020 and 2021. Sites are listed in geographical order from north to south.
Sites in the northern BESA were located on rivers with a Class 3 riverine flow regime, defined by Kennard et al. (2010) as exhibiting a stable, summer baseflow. Substantial groundwater inputs from the CLA maintain the summer baseflow and ensure perenniality (Pusey, 2011). Sites in the southern BESA were located on stream networks with a Class 12 flow regime, defined by Kennard et al. (2010) as exhibiting extremely intermittent, variable summer flows. These systems, that rarely flow, are fed by highly variable rainfall events, with the exception of some sites, e.g., Milner’s Lagoon (HML) which receives groundwater for stock watering from an adjacent borehole.
2.3 Water quality
At each site, we made triplicate water-quality measurements (water temperature, pH, conductivity, and dissolved O2 concentration) at approximately 0.2 m below the water surface using a Hydrolab Quanta multiprobe (Hach Corp., Loveland, Colorado). We measured turbidity (NTU) using a Hach Turbidimeter. One unfiltered water sample (50 mL) per site was collected for analysis of NOx (Nitrite + Nitrate as N), TN (Total Nitrogen), TKN (Total Kjeldahl Nitrogen), TP (Total Phosphorus). All nutrient analyses were performed by ALS Environmental. Triplicate phytoplankton samples (1 L) for the analysis of chlorophyll a were filtered in the field through a 0.45 mm membrane. Triplicate periphyton samples were collected from benthic sediments and submerged wood using a periphyton sampler (Davies & Gee, 1993). All chlorophyll a filter papers were stored frozen until they were analysed in the laboratory using the non-acidification technique for acetone extracted chlorophyll with a Trilogy® laboratory fluorometer (Turner Designs, Sunnyvale, California; Welschmeyer, (1994)).
2.4 Freshwater fishes
Freshwater fishes were sampled in June and August 2020, and March 2021, at the 21 sites listed in Table 1. All sites were only sampled once, except the upper Roper River (RR12) and the Cox River (CGW), in the northern BESA, and Longreach Waterhole (LRW), in the southern BESA. These were sampled in both years to provide preliminary observations on interannual variability.
Fishes were sampled using a range of capture and detection methods, including electrofishing, seine netting, cast netting, gill netting and environmental DNA (eDNA). Substantial variation in environmental characteristics among sites meant that a standard sampling approach was impossible; for example, sites with high turbidity could not be electrofished because individuals captured in the electrical field could not be visually detected, or areas with highly complex habitat, such as rock bars or woody debris, prevented the use of mesh nets. Fish captured by netting or electrofishing were identified and then returned to the waterbody alive.
2.4.1 Netting
2.4.1.1 Seine netting
We used standard monofilament seine net (20 m length, 2 m drop, 11 mm stretched mesh) with a buoyant float line on the top, and a weighted lead line on the bottom was used at turbid sites where the water was shallow enough for two people to safely wade. After being towed a set distance, the net was pulled to the shore, effectively trapping everything caught in the net.
2.4.1.2 Cast netting
We used a circular net of 2.1 m radius with the outer rim weighted and sewn into pockets. The net was “cast” by a highly experienced operator using a technique that causes the net to open to a full circle (∼4.2 m in diameter) as it lands on the water’s surface. As the net sinks, it closes, and fish are either caught in the mesh or the pockets.
2.4.1.3 Gill netting
We used a 25 m long, 3 m drop, multi-panel mono-filament gill net with a variety of mesh sizes (50–90 mm). The net was set 1 hour before sunset and was removed 1 hour after sunset. The net was cleared of fish when it became evident through the motion of the float line that fish were present. The net was set parallel or perpendicular to the bank depending on the amount of woody structure present.
2.4.2 Electrofishing
Electrofishing uses pulse Direct Current (DC) to generate an electric field between a cathode (−) and anode (+). Its efficacy is dictated primarily by the electrical conductivity of the water body being sampled. When fish are caught parallel to the direction of the electron flow, they are temporarily immobilized and come to the surface where they can be collected. We used a 24 V Smith-Root LR20B back-pack electrofishing unit with a standard 400 mm anode ring and braided cable rat tail for a cathode. The battery used was a custom built 24V, 23 AH lithium battery (Lithium Batteries Australia, Sydney NSW). Pulse width was standardized at 45 Hz and duty cycle at 30%, voltage varied according to the ambient EC of the receiving waterbody. Each site was sampled for 1,000 s “on-time” recorded on the timer incorporated into the LR20B back-pack electrofisher. Sampling at each site was carried out to incorporate a proportion of the “on-time” per habitat type present.
2.5 eDNA
2.5.1 Water column eDNA
We used an extendable bottle holder to collect water column samples at an average of 0.4 m depth. We filtered the water on site with a battery-driven peristaltic pump (GeoPump, Thermofisher, Australia), a filter manifold (Sartorius, Australia) with 250-mL Biosart plastic funnels (Sartorius, Australia) and sterile 0.45 micron cellulose nitrate filters. We filtered an average of 1 L at each site.
eDNA was extracted from filter papers as described by Day et al. (2019) using a Qiagen DNeasy Blood & Tissue Kit (Qiagen). Briefly, filter papers were snap frozen in liquid nitrogen and pulverised to 2–3 mm fragments. To ensure DNA from the entire filter paper was extracted, the Proteinase K, ethanol and Buffers AL and ATL were tripled in volume during the extraction process. For quality control, triplicate “blank samples” (filters that had filtered sterile water) were extracted alongside the eDNA samples and negative controls, then included in downstream PCR and sequencing.
2.5.2 Sediment eDNA
We collected benthic sediments for eDNA analysis at two sites (Red Lily Lagoon and Roper River 12 Mile). The top 2–5 cm s of sediment was collected using plastic pipe and stored in the fridge prior to analysis. Two sediment samples were analysed for eDNA from each site. In the lab, each sample was subsampled five times, resulting in a total of 10 sediment samples being analysed per site. Each sediment subsample weighed between 6, 7 g. DNA was extracted from the sediment using the Qiagen DNeasy PowerMax Soil Kit (Qiagen) following the manufacturer’s instructions. In addition, extracted DNA was precipitated overnight to purify and reduce the final eluted volume to 110 uL. DNA was precipitated by adding 500 uL of 3 M Sodium Acetate and 13.5 mL of molecular-grade 100% ethanol, vortexed and left to incubate overnight. Samples were then centrifuged at 4,000 rpm for 30 min and supernatant poured off. Tubes containing the DNA pellet were left to air dry upside-down for 6 h before the pellet was resuspended by adding 110 uL of 10 mM Tris and incubating at 60°C for 20 min.
2.5.3 eDNA amplification and sequencing
Purified eDNA from each sample were diluted with 10 mM Tris to 10 ng/uL then 2.5 uL of eNDA was amplified by PCR using the Mifish-U Forward GTCGGTAAAACTCGTGCCAGC and Reverse CATAGTGGGGTATCTAATCCCAGTTTG primers (Miya et al., 2015). The Bylemans et al. (2018) PCR conditions were used to yield a 219 bp product size. Briefly, PCR conditions were 5 min at 95 C, followed by 45 cycles of 30 s at 95 C, 30 s at 61.5 C, 60 s at 72 C followed by 10 min at 72 C. PCR product quality was determined by gel electrophoresis using 2 uL of product and PCR products were subjected to 2 × 250 bp MiSeq sequencing (Ramaciotti Centre for Genomics (UNSW Sydney, NSW).
Sequences were subjected to quality control, trimmed, assembled cleaned, and species assigned by uploading the raw eDNA sequence data (fastq.gz files) to the MiFish pipeline (http://mitofish.aori.u-tokyo.ac.jp/mifish/) using the default settings (Sato et al., 2018). To target Australian taxa, curated sequences were blasted in NCBI using BLASTN, and search results restricted to Australia. The results were then verified against a list of known species in the region from the Atlas of Living Australia (2020) and Pusey et al. (2017).
2.6 Statistical analyses
We used principal component analysis (PCA) in order to identify major sources of variation in water quality variables across all the sites where full water quality data was available (20 of 21 sites) from four drainage basins. Prior to analysis, all water quality data (except pH) were log(x + 1) transformed. To visualize fish assemblage differences across 17 sites (fish were absent from four of the 21sites) grouped by drainage basins, we used Non-Metric Multidimensional scaling (NMDS) based on Bray-Curtis similarity of fish presence/absence data. Water quality variable trajectory overlays with a Spearman’s correlation >0.2 were also plotted on the NMDS ordination. One-way analysis of similarity (ANOSIM) on a Bray-Curtis similarity matrix (999 permutations) ultivariate analyses were conducted in PRIMER v.7.0 (Clarke and Gorley, 2015).
3 Results
3.1 Environmental characteristics of sampling sites
Rainfall in the 12 months preceding the first sampling session was low at the northernmost sites, with 459 mm recorded in 2020, but higher, at 1,300 mm, in 2021 (data from the BOM Tindal RAAF station). In contrast, rainfall in the southern region was consistently low with 374 mm recorded in 2020 and 364 mm in 2021 (data from the BOM Tennant Creek station). Although all sites were located within stream networks, flowing water was present at only four sites (BS, RR12, SCMF, and CGW) at the time of sampling. All remaining sites were present as pools (standing waterbodies) within dry river channels or a lakebed (DHD).
All sites were classified as freshwaters (EC < 1.5 m/cm) except SCMF (EC = 3.56 ms/cm) (Table 2). Sites ranged in pH from slightly below neutral to alkaline. The highest pH (10.37) was recorded at a site (SHW) where visual inspection revealed the presence of a cyanobacterial bloom. High to extremely high turbidities (>50 NTU) were recorded at some waterbodies, mainly in the western and southern BESA (Table 2). Some sites were highly turbid due to the suspension of fine particles from clay-dominated sediments whilst others were dominated by algal blooms as indicated by the high concentrations of phytoplankton (>30 μg/L chla) (Table 3).
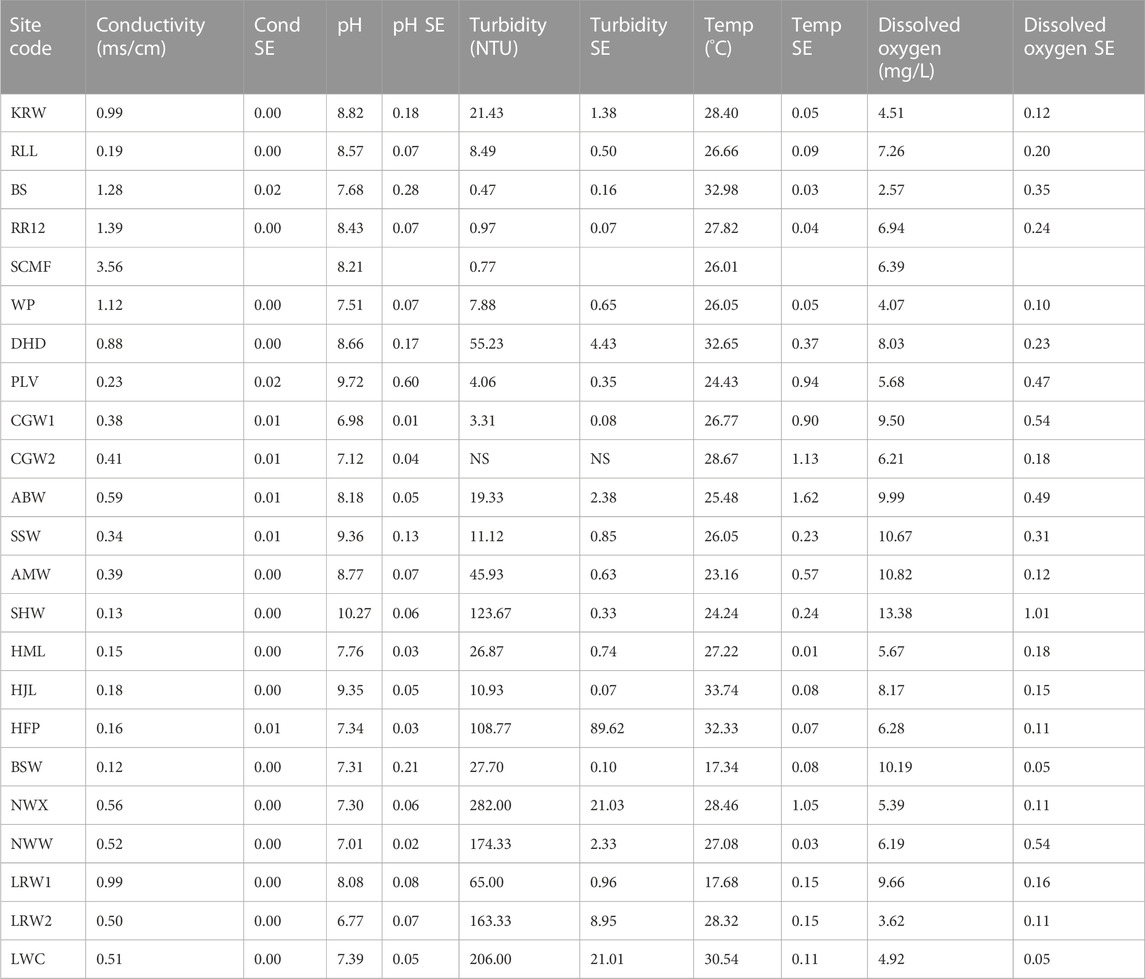
TABLE 2. Water quality variables recorded at surface waterbodies sampled in the BESA in 2020 and 2021. Values are the mean of three replicates except for SCMF where only 1 reading was recorded (SE = standard error).
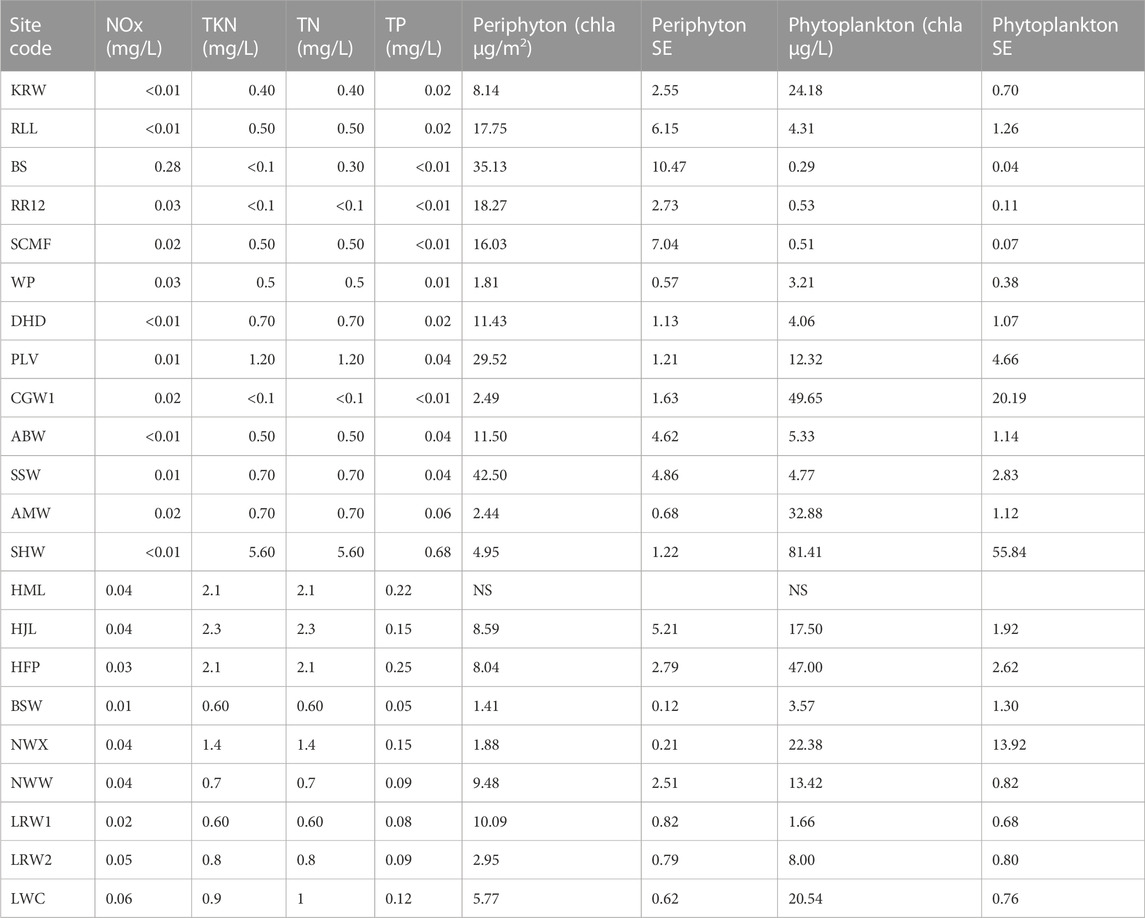
TABLE 3. Nutrient, periphyton and phytoplankton concentrations recorded at surface waterbodies sampled in the BESA in 2020 and 2021. Nutrient values are from one sample per site. Periphyton and phytoplankton values are the mean of three replicates (SE = standard error). NS = not sampled.
Northern sites tended to contain clear water with low concentrations of phytoplankton, but high concentrations of periphyton (periphyton >15 μg/L) (Table 3). Nutrient concentrations at all sites were low, however, in some cases it was likely that nutrients had been incorporated into aquatic plant biomass (Table 3). The PCA including 10 water quality variables explained 86.9% of the data variability along the first two axes (axis 1 = 52.7%, axis 2 = 34.2% of the total variance). Axis 1 was positively correlated with pH and periphyton, but negatively correlated with turbidity. Axis 2 was negatively correlated with turbidity and phytoplankton (Figure 2).
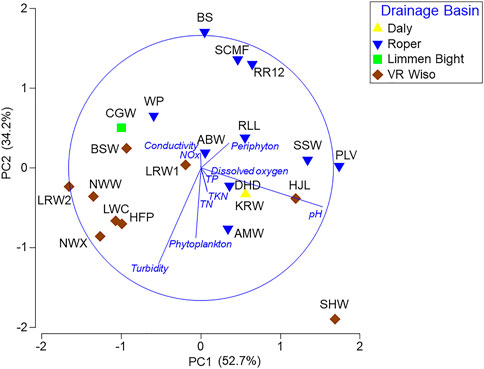
FIGURE 2. Principal components analysis (PCA) scatterplot based on water quality variables at 20 Beetaloo wetland sites across 4 drainage basins. Nutrient abbreviations are described in Section 2.3.
3.2 Freshwater fish diversity
Twenty-nine species of fish, in 17 families, were recorded at BESA waterbodies (Table 4; Supplementary Table S1). Species richness was highest at groundwater-fed sites on northward-draining rivers. More species were detected using water column eDNA, compared with the live capture methods (netting and electrofishing), at all the waterbodies (13) where both methods were used (maximum of 8 vs. 3 species). Inter-annual variability in species richness, as determined at the three sites that were sampled in both 2020 and 2021, was low. Thirteen species were recorded at RR12 in both years; 12 species were recorded at CGW in 2020 and 13 in 2022; and three species were recorded at LRW in 2020 and five in 2021. The most commonly detected species were the rainbowfish, Melanotaenia splendida (recorded at 17 sites) and the spangled perch, Leiopotherapon unicolor (recorded at 16 sites).
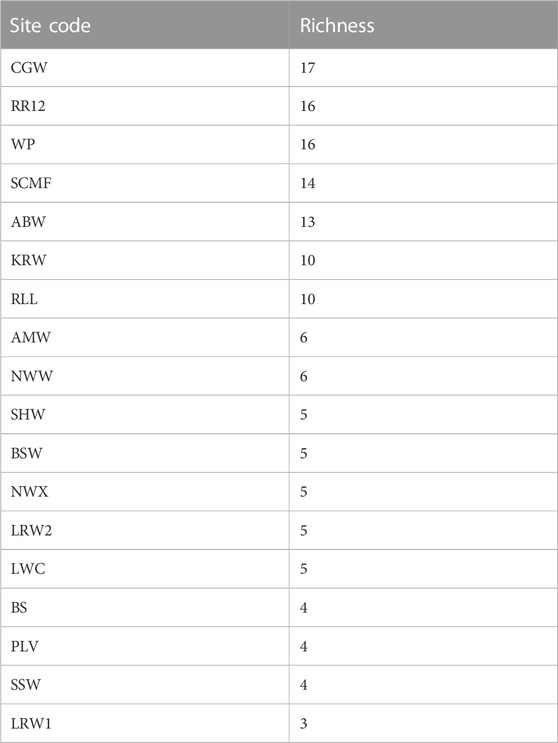
TABLE 4. Fish species richness across the sites listed from highest to lowest.
The NMDS showed separation between the 17 sites grouped by drainage basin and this was supported by the pairwise ANOSIM test between the Roper and Victoria River-Wiso drainage basins R = 0.41, p < 0.009, which were the two basins where multiple sites were sampled (Figure 3).
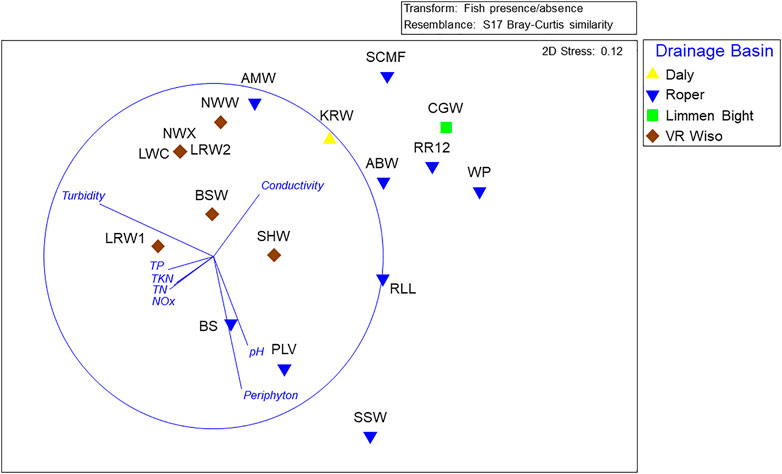
FIGURE 3. Non-metric Multidimensional scaling (NMDS) ordination of fish assemblages found at 17 Beetaloo wetland sites across 4 drainage basins with an overlay of water quality vectors (with a Pearson’s correlation >0.2) indicating the direction of the correlation. Nutrient abbreviations are described in Section 2.3.
For water column eDNA a total of 260 sequences were attributed to fish species in the MiFish database. Of these, 120 sequences were directly attributed by Mifish to species known to be present in the region. The remaining sequences (140) were attributed to species related at either the family (83 sequences) or genus (57 sequences) level to species known to be present in the region and were later matched to known species. Almost all (243 out of 260) sequences detected in the MiFish database were ultimately able to be verified as species known to inhabit the region.
For sites where both water column and benthic sediments eDNA were analysed, species detections using eDNA differed between habitats and sites. At the standing water (lentic) site (RLL), all except one of the species detected with eDNA in the water column were also detected with eDNA in sediment. At the running water (lotic) site (RR12) only one of the 10 species detected in the water column was also detected in the sediments (Supplementary Table S2).
4 Discussion
The number and identity of fish species recorded within the drainage basins sampled in our study agrees with the information provided for corresponding biogeographic regions by previous studies (Unmack, 2001; Pusey et al., 2017). The total of 29 species recorded in the northward coastal-draining basins (Daly, Roper and Limmen Bight) lies almost midway between the 37 species given for the Daly River region and 25 for the Western Gulf of Carpentaria region (Unmack, 2001). The total of eight species recorded in the Victoria River-Wiso Basin is close to the nine species recorded in the Barkly Tablelands region (Unmack, 2001). Although we attempted to maximize the number of species detected at each site by using multiple methods, we are aware that species richness will likely increase at northern sites following an extended sampling program including day/night sampling and encompassing seasonal variability.
Our results support the suggestion (Unmack, 2001) that species in northern Australia river systems tend to be widespread, and, correspondingly, the level of species endemism is low. All species that were found at only one site have previously been recorded from other northern rivers (Pusey et al., 2017; Atlas of Living Australia, 2020). The low level of endemism in many northern Australian rivers has been attributed to high drainage connectivity during a period of lowered sea level preventing the isolation needed for local speciation to occur (Unmack, 2001).
Multiple studies have confirmed the importance of regional groundwater discharging from the Cambrian Limestone Aquifer, (CLA) particularly the Tindall Limestone, in maintaining baseflow in the upper Roper River (Deslandes et al., 2019; Evans et al., 2020; Lamontagne et al., 2021; Bruwer and Tickell, 2015). Groundwater inputs are critical for aquatic connectivity in the perennially flowing upper Roper River system and also support the persistence of waterbodies on seasonally flowing tributaries, such as Warlock Ponds and Salt Creek. The importance of groundwater for the fish fauna of this area is demonstrated by the high species richness recorded at RR12, WP and SCMF (Table 4). The ordination (Figure 3) revealed that these sites also supported fish faunas with similar community composition. The fish assemblages in the VR Wiso and those in the southern parts of the Roper basin have the lowest richness potentially related to the lower rainfall gradient, lack of groundwater inputs and little or no connection to the sea (Table 4). The high levels of turbidity and thus reduced periphyton biomass at the VR Wiso sites would also be an important factor related to the low fish richness at these sites (Figures 2, 3).
No studies exist to confirm the importance of groundwater discharge at the site containing the highest species richness, CGW, on the northward-flowing Cox River in the Limmen Bight basin. However, multiple springs were observed directly discharging into the Cox River at the time of sampling. The source aquifer for these springs is not known, indicating that this is an important area for further hydrogeological study (Evans et al., 2020).
A major exception to our conclusion that groundwater is important in maintaining species richness in the northern BESA occurred at Bitter Springs (BS). Only four species, M. splendida, L. unicolor, G. aprion and M. mogurnda, were recorded at this site. The former two species were the most frequently recorded species in our study, occurring at 17 and 16 sites respectively. This suggests that they are species that are tolerant of a wide range of environmental conditions. Field observations indicated that groundwater was continually discharging to the surface at this site. The depauperate fish fauna is most likely explained by the very low concentration of dissolved oxygen (DO) present (Table 2) resulting from the direct ingress of anoxic subterranean water into this aquatic habitat.
The freshwater sawfish, Pristis pristis, was not captured in our study, nor could it be detected by eDNA (because it is not included in the MiFish database). However, its presence at RLL (on the Roper River floodplain) was reported to us by the Mangarrayi Rangers, and it was later captured by one of us (Dion Wedd) in further sampling of the upper Roper River at RR12. This species is listed as Critically Endangered on the IUCN Red-List (https://www.iucnredlist.org/species/18584848/58336780) and Vulnerable under the Australian government EPBC Act (http://www.environment.gov.au/cgi-bin/sprat/public/publicspecies.pl?taxon_id=60756). This species is considered to be threatened on a global scale, largely due to habitat loss and overfishing (Kyne et al., 2013). The presence of this species at RR12 indicates that the upper Roper River is an important system for its conservation. The groundwater inflows that maintain freshwater baseflow to the upper Roper River (Lamontagne et al., 2021) play an important role in maintaining the freshwater habitats and the upstream/downstream connectivity that exists within this system. Accordingly, planning for the allocation of water resources within this region needs to take into account the groundwater needed to support the persistence of the freshwater sawfish.
The use of eDNA provides a means of detecting species that may not be detected by physical capture methods such as netting and electrofishing. Fish shed DNA into the surrounding water in a variety of ways, including as excreted cells, tissues, faeces, or microscopic eggs and larvae. A recent marine study described the usefulness of capturing and sequencing the free DNA (eDNA) present in water to determine fish biodiversity (Bessey et al., 2020). A review by Yao et al. (2022) further confirmed that eDNA-based methods provide cost-effective, robust and efficient means of assessing fish biodiversity in diverse aquatic environments. Here water column eDNA, used in conjunction with traditional sampling methods, proved to be invaluable in detecting species that could not be recorded without multiple visits, potentially over several years, to the sampling sites. However, the choice of DNA database also influences what can be detected (Furlan et al., 2020). For example, a key group, the catfish, Ariidae, are not represented in the MiFish database, so only live captures of this group are recorded in our study. In addition, some groups could only be detected at the level of genus.
The choice of sampling media (water or sediment) can also affect eDNA detection. While water is most commonly sampled in eDNA surveys, sediment has been recommended as potentially providing both a more concentrated eDNA and broader temporal record of species presence (e.g., Turner et al., 2015). This is because fish eDNA degrades quickly in freshwater, being detectable from several hours to 14 days after removal of the source (Yao et al., 2022). In contrast, as water column eDNA settles out of suspension it accumulates in the sediments and its degradation is potentially delayed (Turner et al., 2015; Buxton et al., 2017). However, sediment can be more complicated to sample and analyse for eDNA, and can sometimes provide fewer species detections than water samples, a contrast which has been attributed to the smaller volume of sediment that can be easily sampled (e.g., Shaw et al., 2016). Here, sediment eDNA did not provide an advantage over water column eDNA (Supplementary Table S1). Our results indicate that it may be less effective for assessing fish diversity in flowing waters than standing waters, however, a more extensive study is needed to confirm this.
The multiple environmental threats that extraction of natural gas from hard-to-reach reservoirs, such as shale gas, poses to surfaces waters around the world were described by Entrekin et al. (2011). These threats to water resources were re-iterated by Vengosh et al. (2014) and to groundwaters by Jackson et al. (2013) and Shanafield et al. (2019). Potential impacts include sediment runoff and reduced streamflow to streams and rivers near gas wells, and possible contamination of groundwaters from fracking-fluid chemicals and wastewater. In the Beetaloo Sub-basin, the greatest adverse impacts are likely to be from the extraction of groundwater to provide the water needed for drilling and fracking fluids, and the possible contamination of groundwater with fracking chemicals if wells crack or fail. There is still a great deal of uncertainty regarding groundwater flow paths and flow rate in the CLA. Large karstic pathways (including cave systems and subterranean channels) provide high velocity conduits that could transport and disperse contaminates from chemical spills, and other adverse events, if they were to occur (Deslandes et al., 2019; Evans et al., 2020; Lamontagne et al., 2021; Oberprieler et al., 2021). Given this, the groundwater-dependent ecosystems of the northern BESA need to be accurately mapped and characterised, and evidence-based water planning and management is needed to ensure that their freshwater fish fauna and other aquatic biota persists.
Our results from the first major survey of the freshwater fish fauna in this region of northern Australia support our prediction that the richest freshwater fish faunas are generally found at the sites where hydrogeological studies (cited previously) have detected groundwater discharging from the CLA. The number of species recorded in the northern BESA is similar to that recorded in other northward flowing rivers in the Wet/Dry tropics of northern Australia (Pusey, 2011) and highlights the contribution of the Roper River and Limmen Bight basins to Australia’s freshwater fish biodiversity. Further studies are now needed to more fully describe the fish fauna of this region, the factors that influence them, and the connections between aquifers and aquatic habitats. Here we highlight the importance of groundwater in the northern BESA for fish biodiversity, but further research is needed to better understand the groundwater/surface water interactions that support not only the freshwater fish assemblages but all aquatic biodiversity across this region.
Data availability statement
The original contributions presented in the study are included in the article/Supplementary Material, further inquiries can be directed to the corresponding author.
Ethics statement
The animal study was reviewed and approved by the Charles Darwin University Animal Ethics Committee.
Author contributions
Conception and design of the work (JD, EG, MK, and DW). Acquisition, analysis and interpretation of the data (JD, EG, MK, DW, NS, AR, and KG). Drafting the work or revising it critically (JD, E.G, MK, DW, NS, AR, and KG). As such, all authors agree to be accountable for the content of the work.
Funding
This study was funded by the Geological and Bioregional Assessments (GBA) Program of the Department of the Environment and Energy, Commonwealth of Australia.
Acknowledgments
The authors acknowledge the Traditional Owners of the lands upon which the surveys described in this report were undertaken and the assistance of the Mangarrayi Rangers. The NT Parks and Wildlife Commission provided permission to sample aquatic sites within Elsey National Park. The authors also acknowledge the permission and assistance of the owners and managers of the pastoral leases where aquatic surveys were undertaken, these included: Newcastle Waters Station, Beetaloo Station, Amungee Mungee Station, Tanumbirini Station, Hayfield-Shenandoah Station, Kalala Station, Lakefield Station, Manbulloo Station, and Vermelha Station. Roanne Ramsey (CDU) provided financial and project management support. The facilities, equipment and support provided by the Research Institute for Environment and Livelihoods, Charles Darwin University and the Australian Rivers Institute, Griffith University, are also gratefully acknowledged. All field sampling was conducted in accordance with a Charles Darwin University Animal Ethics Permit (#A20011).
Conflict of interest
The authors declare that the research was conducted in the absence of any commercial or financial relationships that could be construed as a potential conflict of interest.
Publisher’s note
All claims expressed in this article are solely those of the authors and do not necessarily represent those of their affiliated organizations, or those of the publisher, the editors and the reviewers. Any product that may be evaluated in this article, or claim that may be made by its manufacturer, is not guaranteed or endorsed by the publisher.
Supplementary material
The Supplementary Material for this article can be found online at: https://www.frontiersin.org/articles/10.3389/fenvs.2023.1106862/full#supplementary-material
References
Atlas of Living Australia (2020). Available at: https://doi.org/10.26197/5e61c1ccc93fb (Accessed March 6, 2020).
Bessey, C., Jarman, S. N., Berry, O., Olsen, Y. S., Bunce, M., Simpson, T., et al. (2020). Maximizing fish detection with eDNA metabarcoding. Environmental DNA 2, 493–504. doi:10.1002/edn3.74
Bruwer, Q., and Tickell, S. J. (2015). Daly basin groundwater resource assessment-North Mataranka to daly waters, department of land resource management, water resources report number 20/2015D. ISBN, 978-1-74350-003-3
Buxton, A. S., Groombridge, J. J., and Griffiths, R. A. (2017). Is the detection of aquatic environmental DNA influenced by substrate type? PLoS ONE 12 (8), e0183371. doi:10.1371/journal.pone.0183371
Bylemans, J., Furlan, E. M., Gleeson, D. M., Hardy, C. M., and Duncan, R. P. (2018). Does size matter? An experimental evaluation of the relative abundance and decay rates of aquatic eDNA. Environ. Sci. Technol. 52, 6408–6416. doi:10.1021/acs.est.8b01071
Davies, A. L., and Gee, J. H. R. (1993). A simple periphyton sampler for algal biomass estimates in streams. Freshw. Biol. 30, 47–51. doi:10.1111/j.1365-2427.1993.tb00787.x
Day, K., Campbell, H., Fisher, A., Gibb, K., Hill, B., Rose, A., et al. (2019). Development and validation of an environmental DNA test for the endangered Gouldian finch. Endanger. Species Res. 40, 171–182. doi:10.3354/esr00987
Department of the Prime Minister and Cabinet (2015). Our north, our future: White paper on developing northern Australia. Canberra, Australia: Department of the Prime Minister and Cabinet.
Deslandes, A., Gerber, C., Lamontagne, S., Wilske, C., and Suckow, A. (2019). Environmental tracers in the Beetaloo basin. Aquifer and groundwater characterization. Australia: CSIRO.
Entrekin, S., Evans-White, M., Johnson, B., and Hagenbuch, E. (2011). Rapid expansion of natural gas development poses a threat to surface waters. Front. Ecol. Environ. 9, 503–511. doi:10.1890/110053
Evans, T. J., Radke, B. M., Martinez, J., Buchanan, S., Cook, S. B., Raiber, M., et al. (2020). Hydrogeology of the Beetaloo GBA region. Technical appendix for geological and bioregional assessment program: Stage 2. Australia: Department of the Environment and Energy, Bureau of Meteorology, CSIRO and Geoscience Australia.
Furlan, E. M., Davis, J. A., and Duncan, R. P. (2020). Identifying error and accurately interpreting eDNA metabarcoding results: A case study to detect vertebrates at arid zone waterholes. Mol. Ecol. Resour. 20 (5), 1259–1276. doi:10.1111/1755-0998.13170
Huddlestone-Holmes, C. R., Frery, E., Wilkes, P., Bailey, A. H. E., Bernadel, G., Brandon, C., et al. (2020). Geological and environmental baseline assessment for the Beetaloo GBA region. Geological and bioregional assessment program: Stage 2. Australia: Department of the Environment and Energy, Bureau of Meteorology, CSIRO and Geoscience Australia.
Jackson, R. E., Gorody, A. W., Mayer, B., Roy, J. W., Ryan, M. C., and Van Stempvoort, D. R. (2013). Groundwater protection and unconventional gas extraction: The critical need for field-based hydrogeological research. Groundwater 51, 488–510. doi:10.1111/gwat.12074
Jackson, S. E., Douglas, M. M., Kennard, M. J., Pusey, B. J., Huddleston, J., Harney, B., et al. (2014). We like to listen to stories about fish”: Integrating indigenous ecological and scientific knowledge to inform environmental flow assessments. Ecol. Soc. 19, 43. doi:10.5751/es-05874-190143
Kennard, M. J., Pusey, B. J., Olden, J. D., Mackay, S. J., Stein, J. L., and Marsh, N. (2010). Classification of natural flow regimes in Australia to support environmental flow management. Freshw. Biol. 55, 171–193. doi:10.1111/j.1365-2427.2009.02307.x
Kyne, P., Carlson, J., and Smith, K. 2013. Pristis pristis (errata version published in 2019). The IUCN RedList of threatened species 2013: e.T18584848A141788242. Available at: https://10.2305/IUCN.UK.2013-1.RLTS.T18584848A18620395.en.
Lamontagne, S., Suckow, A., Gerber, C., Deslandes, A., Wilske, C., and Tickell, S. (2021). Groundwater sources for the Mataranka springs (northern territory, Australia). Sci. Rep. 11, 24288. doi:10.1038/s41598-021-03701-1
Miya, M., Sato, Y., Fukunaga, T., Sado, T., Poulsen, J. Y., Sato, K., et al. (2015). MiFish, a set of universal PCR primers for metabarcoding environmental DNA from fishes: Detection of more than 230 subtropical marine species. R. Soc. Open Sci. 2, 150088. doi:10.1098/rsos.150088
Oberprieler, S., Rees, G. N., Nielsen, D., Shackleton, M., Watson, G., Chandler, L., et al. (2021). Connectivity, not short-range endemism, characterises the groundwater biota of a northern Australian karst system. Sci. Total Environ. 796, 148955. doi:10.1016/j.scitotenv.2021.148955
Pepper, R., Anderson, A., Ashworth, P., Beck, V., Hart, B., Jones, D., et al. (2018). Final report of the scientific inquiry into hydraulic fracturing in the Northern Territory. Available at: https://frackinginquiry.nt.gov.au/inquiry-reports/final-report.
Pusey, B. J., Burrows, D. W., Kennard, M. J., Perna, C. N., Unmack, P. J., Allsop, Q., et al. (2017). Freshwater fishes of northern Australia. Zootaxa 4253, 1–104. doi:10.11646/zootaxa.4253.1.1
Pusey, B. J. (2011). Aquatic biodiversity in northern Australia: Patterns, threats and future. Darwin, Australia: Charles Darwin University Press.
Sato, Y., Miya, M., Fukunaga, T., Sado, T., and Iwasaki, W. (2018). MitoFish and MiFish pipeline: A mitochondrial genome database of fish with an analysis pipeline for environmental DNA metabarcoding. Mol. Biol. Evol. 35, 1553–1555. doi:10.1093/molbev/msy074
Shanafield, M., Cook, P. G., and Simmons, C. T. (2019). Towards quantifying the likelihood of water resource impacts from unconventional gas development. Ground Water 57, 547–561. doi:10.1111/gwat.12825
Shaw, J. L. A., Clarke, L. J., Wedderburn, S. C., Barnes, T. C., Weyrich, L. S., and Cooper, A. (2016). Comparison of environmental DNA metabarcoding and conventional fish survey methods in a river system. Biol. Conserv. 197, 131–138. doi:10.1016/j.biocon.2016.03.010
Turner, C. R., Uy, K. L., and Everhart, R. C. (2015). Fish environmental DNA is more concentrated in aquatic sediments than surface water. Biol. Conserv. 183, 93–102. doi:10.1016/j.biocon.2014.11.017
Unmack, P. J. (2001). Biogeography of Australian freshwater fishes. J. Biogeogr. 28, 1053–1089. doi:10.1046/j.1365-2699.2001.00615.x
Vengosh, A., Jackson, R. B., Warner, N., Darrah, T. H., and Kondash, A. (2014). A critical review of the risks to water resources from unconventional shale gas development and hydraulic fracturing in the United States. Environ. Sci. Technol. 48, 8334–8348. doi:10.1021/es405118y
Welschmeyer, N. A. (1994). Fluorometric analysis of chlorophyll-a in the presence of chlorophyll-b and pheopigments. Limnol. Oceanogr. 39, 1985–1992. doi:10.4319/lo.1994.39.8.1985
Keywords: baseline environmental surveys, groundwater-dependent, aquatic refuges, eDNA, baseflows
Citation: Davis J, Garcia EA, Gibb KS, Kennard MJ, Rose A, Stromsoe N and Wedd D (2023) The importance of groundwater for riverine fish faunas in a region of shale gas development in northern Australia. Front. Environ. Sci. 11:1106862. doi: 10.3389/fenvs.2023.1106862
Received: 24 November 2022; Accepted: 18 April 2023;
Published: 09 May 2023.
Edited by:
Guobin Fu, CSIRO Land and Water, AustraliaReviewed by:
Wynand Malherbe, North-West University, South AfricaRichard George Pearson, James Cook University, Australia
Copyright © 2023 Davis, Garcia, Gibb, Kennard, Rose, Stromsoe and Wedd. This is an open-access article distributed under the terms of the Creative Commons Attribution License (CC BY). The use, distribution or reproduction in other forums is permitted, provided the original author(s) and the copyright owner(s) are credited and that the original publication in this journal is cited, in accordance with accepted academic practice. No use, distribution or reproduction is permitted which does not comply with these terms.
*Correspondence: Jenny Davis, jenny.davis@cdu.edu.au