
Summary
PWBM projects that Social Security’s financial condition is substantially worse than official Social Security Trustees estimates, which don’t factor in how the future growth of debt reduces future growth of the payroll tax base.
Key Points
Since the major Social Security reforms were passed in 1983, Social Security Trustees have slowly reduced their projected Social Security trust fund exhaustion date from at least 2058 to 2034. Yet, Trustees’ estimates don’t incorporate how the nation’s growing debt erodes the size of the future tax base.
Using a model that incorporates future macro-economic forces, PWBM projects that the Social Security trust fund depletes in 2032. More importantly, we project much larger future annual cash-flow shortfalls. Relative to the payroll tax base, we project a cash-flow shortfall in 2032 that is 36 percent larger than the Trustees’ estimate for that year. By 2048, our projected cash-flow shortfall is 77 percent larger.
If Social Security shortfalls continue to contribute to the federal government’s unified deficits, consistent with no changes in taxes or benefits, we project that the federal debt-to-GDP ratio will exceed 200 percent by 2048, a path that is not sustainable.
Social Security’s Worsening Financial Condition
Introduction
Social Security insures the living standards of U.S. workers and their dependents and survivors against wage losses from old age and the onset of disability. The medium and long-term financial condition of Social Security has steadily worsened over time.
Table 1 shows that the Social Security trust fund’s1 projected depletion date, as estimated by Social Security Trustees, has fallen sharply over time. Immediately after the 1983 Social Security reforms, which increased the program’s revenues and reduced projected benefits, resources were projected to be sufficient to pay benefits through at least the following 75 years (1984-2058).2 However, a subsequent faster-than-expected decline in Americans’ mortality and a lower-than-expected fertility rate increased projected Social Security benefits while reducing projected revenues.3
| Calendar Year | Social Security Trustees' Annual Report Year | |||
|---|---|---|---|---|
| 1984** | 2005 | 2010 | 2018 | |
| 1985 | 21 | |||
| 1990 | 54 | |||
| 1995 | 138 | |||
| 2000 | 258 | |||
| 2005 | 390 | 320 | ||
| 2010 | 500 | 394 | 355 | |
| 2015 | 544 | 418 | 335 | |
| 2020 | 530 | 393 | 299 | 256 |
| 2025 | 476 | 332 | 237 | 171 |
| 2030 | 411 | 245 | 154 | 86 |
| 2035 | 343 | 143 | 59 | |
| 2040 | 281 | 31 | ||
| 2045 | 219 | |||
| 2050 | 154 | |||
| 2055 | 84 | |||
| 2060 | 11 | |||
| Projected Trust Fund Depletion Year | None | 2041 | 2038 | 2034 |
* The Social Security (OASDI) Trust Fund Ratio is the value of assets at the beginning of the year divided by annual benefit expenditures during the year.
** The 1984 Trustees annual report showed two sets of intermediate projections with different assumed economic growth. The ratios shown in this column are based on the intermediate alternative with lower assumed economic growth.
Sources: Social Security Trustees’ annual reports (various years) and Social Security Administration.
The Trustees’ projections of Social Security’s long-term finances are constructed under “static” assumptions that do not account for the effects of changing economic conditions on individual decisions to invest and work. Static projections, therefore, assume that economic conditions are expected to remain stable over time.
However, both PWBM and the Congressional Budget Office (CBO) project large increases in national debt during the next decade and beyond. Increased national debt reduces resources available for private investment, thereby reducing the size of the wage base that is used to finance Social Security benefits relative to no additional debt accruals in the future. PWBM projects that growing debt, therefore, shifts the depletion date to 2032, and produces substantially larger shortfalls than the Trustees’ projections.
PWBM’s Projection Method
Projecting the Social Security trust fund depletion date requires examining the inflows into and outflows from the Social Security trust fund that helps fund the Old Age and Survivors Insurance (OASI) and Disability Insurance (DI) programs. Toward this end, PWBM uses the newest version of its Social Security Module to make these estimates on static and dynamic bases.
On the inflow side, we estimate the number and composition of workers and their earnings to generate payroll taxes under present law using the PWBM microsimulation model. This model provides a comprehensive picture of the demographic composition of the population today and projects these changes into the future.4 On the outflow side, PWBM has coded up benefits rules associated with retirees, child and adult (spousal) dependents, widowers, divorced spouses, and disabled beneficiaries.5 The model is then validated using a battery of tests with historical data at both the micro (household) level and aggregate (total benefits and revenues) level.
While these “static” estimates provide a rich level of detail, they do not consider how individual economic decisions respond to changes in future macroeconomic conditions, such as growing debt under current policy. These estimates are obtained using the PWBM dynamic overlapping-generations model. This model recognizes how future taxable payrolls, benefit eligibility, earnings histories, and benefit levels are impacted by growing debt.6
Social Security’s Finances: Static Analysis
A key metric of Social Security’s finances is the Annual Balance Ratio. This ratio is calculated by subtracting annual costs (including all benefit expenditures) from revenues (excluding interest income), and then dividing this difference by annual taxable payrolls.7 Since Social Security gets most of its revenue from payroll taxes,8 projected revenues divided by annual taxable payrolls are generally quite close to the payroll tax rate of 12.4 percent, regardless of the estimation methodology. Most of the differences in estimates of annual balance ratios between PWBM and Trustees, therefore, emerge from differences in projected costs relative to payroll.
Figure 1 reports the Annual Balance Ratio projected by the Social Security Trustees and the Penn-Wharton Budget Model on a static basis. Both sets of projections ignore economic feedback effects. Projected Annual Balance Ratios are negative because Social Security’s expenditures are projected to exceed revenues throughout the timeframe, which reduces the size of the trust fund until it is depleted. While the CBO also makes similar projections, it does not provide projections on a static basis.
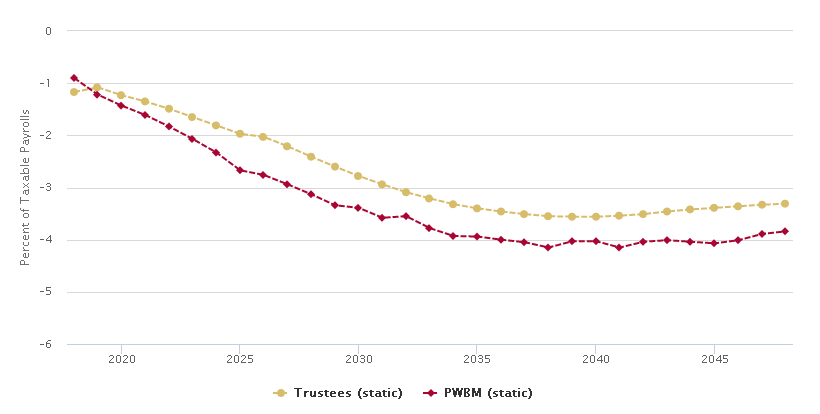
Figure 1 shows that PWBM’s projected Annual Balance Ratio is more negative than the Trustees’ projection during the next two decades. The main reason is that Trustees assume higher economic growth rates during this period, which produces larger growth in the payroll tax base (the denominator in calculating the Annual Balance Ratios). After the next two decades, the two sets of static projections grow at similar rates and even begin to flatten around 2038. The flattening reflects the near completion of the baby boomers’ lifetimes and greater stability thereafter in the proportions of workers (taxpayers) and beneficiaries in the population. However, PWBM’s projection will diverge significantly from the Trustees’ static ones when dynamics are considered in a later section below.
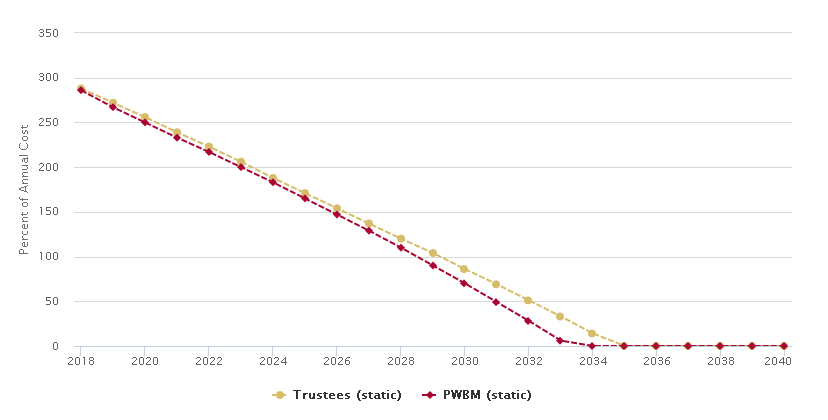
Figure 2 shows the OASDI Trust Fund Ratios, as projected by the Social Security’s Trustees as well as PWBM under static conditions. The Trust Fund Ratio equals the beginning-of-year value of the OASDI trust fund divided by Social Security’s program cost (benefit expenditures) in that year. Notice that projected Trust Fund Ratios decline during the next decade and half, reflecting the negative Annual Balance Ratios reported in Figure 1. The Trustees project a trust fund depletion date – the year when the OASDI trust fund becomes zero – as 2034 whereas the PWBM’s static estimate is 2033.
A Growing Debt Path
Figure 3 shows the debt-to-GDP ratio, as projected by PWBM as well as the Congressional Budget Office. The CBO produces two projections. Its “extended baseline” assumes that current laws will be continued, including sunsets of various tax cuts in the Tax Cuts and Jobs Act (TCJA).9 The CBO’s “alternative policy” projection is consistent with continuing current policies – that is, under extension by Congress of expiring laws beyond their sunset dates. For comparison purposes, we extend their “alternative policy” projection in Figure 3 beyond the CBO’s standard 10-year budget projection window.
Notice that PWBM’s projected debt-to-GDP ratio rises faster through mid-century than the CBO’s projection. Regardless, all three projections show that the debt-to-GDP ratio is expanding rapidly throughout the foreseeable future, as Congress is projected to spend more than it collects in revenue. Both projections indicate that the debt-to-GDP ratio will grow from its current level of 78 percent to about twice that value by mid-century.10

We project that the increase in national debt will slow future growth in capital formation, labor productivity, wages, and the payroll tax base.11 A smaller payroll tax base, in turn, worsens the Annual Balance Ratio and the Trust Fund Ratio by decreasing the denominator of both.
Social Security’s Finances: Dynamic Projections
Figure 4 adds PWBM’s and the CBO’s dynamic estimates of Annual Balance Ratios (solid lines) to the projections shown in Figure 1.12 The “bump” in the Annual Balance Ratio during early years in PWBM’s dynamic projections results from the incentive effects of the Tax Cuts and Jobs Act (TCJA) of 2017. This Act reduced income tax rates on corporations and individuals, that we project will increase capital investment, employment, and wages in the short term. In turn, that would boost the payroll tax base and Social Security’s revenues in the short term. However, several of TCJA’s tax incentives expire by the mid-2020s, causing U.S. domestic investment and wage growth to slow during the latter part of that decade. Our TCJA projections keep adjustment costs turned off, which allows for comparisons with other models that don’t support this level of detail. With positive adjustment costs, economic growth from TCJA would smoother but smaller.
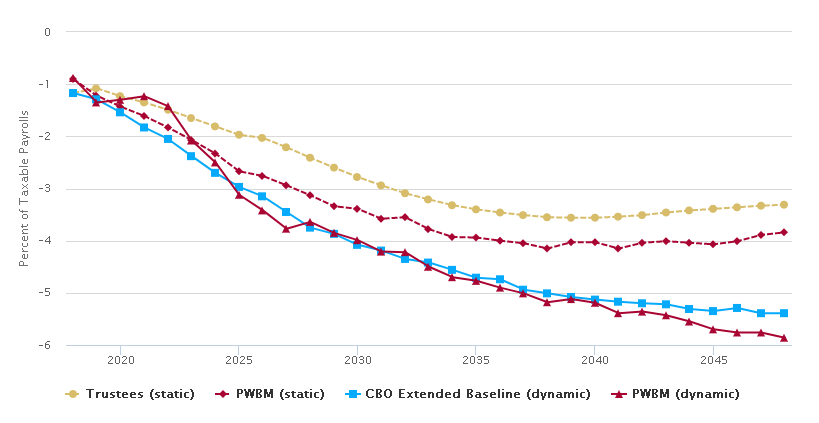
Relative to the Trustees, PWBM (dynamic) projects an Annual Balance Ratio equal to -4.2 percent in 2032, or 36 percent larger than the Trustees’ estimate of -3.09 for that year.13 For year 2048, PWBM (dynamic) projects an Annual Balance Ratio equal to -5.9 percent, which is 77 percent larger than the Trustees’ estimate of -3.31 percent for the same year.14 As noted above, growing debt along the baseline reduces growth in the payroll tax base relative to static projections that don’t incorporate debt effects. Some of this growing debt is due to negative Annual Balance Ratio’s in Social Security itself.15
Relative to the CBO’s projections, PWBM’s projected Annual Balance Ratios are worse, despite similar future debt projections shown in Figure 3. By 2048, the CBO projects the Annual Balance Ratio at -5.4 percent, smaller than PWBM’s value of -5.9 percent. The CBO’s dynamic estimates are constructed by applying a fixed elasticity (economic response) to the impact that new cash-flow deficits, rather than the size of debt, have on the economy.16 In contrast, debt effects are an integral part of the standard Samuelson-Diamond overlapping-generations model, including PWBM’s implementation of dynamic projections.
Another important consideration in projecting Social Security’s finances is the time horizon: The standard projection horizon for Social Security is 75 years from today. However, the CBO and PWBM’s projections reported herein extend only through 2048. The reasons for the CBO’s projection window being less than 75 years are unclear from their documentation. In the case of PWBM, the dynamic feedback effects from increasing debt are not sustainable after about 2065. As a mostly pay-as-you-go program, Social Security’s finances should ideally be projected into perpetuity. However, its current substantial financial shortfalls cast doubt on the usefulness of the standard 75-year projection period when dynamic effects are considered.

Figure 5 adds CBO and PWBM Trust Fund Ratios under dynamic projections to Figure 3. Despite their longer-term differences, both the CBO and PWBM (dynamic) project the same year for trust fund depletion – 2032. As noted above, the main differences between CBO and PWBM emerge well after the trust fund is depleted.
Conclusion
Despite increased dependency on Social Security, the program’s finances have worsened over the decades since the last major reform of the early 1980s. Official Social Security Trustees estimates do not incorporate key future macro-economic variables, including the nation’s growing debt path. Using a model that incorporates future macro-economic forces, PWBM projects that the Social Security trust fund depletes in 2032. More importantly, we project much larger future annual cash-flow shortfalls.
[Updated 08/08/2018 to include additional information about the distinction between current and present law regarding the Social Security system.]
-
Technically, Social Security has two trust funds, one for OASI and another for DI. However, these two trust funds are generally combined into one for presentation purposes by Trustees’, CBO and PWBM. ↩
-
The Social Security Trustees’ 1984 Annual report projected average surpluses of 2.4 and 0.72 percent of payrolls in the first and second 25-year periods, respectively, and average deficits of 1.16 percent in the third 25-year period for the 1984-2058 period. Over the entire 75-year period, the system was projected to accrue an average surplus of 0.65 percent of annual payrolls. The short-term surpluses would accumulate as assets in the Trust Funds that would cover deficits during the latter part of the 75-year projection horizon. ↩
-
The 1984 report of the Social Security Trustees projected the program’s finances under long-term total fertility rate (TFR) of 2.3 per female lifetime. During 1990-2007, the TFR remained stable between 2.0 and 2.1. TFR fell to 1.82 by 2016, a decline that is expected to continue. In the 1984 Trustees’ annual report, life expectancy at age 65 was projected to increase from 14.5 (19.0) additional years for males (females) in 1984 to 17.8 (23.4) additional years by the year 2060. The 2018 Trustees’ annual report, by contrast, expects those life expectancies to improve from 18.3 (20.7) in 2018 for males (females) to 20.9 (23.4) by 2060 and to 22.7 (24.7) by 2095. ↩
-
The PWBM micro-simulation captures, in considerable detail, the distribution of individual attributes that are important for estimating key macro-economic variables. A partial list includes population size, distribution by age. the size of labor force, employment levels, work intensity, labor productivity, payroll, income tax bases, earning histories, marriage, divorce histories, family sizes, and disability. ↩
-
Social Security worker benefits are computed based on a detailed calculation of benefits by applying all aspects of the benefit formula to workers’ earnings records. Auxiliary benefits are computed based on family demographic historical earnings records of all members as applicable. Disability benefits are estimated at the aggregate level by applying the trustees’ estimates of the ratio of DI to OASI benefits. ↩
-
It is assumed that following current tax and benefit laws, entitlement-funding shortfalls would be paid for through additional federal borrowing with the funds transferred to the Social Security and other trust funds as needed. ↩
-
Division by taxable payrolls essentially compares the dollar difference between revenues and costs to the taxable payroll base – indicating the percentage point increase in the payroll tax rate each year that would be required to close the gap. ↩
-
Social Security also receives money from taxation of benefits, but these amounts are much smaller by comparison. ↩
-
The CBO’s debt projection shown is based on its mid-range assumptions about labor force participation, productivity growth, interest rates, and the rate by which health care costs may grow faster than the overall rate of economic growth. Adverse developments in one or more of these assumptions would yield more rapid debt growth relative to GDP. See the CBO’s long-term budget projections released June 2018 – available at: https://www.cbo.gov/about/products/budget-economic-data#1. ↩
-
Both projections assume the current policy paths for Social Security revenues and benefits. ↩
-
The exact size of the impact varies in the literature. See, for example, “New Evidence on the Interest Rate Effects of Budget Deficits and Debt” by Thomas Laubach, Journal of the European Economic Association Vol. 7, No. 4 (Jun., 2009), pp. 858-885. Another relevant study is “Federal Government Debt and Interest Rates,” by Eric M. Engen, R. Glenn Hubbard in NBER Macroeconomics Annual 2004, Volume 19, ed. by Mark Gertler and Kenneth Rogoff, 2005. Still, even under a moderate estimate, a debt-to-GDP ratio increase from 78 percent of GDP to 152 percent of GDP would imply a 222 basis point increase in long-term real interest rates. The effect also appears to be non-linear. See, for example, “Financial and Sovereign Debt Crises: Some Lessons Learned and Those Forgotten,” by Carmen Reinhart and Kenneth Rogoff (IMF 2013 Working Paper). ↩
-
As noted earlier, the CBO does not report their projections on a static basis. ↩
-
PWBM’s projections imply a revenue shortfall of $297 billion in the year 2032, implying a benefit cut of 24 percent to keep expenditures within available revenues. ↩
-
PWBM’s projections imply a revenue shortfall of $562 billion in the year 2048. The required benefit reduction to keep expenditures within available revenues would be 30.4 percent. ↩
-
Under “current law,” Social Security benefits are reduced to match revenues when the Trust Fund is depleted. Under “present law,” Social Security taxes and benefits are maintained at their present values, with annual shortfalls becoming part of the unified deficit, which grows debt. The Trustees’ report some Social Security metrics, such as payable benefits, as under current law, thereby avoiding negative balances in the Trust Fund. They report other measures, such as the 75-year imbalance, as under present law, thereby indicating revenue shortfalls after the Trust Fund depletion date. Our dynamic analysis, like CBO’s analysis, follows present law, where negative Annual Balance Ratios contribute to the debt after the Trust Fund depletion date. ↩
-
In particular, the CBO’s CBOLT model assumes that investment goes down by 33 cents for each dollar of additional deficit above a benchmark. The presence of debt within a balanced budget economy is equivalent to a balanced pay-as-you-go social security system, which is well known to reduce savings. See, for example, the CBO’s“Social Security and Private Saving: A Review of the Empirical Evidence,” July 1998. ↩
  Year,Trustees (static),PWBM (static)
  2018,-1.17,-0.90
  2019,-1.08,-1.22
  2020,-1.23,-1.43
  2021,-1.35,-1.61
  2022,-1.49,-1.83
  2023,-1.65,-2.07
  2024,-1.81,-2.33
  2025,-1.97,-2.67
  2026,-2.03,-2.76
  2027,-2.21,-2.94
  2028,-2.41,-3.13
  2029,-2.6,-3.34
  2030,-2.78,-3.39
  2031,-2.94,-3.58
  2032,-3.09,-3.55
  2033,-3.21,-3.78
  2034,-3.32,-3.93
  2035,-3.4,-3.94
  2036,-3.46,-4.00
  2037,-3.51,-4.05
  2038,-3.55,-4.15
  2039,-3.56,-4.03
  2040,-3.56,-4.03
  2041,-3.54,-4.15
  2042,-3.51,-4.04
  2043,-3.46,-4.01
  2044,-3.42,-4.04
  2045,-3.39,-4.07
  2046,-3.36,-4.01
  2047,-3.33,-3.89
  2048,-3.31,-3.84
  Year,Trustees (static),PWBM (static)
  2018,288,286
  2019,272,267
  2020,256,250
  2021,239,233
  2022,223,217
  2023,206,200
  2024,188,183
  2025,171,165
  2026,154,147
  2027,137,129
  2028,120,110
  2029,104,90
  2030,86,70
  2031,69,49
  2032,51,28
  2033,33,6
  2034,14,0
  2035,0,0
  2036,0,0
  2037,0,0
  2038,0,0
  2039,0,0
  2040,0,0
  Year,CBO current law "extended baseline" (dynamic),PWBM (dynamic),CBO alternative policy (dynamic),PWBM's extension of CBO alternative policy
  2018,78,80,78,
  2019,79,84,79,
  2020,81,85,81,
  2021,83,87,84,
  2022,86,91,87,
  2023,88,101,90,
  2024,90,108,93,
  2025,91,118,96,
  2026,93,122,98,
  2027,94,128,101,101
  2028,96,129,,105
  2029,97,131,,108
  2030,99,136,,110
  2031,101,138,,114
  2032,103,142,,118
  2033,105,146,,122
  2034,107,150,,126
  2035,110,153,,131
  2036,112,157,,135
  2037,115,162,,141
  2038,118,165,,147
  2039,121,169,,152
  2040,124,173,,158
  2041,127,177,,164
  2042,130,180,,171
  2043,133,183,,177
  2044,137,187,,184
  2045,140,189,,191
  2046,144,193,,199
  2047,148,197,,207
  2048,152,200,,216
  Year,Trustees (static),PWBM (static),CBO Extended Baseline (dynamic),PWBM (dynamic)
  2018,-1.17,-0.90,-1.17,-0.88
  2019,-1.08,-1.22,-1.29,-1.35
  2020,-1.23,-1.43,-1.54,-1.30
  2021,-1.35,-1.61,-1.83,-1.23
  2022,-1.49,-1.83,-2.05,-1.42
  2023,-1.65,-2.07,-2.38,-2.08
  2024,-1.81,-2.33,-2.7,-2.50
  2025,-1.97,-2.67,-2.97,-3.12
  2026,-2.03,-2.76,-3.15,-3.42
  2027,-2.21,-2.94,-3.45,-3.77
  2028,-2.41,-3.13,-3.75,-3.64
  2029,-2.6,-3.34,-3.87,-3.85
  2030,-2.78,-3.39,-4.08,-3.99
  2031,-2.94,-3.58,-4.19,-4.21
  2032,-3.09,-3.55,-4.35,-4.22
  2033,-3.21,-3.78,-4.42,-4.50
  2034,-3.32,-3.93,-4.56,-4.70
  2035,-3.4,-3.94,-4.71,-4.77
  2036,-3.46,-4.00,-4.74,-4.90
  2037,-3.51,-4.05,-4.94,-5.01
  2038,-3.55,-4.15,-5.01,-5.18
  2039,-3.56,-4.03,-5.08,-5.12
  2040,-3.56,-4.03,-5.13,-5.19
  2041,-3.54,-4.15,-5.17,-5.39
  2042,-3.51,-4.04,-5.2,-5.36
  2043,-3.46,-4.01,-5.22,-5.43
  2044,-3.42,-4.04,-5.31,-5.55
  2045,-3.39,-4.07,-5.35,-5.70
  2046,-3.36,-4.01,-5.29,-5.76
  2047,-3.33,-3.89,-5.39,-5.76
  2048,-3.31,-3.84,-5.39,-5.86
  Year,Trustees (static),CBO (dynamic),PWBM (static),PWBM (dynamic)
  2018,288,289,286,286
  2019,272,272,267,266
  2020,256,257,250,249
  2021,239,237,233,235
  2022,223,219,217,222
  2023,206,199,200,205
  2024,188,180,183,188
  2025,171,160,165,167
  2026,154,138,147,146
  2027,137,115,129,123
  2028,120,91,110,102
  2029,104,70,90,79
  2030,86,47,70,57
  2031,69,25,49,33
  2032,51,2,28,9
  2033,33,0,6,0
  2034,14,0,0,0
  2035,0,0,0,0
  2036,0,0,0,0
  2037,0,0,0,0
  2038,0,0,0,0
  2039,0,0,0,0
  2040,0,0,0,0