The Federal Reserve’s inaugural reports on Financial Stability and Supervision & Regulation offer a useful peek into Fed thinking and underscore the Fed’s responsibilities for more than inflation and unemployment. The reports didn’t get much attention because they didn’t seem to say much new, didn’t shout about some otherwise unnoticed risk, and were written cautiously. Instead, they focused on identifying and measuring vulnerabilities that—if elevated—could lead to problems for the economy in times of stress.
There is one little-noted feature of the report: charts that provide data to which few outside the Fed previously have had easy access. Here are the few of the nuggets we spotted:
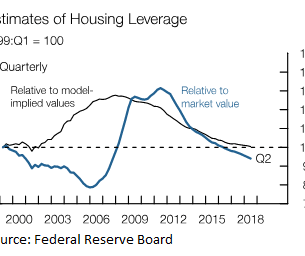
How leveraged are American homeowners?
A lot less than they were a few years ago as house prices have rebounded. Measuring mortgage debt against home values, leverage is at what the Fed describes as “the moderate level seen in the relatively calm housing markets of the late 1990s.” One line here shows mortgages against the market value of homes, as measured by the CoreLogic home price index; the other shows mortgages against what a Fed staff model suggests houses are worth based on rents and interest rates. The big gap in the 2000s reflects the housing bubble that burst so painfully in 2006.
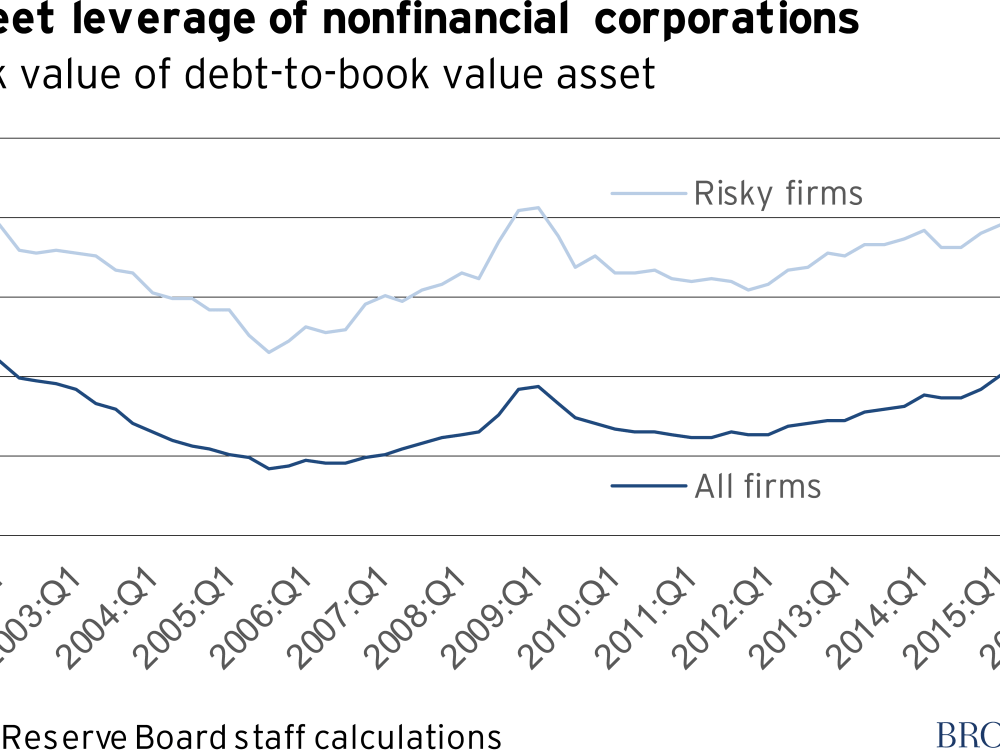
How leveraged are U.S. publicly held corporations?
The ratio of debt to the book value of assets for all publicly traded non-financial firms based on firm-level data hasn’t changed dramatically in the past couple of years, but is at a 20 year high. The previous peaks tended to coincide with recessions; not this time. And the riskiest firms—the ones with heavy borrowing, large interest tabs, low earnings and little cash—have been increasing their debt loads the most.
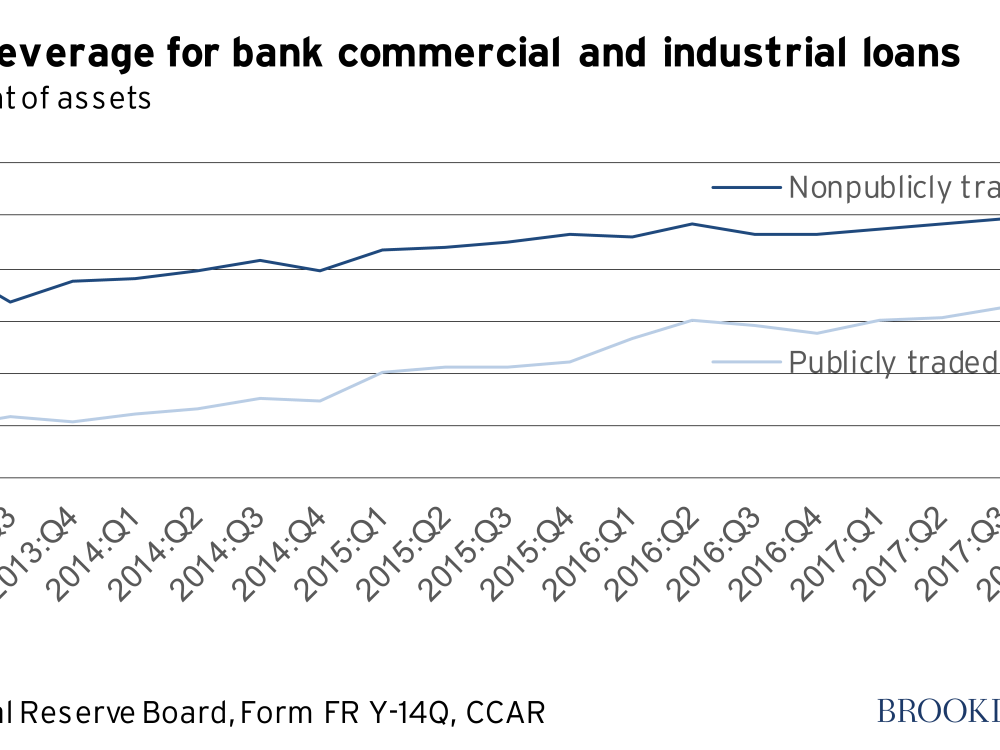
How leveraged are banks’ business borrowers?
More than they used to be or, as the Fed put it, “The leverage of borrowers who are receiving C&I [commercial and industrial] loans from the largest banks has been trending up in recent years….” based on loan-level data provided by the largest banks for the Fed’s stress tests. It’s hard to tell from this data how much of the leveraged loan business—loans to the most financially fragile companies—are ending up on bank balance sheets.
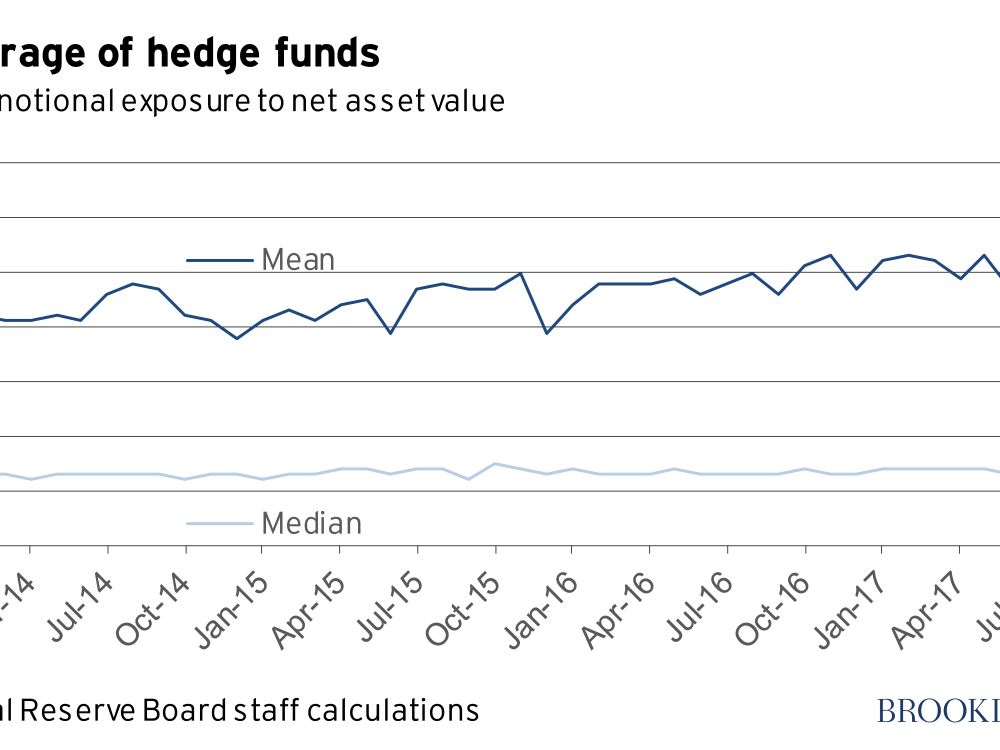
How leveraged are hedge funds?
Hedge funds are notoriously secretive, but the government has been gathering more data from them, albeit with a long lag. This chart shows that the average (mean) hedge fund’s leverage (broadly defined to include loans, repurchase agreements and derivatives) rose by about a third during 2016 and 2017. Since the typical (median) fund’s leverage did not rise, some hedge funds must have increased leverage a lot.
“The increased use of leverage by hedge funds,” the report says, “exposes their counterparties to risks and raises the possibility that adverse shocks would result in forced asset sales. That said, hedge funds do not play the same central role in the financial system as banks or other institutions.”
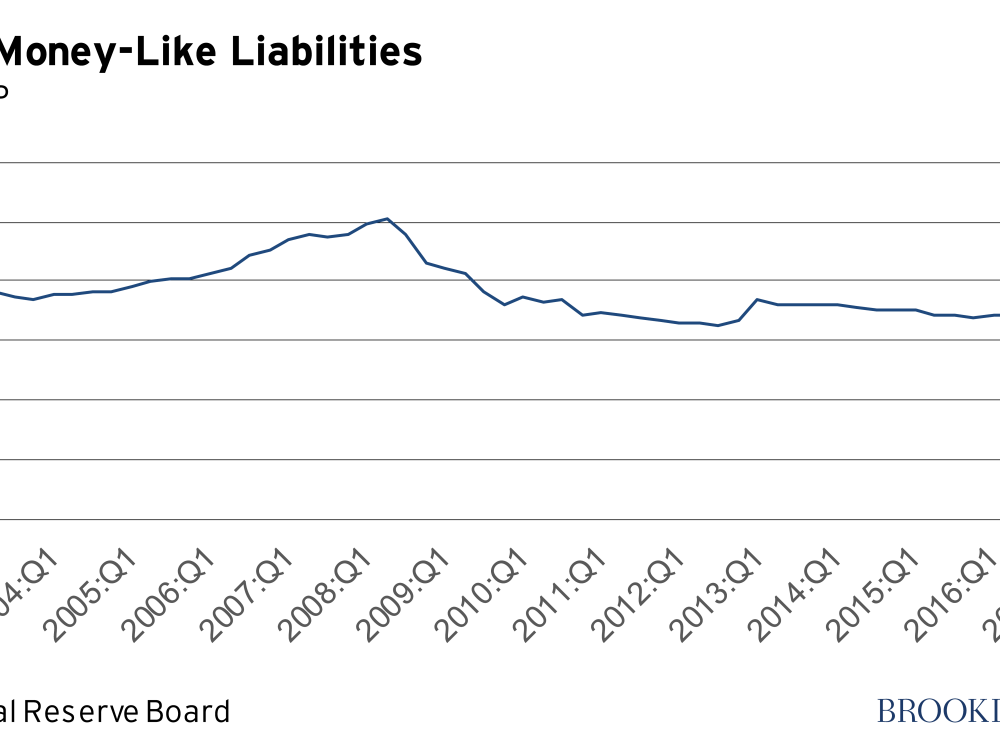
How vulnerable is the financial system to a run in short-term fund markets, like the 2008 run?
A lot less than it was back then. The Fed tallies all the private-short term markets that are susceptible to runs—repos, commercial paper, money market funds, uninsured bank deposits, etc. The total now stands at $13 trillion, significantly lower than its pre-crisis peak. This chart measures the total against the size of the economy, that is, as a percentage of the Gross Domestic Product (GDP).
What are Fed bank supervisors looking at these days?
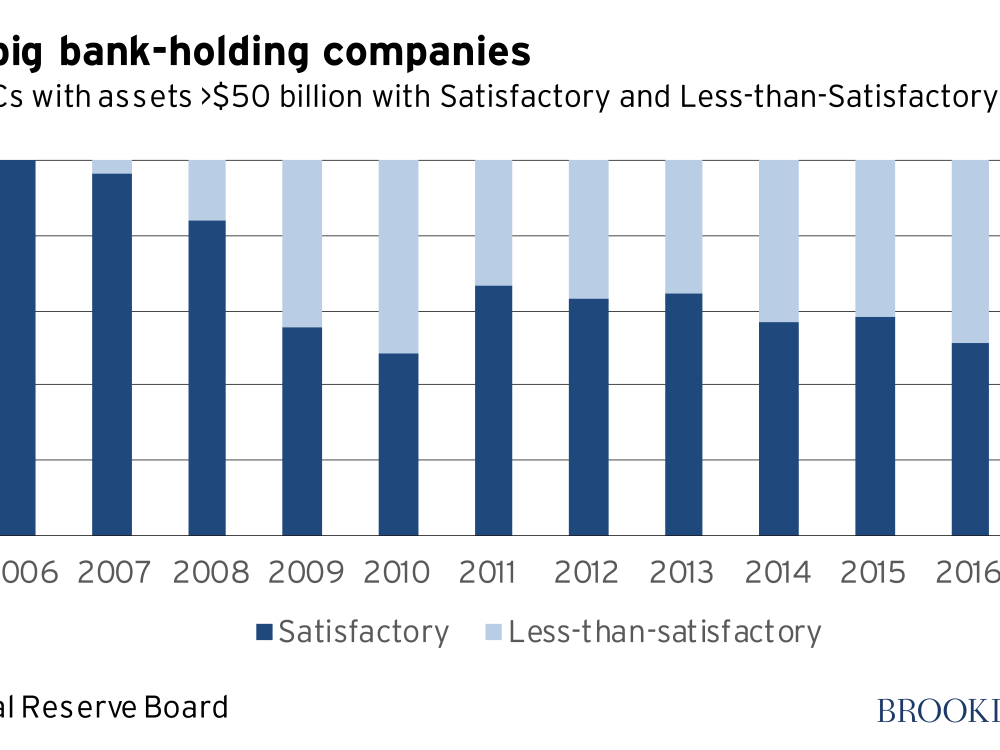
The S&R report reveals that 42.5 percent of bank holding companies with assets greater than $50 billion are rated “less than satisfactory” today on the Fed’s internal five-point rating system. Note that nearly all of them were rated satisfactory through 2008, which tells you something about the failures of Fed supervision in the years preceding the Great Recession.
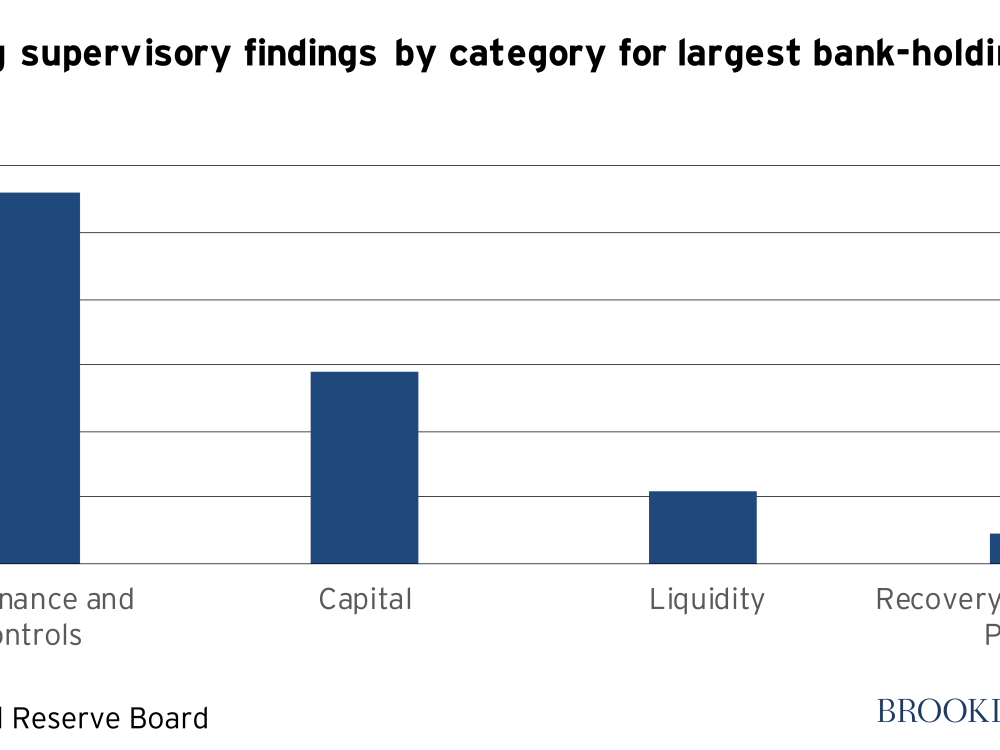
Nearby charts reveal that while capital and liquidity of the largest bank holding companies have improved, Fed supervisors are particularly focused on weaknesses in governance and controls at big banks—which include weaknesses in anti-money laundering programs, concerns about oversight by the boards of directors, risk-management and control functions and cybersecurity.
*Jeffrey Cheng contributed research support to this post.


Commentary
Nuggets from the Fed’s new Financial Stability and Supervision & Regulation reports
January 31, 2019