The Wall Street Journal recently asked me to identify and rank the nation’s toughest places to build housing. This blog post provides readers with the full set of rankings, as well as commentary and a rundown of the data and methods used.
Download Rankings
-
Metropolitan areas
-
Zip code areas, ranked nationally
-
Zip code areas, ranked within metropolitan areas
How to identify tough-to-build places?
One might think that places which are slower to permit construction or reject a greater share of plans are tougher to build in than others, but the opposite is often true. The toughest places to build tend to see few, if any, proposals for new construction because developers know to conserve their energy by pursuing more feasible alternatives. For example, if expensive Silicon Valley suburbs like Palo Alto were to sprout glass condo towers in the midst of single-family homes, they would sell out in no time. However, the fact that no developer wastes their time proposing such a project doesn’t mean it would be easy for a developer to swoop in to build it. On the contrary.
A better way to gauge the toughest places to build is to ask “where does an increasing willingness to pay for housing fail to result in more housing being built?” If people are willing to pay increasing amounts of money for housing, then a paucity of new homes indicates that construction is obstructed, i.e. that it is a “tough-to-build” area. The obstruction can stem from natural geography, from man-made constraints on what may be built, or – as is generally the case – from a mixture of both. Therefore, stunted or delayed construction plans do not indicate that a place is tough-to-build. In fact, it often indicates that plans are likely enough to succeed that they’re worth a shot for developers.
An exception to the rule is the rust-belt scenario in which existing homes – left over from better economic times – are sufficiently abundant relative to current needs to keep the price of housing below the cost of new construction. In this case, there is little impetus to build.
Metropolitan Areas
The extent to which American metro areas are tough-to-build is closely related to their ability and tendency to expand their developed footprint and to densify within that footprint.
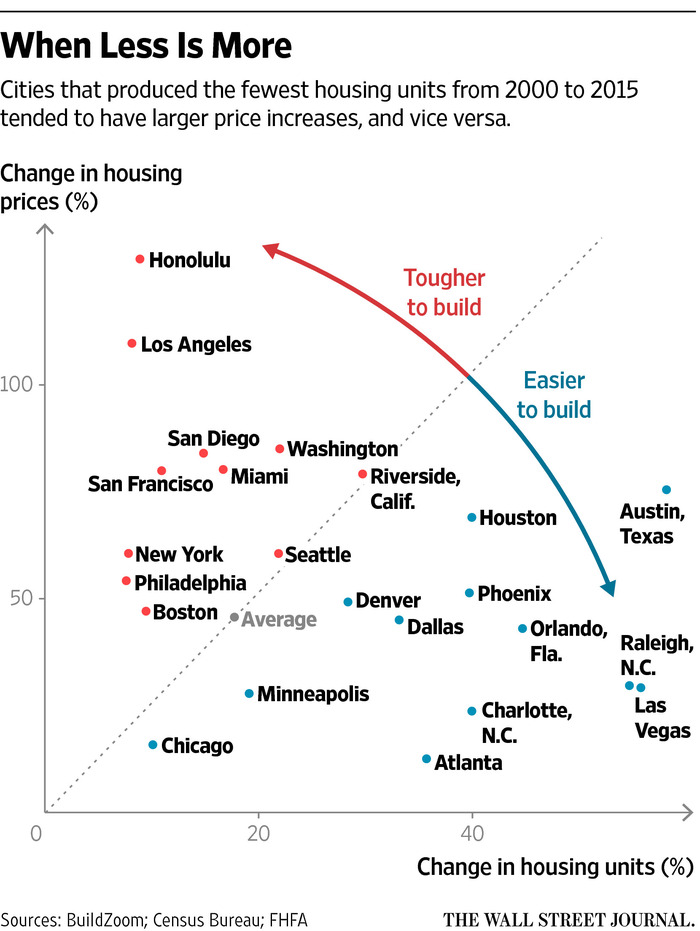
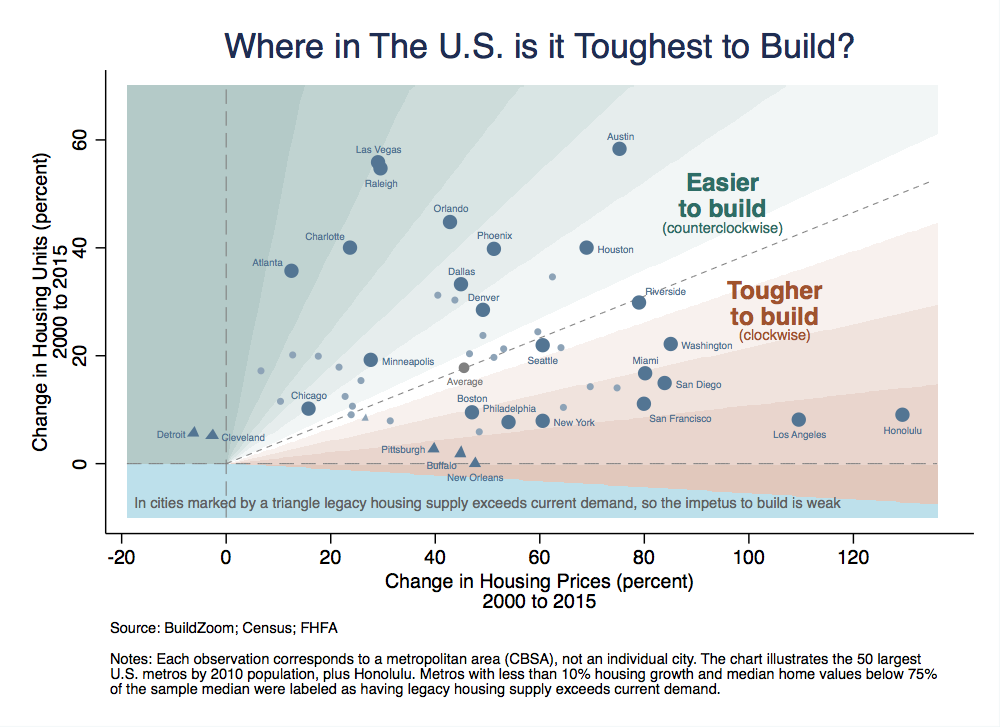
Below is the metro area chart, published by the Wall Street Journal. Data-visualization master Edward Tufte would surely argue that their chart is more effective than my original chart at delivering the information visually (it is even entitled “When Less is More”). Aside from squaring the rectangle, switching the axes and clearing the visual clutter, there are three noteworthy differences between The Wall Street Journal’s chart and my original version, beneath it:
First, The Wall Street Journal omitted plotted metro areas that were not labeled in the original; they can be found in the rankings available for download, above.
Second, The Wall Street Journal also omitted metro areas in which the impetus to build was weak, which appear with triangular markers in the original chart (I have referred to these cities elsewhere as legacy cities). Whereas Detroit and Cleveland have seen declining home prices and little new construction, Pittsburgh and Buffalo have experienced price increases, but these price gains are not yet sufficient to trigger significant amounts of new construction. New Orleans is more complicated because of Hurricane Katrina.
Finally, the original chart emphasizes that it is each metro area’s direction with respect to the origin that represents how tough it is to build. Thus:
- It is tougher to build in Honolulu and Los Angeles than in San Francisco and New York.
- New York and Philadelphia are tougher-to-build than Boston and Miami, which are tougher than Washington, which is tougher than Seattle.
- Seattle and Riverside – whose metro area spans Los Angeles’ so-called “Inland Empire” – are roughly on par with each other.
- Denver and Houston are roughly on par with each other as well but are both tougher to build than Dallas, Phoenix, and Austin.
- Except for Las Vegas, the large metros in which it is easiest to build are located in the Southeast, and Atlanta stands out as the easiest among them.
Zip Code Areas
The best arbiters of the zip code area rankings are the long time residents of each metro, who know the places from personal experience. Nevertheless, a handful of broad observations are in order:
- The toughest places to build are not downtown. It is expected and accepted that U.S. downtowns be dense, and once density is accepted in an area it is easy to build more there.
- The toughest-to-build places tend to be in the inner suburbs. Local land use rules typically codify as taboo dense construction outside of downtowns and in the vicinity of transit hubs. Because the inner suburbs have been around longer than more distant suburbs, the inner suburbs are more likely to have depleted their supply of vacant lots, leaving no room for “acceptable” new construction. The three toughest-to-build neighborhoods featured in The Wall Street Journal – Venice Beach in Southern California (90291), Prospect-Lefferts Gardens in Brooklyn (11225) and the Fishtown section of Philadelphia (19125) – all fall into this category.
- The toughest-to-build places are often in gentrifying neighborhoods. While the process of gentrification is in progress, neighborhoods experience sharp housing price appreciation. However, because gentrification is often closely tied to the neighborhood’s physical charm, housing price appreciation is rarely met by equally large increases in the rate of new construction. As a result, gentrifying neighborhoods often elicit an increasing willingness to pay for housing while failing to get more housing built, i.e. they are tough-to-build. The three toughest-to-build neighborhoods featured in The Wall Street Journal fall into the gentrifying neighborhood category as well.
- Another variety of tough-to-build places consists of exclusive and wealthy low-density enclaves. When such enclaves are sufficiently mature that they no longer harbor vacant land eligible for construction, they often fail to produce any new housing. In metro areas that continue to sprawl, gentrification is less common and the sharpest housing price appreciation often occurs in exclusive, wealthy enclaves such as these. The Villages in Houston (77024) and Brookhaven in Atlanta (30319) are good examples.
“The extent to which American metro areas are tough-to-build is closely related to their ability and tendency to expand their developed footprint and to densify within that footprint.”
But how clear or unclear are we, about the relationship between systemic affordability, and the different types of “freedom to build” at the metro level?
The relationship in US or global data sets, between density, growth rates, and “house prices”, does not at all support the assumption that it is possible to increase supply and bring house prices down by means of planned intensification and redevelopment and upzoning – even though the entire contemporary “compact city” urban planning fad is based on this assumption. I recommend a study from 2002, “Building a Crisis: Housing Under-Supply in England” by John Stewart. Since the UK Planning system established in 1947 strictly rationed the outwards growth of cities, Plan after Plan has introduced bolder and bolder upzoning in an attempt to provide increased housing supply and improved affordability. This has been a dismal failure and still is, 15 years later.
The essential problem is that upzonings under these conditions, always result in an increase in the value of sites which is reaped by the incumbent owner. “Site values are elastic to allowed density” is something that planners need to be made to write out 1000 times when they are being trained. This price increase in sites, has the effect of making development more risky and less worthwhile, for the actual development and construction industry. Cyclical economic conditions ruin a far higher proportion of developers because of the greatly increased costs of sites, “work in progress”, and land banks, which is a significant proportion of overall costs in this industry.
Furthermore, the incentive to incumbent site owners is to “hold” and not cash out, because if considerable capital gains are being experienced (especially each time upzoning occurs), “holding” in anticipation of more capital gains is the common decision. Meanwhile, as there is a worsening shortage of housing, landlords are able to crowd more and more tenants and earn more and more rental income in basically unimproved properties – so why bother to rebuild taller and provide more floor space? An interesting historical reality about cities is that density correlates far more closely to crowding than to building “up”, which is why both “Manhattan in 1900” and “Dhaka now”, are considerably more dense than “Manhattan now”. It is also why the densest part of Hong Kong in history was Kowloon Walled City, which was only 3 to 4 stories high.
Issi, your previous studies were extremely confirming to me that “allowing sprawl” not only guarantees systemic affordability in the metro area, it breaks the impasse described above about upzoning capitalizing into site values. The land price “curve” is determined “differentially”, starting from the value of the exurban rural land which is freely allowed to be developed. Intensification and redevelopment (as long as they are allowed) are truly driven by market demand. If there is no demand (because there are no agglomeration economies being chased in a given location) then intensification and redevelopment won’t occur. If intensification and redevelopment are occurring, as they are in Houston, then there is economic evolutionary processes taking place in the local economy. But while the metro area as a whole has a median multiple house price of 3 to 4, thanks to the sprawl, dense centrally located housing of all types will be significantly more affordable than the same housing in metro areas where sprawl is constrained.
It is absurd, for example, that a small apartment in the inner city of Auckland, NZ, is significantly more expensive than the equivalent in Houston. Economists attempting to explain away absurd disparities in equivalent housing between cities, in terms of “agglomeration effects”, are talking nonsense, and unfortunately there are many such economists. “Compact City” ideology has become like a religious faith, and true believers in it will commit any contortion of logic and reason to justify the perverse outcomes (which are only too convenient for the rentier classes in urban land and finance).
Ironically, actual agglomeration economies are far more likely to be evolved under conditions like Houston, where the systemic affordability of all types of housing at all locations, ensure that the maximum number of potential participants in any agglomeration, are able to afford to “move in”. I hold that New York in a crucial several decades of growth, benefited from this phenomenon – it was significantly more affordable than its “global city” competitor, London, not because NY allowed skyscrapers to be built and London did not, but because NY urban area was freely sprawling at low density for dozens of miles and London’s planning system disallowed this. Had New York had a land-rationing policy like London’s, the skyscrapers would not have been built, not to the same extent, even if there was liberalisation of height and density. This is because of the phenomenon I described earlier, where site values are elastic to allowed density. I hold that for decades, the value of sites in Manhattan was kept flatter by the “differential” effect of the cost of land in rural New Jersey and Long Island, and the values everywhere in between, reflecting true transport cost and time savings and local agglomeration effects. It is important to not mistake “extractive economic rent” in the absence of “differential” mechanisms, for “agglomeration” effects.
Any seeming correlation between “toughness to build” denser, and affordability, is purely because of another coincident correlation between sprawl-constrained urban areas and that “toughness to build denser” (probably a NIMBY backlash against the planners attempts to substitute density FOR sprawl). The famous Wharton Regulatory Index also suffers from the misleading implication that “restrictions on density” matter for housing affordability expressed in clear median-multiple terms. They do not. As long as the urban area can sprawl and convert rural land to urban use freely, it can be as low density as anyone can make it, and still have a median multiple of around 3. Even the mandates for large lots, suppress the per-acre price of the underlying land in such a way that “affordable” large-lot suburbs are commonplace. Atlanta is one of the lowest density cities in the world but that does not lead to issues with affordability. Even the “most exclusionary low density” suburbs in a median multiple 3 urban area are a fraction of the price commanded by much denser housing in “in-demand” locations in median-multiple 6+ cities which do not have sprawl.
I am not endorsing this approach, merely trying to point out the underlying assumptions and realities in urban land economics, prices and economic rents.
Many cities do not have an explicit “growth boundary” like Portland, but suffer from the same economic effect because of a combination of geographic obstacles, rural municipalities zoned against urban development, and government-owned land (National Parks, Defense, etc) that is not for sale. Even some so-called “liberal growth” cities like Phoenix and Las Vegas fall into this category, leading to all sorts of errors of judgement on the part of economists and activists analyzing affordability and cyclical volatility.
Issi and Phil, thank you so much for sharing your deep knowledge and significant insights regarding this important topic.
Re: Phil’s comment: Your argument that intensification in Houston is proof of true agglomeration economies fails to incorporate congestion diseconomies that are clearly an important factor. In many US metros, ex-urban greenfield development during the housing bubble pushed the boundaries of commuting time/cost (think places like Santa Clarita or Vacaville in California, and Leesburg or Gainesville in NoVA) too far relative to the benefit of a cheaper $/sf.