


The transportation industry is tied to more cycles than your washing machine has on its dial. There are short, mid, and long run cycles that impact transportation. All of them impact capacity in different ways. Short run seasonal commodity flows come and go in various markets throughout the year. When enough of the commodities pile up there is a nationwide impact as volumes and rates surge in the mid-term. The longer run trends have more to do with the general economy and macroeconomic factors such as increased retail spending and industrial production. Currently we are experiencing one of the longest running economic expansions in the modern era. Carriers have not only been investing in infrastructure but utilizing technology to increase capacity, as the bullish market has shown little sign of slowing.

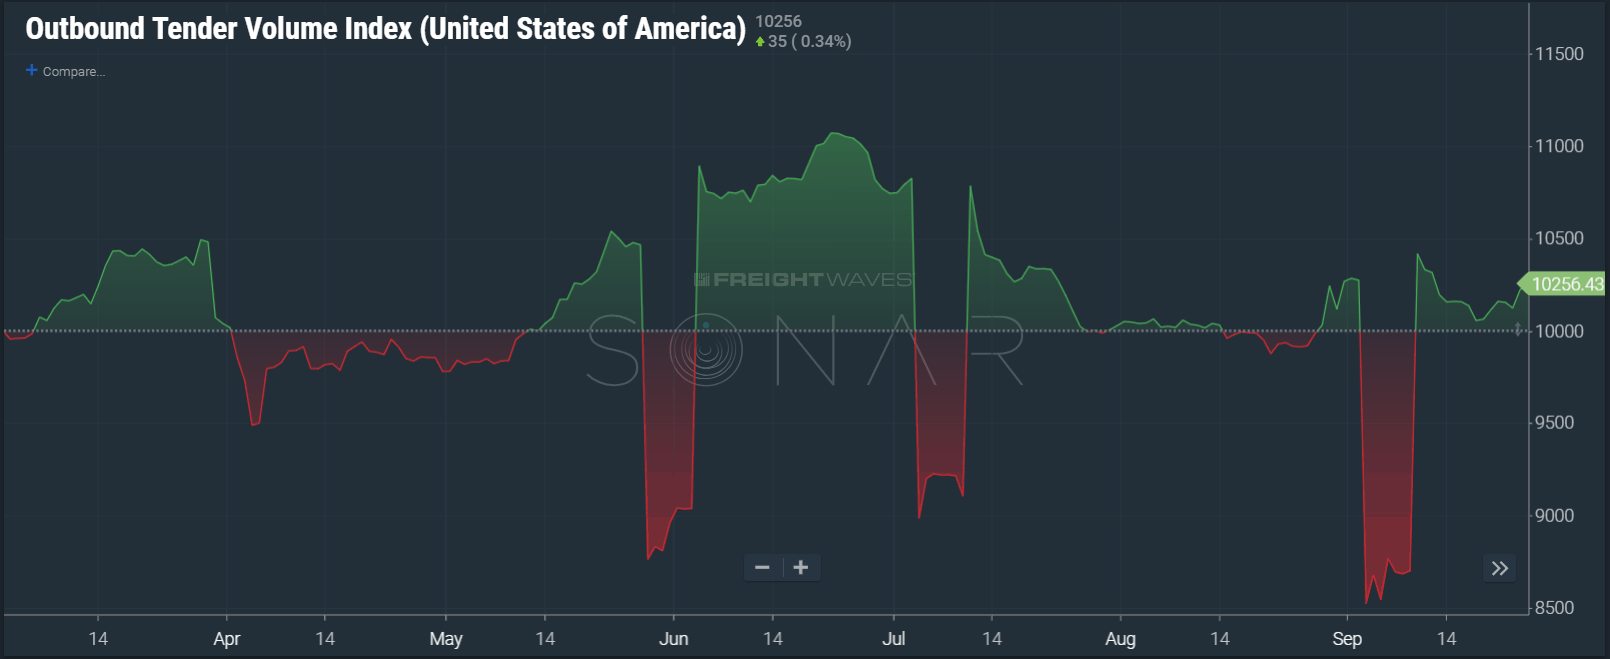
Looking at the outbound tender volume index, an index that measures freight volume in the U.S., we see volume is still relatively high. It is currently 2.56% higher than freight volumes were in early March. Compare this to the national tender rejection index, a measure of carrier willingness to accept loads at the contracted amount, and you can see that volume has less to do with carriers accepting loads than it did in the early part of the year with rejection rates 6 percentage points lower than they were in early March at 18.26%. When carriers reject loads at higher rates we tend to see increasing rates on the spot market. National spot market rates according to DAT Rateview™ were down to $2.13/mile August compared to $2.14 in March.
The reasons for the discrepancy between gradually rising volumes and gradually softening turndowns can be traced to fully executed contracts that have 5-10% higher rates than six months ago, making carriers more willing to honor their contract by sending a truck, and an increase in capacity. We have seen reports of record orders from OEMs on both class 8 trucks and trailers. The most recent reports from ACT Research state backlogs for class 8 vehicles are stretched to 10 months and trailer orders are up 142% year over year. Carriers have had incentive to invest in their fleets with tax breaks and numerous quarters of profitability in a row.
The Trucks in Market index (TRUK), an index that measures the amount of trucking activity in the U.S. with a base period of early April and a base value of 100, is currently hovering around 104, meaning there is approximately 4% more trucks operating in the U.S. currently than the first week of April. We indexed TRUK to the first week of April to avoid comparing the present environment to the pre-ELD mandate environment.

Carriers are not only adding physical capacity, but ELDs have helped create some additional capacity as well by helping carriers manage their fleets’ up and down time more effectively, at least on paper. Looking at the Hour of Service Drive Time index (HOS11), a measure of average hours spent driving on the 11-hour clock in the U.S., there is roughly a 1.65% increase in drive time utilization since early April.
What has made this current growth cycle so impressive is the fact that in 2016 we were in what many in the industry called the mini-freight recession. Carriers were in cost-cutting mode 18 months ago and now they are purchasing equipment faster than it can be produced. The overriding question is will they be able to hire enough people to drive them if the economy continues to grow.
