


https://www.kff.org/medicare/issue-brief/the-facts-on-medicare-spending-and-financing/There ought to be a law that the United States send to every citizen a copy of the US budget and actual spending by the Federal Government. Fortunately, private enterprise does give us a picture of how well our country is doing financially. It’s the US Debt Clock.
It would behoove every American to learn how much money the federal government takes in and spends. The US budget is not what is actually spent. This is revealed in US DEBT CLOCK data. And not all data presented at US DEBT CLOCK is accurate. Official data regarding unemployment released by the Bureau of Labor Standards should be disregarded. Unemployment is rampant and has serious repercussions on the funding of federal programs (Social Security/Medicare) that rely on FICA payroll deductions.
I’m sure most members of Congress don’t fully understand the dire financial predicament the country is in at the present time. Neither does its citizenry.
Fortunately, via the internet and thanks to private enterprise, we have the opportunity to view our country’s financial status on a single printed page or web page. We direct you to the US Debt Clock.
The data in this report is for the fiscal year (not calendar year), tabulated on May 27, 2021. The entire fiscal year runs from October 1 of the budget’s prior year through September 30 of the year being described. For example: FY 2021 is between October 1, 2020 and September 30, 2021.
The CLOCK provides running totals of collections and payments by the federal government in real time. It is graphically organized into green boxes that indicate INCOME/ASSETS and red boxes that indicate EXPENSES and future financial obligations (outlays).
We are going to hold your hand and take you through the US Debt Clock step by step. Here is what we learn from the US Debt Clock.

In the past ten years US federal tax revenues have jumped by a trillion dollars.
The United States has collected almost $3.5 trillion dollars so far, this fiscal year. Tax receipts for the fiscal year are projected to be $3.86 trillion. But it appears, at the current rate of tax collections, federal tax revenues will actually exceed $4 trillion.
President Trump’s proposed budget for 2021 was $4.8 trillion. President Biden is pitching for a $6.1 trillion budget. However, actual spending far exceeds even these outrageous target numbers, as you will learn below. This is in a pandemic-stressed economy where trillions of borrowed dollars are being thrust into the economy.

Federal spending will surpass $7 trillion/in fiscal year 2021. Last year 2020 there were $6.55 trillion of outlays. This fiscal year outlays have already exceeded last year’s spending.
Obviously there is a big difference between what is budgeted and what is spent. Budget projections for FY 2021 were $3.5 trillion in revenues, $5.8 trillion in outlays and a deficit of $2.3 trillion (Congressional Budget Office).
You might ask, if tax revenues exceed $4 trillion and actual spending exceeds $7 trillion, where does that extra $2+ trillion dollars come from to balance revenue with spending?
The US borrows some the difference and pays ~2% interest. It does this by offering IOUs in the form of US Treasury Notes.
The US’s penchant to grow its economy with borrowed money has led to the accumulated national debt of $28 trillion and counting. Twenty-six percent (26%) of this debt, or $7.28 trillion, is intragovernmental debt that the US owes to itself. So interest is being paid on about $21 trillion to holders of US Treasury Bills.

Out of this $28 trillion, ~$7 trillion is owed to foreign countries (See below).

Interest rates
The United States pays 2% interest on this $21+ trillion of debt, or about $400 billion so far this year (see below).

Today savers receive less then 1% interest on their banked money.
If the interest on the debt increases, let’s say to 5% it would mean savings accounts would be paid $5 interest for every $100 on account.
But then the US Treasury Department would have to pay 5% interest on $21 trillion, or over $1 trillion a year in interest only, which would bankrupt the country.
So, the nation’s central bank, the Federal Reserve, is trapped into keeping interest rates low at the expense of savers whose accounts are losing purchasing power as the rate of inflation increases.
Prior to the distribution of COVID-19 stimulus money, there were ~$13 trillion in US savings accounts that earn less than 1% interest. According to Shadowstats.com, the real rate of inflation is ~12% versus official government numbers of ~4%. That means the $13 trillion of banked money is losing ~$2.6 trillion of its purchasing-power each year.
Future obligations
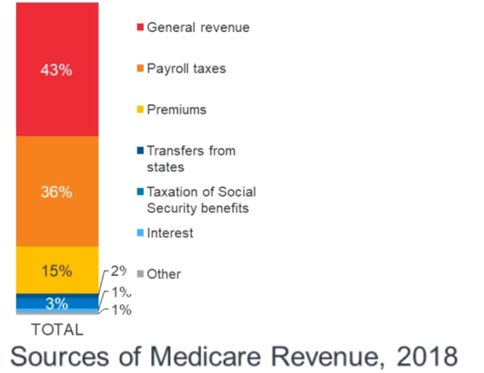
In addition to this current debt the US has future liabilities. For example, the US owes $21+ trillion dollars for future Social Security and $32+ trillion in future Medicare payments.
The admission that some of the money for Social Security and Medicare now come out of the general fund indicates the trust funds for these programs are partially depleted. Only the bi-weekly deductions from paychecks (FICA payments) repletes these trust funds.


Gross domestic product
Offsetting all these debts the US generates a total economic productivity exceeding $20 trillion annually. This is called the Gross Domestic Product (GDP). This is an implausible figure in light of 40 million unemployed US workers (discussed further herein).

However, GDP is supposed to represent economic productivity. The growth in the GDP now largely represents borrowing (stimulus money).
In the past year the US has provided nearly $2.56 trillion of COVID-19 relief, a chunk of that directly to citizens, with most of it fortunately being stashed into savings accounts. Another $6 trillion of COVID-19 related public works and other programs is now being pushed through Congress.
Americans reportedly stashed $2.56 trillion of this stimulus money into savings accounts. Had the people spent the money rather than saved it, inflation would have risen uncontrollably.
So, according to Reuters News Service the economy artificially grew a whopping 10.6% in the 1st Quarter of 2021. But all that happened was the federal government has flooded the economy with paper money and direct deposits of electronic money in bank accounts (see MI money supply chart below).


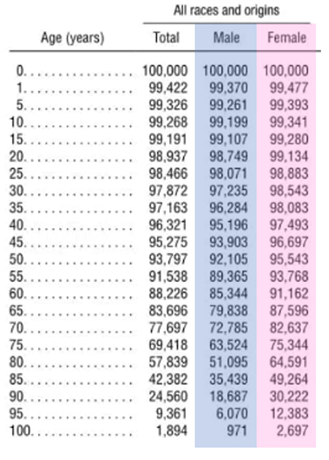
Longevity is financially killing the country
The following mortality table reveals Americans are living longer and longer. Out of 100,000 Americans, 90 years after their birth, 24% are still alive. Medicare and Social Security cannot continue in the present form. These programs cannot afford to continue paying for promised health care and pensions.

Unemployment
According to the US Debt Clock officially there are 9,667,080 unemployed as of May 27, 2021. However, the Debt Clock also recognizes there more unemployed Americans than the official count by the Bureau of Labor Standards. The official unemployed number according to the US DEBT CLOCK is over 17,357,888 million.
But a closer look by economist John Williams of shadowstats.com calculates a 25.5% unemployment rate when you include all the people who have stopped looking for a job. Which means close to 40 million Americans are actually out of work (25.5% of 151 million workers).
Now recognize that these 40 million unemployed Americans are not making FICA contributions out of their paychecks for Medicare and Social Security.
Therefore, there is no possible way Medicare and Social Security payments can continue to be made under the present circumstances.


Can the US continue to fund Medicare and Social Security?
To the financially naïve, it would appear the greatest country in the world could at least offer a universal health care plan.
Can the US afford to offer free healthcare for all, from a single payer, the US government?
Even the trillions of borrowed dollars being thrown at the COVID-19 pandemic will have dire consequences for America.
Turns out, private health plans pay 141% to 259% of Medicare rates to help keep Medicare costs low. In other words, private insurance carriers bear some of Medicare’s freight. Take away private insurance and it will cost a lot more for Medicare. Hospitals lose money on Medicare but make considerable profit from private health plans.
There is an organization, National Nurses United, that wants Medicare for all. Here is a photo from their website (below). Obviously National Nurses United hasn’t read the US Debt Clock or referred to Shadowstats. And to the consternation of this group of nurses, the President of the United States is throwing trillions of borrowed dollars away in the stimulus funding. It appears the US can make all the money it desires.

Other notable data available at US DEBT CLOCK include number of Americans living in poverty (36 million), US bankruptcies (637,238), foreclosures on US homes (74,089), food stamp recipients (42 million), total unfunded liabilities ($148 trillion). The US is increasing the money supply by $33,921 for every new ounce of gold mined; $4767 for every new ounce of silver produced. ####

