Deuterium Excess in Precipitation Reveals Water Vapor Source in the Monsoon Margin Sites in Northwest China
by
 , ,
, ,
Fenli Chen
1, 
Mingjun Zhang
1,*,
Athanassios A. Argiriou
2,
Shengjie Wang
1,
Xin Zhou
1 and
Xueyuan Liu
1 1
College of Geography and Environmental Science, Northwest Normal University, Lanzhou 730070, China
2
Laboratory of Atmospheric Physics, Physics Department, University of Patras, GR-265 00 Patras, Greece
*
Author to whom correspondence should be addressed.
Water 2020, 12(12), 3315; https://doi.org/10.3390/w12123315
Submission received: 6 October 2020
/
Revised: 16 November 2020
/
Accepted: 17 November 2020
/
Published: 26 November 2020
Abstract
:The deuterium excess (d) in precipitation, determined by the stable hydrogen and oxygen isotopes (δ2H and δ18O), is a widely applied parameter in tracing the water vapor source. Based on the multiple-year observations of stable water isotopes in precipitation at four stations in the Lanzhou city, Northwest China, we analyzed the variations in deuterium excess in precipitation at the Asian monsoon margin region. The mean value of deuterium excess at the study region is 11.0‰ in the dry season and 8.0‰ in the wet season. The d value in precipitation negatively correlates with air temperature and vapor pressure. The low d value during the wet season reflects the monsoon moisture transported from long distances. During the dry season, the continental air masses correspond to the higher d value in precipitation. The moisture regimes based on reanalysis data are generally consistent with the findings using a stable isotopic approach, and the monsoon moisture is highlighted in summer precipitation at these monsoon margin sites.
1. Introduction
Water resources and especially fresh water are indispensable for human survival and development [1,2]. However, fresh water accounts for 2.5% of the global water and only 0.3% of it can be easily used, indicating the water is unevenly distributed in space and time [3]. Since precipitation is the direct input of surface water, groundwater, glacier and other hydrologic components, it determines whether a region has abundant water resources or not. At present, atmospheric circulation is undergoing significant changes due to global warming and so is precipitation [4,5]. Stable water isotope ratios (δ2H and δ18O) in precipitation are sensitive to environmental conditions so they can be used as natural records of environmental changes [6,7,8]. Water bodies from different sources often have different isotope ratios; therefore, their isotopic signature allows us to trace these sources. Deuterium excess (d = δ2H − 8δ18O; [9]) in meteoric water reflects the evaporation degree for the water vapor source areas. The higher the evaporation degree, the larger the d value is; after a raindrop is condensed, the stronger the re-evaporative fractionation under the cloud, the smaller the d value is. The d value is not only affected by temperature, relative humidity as well as wind speed at the locations where the water vapor sourced but also by the fractionation due to re-evaporation of raindrops as they leave the cloud (below cloud evaporation) [10,11]. In the Mediterranean area, d values are generally higher in autumn–winter precipitation than those in spring-summer precipitation, which can be attributed to the influence of Mediterranean air masses [12,13].
Although a number of methods can be applied to trace the moisture sources, in recent years, increasing attention has been paid to the stable isotopes in precipitation and water vapor [14,15,16]. As far as isotope techniques are concerned, knowledge has been accumulated worldwide regarding the relation between the isotopic composition and the origin of the water vapor in various regions of the world [17,18,19,20]. Since the d value in precipitation depends on meteorological conditions at the water vapor source regions, changes in d values in precipitation can be used to trace the water vapor to a certain area [21,22,23,24].
In western China, precipitation isotopes have been considered in the identification of water vapor sources [25,26]. In the Tibetan Plateau, Yao et al. [27] identified three sub-regions with seasonal isotopic features impacted by different large-scale moisture paths (the westerlies in the north, the transition in the middle as well as the monsoon in the south), considering that the potential interaction between the westerlies and monsoon is the critical driving force of different isotope characteristics. Liu et al. [28] demonstrated that raindrops in northwest China are subjected to below cloud evaporation during precipitation, so the precipitation vapor may be mixed with locally recycled vapor by means of both Rayleigh and kinetic fractionation. Feng et al. [29] showed a case study linking the isotopic variation to moisture sources, and found that there is a dominant effect of westerly moisture in summer and of a combined influence of westerly and polar air masses in winter. Wang et al. [30,31] demonstrated that the rainfall in westerly-dominated northwest China is related to locally recycled moisture and the advected moisture via Europe and central Asia.
The Lanzhou city, located in the Loess Plateau of China, is impacted by both westerlies and monsoon water vapor [32,33,34]. This region is also considered to be the western vertex of the Chinese ‘‘Monsoon Triangle’’ defined by Li et al. [35], and is usually sensitive to modern and paleo climate change. The geographic location at the monsoon margin makes the water cycle at the Lanzhou city interesting for hydrological and climate studies. From 2011 to 2012, 243 samples were collected at Lanzhou and the basic characteristics of d value were mentioned [36]. With further observation from 2011 to 2014 [33], the inter-annual variation of d value may provide more meaningful information about the origin of water vapor over this the region. However, the moisture sources information in d value in precipitation samples was not well treated for this region using multiple year event-based observations in previous studies.
Here, based on 959 event-based samples from four stations in the Lanzhou city between April 2011 and October 2014 [33], we aim (1) to present new detailed information regarding the d value in precipitation in the study region, (2) to clarify the relation between d value and meteorological factors (especially temperature and vapor pressure) and (3) to discuss the linkage of stable isotopes and water vapor origin for these monsoon margin stations.
2. Data and Method
2.1. Study Area
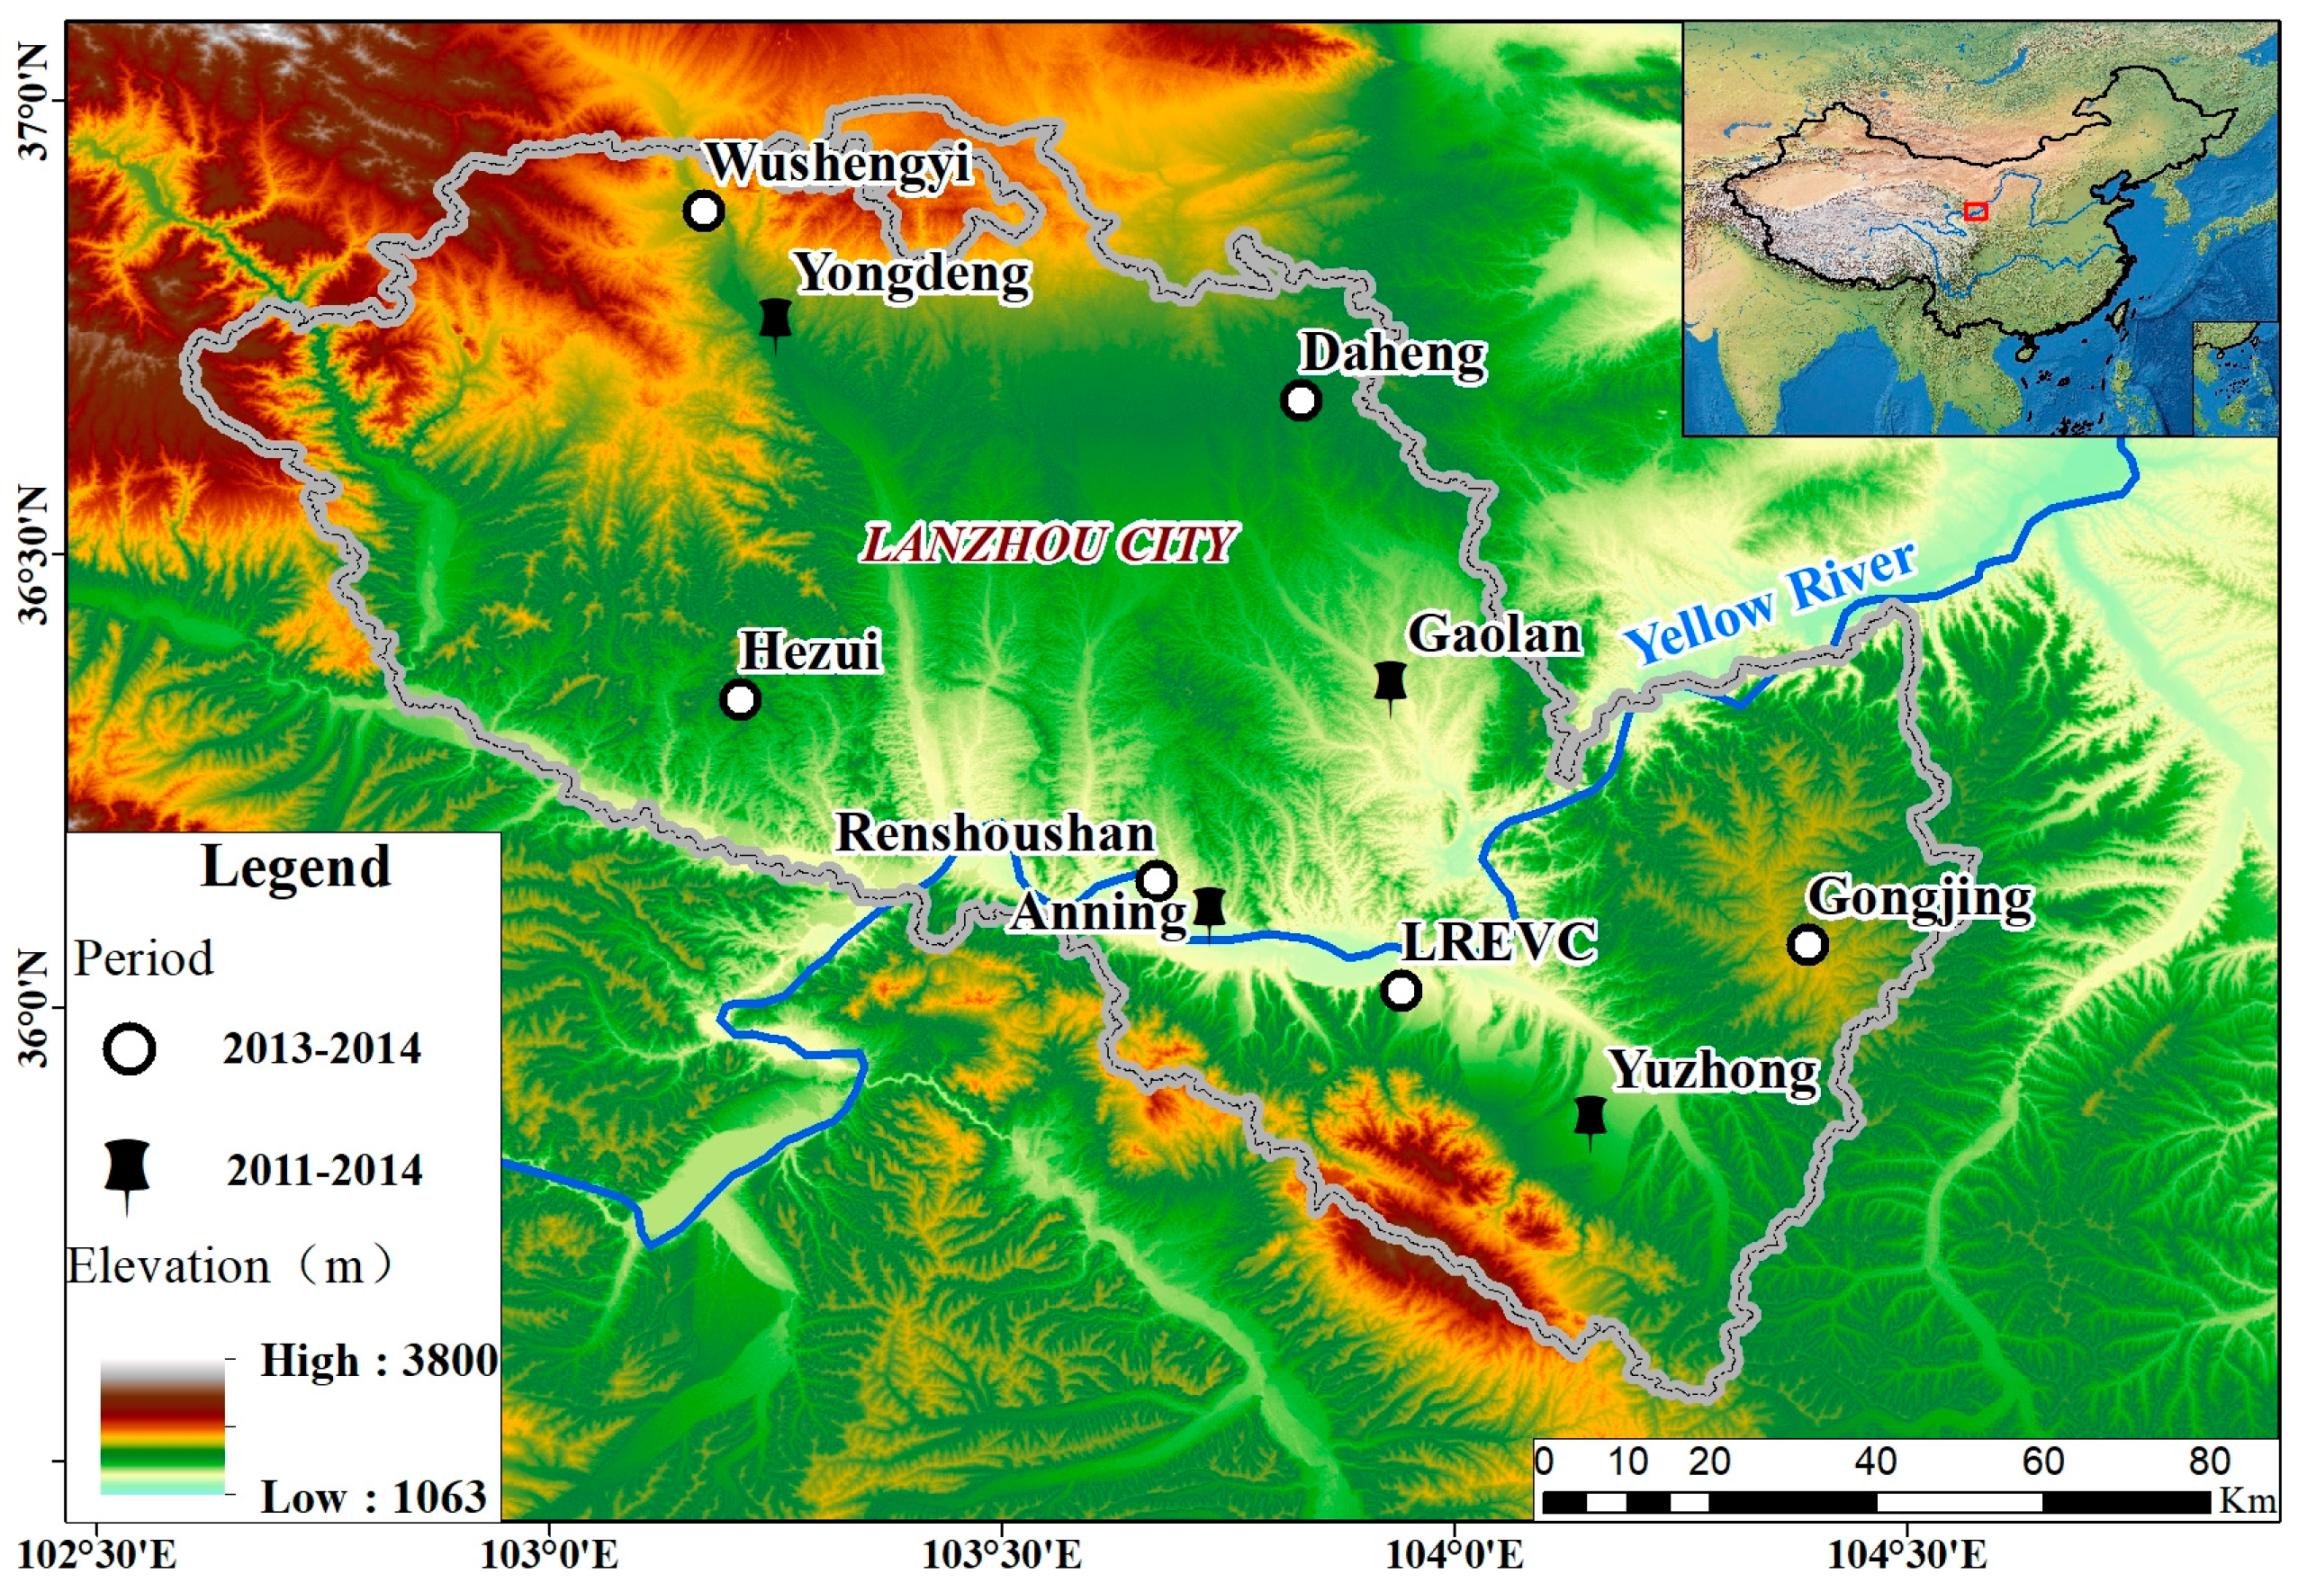
The Lanzhou city (Figure 1) is situated at a transition area between the three natural sub-regions of China including the eastern monsoon region, the northwestern arid region and the Tibetan cold region. Lying at the monsoon margin region, the Lanzhou city presents a cold semi-arid climate (BSk) in Köppen–Geiger climate classification. The Indian and East Asia monsoons can be delivered to this region, leading to an uneven intra-annual precipitation distribution; however, the mid-latitude westerlies regime cannot be ignored. As recorded at the Lanzhou National Basic Meteorological Station (36.05° N, 103.88° E, 1517.2 m) [33], the long-term mean precipitation amount is 293.9 mm, and the fraction of precipitation is 85% during the wet season (from May to September) and 15% during the dry season (from October to April); the pan evaporation amount is 1504.8 mm per year; the annual mean air temperature is 10.4 °C, and the monthly temperature ranges from 23.1 °C in July to −4.5 °C in January.
2.2. Sample Collection and Laboratory Work
The selected stations for precipitation sampling in this study are those of Anning, Yongdeng, Gaolan and Yuzhong from April 2011 to October 2014 [33] (Table 1). Samples in all stations were collected by accredited meteorological observers, except at Anning where sampling was performed by the members of the research group of Northwest Normal University. In order to prevent the possible evaporation in the collector, liquid samples (rain) were immediately gathered after the end of each event. Continuous (and usually with large amount) processes were selectively collected based on fixed time intervals (e.g., every hour). Liquid samples collected were put into approximately 50 mL plastic bottles with outer and inner caps as well as waterproof seals and then stored in a refrigerator. Solid samples (snow or hail) were firstly allowed to melt at room temperature in zip-lock plastic bags; once in liquid form, they were handled as described before. Air temperature, vapor pressure and relative humidity during precipitation events were recorded on an hourly basis using automatic weather stations, and arithmetically averaged for each precipitation event. Samples were analyzed using a liquid water isotope analyzer DLT-100 (Los Gatos Research, Inc., Mountain View, CA, USA) in the College of Geography and Environmental Science, Northwest Normal University, and the analytic precision was ±0.2‰ and ±0.6‰, for δ18O and δ2H, respectively. We presented the stable isotopic characteristics for the period from April 2011 to October 2014 in a previous study [33]. In this study, we focus on the second-order parameters deuterium excess, instead of the raw stable hydrogen and oxygen isotope compositions.
We acquired the historical data in Lanzhou (103°52′ E, 36°03′ N, 1517 m) from the Global Network of Isotopes in Precipitation (GNIP) [37]. The simulations of several isotope-enabled general circulation models (GCMs), including Laboratoire de Météorologie Dynamique Zoom (LMDZ), Isotope-incorporated Global Spectral Model (isoGSM) and Model for Interdisciplinary Research on Climate (MIROC), within 34–37° N and 103–105° E were selected (online available at http://www.giss.nasa.gov/projects/swing2) to verify the results of our analysis [38,39,40,41]. For LMDZ, both the nudged and free results were applied (LMDZ and LMDZfree, for short) [39].
The Hybrid Single-Particle Lagrangian Integrated Trajectory (HYSPLIT) model [42] using the Global Data Assimilation System (GDAS) [43] was applied in order to calculate the air mass trajectories. The weather systems giving the precipitation events were determined using the US National Centers for Environmental Prediction/National Center for Atmospheric Research (NCEP/NCAR) reanalysis [44].
3. Results and Discussion
3.1. Deuterium Excess in Precipitation and Environmental Controls
Table 2 and Figure 2 show the long-term variations in d value in precipitation at the four stations in the Lanzhou city from 2011 to 2014. Generally, the seasonal variability in d value in precipitation can be seen, which is related to the meteorological conditions with higher temperature in the dry season (October to April) and lower temperature in the wet season (May to September). The regional mean d value is 11.0‰ in the dry season and 8.0‰ in the wet season, respectively. Although four sampling stations are presented in Figure 2, the inter- and intra-annual variations are generally consistent. The historical data in the GNIP Lanzhou site are presented in Figure S1 in Supplementary Material; different sampling years are involved, but the basic characteristics of seasonal variability are generally consistent.
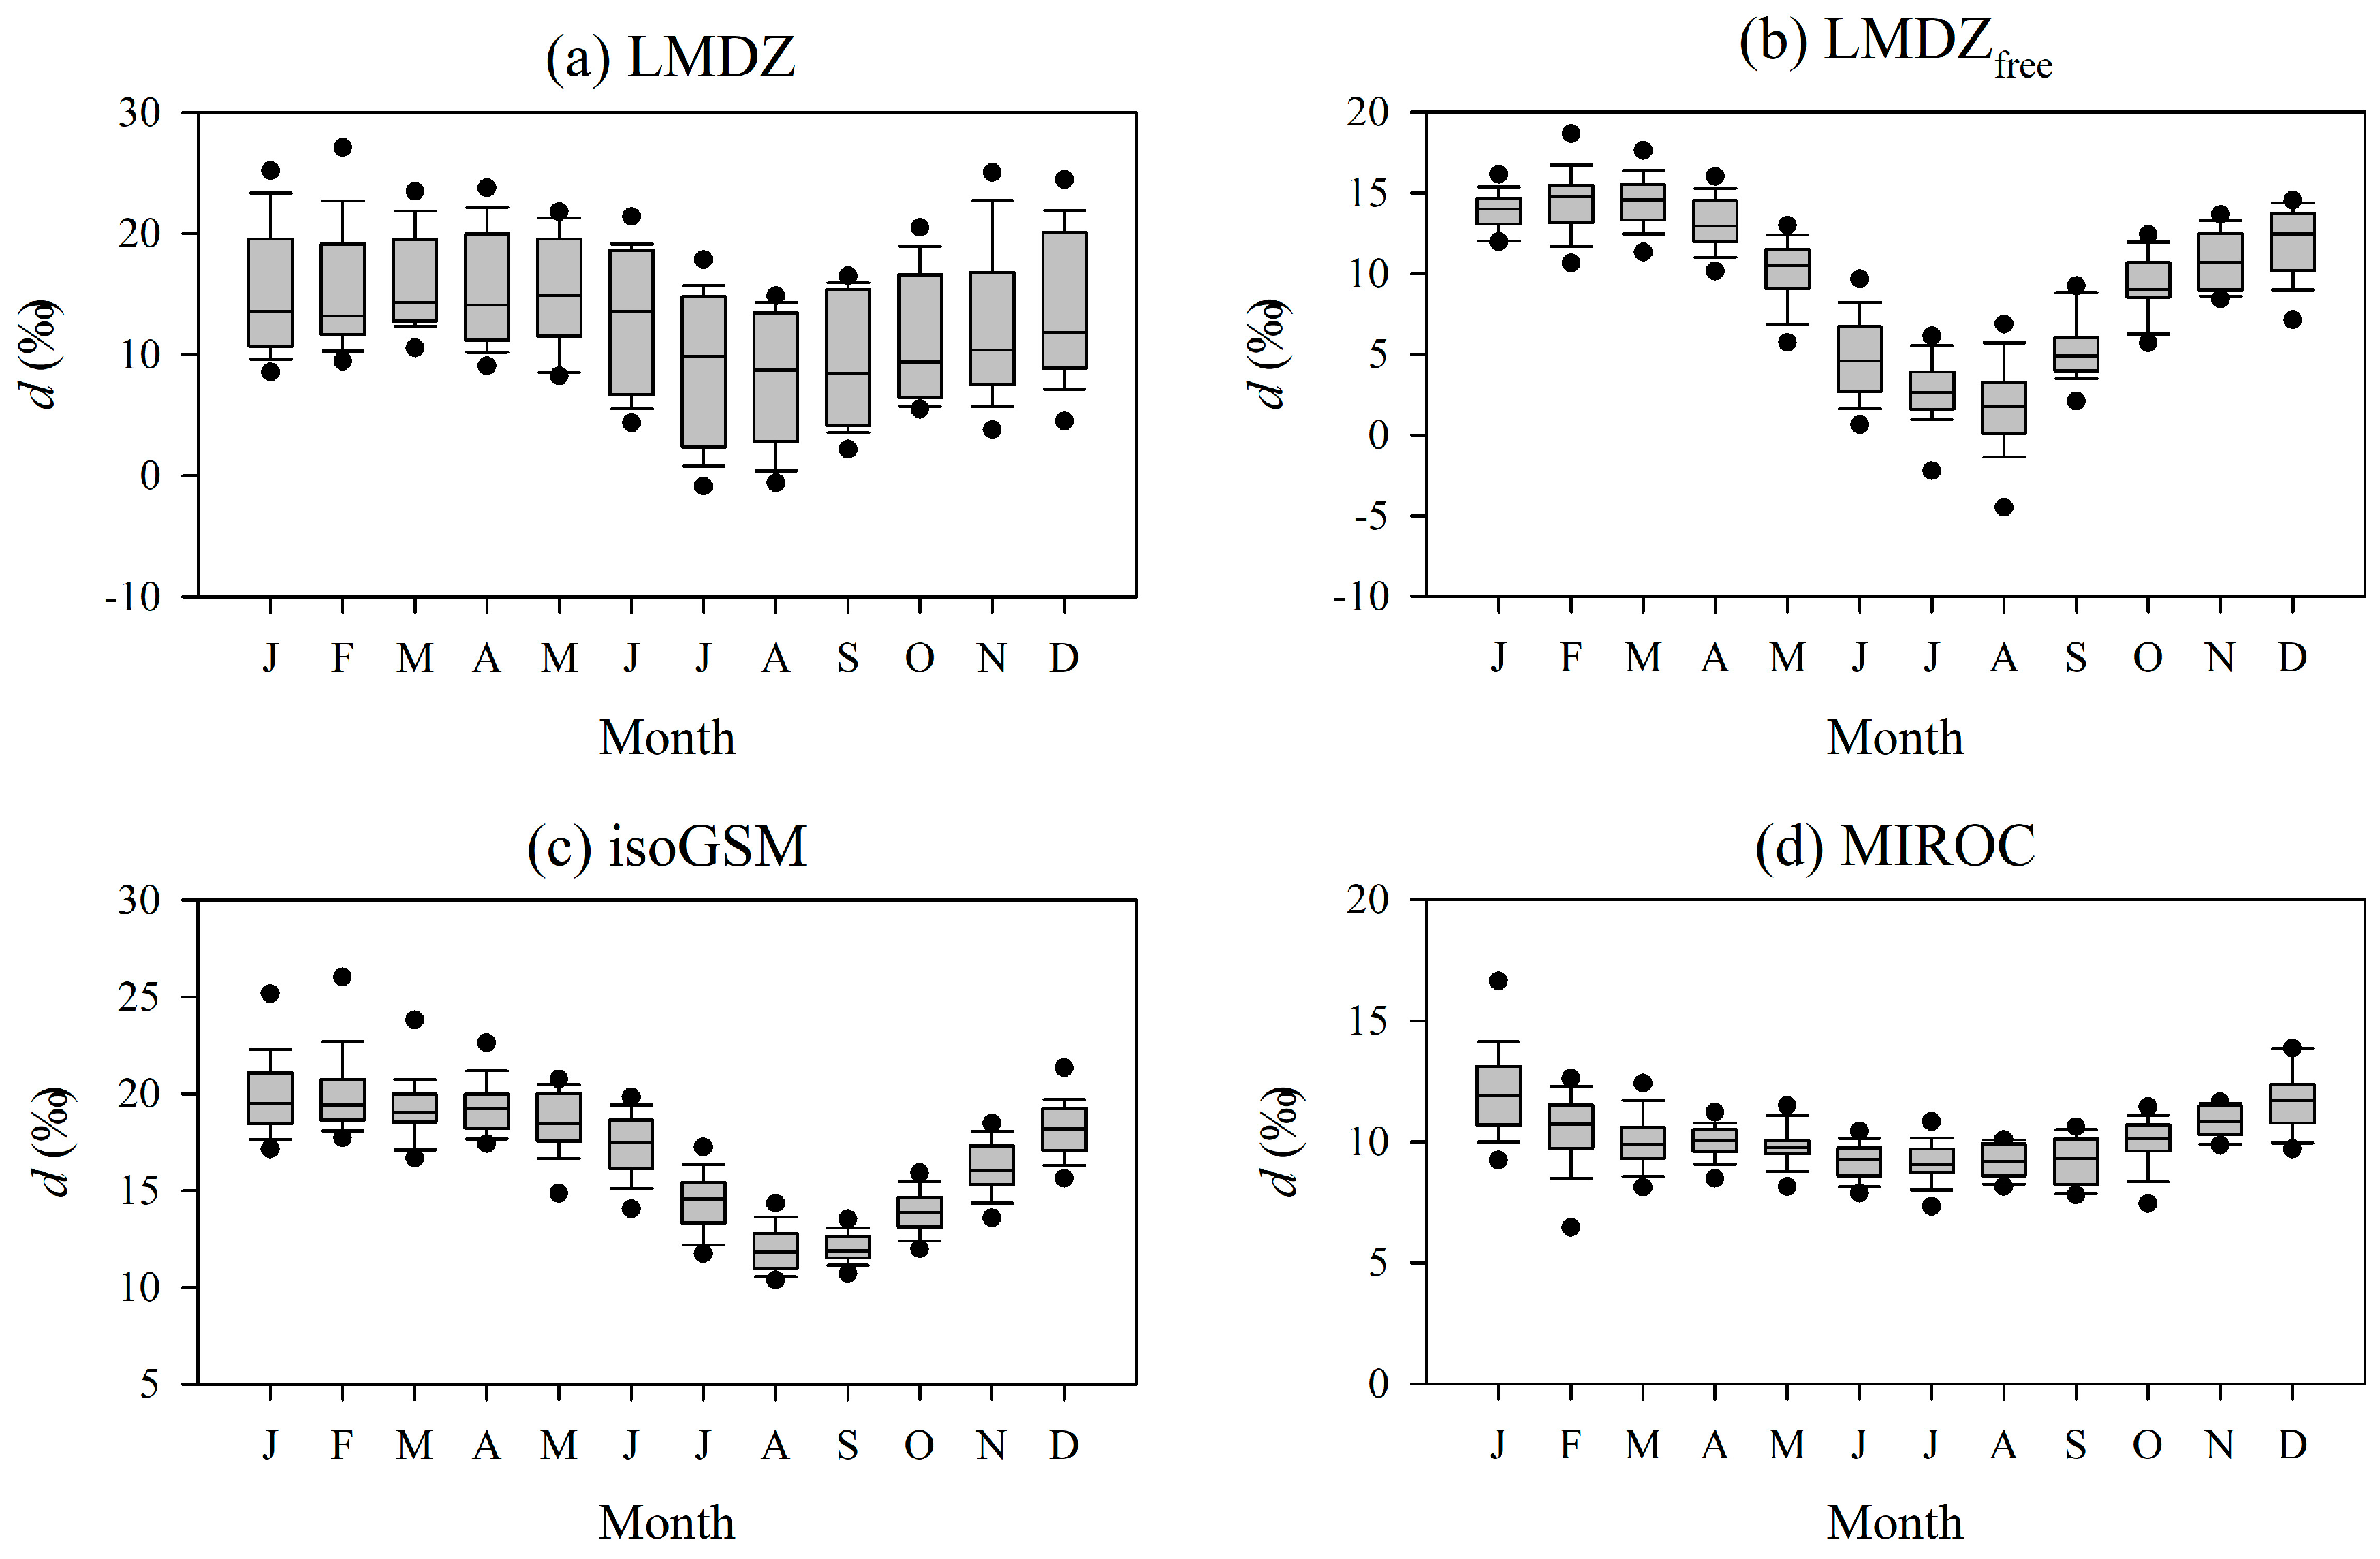
Four simulations of isotope-enabled GCMs are shown in Figure 3, including LMDZ, LMDZfree, isoGSM and MIROC. Although a slight fluctuation in d value can be seen, the mean levels in the wet season are usually lower than that in the dry season, which is consistent with the observed results in this study. It should be mentioned that it is still necessary to improve the accuracy of isotope-enabled GCMs in China, because the differences do exist among these models.
Air temperature and vapor pressure influence the re-evaporation of the falling raindrops, affecting the isotopic signature in precipitation [45,46,47]. According to event-based samples collected in this region, d value is usually negatively correlated with local air temperature and vapor pressure (Table 3). This shows that d value in precipitation in a warm and humid environment is lower than that in a cold and dry environment. The δ2H value during the wet season was higher than that during the dry season at the four stations from 2011 to 2014. The local meteoric water line (LMWL) slopes during the wet season were lower than those during the dry season. The d value increased during the dry season, showing that a large amount of water vapor from local evaporation mixes with the westerly air masses and then impacts the study region [48,49]. Similar correlations are also presented using the GNIP Lanzhou station in Figure S2 in Supplementary Material.
3.2. Stable Isotopes and Circulation Background
The climate regime in China is greatly influenced by monsoon moisture from the Indian and East Asia monsoons. Winter monsoon in China weakens from mid-February to mid-April, and strengthens from mid-September to early December; in contrast, summer monsoon starts and strengthens from mid-April to mid-June, and weakens from mid-August to mid-September. Although the study region lies at the monsoon margin, the monsoon moisture does play a vital role in local precipitation and water resources. To understand the circulation background relating to stable isotopes in precipitation, here, we applied the HYSPLIT model to calculate the backward trajectory to the Lanzhou city for each precipitation event.
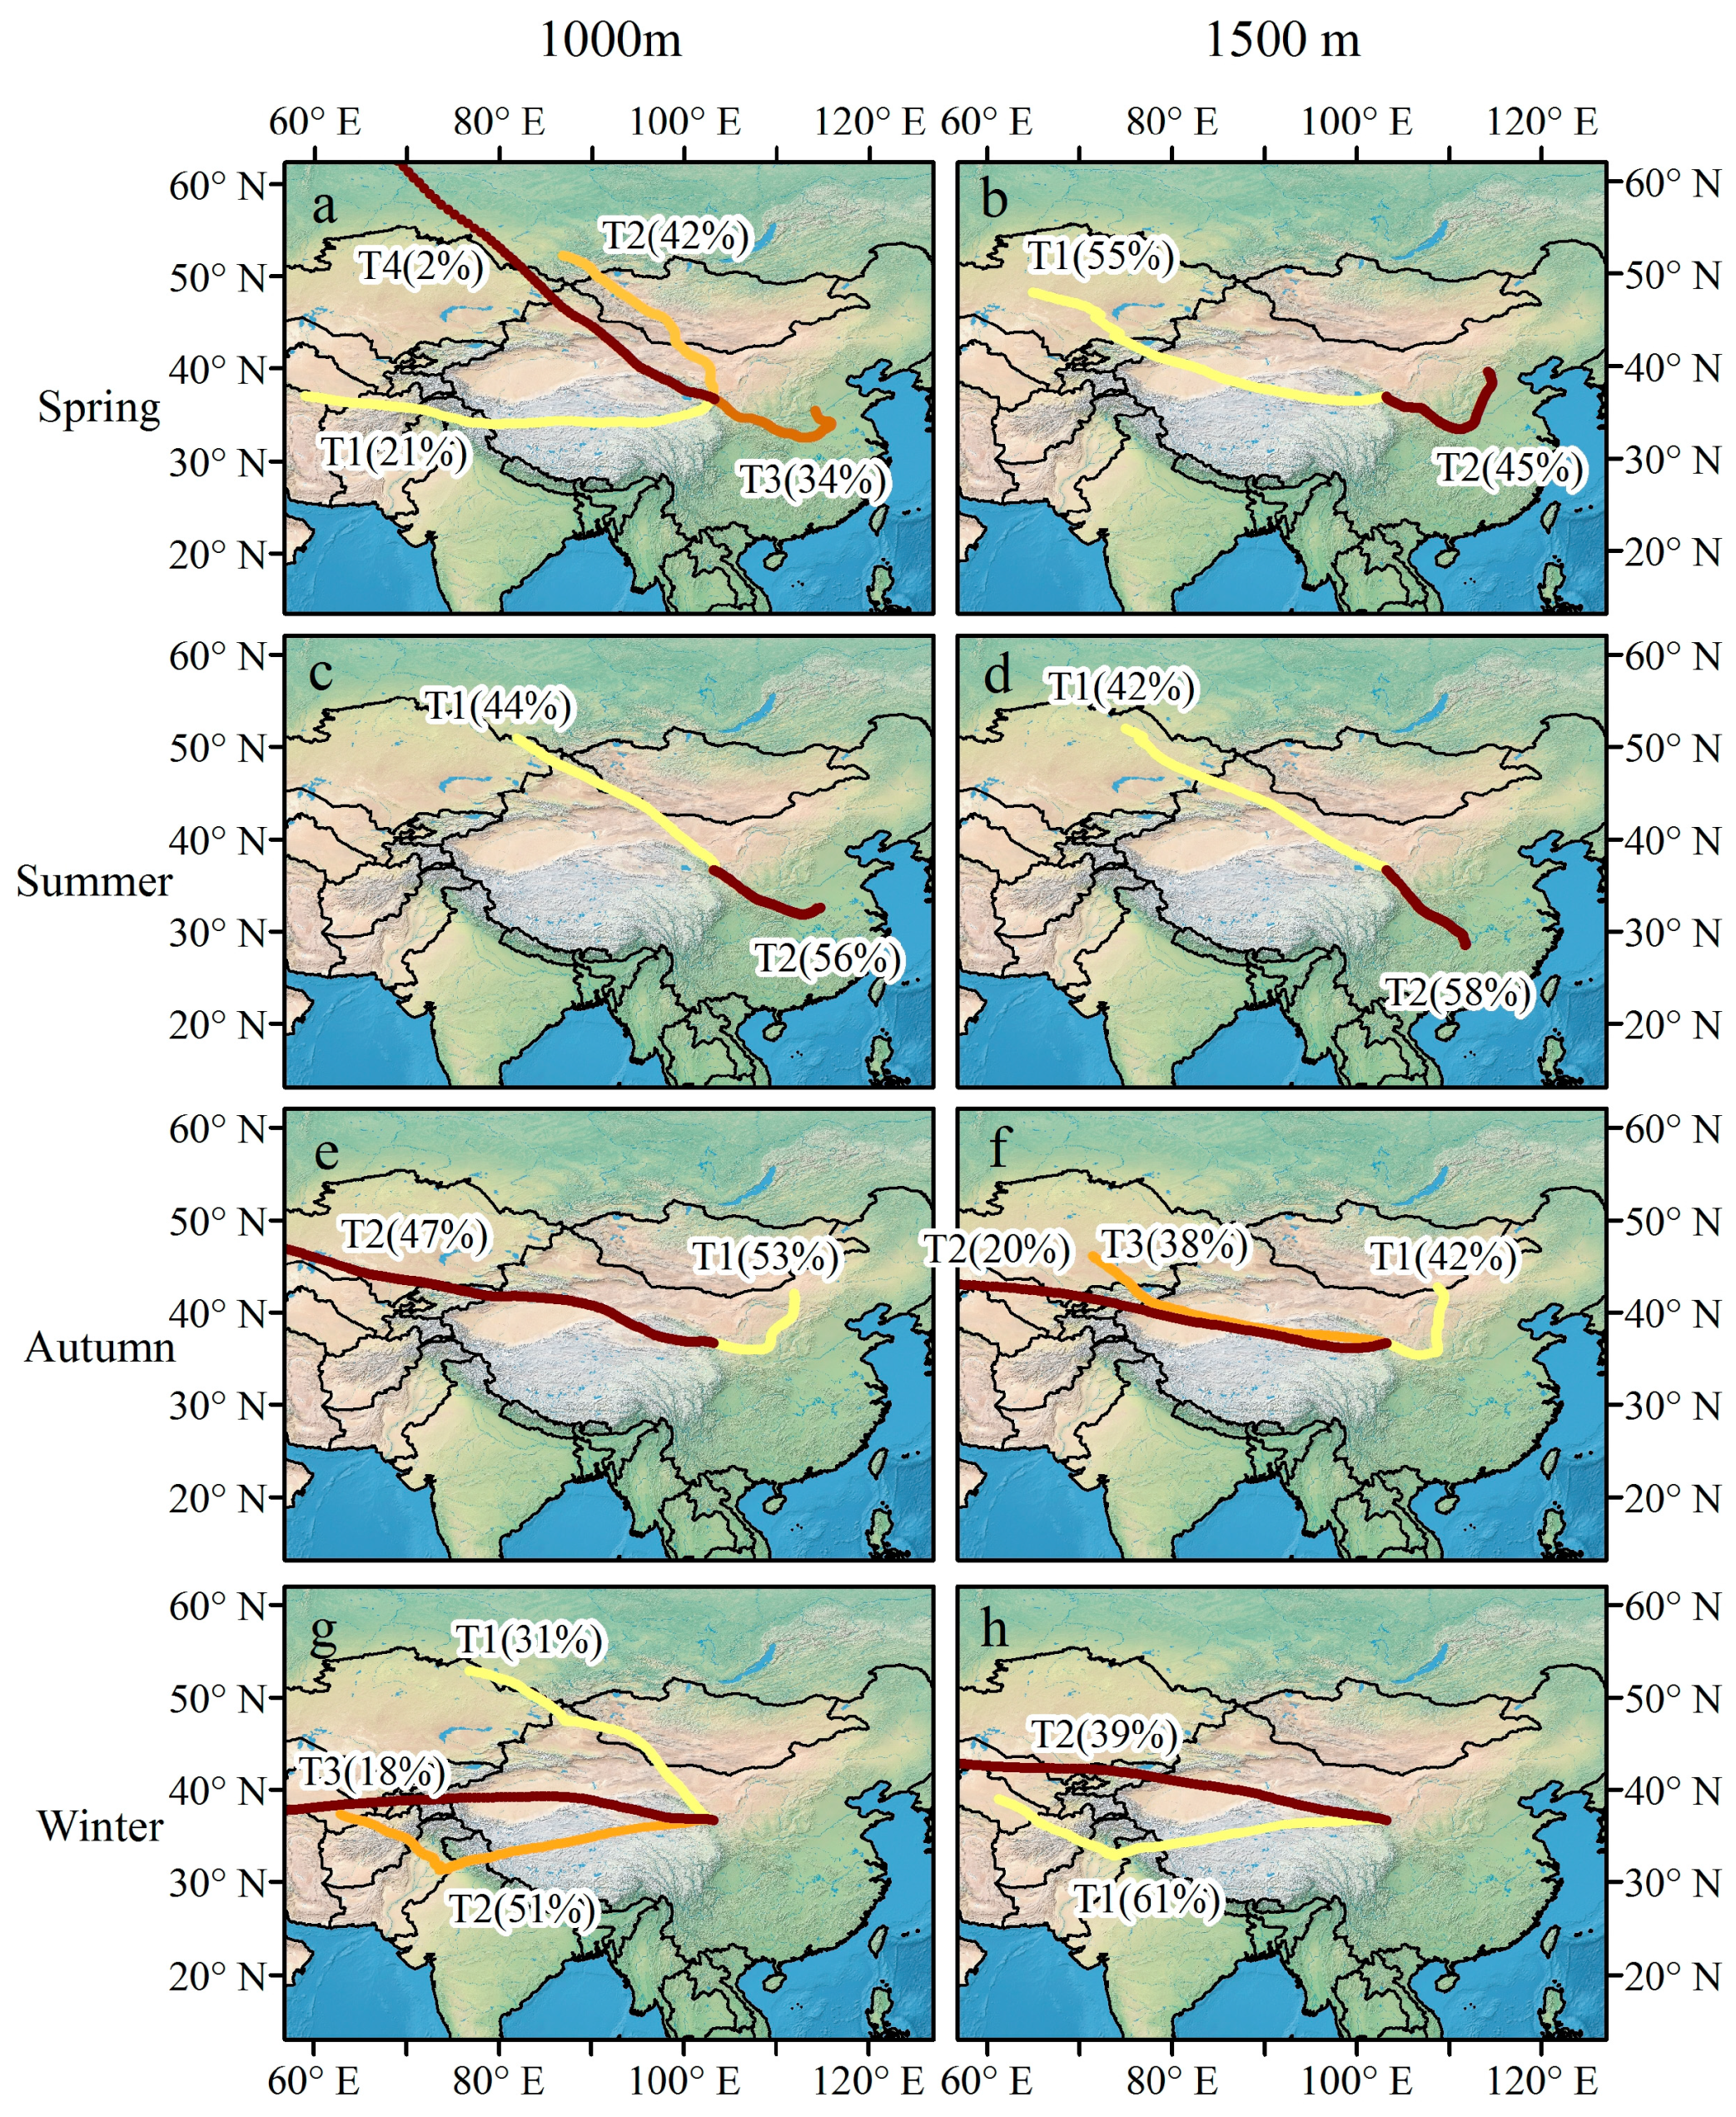
The backward trajectories for the four seasons (March to May as spring, June to August as summer, September to November as autumn, and December to February as winter) from 2011 to 2014 are shown in Figure 4. Two different target altitudes—i.e., 1000 (Figure 4a,c,e,g) and 1500 m (Figure 4b,d,f,h)—are involved. To identify the main paths to the study region, we applied a cluster mean method incorporated into the HYSPLIT model. Since summer precipitation trajectories account for 53% in total, we firstly focused on the cluster mean in summer. Precipitation paths can be generally attributed into two directions—i.e., the northwest (T1 in Figure 4c,d; in yellow) and southeast (T2 in Figure 4c,d; in brown)—the southeast direction accounts for a slightly higher proportion than the northwest; although different target heights were calculated here, there is no significant difference in Figure 4c,d, and the southeast trajectories account for 56% and 58% for 1000 and 1500 m, respectively. Summer monsoon carries abundant moisture, which greatly contributes to the local precipitation. On the contrary, the contribution of the westerly trajectory to the summer precipitation is logically lower. The variations of the stable water isotopes in precipitation mentioned above and in previous reports [33], together with the advance and retreat period of monsoon, indicate the existence of a long-distance monsoon moisture transport to the Lanzhou city.
The shift of moisture sources may cause variability in d value in precipitation. In spring (Figure 4a,b), the spatial pattern was generally similar to that in summer, but the contribution from the southeast path was much smaller; for example, for the target height of 1000 m, the contributions in spring and summer were 34% and 56%, respectively. In autumn (Figure 4e,f), as the monsoon retreated, the moisture trajectory via the southeast path became weak. In winter (Figure 4g,h), the monsoon moisture via the southeast direction could not be detected in the clustered trajectories, and the westerlies were considered as the dominant moisture paths; because of the low moisture loading in westerlies mass, the precipitation in winter is generally limited.
We also calculated the clustered trajectories for each year from 2011 to 2014 (Figures S3–S6 in Supplementary Material): the results are generally consistent with the above findings.
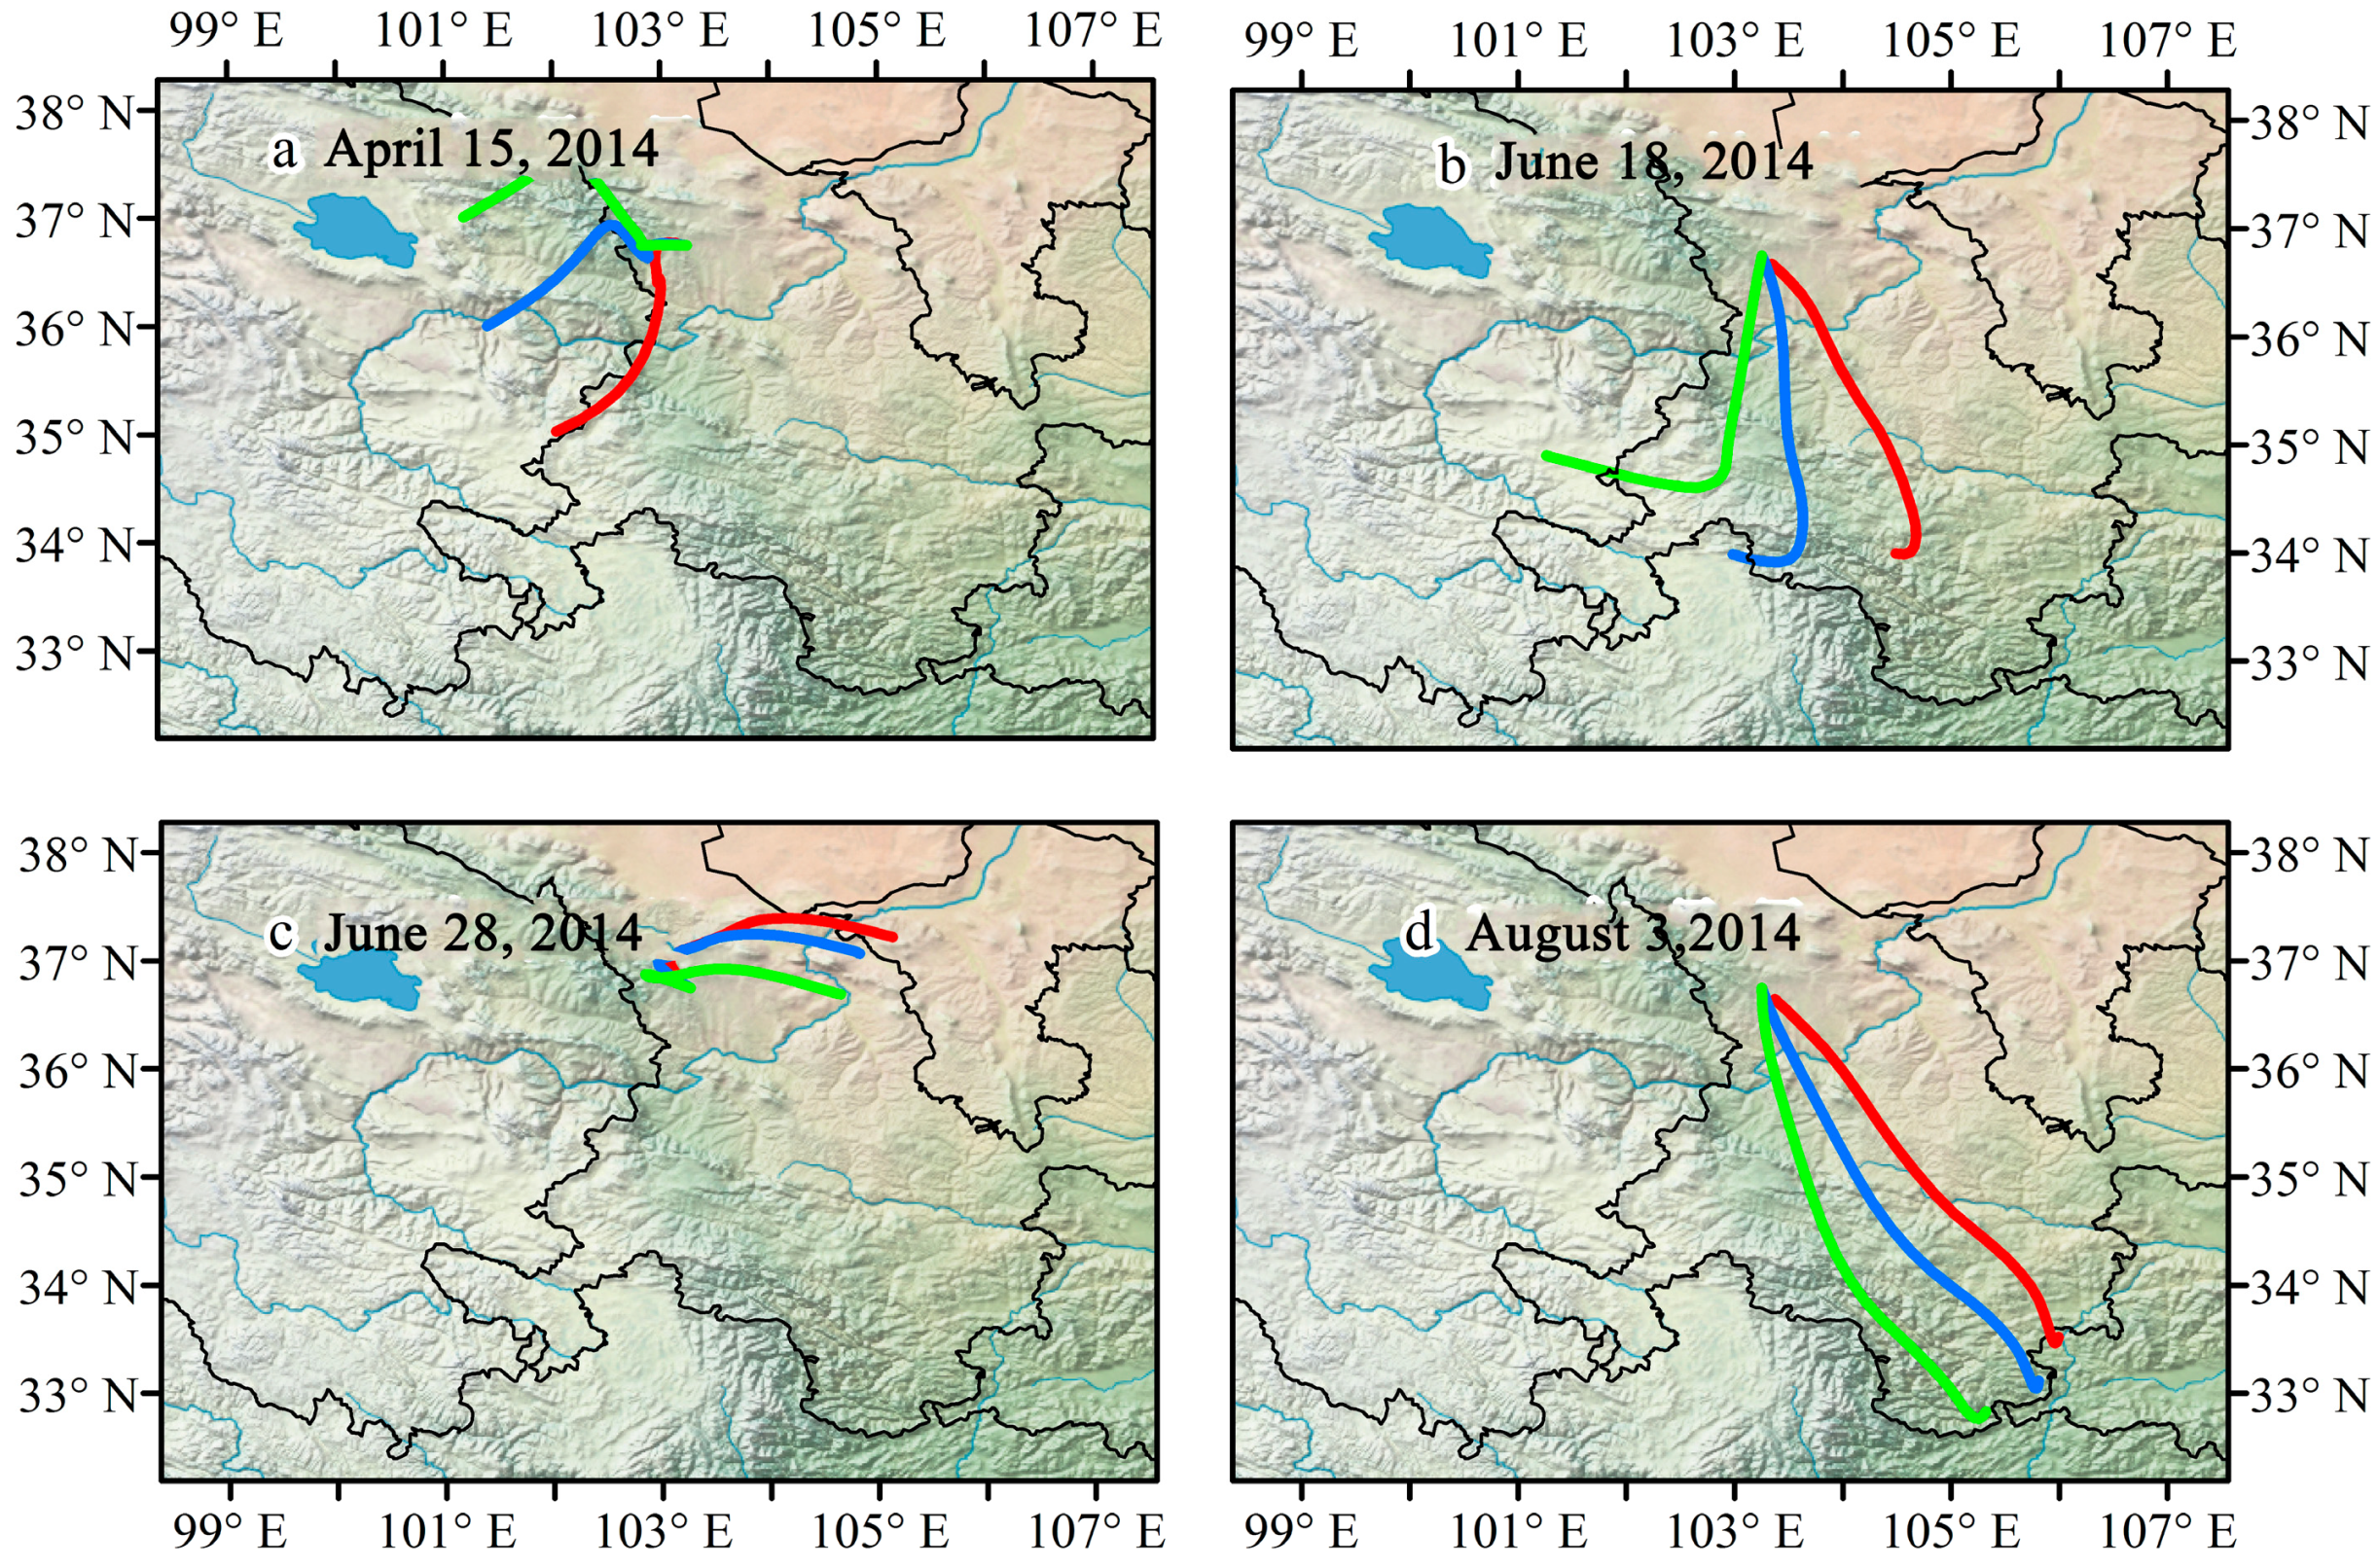
Usually, as the precipitating air mass transports, the stable hydrogen and oxygen isotopes present a depleting trend due to the rainout effect [9]; however, this is not always true for a specific small domain. Here, we analyzed four typical sequentially rainfalls in April, June and August in 2014 without negative trends [33]. The water vapor paths before the four typical events provide a spatial perspective to identify the linkage between isotopic variability and moisture transport. Figure 5 shows the 24-h backward trajectories in which the green, blue and red lines denote the target heights of 500, 1000 and 1500 m, respectively. The slightly different air mass trajectories for the three heights may also impact the fractionation of stable isotopes in precipitation, although the moisture paths are generally similar for different heights. Taking August 3rd, 2014 as an example, the closer to the ground the air mass was, the further south the trajectory extended, and the farther from the ground the air mass was, the further east the trajectory was.
3.3. Stable Isotopes and Water Vapor Transport
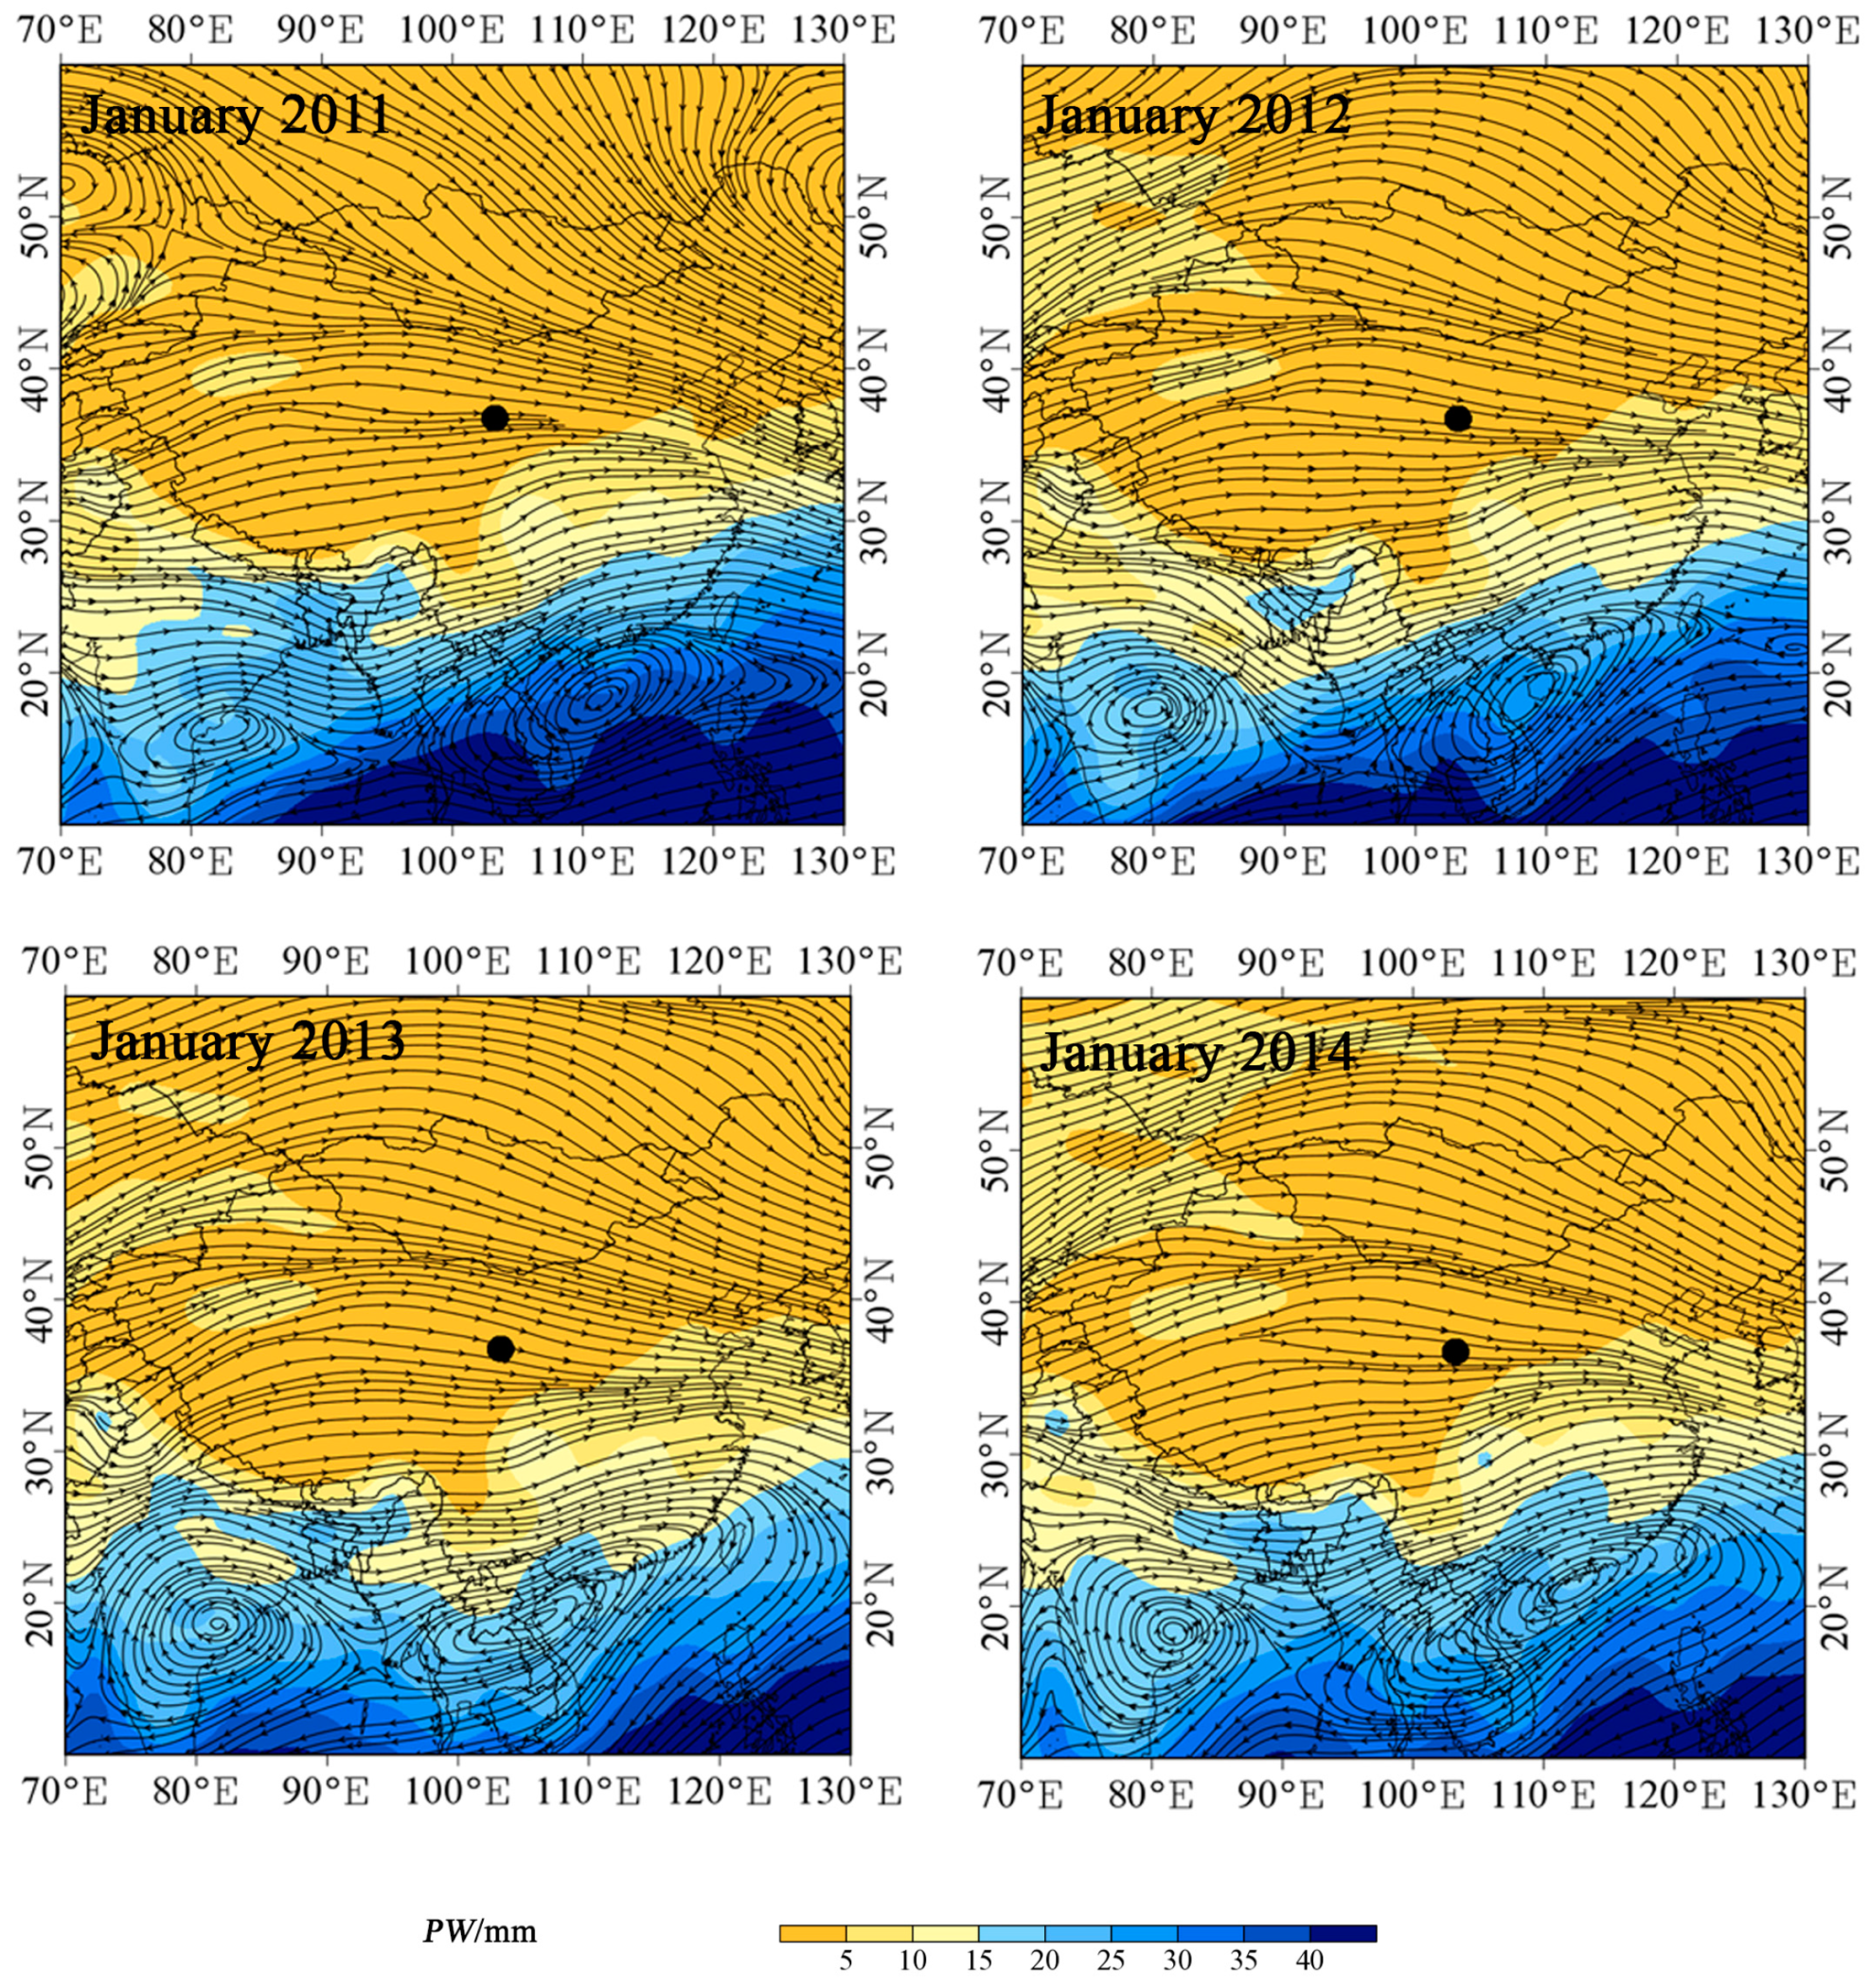
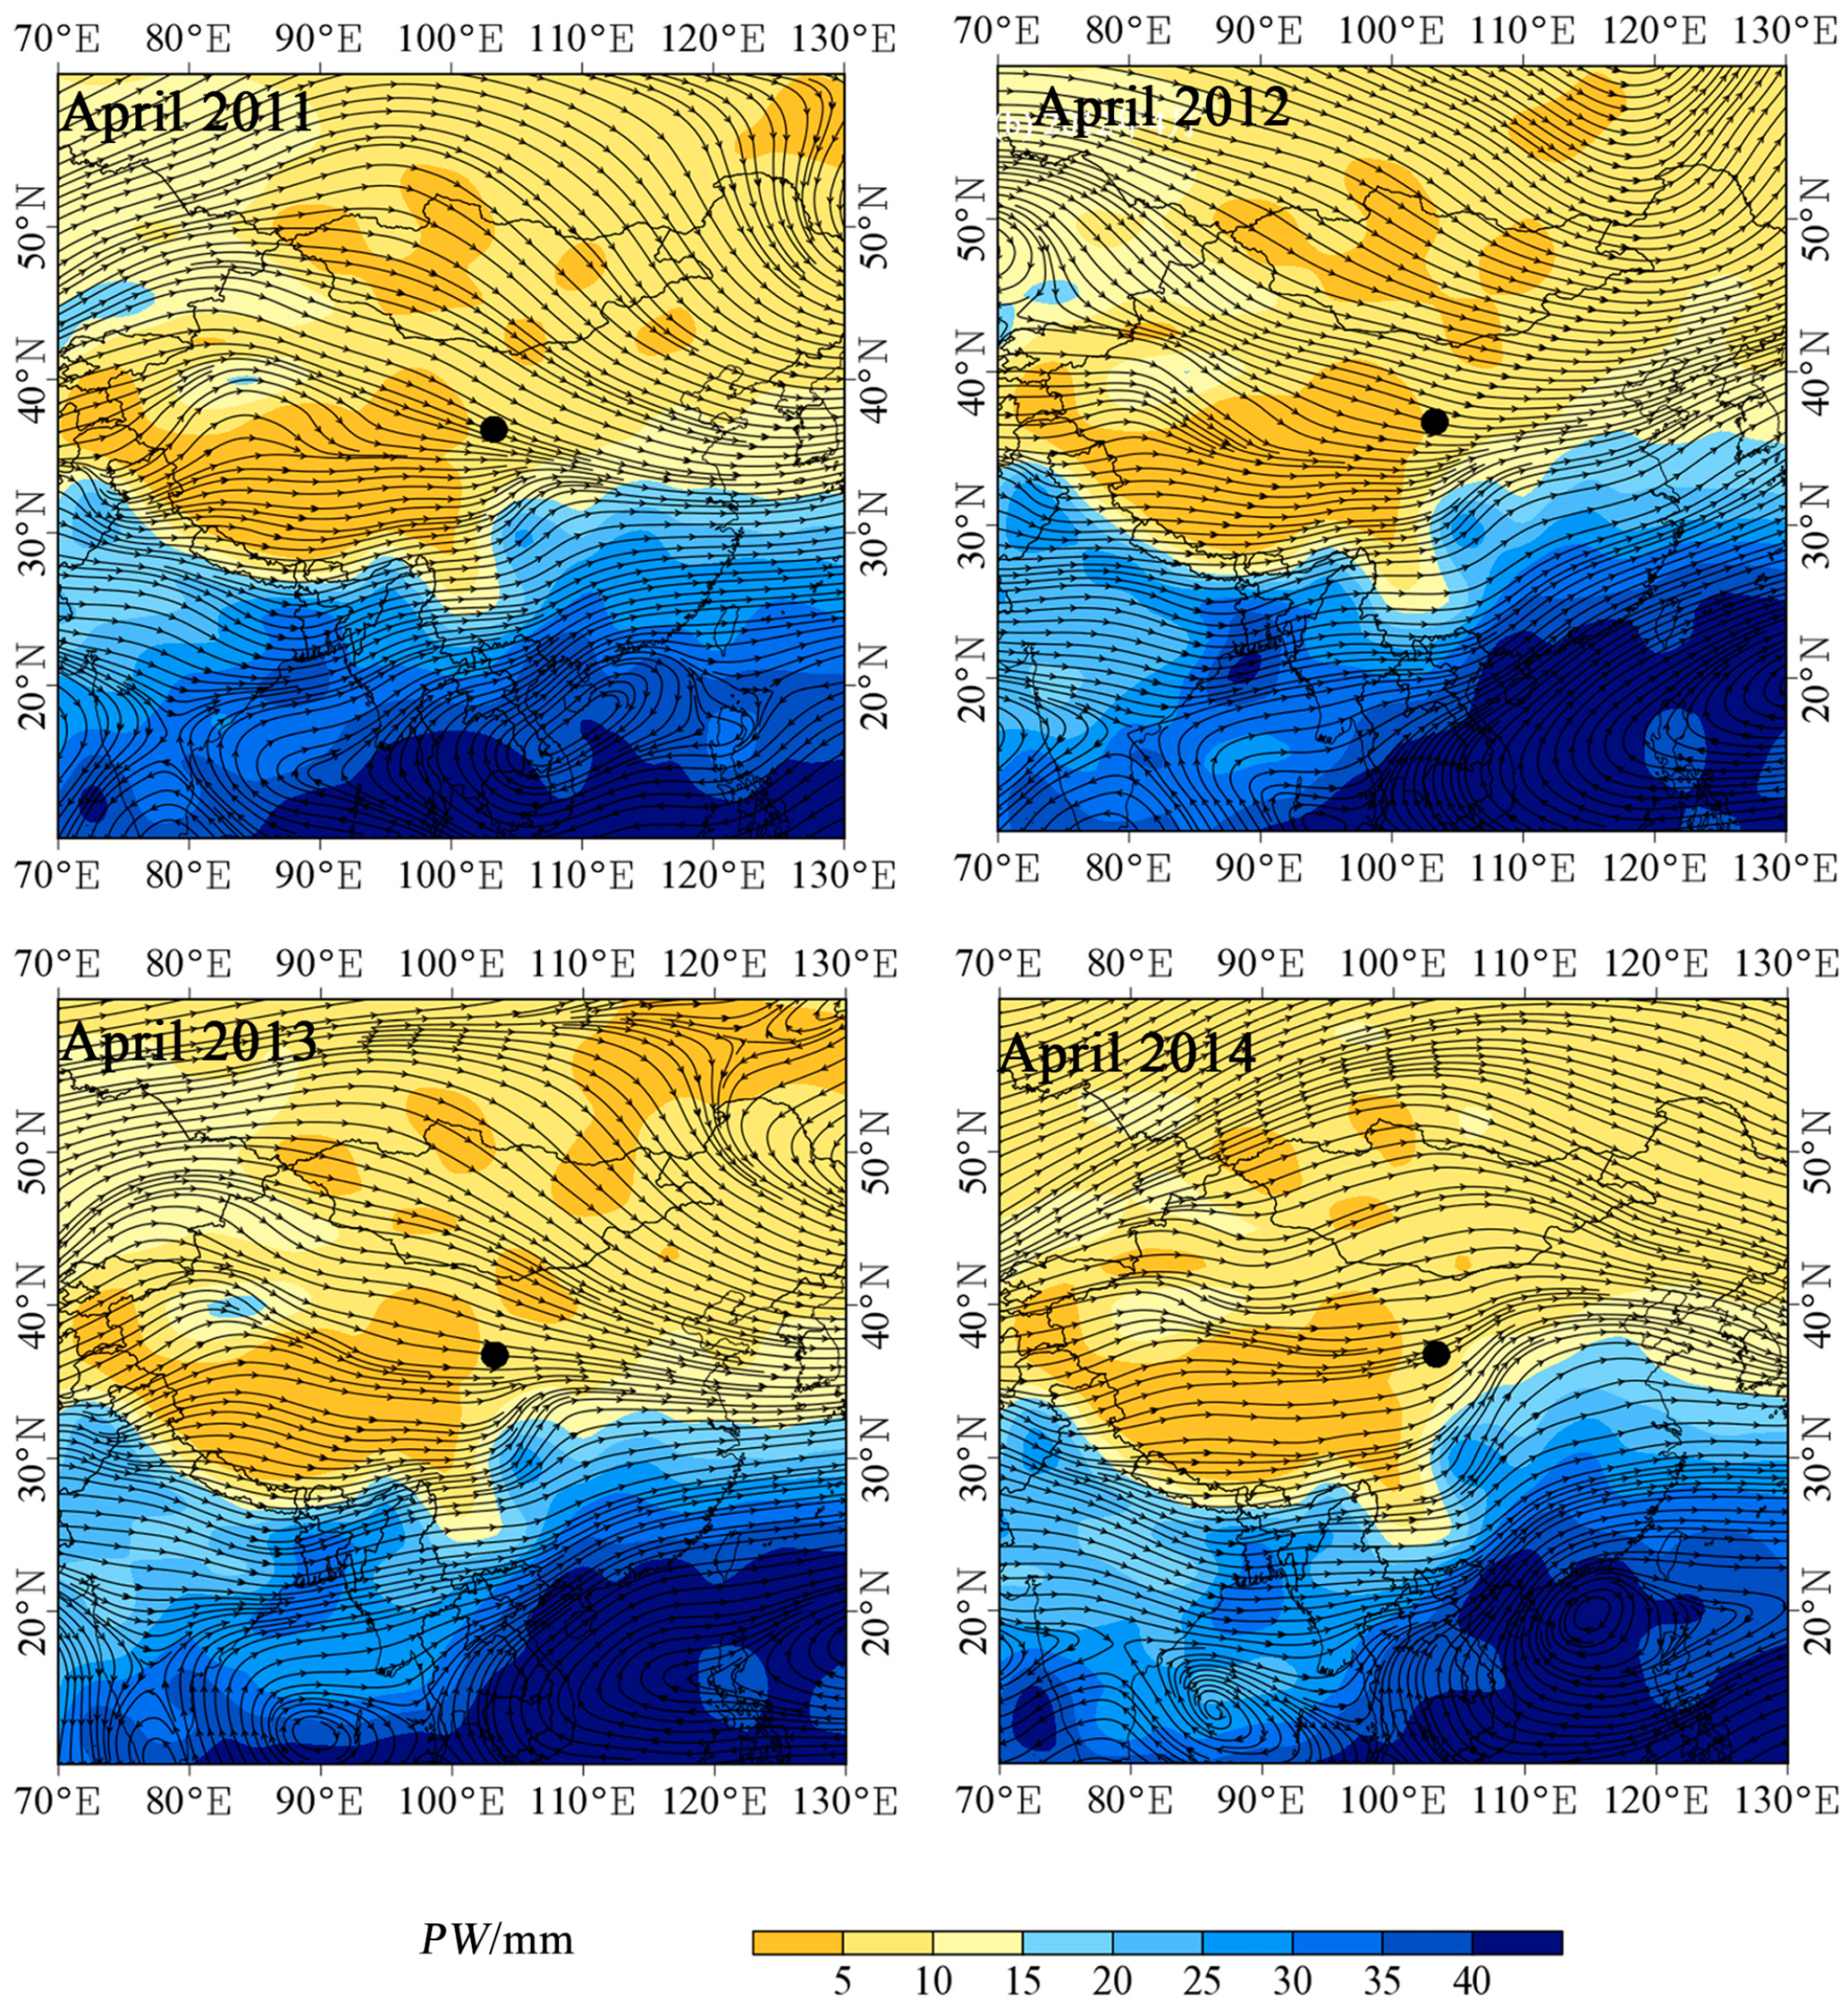
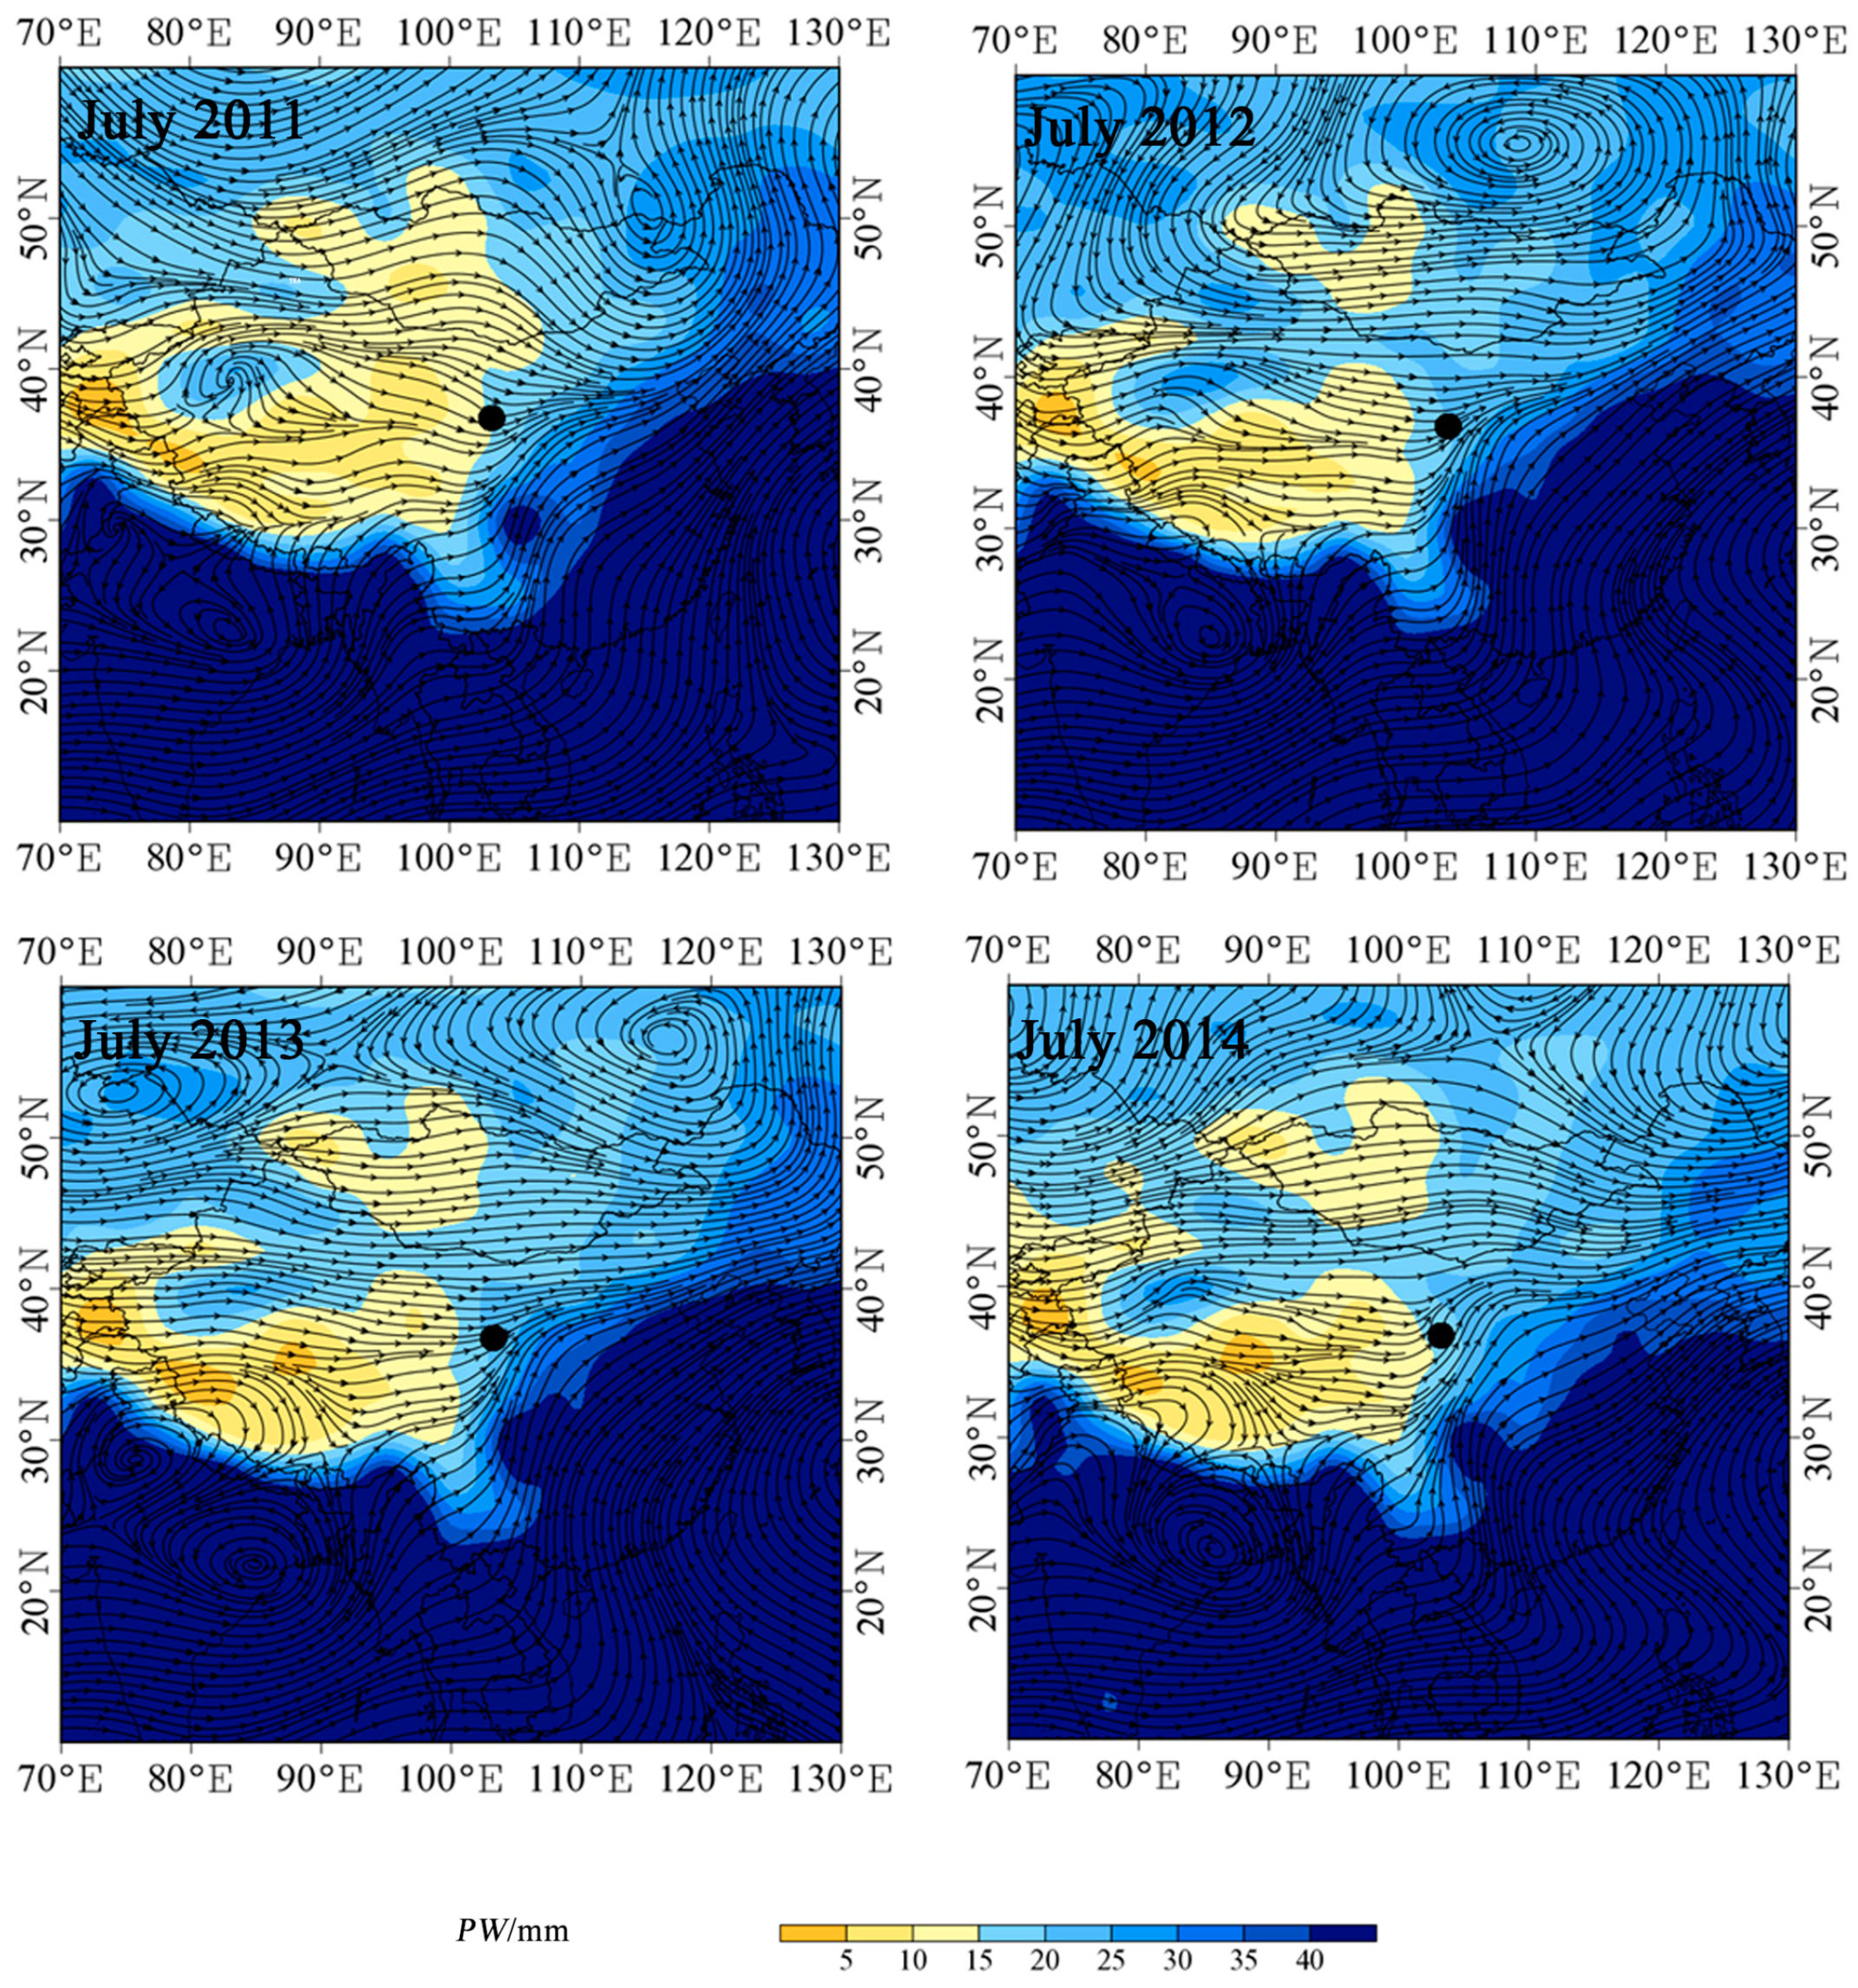
The precipitable water (PW) and water vapor stream can be used to identify the moisture transport, which is different from the HYSPLIT model in that the water loadings in the air are not well considered. Here, we calculated precipitable water and water vapor stream from the surface to the 300 hPa isobaric level during the four seasons during 2011–2014 based on the global reanalysis (Figure 6, Figure 7, Figure 8, and Figure 9). Although the water vapor stream presented generally similar patterns—i.e., from the west to the east—the precipitable water amount showed spatial incoherence for each season. Different from other seasons, the monsoon moisture could be greatly delivered to the study region in summer, which can be easily seen in Figure 8. The westerlies mass is associated to the high values of d in winter. The seasonal characteristics of water vapor stream are related to the seasonal variations of stable isotope compositions in precipitation.
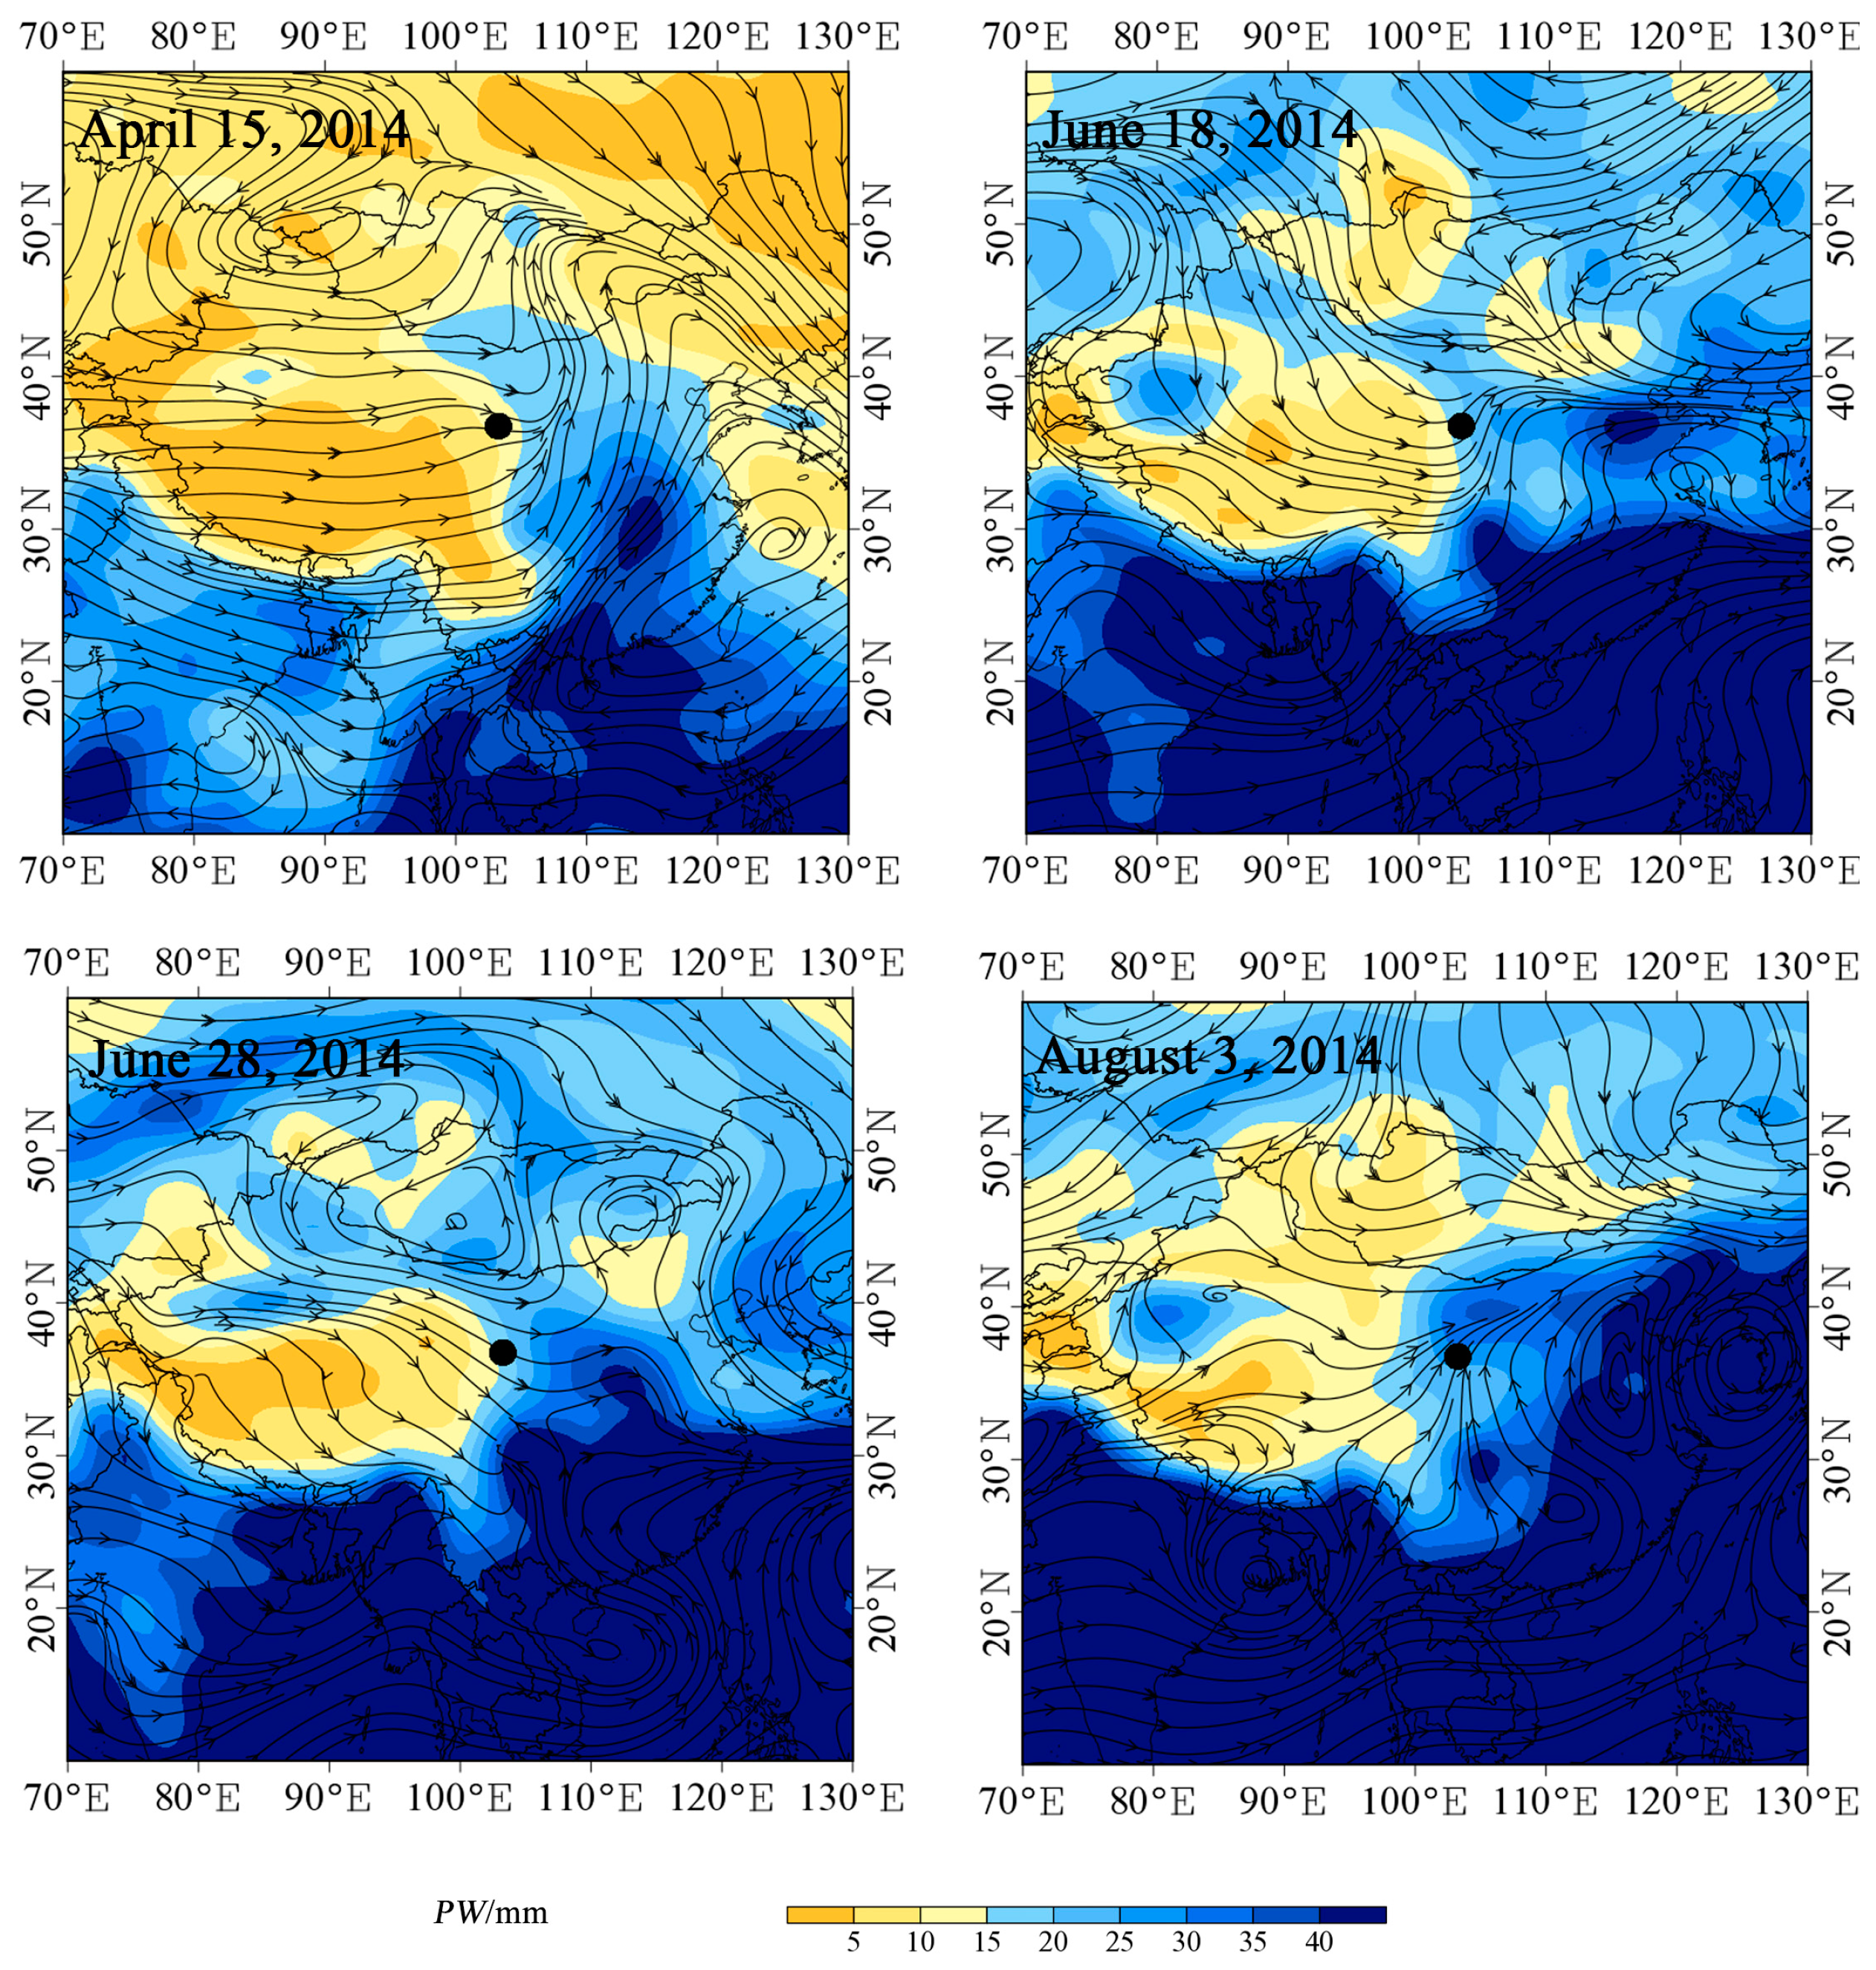
We also examined the water vapor streamline for the four events mentioned in Section 3.2 (Figure 10). Compared to Figure 5 showing the backward trajectories, the moisture diagnosed moisture transport in Figure 10 generally exhibited similar but slightly different information. For example, in August 3rd, 2014 (Figure 5d and Figure 10d), the two methods exhibited a very similar pattern that moisture is delivered from the southeastern direction; however, in other cases—in Figure 5 and Figure 10 —the dominant directions were not always the same, indicating the air mass transport cannot always be treated as moisture transport.
4. Conclusions
The spatial incoherence and seasonal variability in d value in precipitation provide a useful method to understand regional moisture sources. Here, we presented a case study at the monsoon margin, and investigated the d value in precipitation as well as the possible linkage to water vapor sources. In the study region, the regional mean d value is 11.0‰ in the dry season and 8.0‰ in the wet season, respectively. The d value in precipitation usually presents a negative correlation with local air temperature and vapor pressure. The low d value during the wet season generally coincides with the high values in air temperature and water vapor pressure, and is influenced by the monsoon moisture transported from long distances. During the dry season, the continental air masses lead to a relatively dry background and higher d value in precipitation, which is also consistent with the strong below-cloud evaporation under dry conditions. The Lagrangian method was applied to diagnose the air backward trajectory, and the water vapor flow was used to identify the moisture transport. The moisture regimes based on reanalysis data are generally consistent with the findings using the stable isotopic approach in the study, and the monsoon moisture is highlighted in summer precipitation at these monsoon margin sites.
Supplementary Materials
The following are available online at https://www.mdpi.com/2073-4441/12/12/3315/s1, Figure S1: Variation of monthly d value at the GNIP Lanzhou station. Figure S2: Correlations between d value and air temperature (a) or water vapor pressure (b) at the GNIP Lanzhou station. Figure S3: Clustered backward trajectories during different seasons to the Lanzhou city in 2011. Figure S4: Clustered backward trajectories during different seasons to the Lanzhou city in 2012. Figure S5: Clustered backward trajectories during different seasons to the Lanzhou city in 2013. Figure S6: Clustered backward trajectories during different seasons to the Lanzhou city in 2014.
Author Contributions
Conceptualization, M.Z.; Software, F.C.; Validation, F.C.; Formal analysis, F.C.; Investigation, F.C.; Methodology, S.W. and A.A.A.; Resources, X.Z. and X.L.; Data curation, F.C.; Writing—original draft preparation, F.C.; Writing—review and editing, F.C. and M.Z.; Supervision, M.Z.; Funding acquisition, M.Z. All authors have read and agreed to the published version of the manuscript.
Funding
The research is supported by the National Natural Science Foundation of China (No. 41771035, 42071047), the Scientific Research Program of Higher Education Institutions of Gansu Province (2018C-02) and the Northwest Normal University (NWNU-LKQN-16-17).
Acknowledgments
The authors thank the meteorological bureaus for their help in sampling.
Conflicts of Interest
The authors declare no conflict of interest. The work described here has not been submitted elsewhere for publication, in whole or in part, and all the authors listed have approved the manuscript that is enclosed.
References
- Falkenmark, M.; Wang-Erlandsson, L.; Rockström, J. Understanding of water resilience in the Anthropocene. J. Hydrol. 2019, 2, 100009. [Google Scholar] [CrossRef]
- Konapala, G.; Mishra, A.K.; Wada, Y.; Mann, M.E. Climate change will affect global water availability through compounding changes in seasonal precipitation and evaporation. Nat. Commun. 2020, 11, 3044. [Google Scholar] [CrossRef] [PubMed]
- Oki, T.; Kanae, S. Global hydrological cycles and world water resources. Science 2006, 313, 1068–1072. [Google Scholar] [CrossRef] [PubMed] [Green Version]
- Papalexiou, S.M.; Montanari, A. Global and regional increase of precipitation extremes under global warming. Water Resour. Res. 2019, 55, 4901–4914. [Google Scholar] [CrossRef]
- Giorgi, F.; Raffaele, F.; Coppola, E. The response of precipitation characteristics to global warming from climate projections. Earth Syst. Dyn. 2019, 10, 73–89. [Google Scholar] [CrossRef] [Green Version]
- Aggarwal, P.K.; Romatschke, U.; Araguas-Araguas, L.; Belachew, D.; Longstaffe, F.J.; Berg, P.; Schumacher, C.; Funk, A. Proportions of convective and stratiform precipitation revealed in water isotope ratios. Nat. Geosci. 2016, 9, 624–629. [Google Scholar] [CrossRef] [Green Version]
- Allen, S.T.; Jasechko, S.; Berghuijs, W.R.; Welker, J.M.; Goldsmith, G.R.; Kirchner, J.W. Global sinusoidal seasonality in precipitation isotopes. Hydrol. Earth Syst. Sci. 2019, 23, 3423–3436. [Google Scholar] [CrossRef] [Green Version]
- Zhang, M.; Wang, S. A review of precipitation isotope studies in China: Basic pattern and hydrological process. J. Geogr. Sc. 2016, 26, 921–938. [Google Scholar] [CrossRef]
- Dansgaard, W. Stable isotopes in precipitation. Tellus 1964, 16, 436–468. [Google Scholar] [CrossRef]
- Bershaw, J. Controls on deuterium excess across Asia. Geosciences 2018, 8, 257. [Google Scholar] [CrossRef] [Green Version]
- Salamalikis, V.; Argiriou, A.A.; Dotsika, E. Isotopic modeling of the sub-cloud evaporation effect in precipitation. Sci. Total Environ. 2016, 544, 1059–1072. [Google Scholar] [CrossRef] [PubMed]
- Vreča, P.; Krajcar Bronić, I.; Horvatinčić, N.; Barešić, J. Isotopic characteristics of precipitation in Slovenia and Croatia: Comparisom of continental and maritime stations. J. Hydrol. 2006, 330, 457–469. [Google Scholar] [CrossRef]
- Krajcar Bronić, I.; Barešić, J.; Borković, D.; Sironić, A.; Lovrenčić Mikelić, I.; Vreča, P. Long-Term Isotope Records of Precipitation in Zagreb, Croatia. Water 2020, 12, 226. [Google Scholar] [CrossRef] [Green Version]
- Gimeno, L.; Stohl, A.; Trigo, R.M. Oceanic and terrestrial sources of continental precipitation. Rev. Geophys. 2012, 50, RG4003. [Google Scholar] [CrossRef]
- Wang, S.; Zhang, M.; Che, Y.; Chen, F.; Qiang, F. Contribution of recycled moisture to precipitation in oases of arid central Asia: A stable isotope approach. Water Resour. Res. 2016, 52, 3246–3257. [Google Scholar] [CrossRef] [Green Version]
- Zhu, X.; Wu, T.; Hu, G.; Wang, S.; Wu, X.; Li, R.; Wang, W.; Wen, A.; Ni, J.; Li, X.; et al. Long-distance atmospheric moisture dominates water budget in permafrost regions of the Central Qinghai-Tibet plateau. Hydrol. Process. 2020, 34, 4280–4294. [Google Scholar] [CrossRef]
- Crawford, J.; Hughes, C.E.; Parkes, S.D. Is the isotopic composition of event based precipitation driven by moisture source or synoptic scale weather in the Sydney Basin, Australia. J. Hydrol. 2013, 507, 213–226. [Google Scholar] [CrossRef]
- Breitenbach, S.F.; Adkins, J.F.; Meyer, H.; Marwan, N.; Kumar, K.K.; Haug, G.H. Strong influence of water vapor source dynamics on stable isotopes in precipitation observed in Southern Meghalaya, NE India. Earth Planet. Sci. Lett. 2010, 292, 212–220. [Google Scholar] [CrossRef]
- Bagheri, R.; Bagheri, F.; Karami, G.H.; Jafari, H. Chemo-isotopes (18O & 2H) signatures and HYSPLIT model application: Clues to the atmospheric moisture and air mass origins. Atmos. Environ. 2019, 215, 116892. [Google Scholar]
- Bedaso, Z.; Wu, S.Y. Daily precipitation isotope variation in Midwestern United States: Implication for hydroclimate and moisture source. Sci. Total Environ. 2020, 713, 136631. [Google Scholar] [CrossRef]
- Pang, H.; He, Y.; Zhang, Z.; Lu, A.; Gu, J. The origin of summer monsoon rainfall at New Delhi by deuterium excess. Hydrol. Earth Syst. Sci. 2004, 8, 115–118. [Google Scholar] [CrossRef] [Green Version]
- Pfahl, S.; Sodemann, H. What controls deuterium excess in global precipitation. Clim. Past. 2014, 10, 771–781. [Google Scholar] [CrossRef] [Green Version]
- Juhlke, T.R.; Meier, C.; van Geldern, R.; Vanselow, K.A.; Wernicke, J.; Baidulloeva, J.; Barth, J.A.C.; Weise, S.M. Assessing moisture sources of precipitation in the Western Pamir Mountains (Tajikistan, Central Asia) using deuterium excess. Tellus B 2019, 71, 1601987. [Google Scholar] [CrossRef] [Green Version]
- Kostrova, S.S.; Meyer, H.; Fernandoy, F.; Werner, M.; Tarasov, P.E. Moisture origin and stable isotope characteristics of precipitation in southeast Siberia. Hydrol. Process. 2020, 34, 51–67. [Google Scholar] [CrossRef] [Green Version]
- Tian, L.; Yao, T.; MacClune, K. Stable isotopic variations in west China: A consideration of moisture sources. J. Geophys. Res. 2007, 112, D10112. [Google Scholar] [CrossRef]
- Du, W.; Kang, S.; Qin, X.; Ji, Z.; Sun, W.; Chen, J. Can summer monsoon moisture invade the Jade Pass in Northwestern China? Clim. Dyn. 2020, 55, 3101–3115. [Google Scholar] [CrossRef]
- Yao, T.; Masson-Delmotte, V.; Gao, J. A review of climatic controls on δ18O in precipitation over the Tibetan Plateau: Observations and simulations. Rev. Geophys. 2013, 51, 525–548. [Google Scholar] [CrossRef]
- Liu, J.; Song, X.; Sun, X. Isotopic composition of precipitation over Arid Northwestern China and its implications for the water vapor origin. J. Geophys. Sci. 2009, 19, 164–174. [Google Scholar] [CrossRef]
- Feng, F.; Li, Z.; Zhang, M. Deuterium and oxygen 18 in precipitation and atmospheric moisture in the upper Urumqi River Basin, eastern Tianshan Mountains. Environ. Earth Sci. 2013, 68, 1199–1209. [Google Scholar] [CrossRef]
- Wang, S.; Zhang, M.; Crawford, J.; Hughes, C.E.; Du, M.; Liu, X. The effect of moisture source and synoptic conditions on precipitation isotopes in arid central Asia. J. Geophys. Res. Atmos. 2017, 122, 2667–2682. [Google Scholar] [CrossRef]
- Wang, S.; Du, M.; Zhang, M.; Shi, M.; Jiao, R.; Wang, L. Precipitation isotopes associated with the duration and distance of moisture trajectory in a westerly-dominant setting. Water 2019, 11, 2434. [Google Scholar] [CrossRef] [Green Version]
- Araguás-Araguás, L.; Froehlich, K.; Rozanski, K. Stable isotope composition of precipitation over southeast Asia. J. Geophys. Res. 1998, 103, 28721–28742. [Google Scholar] [CrossRef]
- Chen, F.; Zhang, M.; Wang, S.; Qiu, X.; Du, M. Environmental controls on stable isotopes of precipitation in Lanzhou, China: An enhanced network at city scale. Sci. Total Environ. 2017, 609, 1013–1022. [Google Scholar] [CrossRef] [PubMed]
- Han, T.; Zhang, M.; Wang, S.; Qu, D.; Du, Q. Sub-hourly variability of stable isotopes in precipitation in the marginal zone of East Asian Monsoon. Water 2020, 12, 2145. [Google Scholar] [CrossRef]
- Li, J.J.; Feng, Z.D.; Tang, L.Y. Late Quaternary monsoon patterns on the loess plateau of China. Earth Surf. Proc. Land. 1988, 13, 125–135. [Google Scholar]
- Ma, Q.; Zhang, M.; Wang, S.; Wang, Q.; Liu, W.; Li, F.; Chen, F. An investigation of moisture sources and secondary evaporation in Lanzhou, Northwest China. Environ. Earth Sci. 2014, 71, 3375–3385. [Google Scholar] [CrossRef]
- IAEA/WMO (International Atomic Energy Agency/World Meteorological Organization). Global Network of Isotopes in Precipitation (GNIP). Available online: http://www-naweb.iaea.org/napc/ih/IHS_resources_gnip.html (accessed on 17 January 2020).
- Sturm, C.; Zhang, Q.; Noone, D. An introduction to stable water isotopes in climate models: Benefits of forward proxy modelling for paleoclimatology. Clim. Past 2010, 6, 115–129. [Google Scholar] [CrossRef] [Green Version]
- Risi, C.; Bony, S.; Vimeux, F.; Jouzel, J. Water-stable isotopes in the LMDZ4 general circulation model: Model evaluation for present-day and past climates and applications to climatic interpretations of tropical isotopic records. J. Geophys. Res. Atmos. 2010, 115, D12118. [Google Scholar] [CrossRef] [Green Version]
- Yoshimura, K.; Frankenberg, C.; Lee, J.; Kanamitsu, M.; Worden, J.; Röckmann, T. Comparison of an isotopic atmospheric general circulation model with new quasi-global satellite measurements of water vapor isotopologues. J. Geophys. Res. Atmos. 2011, 116, D19118. [Google Scholar] [CrossRef] [Green Version]
- Wang, S.; Zhang, M.; Chen, F.; Che, Y.; Du, M.; Liu, Y. Comparison of GCM-simulated isotopic compositions of precipitation in arid central Asia. J. Geogr. Sci. 2015, 25, 771–783. [Google Scholar] [CrossRef] [Green Version]
- Draxler, R.R.; Hess, G.D. An overview of the HYSPLIT_4 modelling system for trajectories, dispersion, and deposition. Aust. Met. Mag. 1998, 47, 295–308. [Google Scholar]
- Kleist, D.T.; Parrish, D.F.; Derber, J.C.; Treadon, R.; Wu, W.; Lord, S. Introduction of the GSI into the NCEP Global Data Assimilation System. Weather Forecast. 2009, 24, 1691–1705. [Google Scholar] [CrossRef] [Green Version]
- Kistler, R.; Kalnay, E.; Collins, W.; Saha, S.; White, G.; Woollen, J.; Chelliah, M.; Ebisuzaki, W.; Kanamitsu, M.; Kousky, V.; et al. The NCEP-NCAR 50-year reanalysis: Monthly means CD-ROM and documentation. B Am. Meteorol. Soc. 2001, 82, 247–268. [Google Scholar] [CrossRef]
- Yao, T.; Masson, V.; Jouzel, J.; Stievenard, M.; Sun, W.; Jiao, K. Relationships between δ18O in precipitation and surface air temperature in the Urumqi River Basin, East Tianshan Mountains, China. Geophys. Res. Lett. 1999, 26, 3473–3476. [Google Scholar]
- Wang, S.; Zhang, M.; Che, Y.; Zhu, X.; Liu, X. Influence of below-cloud evaporation on deuterium excess in precipitation of arid central Asia and its meteorological controls. J. Hydrometeorol. 2016, 17, 1973–1984. [Google Scholar] [CrossRef]
- Wang, S.; Zhang, M.; Hughes, C.E.; Zhu, X.; Dong, L.; Ren, Z.; Chen, F. Factors controlling stable isotope composition of precipitation in arid conditions: An observation network in the Tianshan Mountains, central Asia. Tellus B 2016, 68, 26206. [Google Scholar] [CrossRef] [Green Version]
- Chen, F.; Zhang, M.; Wang, S.; Ma, Q.; Zhu, X.; Dong, L. Relationship between sub-cloud secondary evaporation and stable isotope in precipitation of Lanzhou and surrounding area. Quat. Int. 2015, 380–381, 68–74. [Google Scholar] [CrossRef]
- Chen, F.; Zhang, M.; Ma, Q.; Wang, S.; Li, X.; Zhu, X. Stable isotopic characteristics of precipitation in Lanzhou city and its surrounding areas, northwestern China. Environ. Earth Sci. 2015, 73, 4671–4680. [Google Scholar] [CrossRef]
Figure 1.
Map showing the four stations (Anning, Yongdeng, Gaolan and Yuzhong marked as black pins) in the Lanzhou city, China. The stations involved in Chen et al. [33] but not included in this study are also marked as white circles. The small map indicates the location of the Lanzhou city in China.

Figure 2.
Variations of d value at the four stations in the Lanzhou city from 2011 to 2014.

Figure 3.
Monthly variations of d value for the nearest grid boxes to the Lanzhou city simulated using four isotope-enabled models (LMDZ, LMDZfree, isoGSM and MIROC).
Figure 3.
Monthly variations of d value for the nearest grid boxes to the Lanzhou city simulated using four isotope-enabled models (LMDZ, LMDZfree, isoGSM and MIROC).

Figure 4.
Clustered backward trajectories during different seasons to the Lanzhou city. The target altitudes are set as 1000 (a,c,e,g) and 1500 m (b,d,f,h), respectively. The percentages in brackets denote the proportions in trajectory amount for each cluster in total amount.
Figure 4.
Clustered backward trajectories during different seasons to the Lanzhou city. The target altitudes are set as 1000 (a,c,e,g) and 1500 m (b,d,f,h), respectively. The percentages in brackets denote the proportions in trajectory amount for each cluster in total amount.

Figure 5.
Backward trajectories for four typical rainfall events during the past 24 h: (a) 15 April 2014, (b) 18 June 2014, (c) 28 June 2014, and (d) August 3, 2014. The green, blue and red lines denotes the target heights of 500, 1000 and 1500 m, respectively.
Figure 5.
Backward trajectories for four typical rainfall events during the past 24 h: (a) 15 April 2014, (b) 18 June 2014, (c) 28 June 2014, and (d) August 3, 2014. The green, blue and red lines denotes the target heights of 500, 1000 and 1500 m, respectively.

Figure 6.
Water vapor stream and precipitable water amount (PW) surrounding the study region in January for different years.
Figure 6.
Water vapor stream and precipitable water amount (PW) surrounding the study region in January for different years.

Figure 7.
Water vapor stream and precipitable water amount (PW) surrounding the study region in April for different years.
Figure 7.
Water vapor stream and precipitable water amount (PW) surrounding the study region in April for different years.

Figure 8.
Water vapor stream and precipitable water amount (PW) surrounding the study region in July for different years.
Figure 8.
Water vapor stream and precipitable water amount (PW) surrounding the study region in July for different years.

Figure 9.
Water vapor stream and precipitable water amount (PW) surrounding the study region in October for different years.
Figure 9.
Water vapor stream and precipitable water amount (PW) surrounding the study region in October for different years.

Figure 10.
Water vapor stream and precipitable water amount (PW) surrounding the study region during four typical rainfall events.
Figure 10.
Water vapor stream and precipitable water amount (PW) surrounding the study region during four typical rainfall events.


Table 1.
Latitude (Lat), longitude (Lon), altitude (Alt), meteorological parameters (T—air temperature, P—precipitation amount, e—water vapor pressure and h—relative humidity) and their standard deviations (σ) at four sampling stations in the Lanzhou city from 2011 to 2014.
Table 1.
Latitude (Lat), longitude (Lon), altitude (Alt), meteorological parameters (T—air temperature, P—precipitation amount, e—water vapor pressure and h—relative humidity) and their standard deviations (σ) at four sampling stations in the Lanzhou city from 2011 to 2014.
| Station | Lat | Lon | Alt (m) | T (°C) | P (mm) | e (hPa) | h (%) | ||||
|---|---|---|---|---|---|---|---|---|---|---|---|
| Mean | σ | Mean | σ | Mean | σ | Mean | σ | ||||
| Anning | 36°06′ | 103°44′ | 1548 | 7.9 | 7.2 | 194.1 | 6.0 | 13.7 | 5.9 | 73.5 | 11.2 |
| Yuzhong | 35°52′ | 104°09′ | 1874 | 13.5 | 8.5 | 217.7 | 5.9 | 11.9 | 6.7 | 78.3 | 14.5 |
| Gaolan | 36°21′ | 103°56′ | 1669 | 12.6 | 8.5 | 180.2 | 3.6 | 10.9 | 5.3 | 73.8 | 17.8 |
| Yongdeng | 36°45′ | 103°15′ | 2119 | 11.4 | 6.5 | 346.9 | 6.4 | 10.9 | 3.6 | 75.3 | 15.8 |
Table 2.
Minimum, maximum, mean values and standard deviation (σ) of d value for the wet (May to September) and dry (October to April) seasons at the four stations in the Lanzhou city.
Table 2.
Minimum, maximum, mean values and standard deviation (σ) of d value for the wet (May to September) and dry (October to April) seasons at the four stations in the Lanzhou city.
| Station | Min (‰) | Max (‰) | Mean (‰) | ||||
|---|---|---|---|---|---|---|---|
| Annual | Dry Season | Wet Season | |||||
| Mean | σ | Mean | σ | ||||
| Anning | −28.3 | 23.4 | 5.1 | 8.7 | 7.9 | 4.1 | 9.1 |
| Yuzhong | −13.6 | 28.4 | 11.1 | 11.1 | 7.7 | 11.2 | 7.7 |
| Gaolan | −36.4 | 33.3 | 9.3 | 10.2 | 7.5 | 8.9 | 11.6 |
| Yongdeng | −25.3 | 27.7 | 9.1 | 13.8 | 10.6 | 7.9 | 8.4 |
Table 3.
Comparisons of mean d value, δ2H, correlation coefficients (r) between d value and air temperature (T) or water vapor pressure (e), and the local meteoric water lines (LMWLs) during the wet (May to September) and dry (October to April) seasons at the four sites in the Lanzhou city.
Table 3.
Comparisons of mean d value, δ2H, correlation coefficients (r) between d value and air temperature (T) or water vapor pressure (e), and the local meteoric water lines (LMWLs) during the wet (May to September) and dry (October to April) seasons at the four sites in the Lanzhou city.
| Station | Season | d (‰) | δ2H (‰) | r (d vs. T) | r (d vs. e) | LMWL |
|---|---|---|---|---|---|---|
| Anning | Wet | 4.1 | −26.6 | −0.40 | −0.08 | δ2H = 7.03δ18O + 0.75 (r2 = 0.95, p < 0.01, σslope = 0.13, σintercept = 0.87, n = 155) |
| Dry | 8.7 | −61.2 | −0.21 | −0.10 | δ2H = 7.85δ18O + 7.63 (r2 = 0.96, p < 0.01, σslope = 0.28, σintercept = 2.70, n = 34) | |
| Yuzhong | Wet | 11.2 | −46.3 | −0.15 | −0.04 | δ2H = 7.47δ18O + 7.10 (r2 = 0.97, p < 0.01, σslope = 0.11, σintercept = 1.02, n = 154) |
| Dry | 11.1 | −57.2 | 0.03 | 0.05 | δ2H = 7.48δ18O + 6.52 (r2 = 0.97, p < 0.01, σslope = 0.17, σintercept = 1.68, n = 71) | |
| Gaolan | Wet | 8.9 | −36.0 | −0.34 | −0.08 | δ2H = 7.40δ18O + 5.55 (r2 = 0.88, p < 0.01, σslope = 0.19, σintercept = 1.34, n = 200) |
| Dry | 10.2 | −41.6 | −0.02 | −0.15 | δ2H = 8.02δ18O + 10.13 (r2 = 0.89, p < 0.01, σslope = 0.35, σintercept = 2.48, n = 63) | |
| Yongdeng | Wet | 7.9 | −26.3 | −0.11 | −0.17 | δ2H = 7.18δ18O + 4.17 (r2 = 0.94, p < 0.01, σslope = 0.12, σintercept = 0.70, n = 233) |
| Dry | 13.8 | −50.5 | 0.08 | 0.00 | δ2H = 7.12δ18O + 6.53 (r2 = 0.92, p < 0.01, σslope = 0.29, σintercept = 2.77, n = 54) |
Publisher’s Note: MDPI stays neutral with regard to jurisdictional claims in published maps and institutional affiliations. |
© 2020 by the authors. Licensee MDPI, Basel, Switzerland. This article is an open access article distributed under the terms and conditions of the Creative Commons Attribution (CC BY) license (http://creativecommons.org/licenses/by/4.0/).
Share and Cite
MDPI and ACS Style
Chen, F.; Zhang, M.; A. Argiriou, A.; Wang, S.; Zhou, X.; Liu, X. Deuterium Excess in Precipitation Reveals Water Vapor Source in the Monsoon Margin Sites in Northwest China. Water 2020, 12, 3315. https://doi.org/10.3390/w12123315
AMA Style
Chen F, Zhang M, A. Argiriou A, Wang S, Zhou X, Liu X. Deuterium Excess in Precipitation Reveals Water Vapor Source in the Monsoon Margin Sites in Northwest China. Water. 2020; 12(12):3315. https://doi.org/10.3390/w12123315
Chicago/Turabian StyleChen, Fenli, Mingjun Zhang, Athanassios A. Argiriou, Shengjie Wang, Xin Zhou, and Xueyuan Liu. 2020. "Deuterium Excess in Precipitation Reveals Water Vapor Source in the Monsoon Margin Sites in Northwest China" Water 12, no. 12: 3315. https://doi.org/10.3390/w12123315
Note that from the first issue of 2016, this journal uses article numbers instead of page numbers. See further details here.