Why Flash Floods Occur Differently across Regions? A Spatial Analysis of China


1
State Key Laboratory of Simulation and Regulation of Water Cycle in River Basin, China Institute of Water Resources and Hydropower Research, Beijing 100038, China
2
State Key Lab of Resources and Environmental Information System, Institute of Geographic Sciences and Natural Resources Research, Chinese Academy of Sciences, Beijing 100101, China
3
College of Resource and Environment, University of Chinese Academy of Sciences, Beijing 100049, China
*
Author to whom correspondence should be addressed.
Water 2020, 12(12), 3344; https://doi.org/10.3390/w12123344
Submission received: 12 October 2020
/
Revised: 21 November 2020
/
Accepted: 24 November 2020
/
Published: 29 November 2020
Abstract
:In recent years, flash floods have increased, accompanying rapid economic growth, changes to the natural environment and increases in extreme climate events. However, spatial heterogeneity in the influencing factors has seldom been studied systematically. This paper investigates this issue by using the Geodetector tool and considering 14 factors such as climate, natural environment, and human activities in 11 ecoregions in China based on flash flood records from 1950 to 2015 collected by the Investigation Project of Chinese Flash Floods. The results showed that there is obvious spatial heterogeneity in the main influencing factors and influencing weights in 11 ecoregions. Precipitation and landforms have the greatest effects on flash floods and the interactions of these two factors have the strongest effects as compared to interactions between other factors in most of the 11 ecoregions; however, the effect has obvious variation from northwest to Southeast. Meanwhile, human activities were found to have tangible impacts, especially in ecologically vulnerable regions. The findings provide a new understanding of how and why flash floods occur in a particular region and contribute to the formulation of regionally targeted strategies to cope with flash flood.
1. Introduction
A large body of research is devoted to understanding the spatial heterogeneity of natural conditions, human activities, and their interactions [1,2,3]. However, such insights are seldom applied to disaster studies, such as those on floods, which are becoming one of the most severe disasters due to climate change and human activities [4]. As one of the most frequently occurring natural disasters with severe impacts, flash floods (FFs) attract a lot of attention. Characterized by the rapid onset of flooding, FFs are a result of complex interactions between humans and the natural environment [5]. This is particularly the case in China, where the frequency of FFs has increased in recent years owing to rapid economic growth, changes in the natural environment, and increases in extreme climate events [6]. FFs were responsible for 62–92% of deaths attributed to flood disasters that occurred from 2010 to 2015 [7]. There were 1500 deaths and 265 people missing as a result of the FF in Zhouqu, Gansu Province on 7 August 2010 [8], which is one of the areas that often experiences FFs. Therefore, it is important to understand the driving forces behind the FFs [9].
As FFs are nowadays reported in a timely manner and well documented, research on the influence of various temporal and spatial factors on flash floods has been carried out all over the world, such as in China, the United States, and other mountain areas. Significant progress has been made in analyzing influence factors, including the underlying surfaces, residential distribution, and precipitation [10,11,12]. However, these analyses have mostly be carried out in particular regions [13,14,15]. Gruntfest and Hamer [16] pointed out that besides precipitation, human activity factors, such as river occupation, urbanization, and flood control measures have modified the natural characteristics of extreme floods. Tertl et al. [17] explored the space–time characteristics of flood-related vulnerability to understand the human-related factors influencing FF events. Bloshcl et al. [18] argued that the effects of land cover on FF events vary from humid climates to arid areas.
Although many studies have indicated that FFs are a comprehensive result of various factors, all of which include spatial attributes and typically differ in different regions [19,20,21], there is little inquiry into quantitative comparison of the spatial heterogeneity of the influence of various factors in different regions [22].
As hazard sources are dispersed in space [23], it is difficult to determine why FFs often occur in particular areas. The investigation of spatial heterogeneity is of particular importance in advancing our knowledge of the spatial distribution and influential factors of FFs. FFs vary in space and time, making them difficult to forecast precisely [17]. There is limited investigation of FFs and their spatial heterogeneity at the national scale to determine whether the driving factors differ in different regions. Further investigation will help improve FF prediction and the associated policy formulation and implementation. This paper aims to determine the spatial heterogeneity and associated factors causing FFs in China using historical records of FFs from 1950 to 2015.
2. Materials and Methods
2.1. Materials
Since 2013, the Chinese government has worked to collect and compile all flash flood events from 1950 to 2015 across mainland China under the Investigation Project of Chinese Flash Floods (IPCFF) [24]. The project was conducted over 78% of the land area of China, which covered a total population of nearly 900 million. The Project collected more than 60,000 flash flood events that have occurred from 1950 to 2015, which is the widest dataset in terms of the number of flash flood events compared to other existing studies [25].
FFs are a result of the interactions of humans and nature, particularly precipitation and topographic conditions [17,26,27], and recent studies show that human activities play a large role in the occurrence of FFs [12,28]. Hence, potential driving factors of precipitation, changes in the natural environment, and human activities were studied. Datasets of this information were collected from the Resources and Environmental Sciences Data Centre (RESDC), the Database of Resources and Environment in China, and the National Meteorological Science Data Service Platform (Table 1). The data used include not only those that were relatively temporally static, such as topography, but also data that change greatly with time in some areas, such as population and vegetation, which may have a certain impact on the analysis. Because of difficulties in acquiring these datasets for multiple years, we employed single-year datasets.
2.2. Data Processing
2.2.1. Flash Flood Records
For the spatial analysis, a map of FFs was generated based on FF records obtained from Getis-Ord Gi* statistics and the fishnet map technique [29,30]. The Getis-Ord Gi statistics for each feature in the dataset are z-scores and p-values, which indicate where features with either high or low values cluster spatially. For statistically significant positive Z scores, the larger the Z score is, the more intense the clustering of high values (hot spot). For statistically significant negative Z scores, the smaller the Z score is, the more intense the clustering of low values (cold spot). In this paper, the flash flood points were converted to 1 × 1 km gridded data and all the data were integrated into watershed polygons by using area-weighted and aggregation methods. The value of a fishnet polygon in the map is calculated using Equation (1), as follows:
where is the number of FF events in fishnet j, and is the weight of the i-th fishnet and the j-th fishnet. We used a fixed threshold of 200 km [31]. When the distance between the i-th and j-th fishnet is less than the threshold, = 1; otherwise, = 0. m is the sum of the fishnets.
2.2.2. Processing of Precipitation Data
Based on the available dataset and the factors suggested by relevant studies, daily precipitation has been confirmed to be strongly correlated to short-duration (e.g., hourly) precipitation, which is the main trigger factor of FFs [32]. The data was downloaded from websites of the National Weather Service of China (http://data.cma.cn/, Beijing, China).
Six precipitation factors were determined as expressed in Equation (2) for all meteorological stations, as follows:
where represents the value of the i-th precipitation factor of j-th meteorological station; and “i” represents 6 precipitation factors, which are divided according to daily precipitation as Pk ≤ 10 mm, 10 mm < Pk ≤ 25 mm, 25 mm < Pk ≤ 50 mm, 50 mm < Pk ≤ 100 mm, 100 mm < Pk ≤ 250 mm and Pk ≥ 10 mm, means the daily precipitation on the k-th day in “a” year, is the range of daily precipitation as [0–10, 10–25, 25–50, 50–100, 100–250, >250].
The precipitation data is acquired from RESDC, which applied ANUSPLIN software [33,34] to spatialize precipitation data in China by interpolating each factor from the meteorological stations to continuous data. For the precipitation data from 1950 to 2015 (65 years), the annual average days are obtained by dividing the total number of days by 65. The result is shown in Section 3.1.
2.2.3. Processing of Human Activity Data
The population data were converted from the total population of each county to a raster dataset representing the population distributed in a 1-km grid, which represents the spatial density of the population [35]. To further consider the spatial distribution of human activities, the density of villages in a unit area was calculated to determine any possible difference in impacts of human activities on nature owing to the same population.
2.2.4. Integration of Numerical Factors at Watershed Scale
Similar to most research on FFs [36,37], the analysis was performed at the spatial unit of watersheds. The area-weighted method was used for the vector data including the village density and the population density. The mean values method was used for the raster data, including the elevation, slope, intensity of flash floods, and the six precipitation factors. Watersheds ranging from 10 to 50 km2 are the units for FF management and mitigation planning in China [7]. The FF area includes over 250,000 watersheds, more than 110,000 of which are inhabited by humans. These 110,000 watersheds were used as the evaluation area to ensure consistency of the data.
2.3. Methods
The Geodetector tool was applied to determine the spatial heterogeneity of historical events of FFs in China from 1950 to 2015. The Geodetector tool was developed based on geographical spatial differentiation theory by Wang [38].This tool is widely used in spatial analysis [39,40], and it is valuable for identifying association or overlaying between dependent variables and independent variables, according to the consistency of their spatial distributions [39,41]. The tool consists of a factor detector and an interaction detector [39,41]. In Geodetector, the power of determinant (PD) is used to represent the relationship between dependent variable and independent variable. For analysis using the geographical detector, all the data were classified using “Jenks natural breaks” by GIS software [38], which divides spatial continuous data to spatial zones. The scale of 1 to 5 corresponds to high (1) to low (5).
2.3.1. Factor Detector
The factor detector quantitatively judges the contributions of independent variables to variations in dependent variables based on factor accountability, and thereby verifies whether a certain geographical factor accounts for the spatial variation in geographical phenomena.
In the Geodetector, the PD between FFs and X is determined by Equation (3):
where F indicates FFs in ecoregion e (Figure 1); represent a factor, h = 1, 2…L; L is the number of zones for one factor and the zones are classified via Jenks spatial zoning; and N are the number of FFs in zone h and the whole ecoregion, respectively; and and are the variances in the FFs of zone h and the whole ecoregion, respectively. Thus, the indicates the degree to which the distribution is associated with factor . In addition, and the greater the spatial correlation between and the larger the .
2.3.2. Interaction Detector
The interaction detector can be used to identify interactions between different influential factors through spatial overlap; specifically, it compares the sum of the independent accountabilities of two influential factors with the synergistic accountability of the factors, to determine the mode of influence on geographical phenomena upon interaction.
The interaction detector reveals whether the independent factors L1 and L2 interact with and influence target Y. GIS software was used to unite the L1 and L2 geographical layers and obtain a new layer L1∩L2. The correlation of the interaction was determined by comparing the PD values for L1, L2, and layer L1∩L2, and the interaction relationship was determined based on the location of PD(X1∩X2) in the 5 intervals (Table 2) [39,41].
2.3.3. Spatial Zoning Scheme
Chinese scholars and policy makers promote the idea of ecoregions, which represent a comprehensive system of landforms, vegetation, precipitation, and human activities to facilitate environmental protection and ecological rehabilitation [42,43,44]. This idea has been widely used to assist spatial analysis and management [45]. The concept was adopted here to investigate the spatial heterogeneity of FFs (Figure 1). The details of investigated factors in each ecoregion can be found in Appendix A.
3. Results
3.1. Spatial Variation in the FFs and Factors
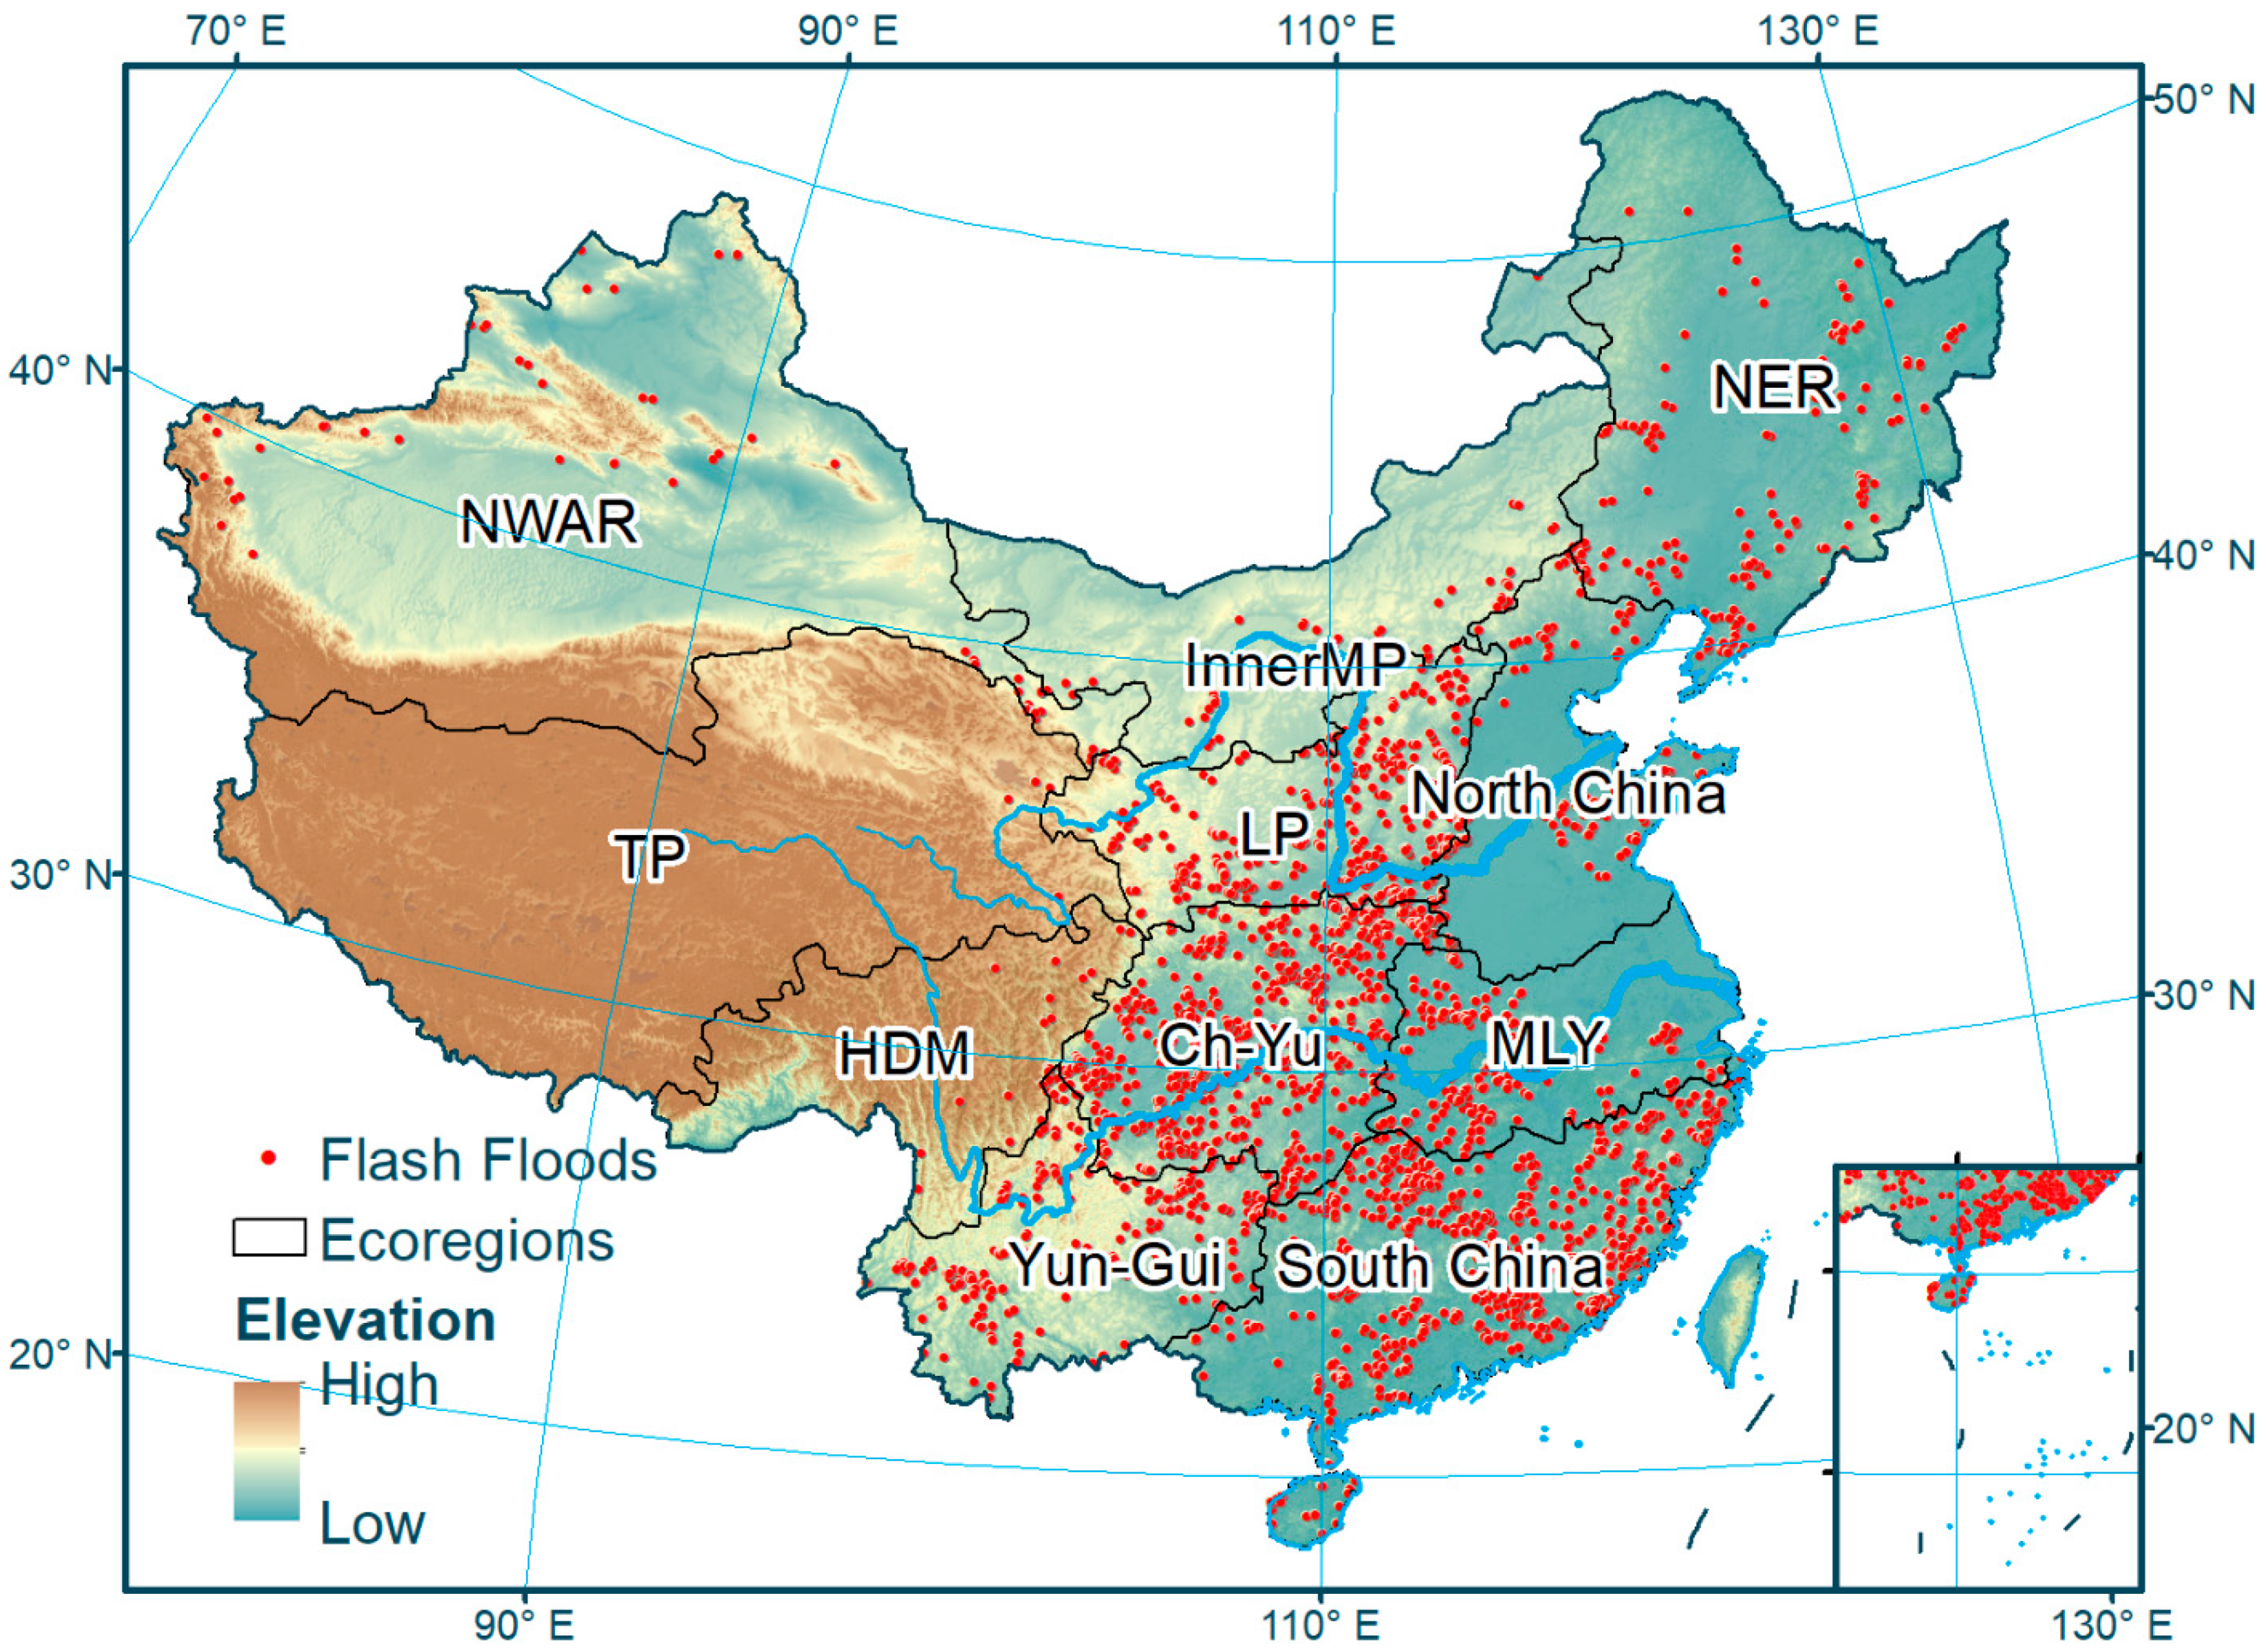
As Figure 1 shows FFs were heavily concentrated in South China (26%), Ch-Yu (23%), the Loess Plateau (LP) (17%), Yun-Gui (10%), and the middle and lower reaches of the Yangtze River region (MLY) (10%), which in total includes 86% FFs in China from 1950 to 2015. In contrast, regions such as the Tibetan plateau (1%), Hengduan mountainous ecoregion (1%), Inner Mongolia Plateau (Inner MP) (2%), and Northwest Arid Region (NWAR) (2%) were seldom affected by FFs.
3.2. Driving Factors of Flash Floods Across Different Ecoregions
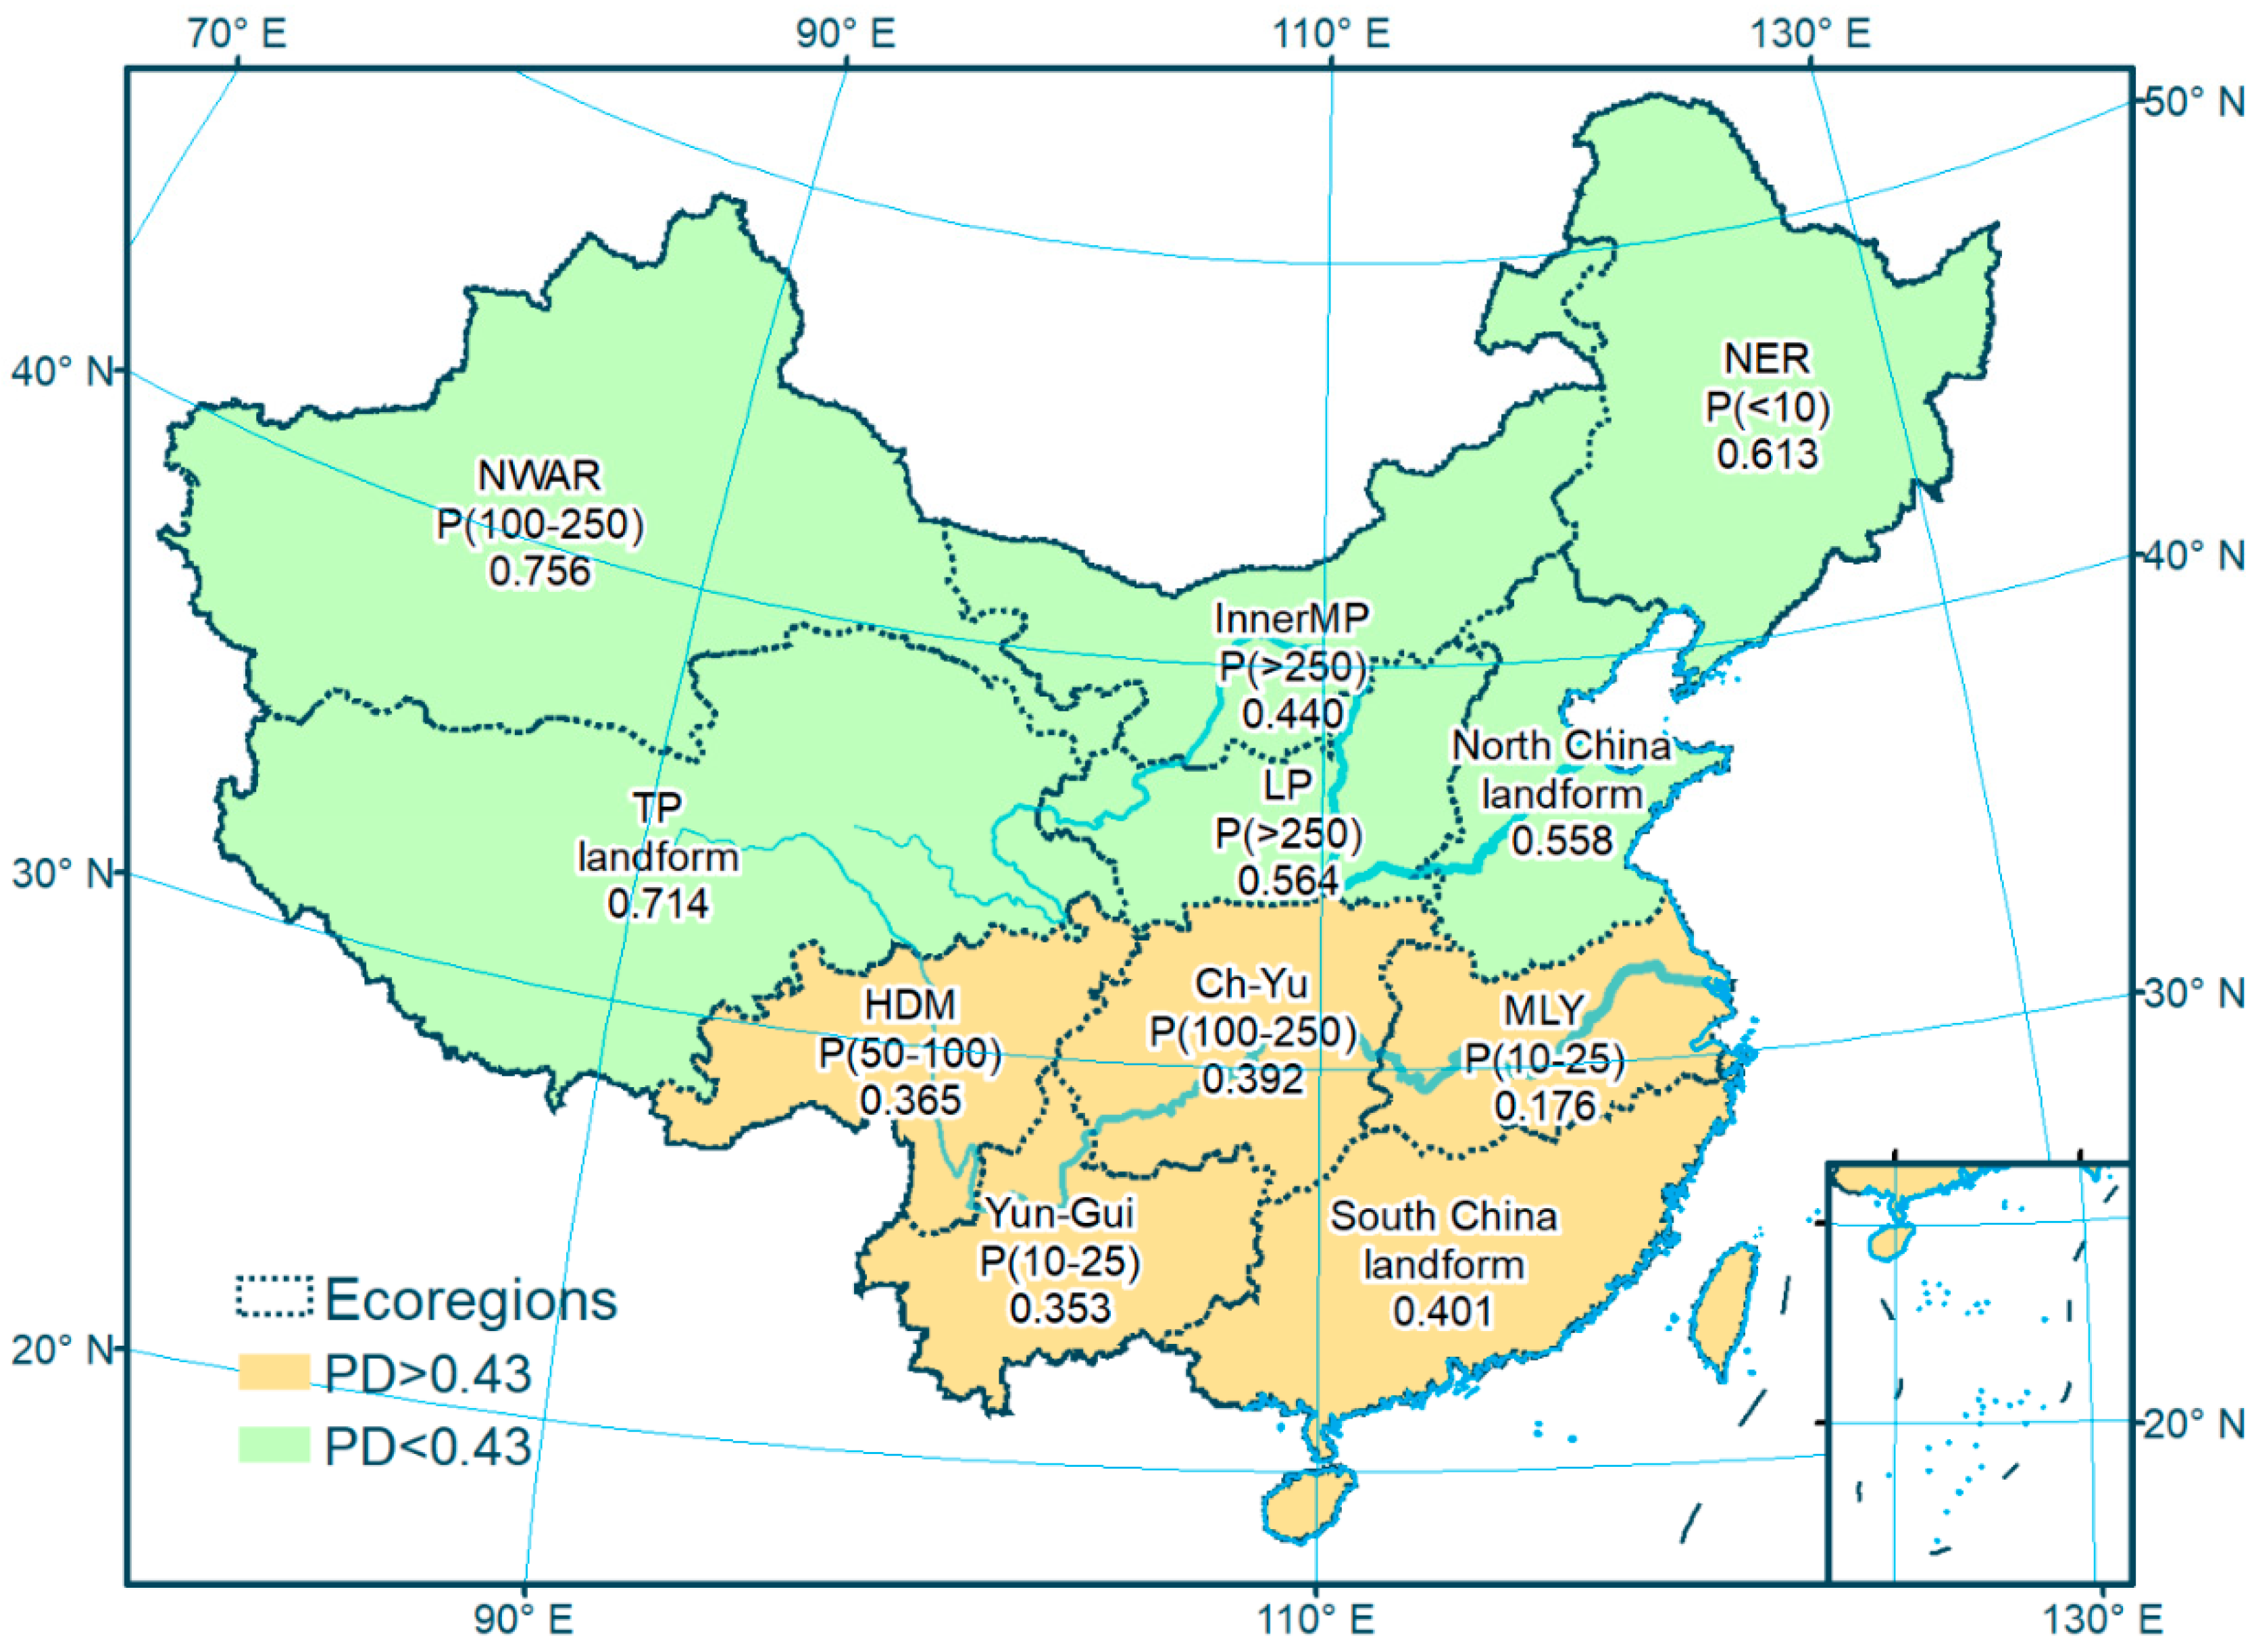
The spatial variations in the FFs and the associated key factors were determined using the Geodetector tool. The factor detector results show that there is an obvious spatial heterogeneity in the major factors. Similar to the findings of other researchers [46,47], precipitation was found to be the most influential factor affecting the spatial distribution of FFs, especially heavy precipitation, which was highly ranked, along with landforms (Table 3). For instance, P(100–250) was the most influential factor in NWAR and Ch-Yu, while P(>250) was the most influential factor in Inner MP and LP.
3.3. Interaction of Influential Factors Driving Flash Floods
The interaction detector results showed that heavy precipitation was one of the two factors with the highest PDs in all 11 ecoregions (Table 4). P(>250) had the highest PD in nine ecoregions and P(100–250) had the highest PD in the remaining two ecoregions, which indicates that precipitation is the most influential factor affecting the spatial distribution of FFs in China, consistent with the findings of most other related studies [48,49]. Likewise, the interactions of the key factors and their relations varied greatly in their influence on FFs in different ecoregions (Table 4). For example, in the NWAR ecoregion, the primary factor was P(100–250), which affected FFs by strongly interacting with landforms (0.901).
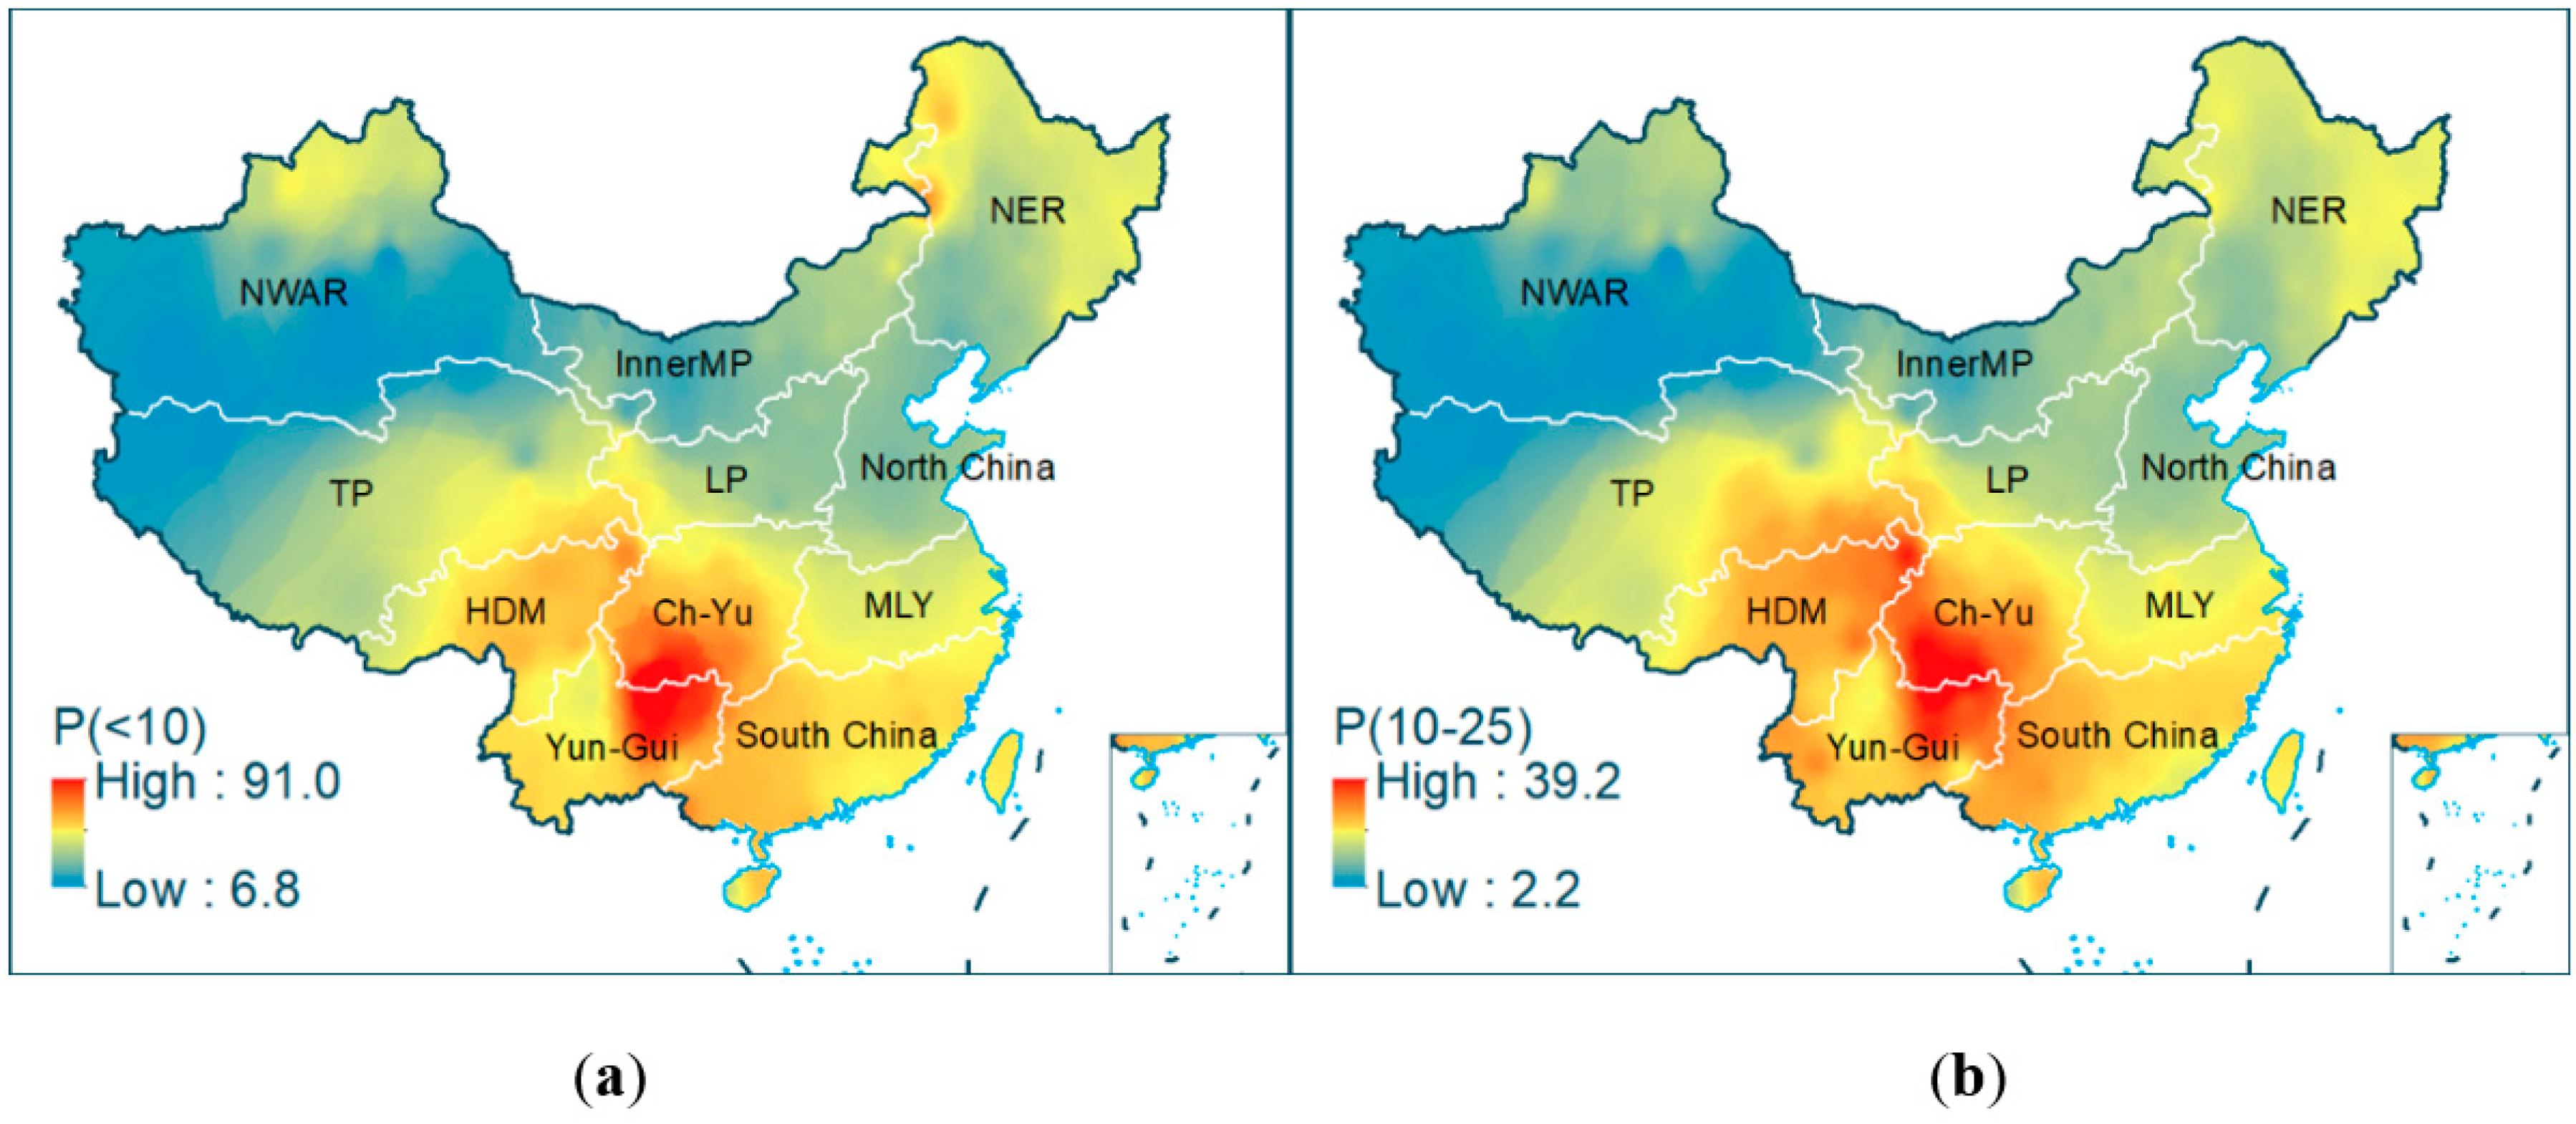
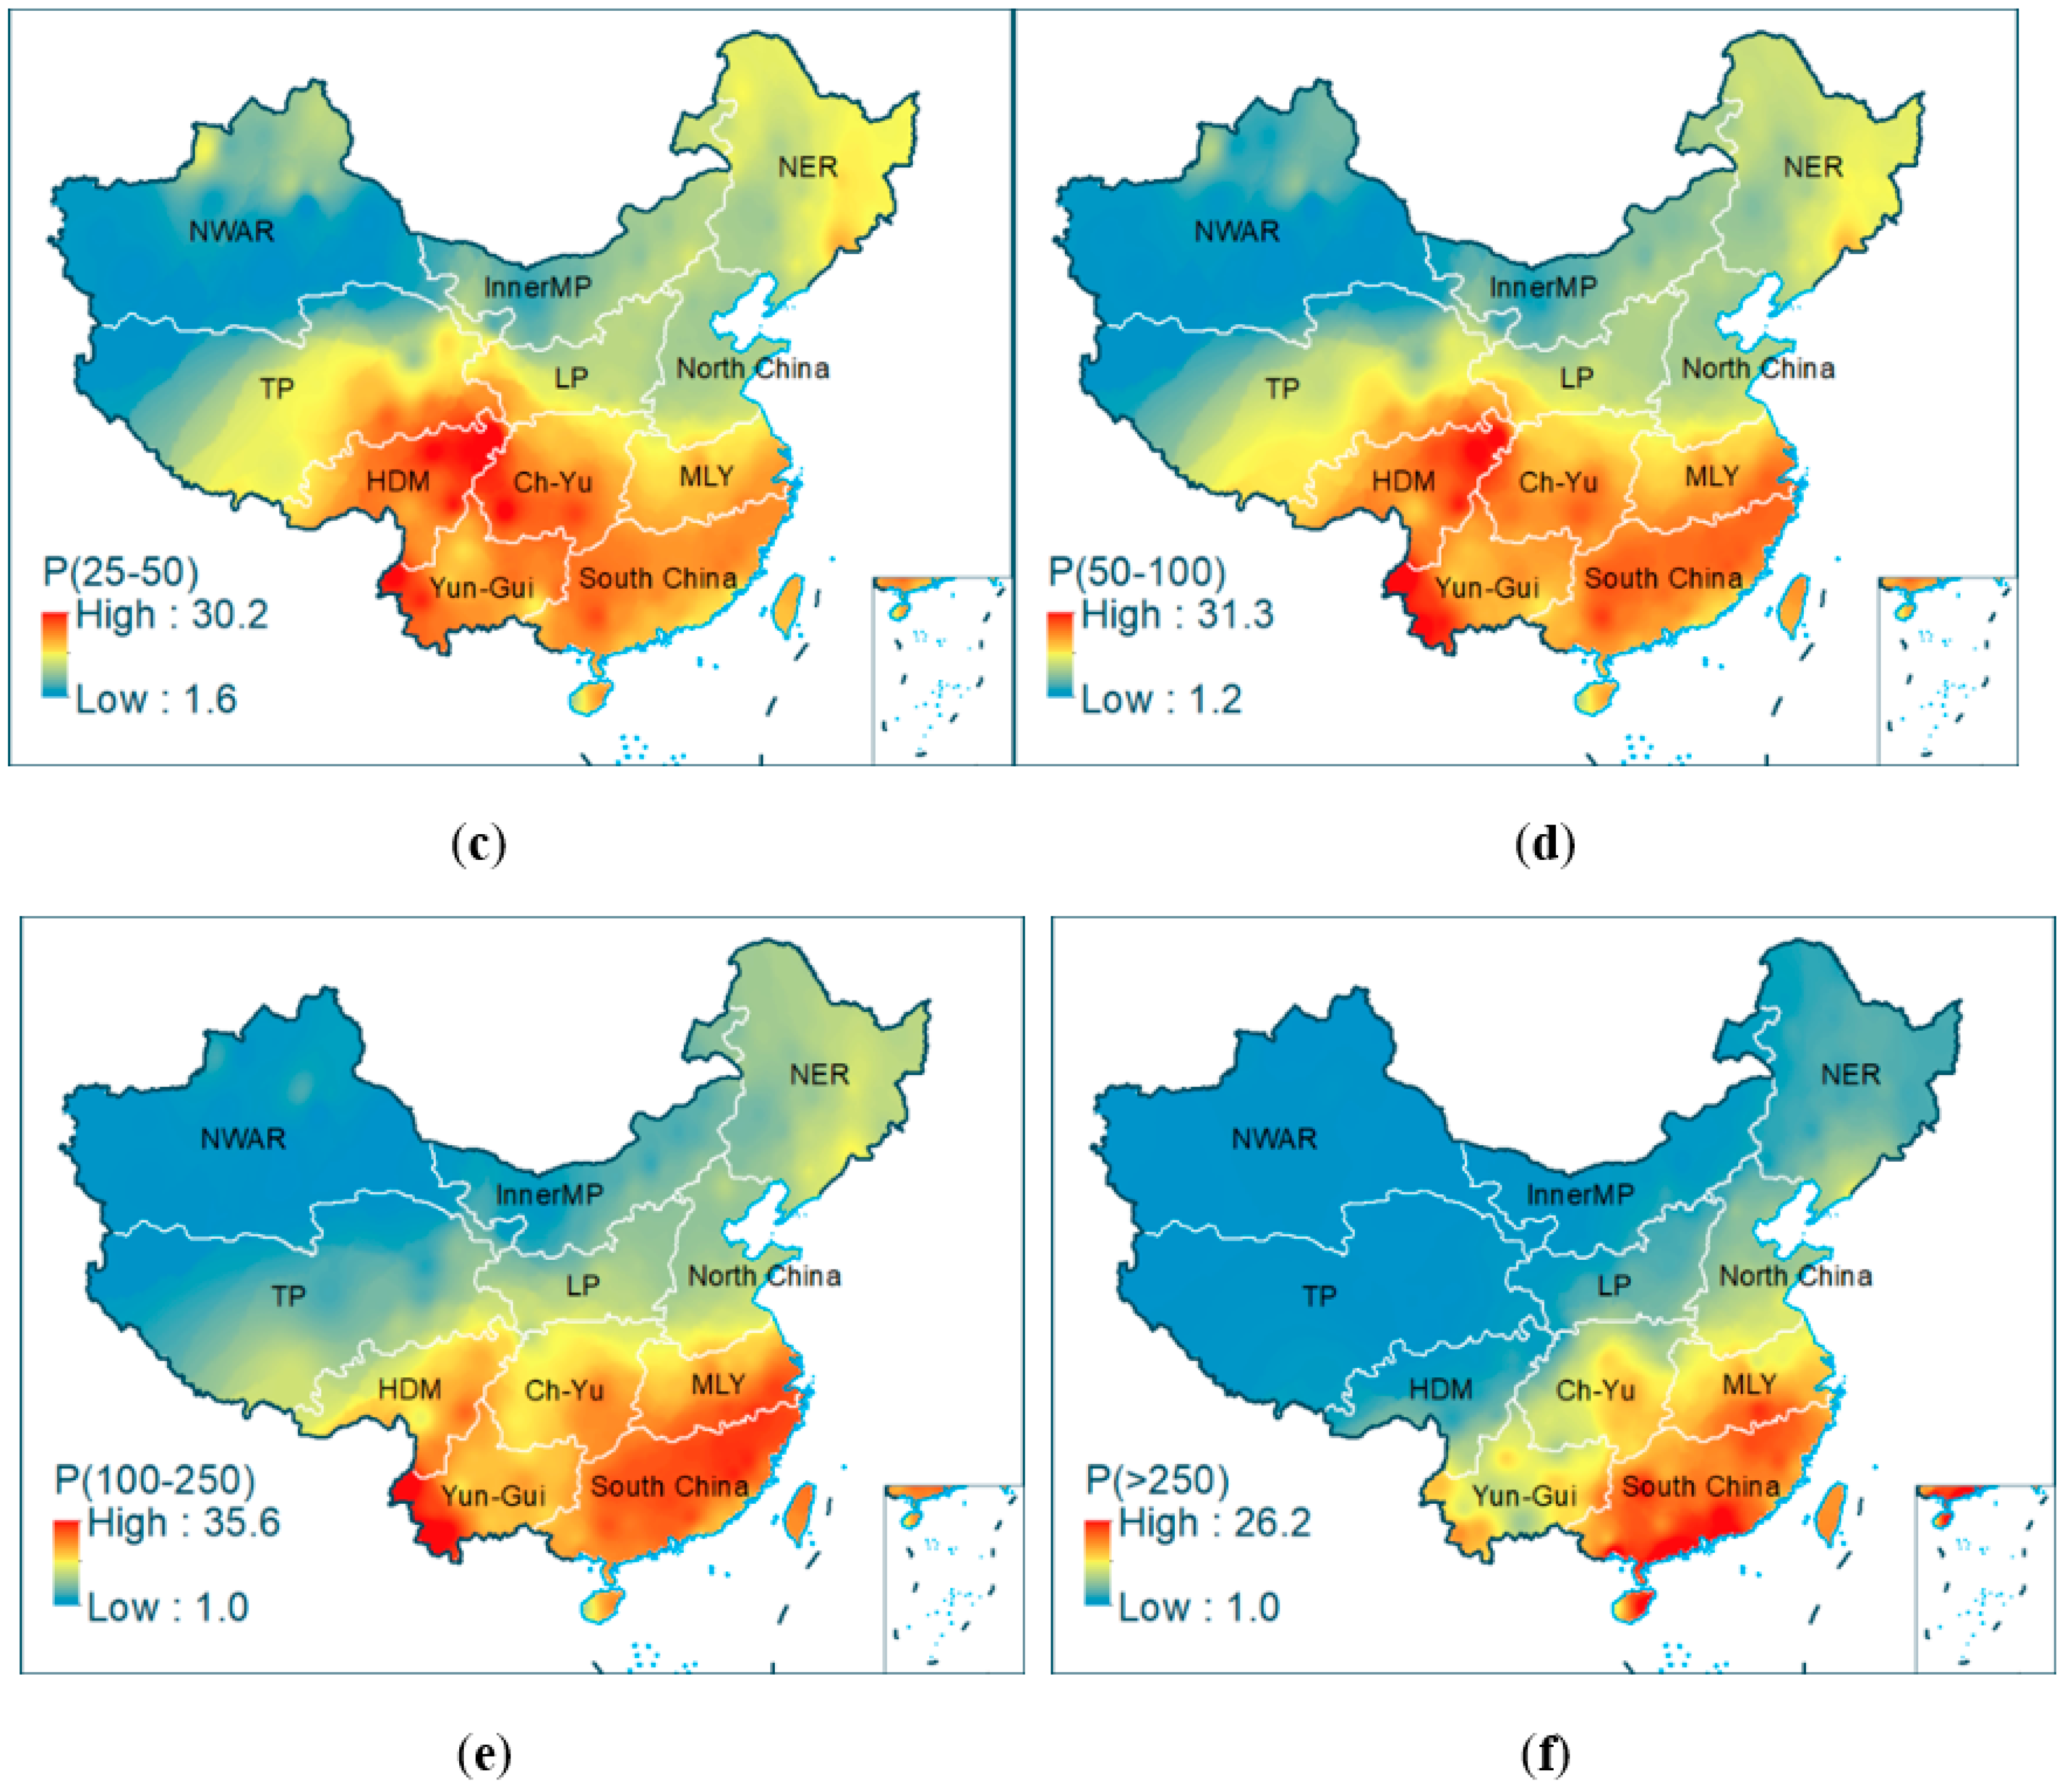
Of the driving forces, there is an obvious spatial heterogeneity in the precipitation factors. Hotspots of P(<10) are mainly located in the Ch-Yu and the Yun-Gui ecoregions. In contrast, the hotspots of P(>250) are mainly located in the LMY and South China ecoregions. The other four precipitation factors, P(10–25), P(25–50), P(50–100), and P(100–250), have similar spatial distributions, and their hotspots are mainly in the Hengduan mountainous ecoregion, Ch-Yu ecoregion, LMY, Yun-Gui plateau, and South China ecoregion (Figure 2). Table 3 also shows the highest factors of PD in NWAR are P(50–100), P(100–250) and P(>250), while landform has the highest impact (0.714) on FF in TP (Figure 3).
4. Discussion
Precipitation and landforms are the main factors that result in environments that are ecologically vulnerable to human activities. Accordingly, human activities significantly influence FFs; for example, the PD of the population density was as high as 0.501 and 0.384 in the NWAR and TP ecoregions, respectively (Figure 4).
The spatial heterogeneity of the interactions is more significant than that of the factors (Figure 5). The interaction of the six ecoregions in northwest China is bilinearly enhanced and that of the five ecoregions in southeast China is nonlinearly enhanced, meaning that the combined influence of multiple factors is substantially greater than that of a single factor. For instance, bilinear enhancement between precipitation and landforms was observed in NWAR, TP, Inner MP, and Northeast China regions, which seldom suffer from FFs, totaling approximately 10% of the occurrences.
The relationship between precipitation and landforms can be non-linearly enhanced in ecoregions mainly in the southern part of China (Figure 5). Some other factors may be influential here because human activities are more diversified, such as urbanization, population growth, and industrial agglomeration, alongside complex natural conditions of sub-level landforms, climate change, and different terrains (Figure 4). For instance, in South China, P(>250) and landforms are the primary factors, respectively, that can explain 40.1% and 12.6% of the FF occurrences. However, their interaction explains 64.1% of the FFs, which is greater than the effect of summation (52.6%).
In the traditional view, more precipitation will induce more serious FFs, whereas, by adding more factors such as natural conditions, economy and human effects in different ecoregions, the driving factors varied. It can be illustrated that other factors undoubtedly change the influence of precipitation on FFs in different ecoregions. Herewith, we consider that the result of our manuscript is innovative and useful in forewarning of FFs in special ecoregions.
As for the forces driving the heterogeneity of the spatial distribution of FFs, precipitation, especially heavy precipitation was the major driving force in eight ecoregions of China, and the power of determinants (PDs) were 0.176–0.756. Landform is another significant factor, which is the most influential factor in three ecoregions of Tibetan Plateau, North China and South China, and the PDs were 0.401–0.714. Furthermore, interactions of precipitation and landform have the strongest effect on the spatial distribution of FFs (e.g., 0.901 in Northwest Arid Region), although the degrees vary across ecoregions. The interactive influence of precipitation and landform was much greater than that of any single factor, with PDs of 0.478–0.901, which exceeded 0.8 in 8 of the 11 ecoregions. All these indicated that precipitation and landform were the major driving forces in China. However, human activities have a tangible relationship with flash floods, especially in ecologically vulnerable regions of Northwest Arid Region, Tibetan Plateau, and North China. Interestingly, the interaction between precipitation and landforms was found to be bilinearly enhanced in the six ecoregions of northwest China and nonlinearly enhanced in the five ecoregions in southeast China, implying that there are different interactions among the influential factors across ecoregions, which deserve further study. Based on the above, different strategies and proposals for preventing and controlling flash floods are also proposed.
5. Conclusions
FFs are one of main forms of disaster globally, dramatically affected by nature and human activities, and therefore the occurrence of FFs demonstrates spatial or regional heterogeneity. Availing of the data from the Investigation Project of Chinese Flash Floods, which is so far the largest and comprehensive dataset of FF records in China, this study explores the spatial variation of FF in China and assessed the driving force of various factors by using the Geodetector tool and considering 14 factors such as climate, natural environment, and human activities in 11 ecoregions in China. This contributes to understanding why FFs often occur in particular areas. The findings provide useful references for improving the prewarning system of FFs. Regional strategies are required to cope with the variation in these influential factors. Pre-warning systems in particular should pay attention to factors with high PD and the effects of their interaction.
The analysis may be limited owing to the choice of factors. It can be improved by including more variables to reflect and evaluate human activities. Nevertheless, they provide a new understanding of FFs from the perspective of spatial heterogeneity and will enable the development of regionally targeted strategies to cope with FFs. We hope the attempt at understanding the spatial heterogeneity of FFs and associated influential factors can improve our knowledge on how and why FFs occur in a particular ecoregion.
Author Contributions
Data curation, Y.L.; Software, Y.H.; Writing—original draft, Y.L.; Writing—review & editing, Y.H. All authors have read and agreed to the published version of the manuscript.
Funding
This research was supported and funded by the CRSRI Open Research Program (Program SN: CKWV2018484/KY), the National Key Research and Development Program of China (Grant No. 2017YFB0503005) and the Strategic Priority Research Program of the Chinese Academy of Sciences (XDA19040402).
Conflicts of Interest
The authors declare no conflict of interest.
Appendix A

Table A1.
Descriptive analysis of investigated factors.
| NWAR | HDM | Inner MP | LP | MLY | North | NER | TP | Ch-Yu | South China | Yun-Gui | ||
|---|---|---|---|---|---|---|---|---|---|---|---|---|
| Number of Flash Floods | 148 | 93 | 146 | 1078 | 621 | 231 | 301 | 38 | 1468 | 1688 | 638 | |
| P(<10) | Mean | 21.9 | 42.58 | 22.38 | 26.64 | 35.01 | 22.46 | 29.19 | 27.93 | 46.02 | 42.5 | 46.9 |
| Min | 7.26 | 28.36 | 14.63 | 17.86 | 28.6 | 18.04 | 17.35 | 9.3 | 25.96 | 29.4 | 34.47 | |
| Max | 39.71 | 53.25 | 37.48 | 41.21 | 40.91 | 31.98 | 51.26 | 48.41 | 90.98 | 54.82 | 90.48 | |
| P(10–25) | Mean | 10.04 | 25.72 | 12.31 | 15.23 | 19.59 | 12.39 | 15.82 | 16.72 | 25.76 | 23.22 | 25.85 |
| Min | 2.92 | 17.11 | 7.03 | 10.65 | 14.82 | 10.64 | 10.81 | 4.11 | 14.18 | 13.59 | 19.13 | |
| Max | 22.18 | 35.35 | 17.47 | 25.18 | 22.69 | 17.76 | 20.16 | 31.36 | 39.2 | 30.35 | 39.06 | |
| P(25–50) | Mean | 6.99 | 22.85 | 9.62 | 12.51 | 18.03 | 10.23 | 13.19 | 13.91 | 20.81 | 20.36 | 21.22 |
| Min | 2.02 | 14.74 | 4.71 | 7.81 | 13.32 | 8.72 | 9.29 | 2.59 | 11.77 | 10 | 14.99 | |
| Max | 16.67 | 30.14 | 12.59 | 21.62 | 21.46 | 15.9 | 19.02 | 27.29 | 28.21 | 24.66 | 27.79 | |
| P(50–100) | Mean | 5.09 | 22.46 | 8.58 | 11.72 | 19.83 | 10.06 | 12.4 | 13.65 | 19.57 | 21.86 | 21.53 |
| Min | 1.49 | 15.47 | 3.94 | 6.98 | 13.83 | 8.88 | 7.59 | 2.09 | 12.13 | 10.18 | 15.71 | |
| Max | 12.73 | 29.04 | 11.06 | 20.17 | 24.35 | 16.9 | 18.67 | 26.46 | 27.18 | 25.94 | 31.35 | |
| P(100–250) | Mean | 2.95 | 19.19 | 6.98 | 10.36 | 24.01 | 10.34 | 11.63 | 9.81 | 19.27 | 26.62 | 23.62 |
| Min | 1.18 | 8.96 | 2.49 | 5.15 | 14.9 | 8.19 | 7.01 | 1.55 | 11.6 | 11.51 | 17.8 | |
| Max | 8.29 | 31.04 | 9.2 | 15.07 | 30.35 | 19.32 | 16.95 | 18.85 | 25.51 | 30.88 | 35.63 | |
| P(>250) | Mean | 1.2 | 3.88 | 2.4 | 3.85 | 15.23 | 5.87 | 4.82 | 1.66 | 10.09 | 18.08 | 11.28 |
| Min | 1 | 1.22 | 1.19 | 1.5 | 7.4 | 2.37 | 2.28 | 1.03 | 2.44 | 10.51 | 5.25 | |
| Max | 1.69 | 12.43 | 3.54 | 7.52 | 21 | 12.49 | 11.16 | 2.77 | 15.14 | 26.23 | 18.05 | |
| Elevation (m) | Mean | 1764.17 | 3472.59 | 1347.03 | 1325.57 | 167.76 | 410.48 | 385.15 | 4275.7 | 709.48 | 290.53 | 1493.78 |
| Min | −26.84 | 765 | 545.19 | 75.11 | 1.46 | 0 | 0 | 1481.37 | 40.23 | −0.65 | 97.13 | |
| Max | 5322.5 | 5565 | 15,544.65 | 4245.85 | 1222.22 | 1891.95 | 1640.33 | 6086 | 3832.46 | 1776.13 | 4106.74 | |
| Slope (°) | Mean | 13.33 | 28.5 | 7.44 | 18.11 | 14.09 | 11.77 | 8.4 | 18.39 | 21.59 | 17.03 | 21.76 |
| Min | 0 | 0 | 0 | 0 | 0 | 0 | 0 | 0 | 0 | 0 | 0 | |
| Max | 55.59 | 55.69 | 39.68 | 74.3 | 43.5 | 40.97 | 31.35 | 48.31 | 53.38 | 48.29 | 51.09 | |
| land use (%) | field | 19.50% | 2.00% | 36.30% | 43.80% | 39.80% | 51.10% | 34.90% | 3.40% | 43.30% | 25.40% | 18.10% |
| forest | 4.90% | 50.40% | 4.10% | 15.40% | 48.10% | 20.60% | 49.80% | 6.30% | 42.70% | 61.60% | 63.60% | |
| grass | 75.60% | 47.60% | 59.60% | 40.80% | 12.10% | 28.30% | 15.30% | 90.30% | 14.10% | 13.00% | 18.30% | |
| Soil (%) | loam | 78.40% | 78.90% | 85.30% | 83.30% | 51.50% | 86.50% | 72.70% | 87.30% | 65.50% | 50.70% | 38.00% |
| clay | 19.00% | 19.70% | 11.60% | 15.90% | 42.80% | 11.00% | 26.60% | 7.70% | 33.80% | 48.00% | 60.90% | |
| other | 2.70% | 1.40% | 3.10% | 0.80% | 5.80% | 2.50% | 0.70% | 5.10% | 0.70% | 1.40% | 1.10% | |
| Vegetation (%) | natural | 88.00% | 97.20% | 79.80% | 52.70% | 71.60% | 50.00% | 71.10% | 89.80% | 68.20% | 82.90% | 92.40% |
| agricultural | 8.60% | 1.00% | 19.60% | 47.30% | 28.20% | 49.60% | 28.90% | 5.20% | 31.60% | 17.10% | 7.50% | |
| other | 3.40% | 1.80% | 0.60% | 0.00% | 0.20% | 0.30% | 0.00% | 5.10% | 0.10% | 0.10% | 0.10% | |
| Landform (%) | low mountain | 10.60% | 0.10% | 37.00% | 43.30% | 69.80% | 68.40% | 71.50% | 0.00% | 80.20% | 79.60% | 34.70% |
| high mountain | 33.00% | 94.90% | 6.30% | 25.50% | 0.00% | 0.40% | 0.40% | 81.10% | 13.70% | 0.10% | 60.60% | |
| plain | 56.40% | 5.00% | 56.60% | 31.20% | 30.20% | 31.20% | 28.10% | 18.90% | 6.20% | 20.30% | 4.70% | |
| population density (/km²) | Mean | 30 | 17 | 83 | 190 | 322 | 385 | 125 | 16 | 289 | 283 | 137 |
| Min | <1 | <1 | <1 | <1 | <1 | <1 | <1 | <1 | <1 | <1 | <1 | |
| Max | 2112 | 542 | 2642 | 3398 | 6342 | 12,672 | 4339 | 2413 | 7468 | 3808 | 8191 | |
| village density (/100km²) | Mean | 3 | 8 | 15 | 39 | 70 | 44 | 21 | 4 | 51 | 58 | 35 |
| Min | <1 | <1 | <1 | <1 | <1 | <1 | <1 | <1 | <1 | <1 | <1 | |
| Max | 62 | 77 | 80 | 1370 | 1497 | 344 | 1045 | 370 | 394 | 261 | 275 | |
References
- Moreno-Rueda, G.; Pizarro, M. Relative influence of habitat heterogeneity, climate, human disturbance, and spatial structure on vertebrate species richness in Spain. Ecol. Res. 2009, 24, 335–344. [Google Scholar] [CrossRef]
- Hale, R.L.; Grimm, N.B.; Vorosmarty, C.J. Spatial-Temporal Heterogeneity in Regional Watershed Phosphorus Cycles Driven by Changes in Human Activity over the Past Century. In Proceedings of the AGU Fall Meeting, San Francisco, CA, USA, 15–19 December 2014. [Google Scholar]
- Qin, C. China Environmental Economic General Equilibrium Analysis System and Its Application; China Science Press: Beijing, China, 2014. [Google Scholar]
- Weizhong, S.U.; Duan, H. Catchment-based Imperviousness Metrics Impacts on Floods in Niushou River Basin, Nanjing City, East China. Chin. Geogr. Sci. 2017, 27, 229–238. [Google Scholar]
- Li, C.; Yuan, B.; Zhang, M. Response of Flash Flood Early Warning Critical Rainfall to Storm Pattern in South Branch of Censhui Watershed. J. Environ. Sci. Eng. B 2015, 4, 637–648. [Google Scholar]
- Guo, L.; He, B.; Ma, M. A comprehensive flash flood defense system in China: Overview, achievements, and outlook. Nat. Hazards 2018, 92, 727–740. [Google Scholar] [CrossRef]
- Sun, D.; Zhang, D.; Cheng, X. Framework of National Non-Structural Measures for Flash Flood Disaster Prevention in China. Water 2012, 4, 272–282. [Google Scholar] [CrossRef]
- Bajabaa, S.; Masoud, M.; Al-Amri, N. Flash flood hazard mapping based on quantitative hydrology, geomorphology and GIS techniques (case study of Wadi Al Lith, Saudi Arabia). Arab. J. Geosci. 2014, 7, 2469–2481. [Google Scholar] [CrossRef]
- Lu, G.; Ling, Z.; Wu, Z. Zoning of Mountain Torrent Hazards in Medium-Small River Basins. Earth Sci. 2014, 39, 1438–1444. [Google Scholar]
- Guo, L.; Liu, C.; Ding, L. Working plan for mountain flood investigation and evaluation in China. China Water Resour. 2012, 23, 10–12. [Google Scholar]
- Gang, Z.; Bo, P.; Zongxue, X.U. Assessment on the hazard of flash flood disasters in China. J. Hydraul. Eng. 2016, 47, 1133–1142. [Google Scholar]
- Liu, Y.; Yang, Z.; Huang, Y. Spatiotemporal evolution and driving factors of China’s flash flood disasters since 1949. Sci. China (Earth Sci.) 2018, 61, 1804–1817. [Google Scholar] [CrossRef]
- Tang, C.; Zhu, J.A. GIS based regional torrent risk zonation. Acta Geogr. Sin. 2005, 60, 87–94. [Google Scholar]
- Liu, Y.; Yuan, X.; Guo, L. Driving Force Analysis of the Temporal and Spatial Distribution of Flash Floods in Sichuan Province. Sustainability 2017, 9, 1527. [Google Scholar] [CrossRef] [Green Version]
- Xiong, J.; Ye, C.; Cheng, W. The Spatiotemporal Distribution of Flash Floods and Analysis of Partition Driving Forces in Yunnan Province. Sustainability 2019, 11, 2926. [Google Scholar] [CrossRef] [Green Version]
- Gruntfest, E.; Handmer, J. Coping with Flash Floods; Springer: Dordrecht, The Netherlands, 2001. [Google Scholar]
- Terti, G.; Ruin, I.; Anquetin, S. Dynamic vulnerability factors for impact-based flash flood prediction. Nat. Hazards 2015, 79, 1481–1497. [Google Scholar] [CrossRef]
- Blöschl, G.; Ardoin-Bardin, S.; Bonell, M. At what scales do climate variability and land cover change impact on flooding and low flows? Hydrol. Process. 2007, 21, 1241–1247. [Google Scholar] [CrossRef]
- Shi, P.; Lili, L.; Ming, W. Disaster system: Disaster cluster, disaster chain and disaster compound. J. Nat. Disasters 2014, 23, 1–12. [Google Scholar]
- Zhong, D.; Xie, H.; Wei, F. Discussion on Mountain Hazards Chain. J. Mt. Sci. 2013, 31, 314–326. [Google Scholar]
- Cui, P.; Zou, Q. Theory and method of risk assessment and risk management of debris flows and flash floods. Prog. Geogr. 2016, 35, 137–147. [Google Scholar]
- Chang, H.-S.; Chen, T.-L. Spatial heterogeneity of local flood vulnerability indicators within flood-prone areas in Taiwan. Environ. Earth Sci. 2016, 75, 1484.1–1484.14. [Google Scholar] [CrossRef]
- Borga, M. Forecasting, Early Warning and Event Management: Non-structural Protection Measures for Flash Floods and Debris Flows. In Dating Torrential Processes on Fans and Cones: Methods and Their Application for Hazard and Risk Assessment; Schneuwly-Bollschweiler, M., Stoffel, M., Rudolf-Miklau, F., Eds.; Springer: Dordrecht, The Netherlands, 2013; pp. 391–398. [Google Scholar]
- Guo, L.; Zhang, X.; Liu, R. Achievements and Preliminary Analysis on China National Flash Flood Disasters Investigation and Evaluation. J. Geo-Inf. Sci. 2017, 19, 1548–1669. [Google Scholar]
- Yuan, X.; Liu, Y.; Huang, Y. An approach to quality validation of large-scale data from the Chinese Flash Flood Survey and Evaluation (CFFSE). Nat. Hazards 2017, 89, 693–704. [Google Scholar] [CrossRef]
- Xing-Hua, L.I. Regularity and cause of mountain torrents in Inner Mongolia in recent 50 years. J. Nat. Disasters 2006, S1, 241–246. [Google Scholar]
- Gaume, E.; Bain, V.; Bernardara, P. A compilation of data on European flash floods. J. Hydrol. 2009, 367, 70–78. [Google Scholar] [CrossRef] [Green Version]
- Terti, G.; Ruin, I.; Gourley, J.J. Toward Probabilistic Prediction of Flash Flood Human Impacts. Risk Anal. 2017, 110, 1779. [Google Scholar] [CrossRef] [PubMed]
- Getis, A.; Ord, J.K. The Analysis of Spatial Association by Use of Distance Statistics. Geogr. Anal. 1992, 24, 189–206. [Google Scholar] [CrossRef]
- Ord, J.K.; Getis, A. Local Spatial Autocorrelation Statistics: Distributional Issues and an Application. Geogr. Anal. 1995, 27, 286–306. [Google Scholar] [CrossRef]
- Huawei, L.I.; Wan, Q. Study on Rainfall Index Selection for Hazard Analysis of Mountain Torrents Disaster of Small Watersheds. J. Geo-Inf. Sci. 2017, 19, 425–435. [Google Scholar]
- Liu, Y.H.; Tang, C.; Jian-Bo, W.U. Spatial and temporal distribution characteristics of geo-hazards and rainfall in different scales. Chin. J. Geol. Hazard Control 2011, 22, 74–83. [Google Scholar]
- Liu, Z.J.; Yu, X.X.; Wang, S.S.; Shang, G.D. Comparative analysis of three covariates methods in Thin-Plate Smoothing Splines for interpolating precipitation. Progr. Geogr. 2012, 31, 56–62. [Google Scholar]
- You, S.; Li, Z.; You, S. Comparison on methods for resterization of air temperature data. Resour. Sci. 2003, 6, 83–88. [Google Scholar]
- Yang, X.H.; Huang, Y.H.; Dong, P.L. An updating system for the gridded population database of China based on remote sensing, GIS and spatial database technologies. Sensors 2009, 9, 1128. [Google Scholar] [CrossRef] [PubMed] [Green Version]
- Smith, J.A.; Baeck, M.L.; Meierdiercks, K.L. Radar rainfall estimation for flash flood forecasting in small urban watersheds. Adv. Water Resour. 2007, 30, 2087–2097. [Google Scholar] [CrossRef]
- Prasad, R.N.; Pani, P. Geo-hydrological analysis and sub watershed prioritization for flash flood risk using weighted sum model and Snyder’s synthetic unit hydrograph. Model. Earth Syst. Environ. 2017, 3, 1–12. [Google Scholar] [CrossRef]
- Wang, J.; Chengdong, X.U. Geodetector: Principle and prospective. Acta Geogr. Sin. 2017, 72, 116–134. [Google Scholar]
- Wang, J.F.; Zhang, T.L.; Fu, B.J. A measure of spatial stratified heterogeneity. Ecol. Indic. 2016, 67, 250–256. [Google Scholar] [CrossRef]
- Wang, J.; Gao, B.; Stein, A. The spatial statistic trinity: A generic framework for spatial sampling and inference. Environ. Model. Softw. 2020, 134, 104835. [Google Scholar] [CrossRef]
- Wang, J.F.; Li, X.H.; Christakos, G. Geographical Detectors-Based Health Risk Assessment and its Application in the Neural Tube Defects Study of the Heshun Region, China. Int. J. Geogr. Inf. Sci. 2010, 24, 107–127. [Google Scholar] [CrossRef]
- Xie, G.D.; Zhang, C.S.; Zhang, L.B. China’s County-Scale Ecological Regionalization. J. Nat. Resour. 2012, 27, 154–162. [Google Scholar]
- Jiaming, L.I.; Dadao, L.U.; Chengdong, X.U. Spatial heterogeneity and its changes of population on the two sides of Hu Line. Acta Geogr. Sin. 2017, 72, 148–160. [Google Scholar]
- Mao, R.; Gong, D.-Y.; Yang, J. Linkage between the Arctic Oscillation and winter extreme precipitation over central-southern China. Clim. Res. 2011, 50, 187–201. [Google Scholar] [CrossRef] [Green Version]
- Zomer, R.J.; Trabucco, A.; Metzger, M.J. Projected climate change impacts on spatial distribution of bioclimatic zones and ecoregions within the Kailash Sacred Landscape of China, India, Nepal. Clim. Chang. 2014, 125, 445–460. [Google Scholar] [CrossRef]
- Tao, Y.; Tang, C. The influence of human activity and precipitation change on mid-long term evolution of landslide and debris flow disasters. Sci. Cold Arid Reg. 2013, 5, 715–721. [Google Scholar]
- Huang, G.; Chen, Z. Research on critical rainfall of mountain torrent disasters based on effective antecedent rainfall. J. Nat. Disasters 2014, 23, 192–197. [Google Scholar]
- Miao, Q.; Yang, D.; Yang, H. Establishing a rainfall threshold for flash flood warnings in China’s mountainous areas based on a distributed hydrological model. J. Hydrol. 2016, 541, 371–386. [Google Scholar] [CrossRef]
- Garambois, P.A.; Larnier, K.; Roux, H. Analysis of flash flood-triggering rainfall for a process-oriented hydrological model. Atmos. Res. 2014, 137, 14–24. [Google Scholar] [CrossRef] [Green Version]
Figure 1.
Flash floods in each ecoregion in China from 1950 to 2015. (Notes: NWAR: Northwest Arid Region; TP: Tibetan Plateau; Inner MP: Inner Mongolia Plateau; NER: Northeast China region; LP: The Loess Plateau; North China: North China ecoregion; HDM: Hengduan mountainous ecoregion; Ch-Yu: Ch-Yu ecoregion; MLY: the middle and lower reaches of the Yangtze River region; Yun-Gui: Yun-Gui Plateau; South China: South China ecoregion).

Figure 2.
Spatial distributions of precipitation factors (Notes: (a) P(<10); (b) P(10–25); (c) P(25–50); (d) P(50–100); (e) P(10–250); (f) P(>250). P(<10) means annual average number of days with daily precipitation less than 10 mm and P(10–25) means annual average number of days with daily precipitation greater than 10 mm and less than 25 mm).


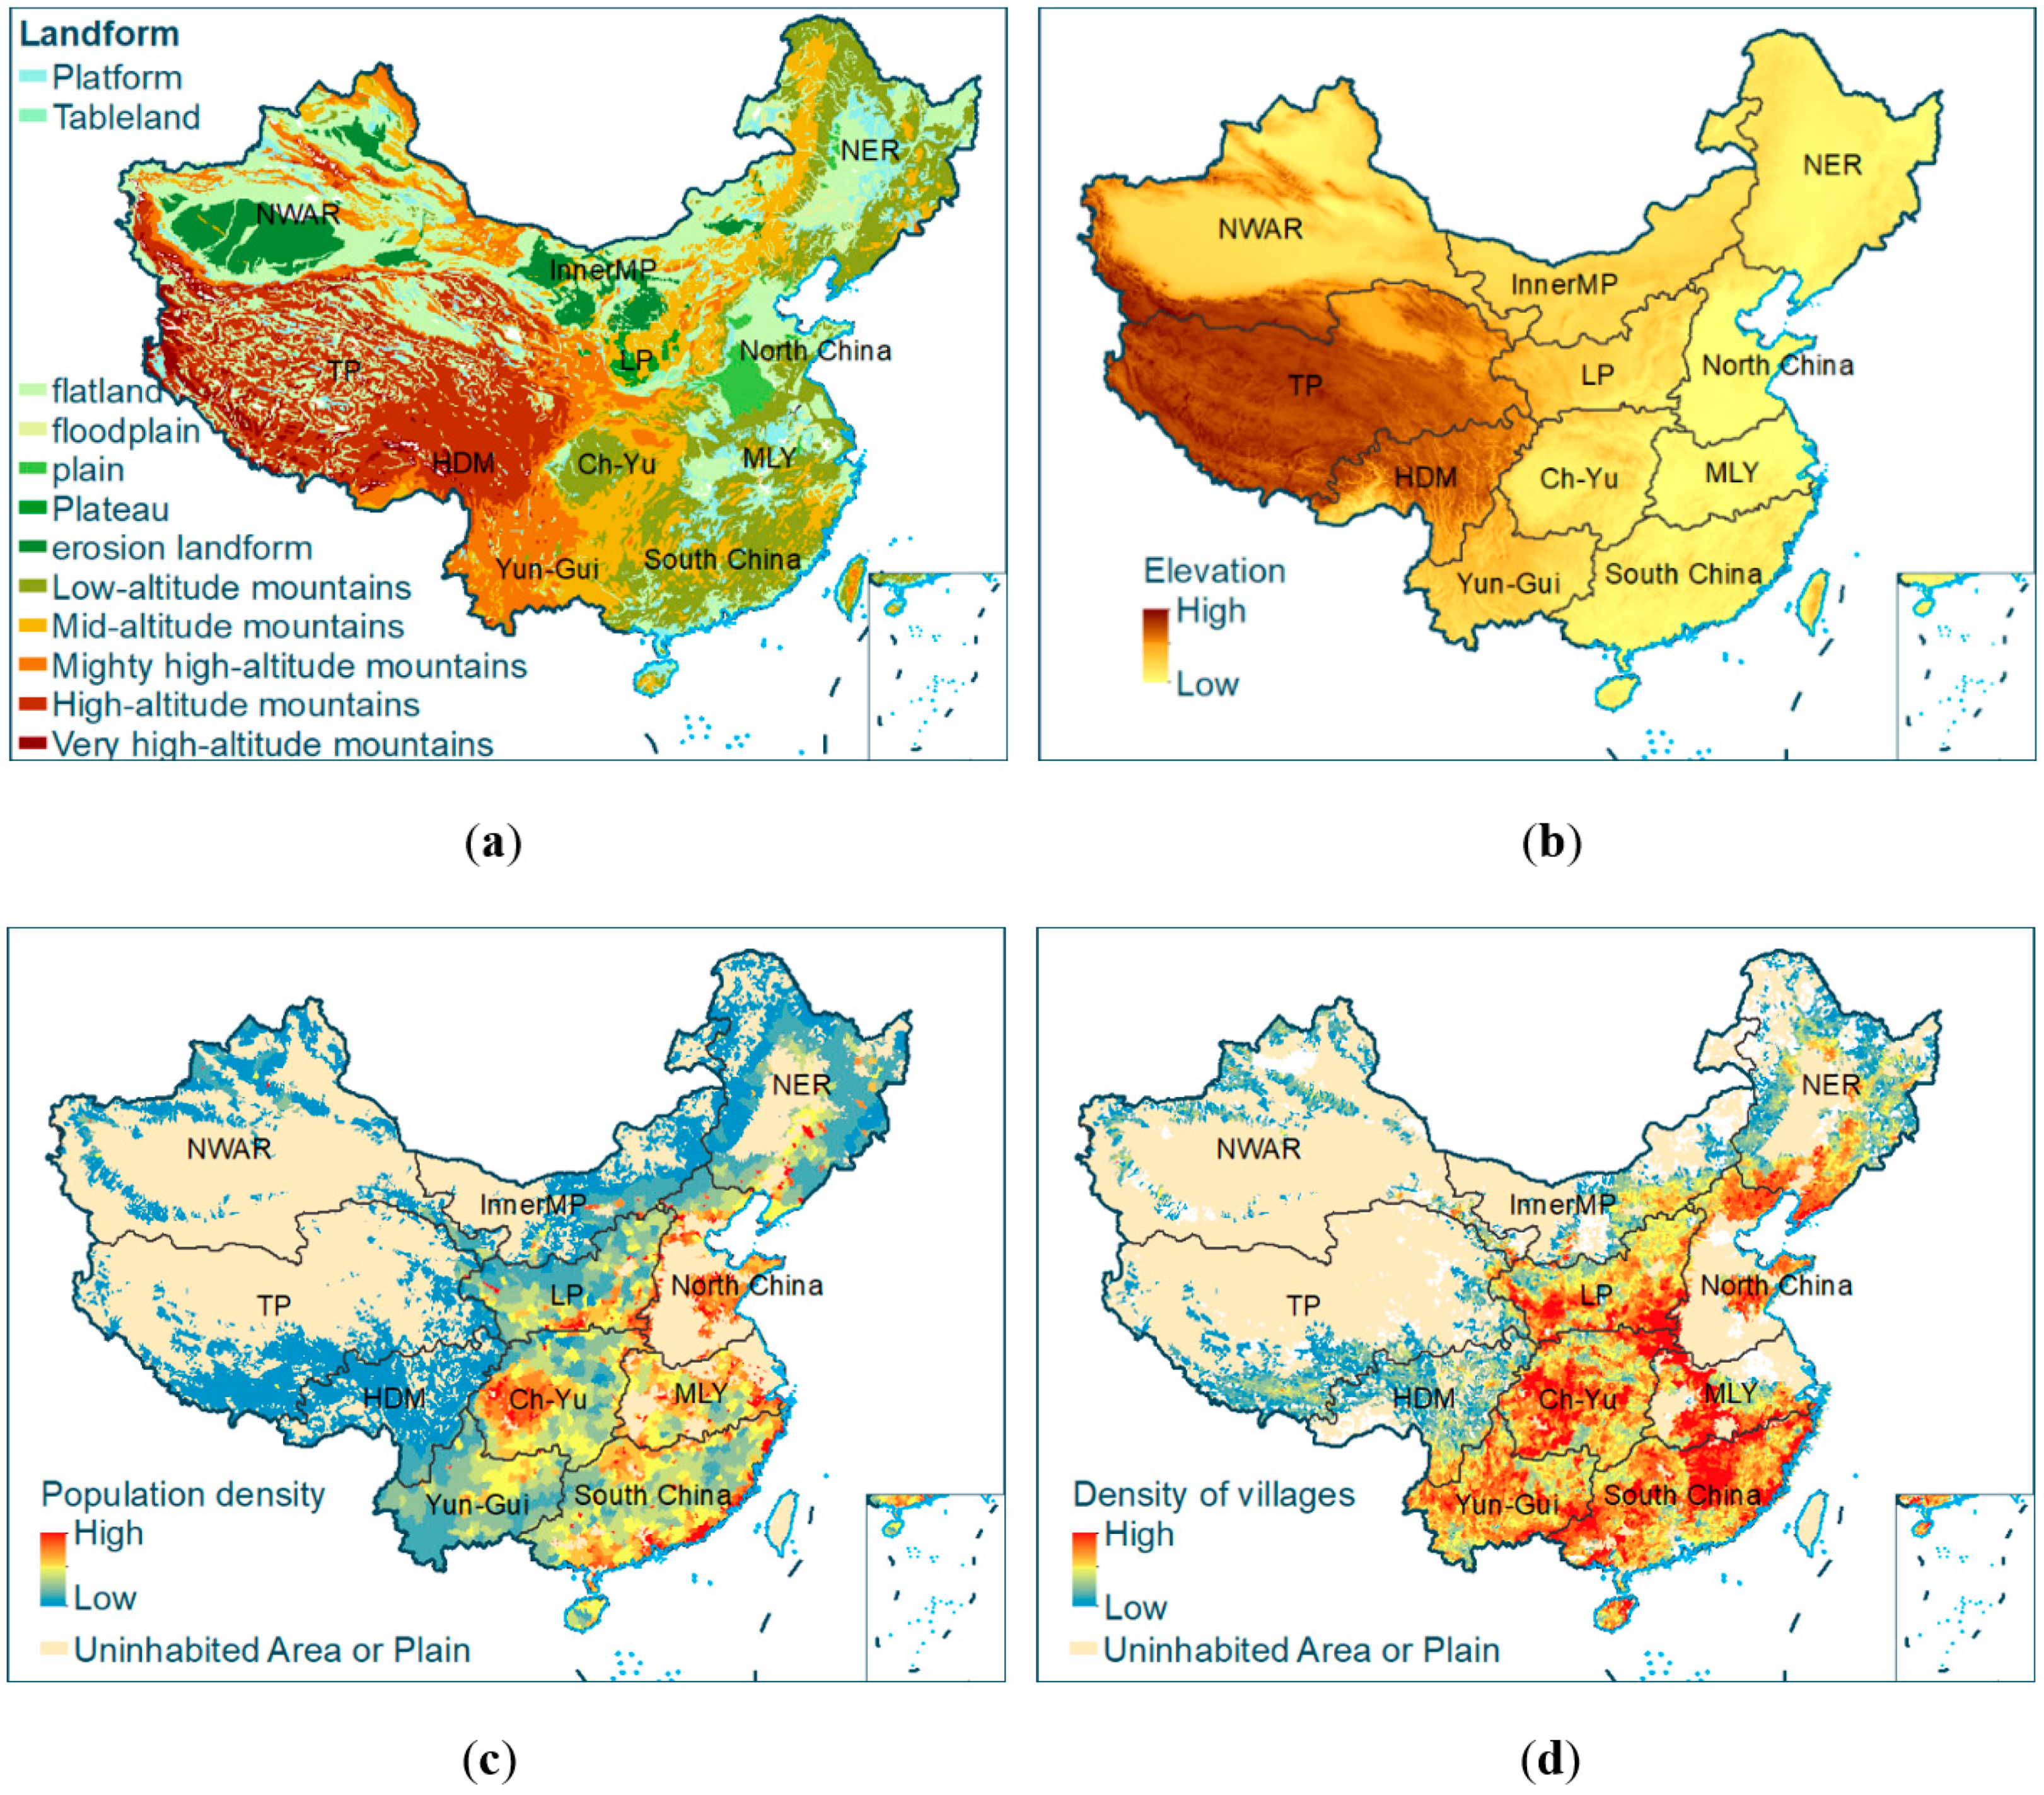
Figure 3.
Spatial distributions of natural environment and human activity factors. (Notes: (a) landform; (b) elevation; (c) population density; (d) village density).
Figure 3.
Spatial distributions of natural environment and human activity factors. (Notes: (a) landform; (b) elevation; (c) population density; (d) village density).

Figure 4.
Regional difference in interactions between precipitation and landforms affecting flash floods.
Figure 4.
Regional difference in interactions between precipitation and landforms affecting flash floods.

Figure 5.
Regional difference in interactions between precipitation and landforms affecting flash floods.
Figure 5.
Regional difference in interactions between precipitation and landforms affecting flash floods.

Table 1.
Data Sources.
| Data | Period | Source | Format | Description |
|---|---|---|---|---|
| Flash floods | 1950–2015 | Investigation Project of Chinese Flash Floods (IPCFF) | Point layer | Location, time, etc. |
| Ecoregion | 2012 | Xie et al. | Polygon layer | Classified into 11 Ecoregion |
| Precipitation | 1950–2015 | CMA | Table | Daily data of 175 national meteorological station |
| DEM | 2003 | NASA | 90 m × 90 m grid | Shuttle Radar Topography Mission (STRM) |
| Land use | 2010 | RESDC 1 | Polygon layer | Based on 1:1,000,000 land use dataset |
| Soil | 2010 | RESDC | Polygon layer | integrated from 1:1,000,000 soil type maps and the 2nd national soil census data |
| Landform | 1994 | RESDC | Polygon layer | 1:4,000,000 geomorphological map of China |
| Vegetation | 1996 | RESDC | Polygon layer | 1:4,000,000 geomorphological map of China |
| Population | 2000 | RESDC | 1 km × 1 km grid | Grid value is population |
| Village | 2000 | RESDC | Point layer | Village layer of national basic geography layer |
1 RESDC: Resources and Environmental Sciences Data Centre (http://www.resdc.cn, Beijing, China).
Table 2.
Types of interaction between two factors.
| Interaction | Description |
|---|---|
| Weaken, nonlinear | PD(L1∩L2) < Min(PD(L1), PD(L2)) |
| Weaken, unilinear | Min(PD(L1), PD(L2)) < PD(L1∩ L2) < Max(PD(L1)), PD(L2)) |
| Bilinear enhanced | PD(L∩L2) > Max(PD(L), PD(L2)) |
| Independent | PD(L∩L2) = PD(L) + PD(L2) |
| Nonlinear enhanced | PD(L∩L2) > PD(L) + PD(L2) |
Where the symbol “∩” represents the union between L1 and L2.
Table 3.
Results of key influential factors.
| Ecoregion | NWAR | TP | Inner MP | NER | LP | North China | HDM | Ch-Yu | LMY | Yun-Gui | South China |
|---|---|---|---|---|---|---|---|---|---|---|---|
| P(<10) | 0.368 | 0.349 | 0.346 | 0.613 | 0.253 | 0.294 | 0.111 | 0.27 | 0.135 | 0.212 | 0.315 |
| P(10–25) | 0.567 | 0.348 | 0.216 | 0.466 | 0.297 | 0.176 | 0.276 | 0.336 | 0.176 | 0.353 | 0.205 |
| P(25–50) | 0.589 | 0.28 | 0.17 | 0.233 | 0.257 | 0.171 | 0.215 | 0.33 | 0.086 | 0.065 | 0.098 |
| P(50–100) | 0.707 | 0.337 | 0.289 | 0.134 | 0.289 | 0.2 | 0.365 | 0.334 | 0.075 | 0.104 | 0.084 |
| P(100–250) | 0.756 | 0.104 | 0.434 | 0.162 | 0.422 | 0.065 | 0.255 | 0.392 | 0.059 | 0.062 | 0.126 |
| P(>250) | 0.704 | 0.206 | 0.44 | 0.306 | 0.564 | 0.044 | 0.231 | 0.301 | 0.134 | 0.06 | 0.199 |
| population density | 0.501 | 0.384 | 0.22 | 0.11 | 0.194 | 0.033 | 0.252 | 0.053 | 0.033 | 0.081 | 0.013 |
| village density | 0.597 | 0.321 | 0.236 | 0.273 | 0.155 | 0.446 | 0.194 | 0.031 | 0.087 | 0.018 | 0.011 |
| elevation | 0.116 | 0.672 | 0.034 | 0.122 | 0.231 | 0.019 | 0.266 | 0.024 | 0.011 | 0.009 | 0.02 |
| Slope | 0.034 | 0.063 | 0.178 | 0.113 | 0.012 | 0.019 | 0.069 | 0.052 | 0.014 | 0.017 | 0.019 |
| land use | 0.104 | 0.248 | 0.069 | 0.136 | 0.173 | 0.071 | 0.039 | 0.026 | 0.052 | 0.033 | 0.1 |
| vegetation | 0.192 | 0.146 | 0.131 | 0.234 | 0.173 | 0.044 | 0.155 | 0.158 | 0.124 | 0.078 | 0.181 |
| soil | 0.285 | 0.343 | 0.093 | 0.149 | 0.067 | 0.125 | 0.149 | 0.031 | 0.11 | 0.146 | 0.08 |
| landform | 0.509 | 0.714 | 0.312 | 0.209 | 0.22 | 0.558 | 0.189 | 0.306 | 0.086 | 0.049 | 0.401 |
Note: The factor with the largest impact of each ecoregion is in bold.
Table 4.
Summary of interaction among influential factors.
| Ecoregion | Factors with Highest Interactive Power of Determinant (PD) | PD of Interaction Detector | Relationship of the Two Factors |
|---|---|---|---|
| NWAR | Landform, P(>250) | 0.901 | Bilinear enhanced |
| TP | Landform, P(>250) | 0.861 | Bilinear enhanced |
| Inner MP | Landform, P(100–250) | 0.737 | Bilinear enhanced |
| NER | P(<10), P(>250) | 0.800 | Bilinear enhanced |
| LP | P(25–50), P(>250) | 0.819 | Bilinear enhanced |
| North China | Landform, P(100–250) | 0.770 | Nonlinear enhanced |
| HDM | P(10–25), P(>250) | 0.690 | Nonlinear enhanced |
| Ch-Yu | P(50–100), P(>250) | 0.617 | Bilinear enhanced |
| LMY | P(<10), P(>250) | 0.478 | Nonlinear enhanced |
| Yun-Gui | P(10–25), P(>250) | 0.532 | Nonlinear enhanced |
| South China | Landform, P(>250) | 0.641 | Nonlinear enhanced |
Publisher’s Note: MDPI stays neutral with regard to jurisdictional claims in published maps and institutional affiliations. |
© 2020 by the authors. Licensee MDPI, Basel, Switzerland. This article is an open access article distributed under the terms and conditions of the Creative Commons Attribution (CC BY) license (http://creativecommons.org/licenses/by/4.0/).
Share and Cite
MDPI and ACS Style
Liu, Y.; Huang, Y. Why Flash Floods Occur Differently across Regions? A Spatial Analysis of China. Water 2020, 12, 3344. https://doi.org/10.3390/w12123344
AMA Style
Liu Y, Huang Y. Why Flash Floods Occur Differently across Regions? A Spatial Analysis of China. Water. 2020; 12(12):3344. https://doi.org/10.3390/w12123344
Chicago/Turabian StyleLiu, Yesen, and Yaohuan Huang. 2020. "Why Flash Floods Occur Differently across Regions? A Spatial Analysis of China" Water 12, no. 12: 3344. https://doi.org/10.3390/w12123344
Note that from the first issue of 2016, this journal uses article numbers instead of page numbers. See further details here.