Study on Heavy Metal Contamination in High Water Table Coal Mining Subsidence Ponds That Use Different Resource Reutilization Methods

1
Jiangsu Key Laboratory of Resources and Environmental Information Engineering, China University of Mining and Technology, Xuzhou 221116, China
2
Xuzhou Institute of Ecological Civilization Construction, Xuzhou 221008, China
*
Author to whom correspondence should be addressed.
Water 2020, 12(12), 3348; https://doi.org/10.3390/w12123348
Submission received: 27 October 2020
/
Revised: 23 November 2020
/
Accepted: 25 November 2020
/
Published: 29 November 2020
Abstract
:Heavy metals accumulate in high water table coal mining subsidence ponds, resulting in heavy metal enrichment and destruction of the ecological environment. In this study, subsidence ponds with different resource reutilization methods were used as study subjects, and non-remediated subsidence ponds were collectively used as the control region to analyze the heavy metal distributions in water bodies, sediment, and vegetation. The results revealed the arsenic content in the water bodies slightly exceeded Class III of China’s Environmental Quality Standards for Surface Water. The lead content in water inlet vegetation of the control region and the Anguo wetland severely exceeded limits. Pearson’s correlation, PCA, and HCA analysis results indicated that the heavy metals at the study site could be divided into two categories: Category 1 is the most prevalent in aquaculture pond B and mainly originate from aquaculture. Category 2 predominates in control region D and mainly originates from atmospheric deposition, coal mining, and leaching. In general, the degree of heavy metal contamination in the Anguo wetland, aquaculture pond, and fishery–solar hybrid project regions is lower than that in the control region. Therefore, these models should be considered during resource reutilization of subsidence ponds based on the actual conditions.
1. Introduction
Since the groundwater level in regions with a high water table is high, a large subsidence pond will form after a coal mine has collapsed [1]. This not only drastically decreases the land area but also affects the ecological structure to some extent and disrupts the ecological equilibrium. Subsidence ponds are usually closed or semi-closed systems to which atmospheric deposition and mine water will carry pollutants from the surroundings, resulting in the accumulation of high levels of heavy metals in these water bodies. At the same time, irrigation with contaminated water on surrounding farms, along with excessive chemical fertilizer application, further exacerbate heavy metal contamination in water bodies. The enrichment of high levels of heavy metals in sediment causes their levels to be significantly higher than background values, resulting in heavy metal contamination [2]. Hence, there is an urgent need to carry out resource reutilization of coal mining subsidence ponds.
Various levels of government are particularly concerned about the integrated remediation of coal mining subsidence ponds. Remediation of subsidence regions containing subsidence ponds should be carried out based on both the local natural and social environments. At present, there are several main remediation measures. Regions with shallow water accumulation and sufficient water supply can be reclaimed as paddy fields [3]. Subsidence ponds that have a water depth of < 3 m and are suitable for aquaculture can be converted into aquaculture ponds. At the same time, the fishery–solar hybrid model can be introduced to achieve power generation and fish rearing. In regions with large areas of water accumulation, a constructed wetland ecosystem can be created [4]. In regions with large water accumulation area and depth, good water quality, and good water conservancy conditions in surrounding regions, a plain reservoir can be constructed to solve local industrial, agricultural, and domestic water supply problems [5].
Employing different remediation measures for coal mining subsidence ponds can alleviate human–land conflict to varying degrees, utilize accumulated water resources and improve the ecological environment in order to bring about economic, social, and environmental benefits. We should not ignore potential environmental problems while focusing on the advantages of these measures, however. For example, some wetlands constructed from subsidence ponds also collect municipal sewage before processing, releasing it into constructed wetlands after the discharge standards are reached [6]. Municipal sewage usually has low heavy metal content. Although heavy metals are not the main problem with municipal sewage, they cannot be degraded and will accumulate in sediment, water bodies, aquatic plants, and animals, and enter humans via various food chains. The heavy metals can disturb human metabolomics, leading to morbidity and even mortality. Many studies have demonstrated that constructed wetlands can purify water. However, are heavy metals enriched in wetlands after constructed wetlands have received wastewater? Does heavy metal enrichment exceed the auto-purification capabilities of wetlands? Will the ecological equilibrium of the wetland system be disrupted? Will aquaculture increase the heavy metal burden of the ecosystem? In addition, although fishery–solar hybrid projects can promote local economic development, does the construction of solar panels adversely affect local water bodies, sediment, and aquatic plants? After the water has accumulated in coal mining subsidence ponds, what measures should be employed to better restore the ecological environment? These questions deserve consideration.
In response to these queries, a resource-exhausted city (Pei County of Xuzhou) in China was used as a study subject to examine heavy metal distributions in the sediment, water bodies, and vegetation of coal mining subsidence ponds using different resource reutilization methods (the Anguo wetland, an aquaculture pond, and solar hybrid project regions) and non-remediated subsidence ponds were collectively used as a control to analyze heavy metal contamination in coal mining subsidence ponds using different resource reutilization methods in order to provide a basis for reclamation plans for Pei County and other subsidence ponds.
2. Study Area
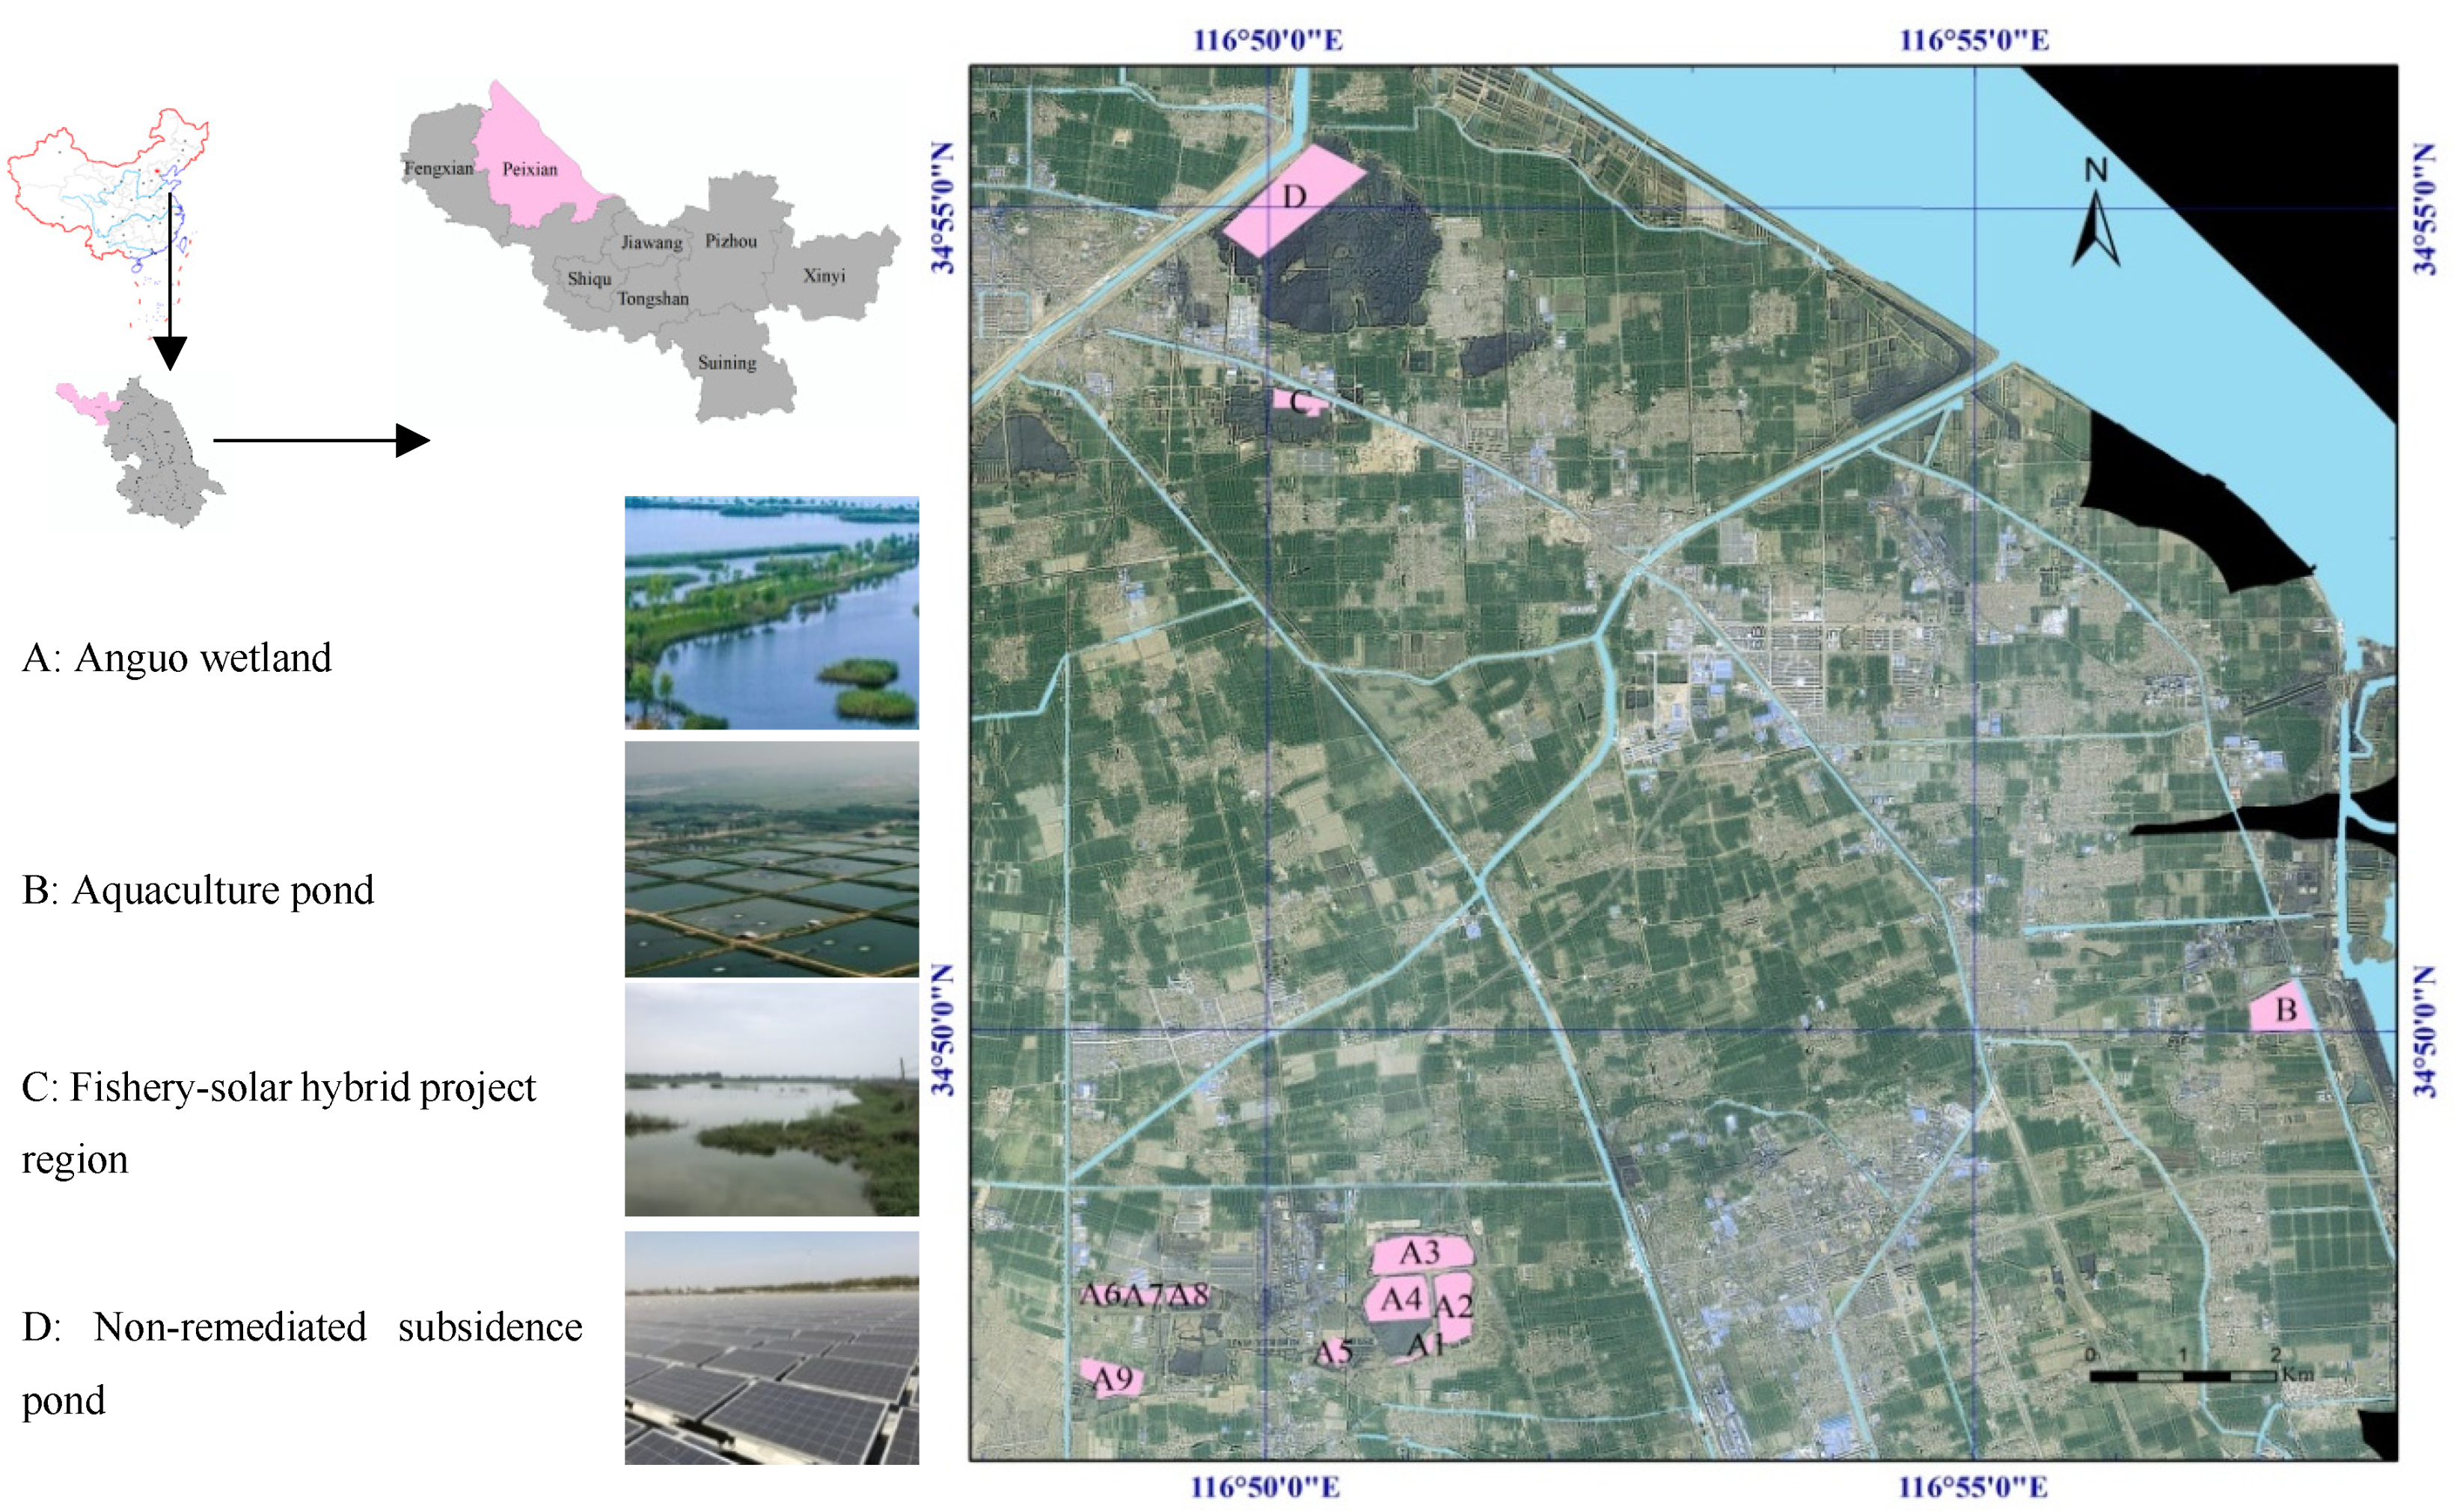
As shown in Figure 1, Pei County is located in the southern part of the North China Plain (latitude: 34°28′–34°59′ N, longitude: 116°41′–117°09′ E). It is a classic alluvial plain with an elevation that decreases from 41 m in the southwest to 31.5 m in the northeast. The annual mean sunshine of Pei County is 1850.3 h, the average temperature is 15.5 °C, the annual mean precipitation is 704.4 mm, the annual mean humidity is 72%, the annual mean runoff depth is 136 mm, the total runoff volume is 170 million m3, the runoff volume in wet years is 250–300 million m3, and the runoff volume in dry years is 60 million m3. Pei County is located in a region with a high water table, and the groundwater flows from southwest to northeast. The vertical depth is 20–40 m and decreases from southwest to northeast. The region also has good groundwater quality [7].
Pei County is a classic coal resource city. There are eight pairs of mines in the county with an annual output of more than 1300 t of superior quality coal. Currently, three pairs of mines are closed. As an important coal-producing region in China, Pei County has made enormous contributions to the country’s economic development. However, coal mining has created large areas of subsidence ponds, which have resulted in damage to the local ecosystems. According to statistics, the area of surface subsidence caused by coal mining in Pei County was 8450 ha by the end of 2019, of which 2149 ha were subsidence ponds formed when the subsidence was ≥2.0 m. Much still needs to be accomplished in order to achieve the integrated remediation of coal mining subsidence ponds.
In recent years, Pei County has focused on the remediation of coal mining subsidence areas. The subsidence ponds that have been flooded have been treated according to local conditions, and the ecological environment has been improved. It has won the 2018 United Nations Human Settlements Award. It has achieved a magnificent transformation from A city of coal ash and half a city of dust “ to “Green hills and half lakes“. The experience of coal mining subsidence in Pei County is also widely promoted.
3. Materials and Methods
3.1. Samples and Preparation
On 29 August 2019, sediment, overlying water, and vegetation samples were collected in (A) the Anguo wetland, (B) an aquaculture pond, (C) fishery–solar hybrid project region, and (D) non-remediated subsidence pond, which were collectively used as the control region. The Anguo wetland was constructed in 2012 in conjunction with the tailwater diversion project of the South-to-North Water Diversion Project and was rated as a national wetland park in 2015. It was divided into two independent wetland systems: water from the Zhangshuanglou Canal and Longkou River was collected at the south and west water inlets, respectively, of which water from the Zhangshuanglou Canal contains recycled water that was obtained after treatment of wastewater from the Pei County development zone and sewage from surrounding residential regions, while water from the Longkou river contains recycled water that was obtained after treatment of wastewater from the Longgu development zone and sewage from surrounding residential regions. After the wastewater has entered the Anguo wetland, it undergoes sedimentation in the inlet sedimentation zone and then flows through the primary and secondary surface flow regions before passing through the plant oxidation pond and other subsequent processing treatments in order to achieve the discharge standard prior to discharge from the wetland outlet. Nine sample plots were set up for the Anguo wetland (A), one for the aquaculture pond (B), one for the fishery–solar hybrid project region (C), and one for the non-remediated subsidence ponds (D), based on the characteristics of the study site. Three sampling points were set up for each sample plot, for a total of 12 sample plots and 36 sampling points in the study. Figure 1 shows the distribution of the sample plots. An organic glass sampling container was used to collect water samples 0.5 m below the water surface, which were then transferred into clean polyethylene bottles. A grab sampler was used to collect 0–10 cm surface layer sediment, which was immediately stored in polyethylene bags for transport back to the laboratory. Concurrently, intact plants were collected from the sample plots. All samples were immediately divided in two after being brought back to the laboratory, one of which was used for physicochemical measurements while the other was stored as a backup sample.
A Global Water (College Station, TX, USA) portable multipurpose water analyzer was used for onsite pH measurements of overlying water. Sediment samples were air-dried at room temperature. When soil moisture content reached the plastic limit, the sample was gently broken into small blocks of diameter < 1 cm following the natural structures (fissures) of the soil. Gravel and plant debris were removed, and the samples were sieved before physicochemical markers were measured. Plant samples were cleaned and dried to a constant weight (60 °C, 48 h). Following this, samples were ground and sieved before physicochemical markers were measured. The sieved sediment samples and plant samples underwent HNO3-HCl-HF (3:3:2) high-temperature digestion, and pH was measured using the 2.5:1 water/soil ratio acidity method [8]. Soil organic carbon (SOC) was analyzed using the potassium dichromate oxidation–ferrous sulfate titrimetric method. Soil available nitrogen (AN) was measured by the alkali N-proliferation method. The concentration of available phosphorus (AP) was determined using the Olsen method (UV-2550, UV-visible spectrophotometer, Shimadzu, Japan). Soil available potassium (AK) was measured by the 1 mol L−1 neutral NH4OAC method (iCAP 6300 ICP-OES spectrometer, Thermo Scientific, USA). Inductively coupled plasma atomic emission spectroscopy (ICP-ES) was used to measure cadmium (Cd), lead (Pb), chromium (Cr), copper (Cu), zinc (Zn), and arsenic (As) content. Mercury (Hg) content was measured using atomic fluorescence spectroscopy (AF-601A). The detection limits of Cd, Pb, Cr, Cu, Zn, Hg, and As were 0.01 mg kg−1, 0.1 mg kg−1, 4.0 mg kg−1, 1.0 mg kg−1, 0.5 mg kg−1, 0.2 μg kg−1, and 0.01 mg kg−1, respectively.
3.2. Pollution Assessment Methods
3.2.1. Sediment Quality Guidelines
At present, since there are no river sediment specifications in China, the paddy field standards in the “Soil environmental quality Risk control standard for soil contamination of agricultural land (GB15618 2018)” are usually used as a reference [9]. Therefore, we first used these paddy field standards to evaluate heavy metal contamination in sediment. Second, it is more meaningful to use the background soil heavy metal values in a specific region to evaluate heavy metal contamination. The soil heavy metal background represents the baseline value of the soil environment that was either not affected or only slightly affected by human activities. In this study, we used the background value of the soil environment in Jiangsu Province as an evaluation criterion to reevaluate heavy metal contamination in sediment. Class III of China’s Environmental Quality Standards for Surface Water (GB 3838–2002) was used as a reference for evaluating heavy metal levels in water bodies, a criterion that is mainly applicable for secondary concentrated domestic drinking water source protection regions, fish and prawn wintering sites, migration channels, aquaculture regions, and other fishing and swimming regions. The National Food Safety Standard Contaminant Limit in Food (GB2762-2017) [10] was used as a standard for evaluating plant heavy metals. Zn and Cu are not regulated in this standard.
3.2.2. Nemerow Synthetic Pollution Index
The Nemerow synthetic pollution index was used for a comprehensive assessment of the level of pollution by various heavy metals in sediment, overlying water, vegetation, and ecosystems. The calculation formula is as follows:
Here, P is the integrated pollution index of various sampling points, max(Pi) is the maximum value of the univariate pollution index of heavy metals, and is the mean value of the univariate pollution index of heavy metals [11]. Ci is the measurement of heavy metal i, while Si is the standard value of heavy metal i and wi is the weight of heavy metal i. According to Soil environmental quality Risk control standard for soil contamination of agricultural land (GB15618 2018), the standard values of Cu, Zn, Cr, Cd, Hg, As and Pb are 200 mg kg−1, 300 mg kg−1, 350 mg kg−1, 0.8 mg kg−1, 1.0 mg kg−1, 20 mg kg−1 and 240 mg kg−1 in the sediment, respectively. In water, the standard values of Cu, Zn, Cr, Cd, Hg, As and Pb are 1.0 mg kg−1, 1.0 mg kg−1, 0.05 mg kg−1, 0.005 mg kg−1, 0.1 mg kg−1, 0.01 mg kg−1 and 0.05 mg kg−1, respectively, according to Class III of China’s Environmental Quality Standards for Surface Water (GB 3838–2002), and the limits of Cr, Cd, Hg, As and Pb in plants are 0.5 mg kg−1, 0.05 mg kg−1, 0.01 mg kg−1, 0.5 mg kg−1 and 0.1 mg kg−1, respectively, according to the National Food Safety Standard Contaminant Limit in Food (GB2762-2017). The weight is determined by the magnitude of the effects of the heavy metal on the environment: Cd, Hg, As, and Pb are Class 1 metals, and their weight is three, while Cu, Zn, and Cr are Class 2 metals and their weight is two.
The above method was used to calculate Nemerow’s synthetic pollution index values for sediment, overlying water, and vegetation, which are represented as Psediment, Pwater, and Pplant, respectively. The arithmetic mean of Psediment, Pwater, and Pplant was used as Nemerow’s synthetic pollution index P of the sampling point. Finally, P was used for pollution grading: P ≤ 1: no pollution, 1 < P ≤ 2: mild pollution, 2 < P ≤ 3: moderate pollution, and P > 3: severe pollution.
3.2.3. Geoaccumulation Index
The geoaccumulation index Igeo was first proposed by Muller in 1969 [12] for quantifying heavy metal contamination in sediment. The calculation formula is as follows:
where Cn represents the measured concentration of heavy metal n in the sediment (mg kg−1), Bn is the background value of heavy metal n in the soil matrix in Pei County (mg kg−1), and 1.5 is the correction coefficient [13].
The heavy metal contamination was divided into seven categories based on the Igeo value, consisting of Class 0: Igeo ≤ 0, practically uncontaminated; Class 1:0 < Igeo ≤ 1, uncontaminated to moderately contaminated; Class 2:1 < Igeo ≤ 2, moderately contaminated; Class 3:2 < Igeo ≤ 3, moderately to heavily contaminated; Class 4:3 < Igeo ≤ 4, heavily contaminated; Class 5:4 < Igeo ≤ 5, heavily to extremely contaminated; Class 6: Igeo > 5, extremely contaminated.
3.3. Statistical Analyses
Pearson correlation is an indicator that is used to characterize the correlation of categorical variables. It is one of the most popular similarity measures to evaluate how much two variables are correlated. Moreover, it is appropriate for the variables with different magnitudes. Principal component analysis (PCA) is a commonly used multivariate analytical method for decreasing variables and dimensionality. We selected factors with eigenvalues > 1 as principal components to effectively reflect the original data [14]. Hierarchical cluster analysis (HCA) uses maximum inter-group differences and minimum intra-group differences for data classification [15] and is widely used in hydrogeochemistry [16,17]. We employed HCA and PCA to analyze the sources of heavy metal contamination. All calculations were completed in Statistical Package for the Social Sciences (SPSS) 26.0.
4. Results and Discussion
4.1. Assessment of Heavy Metal Contamination
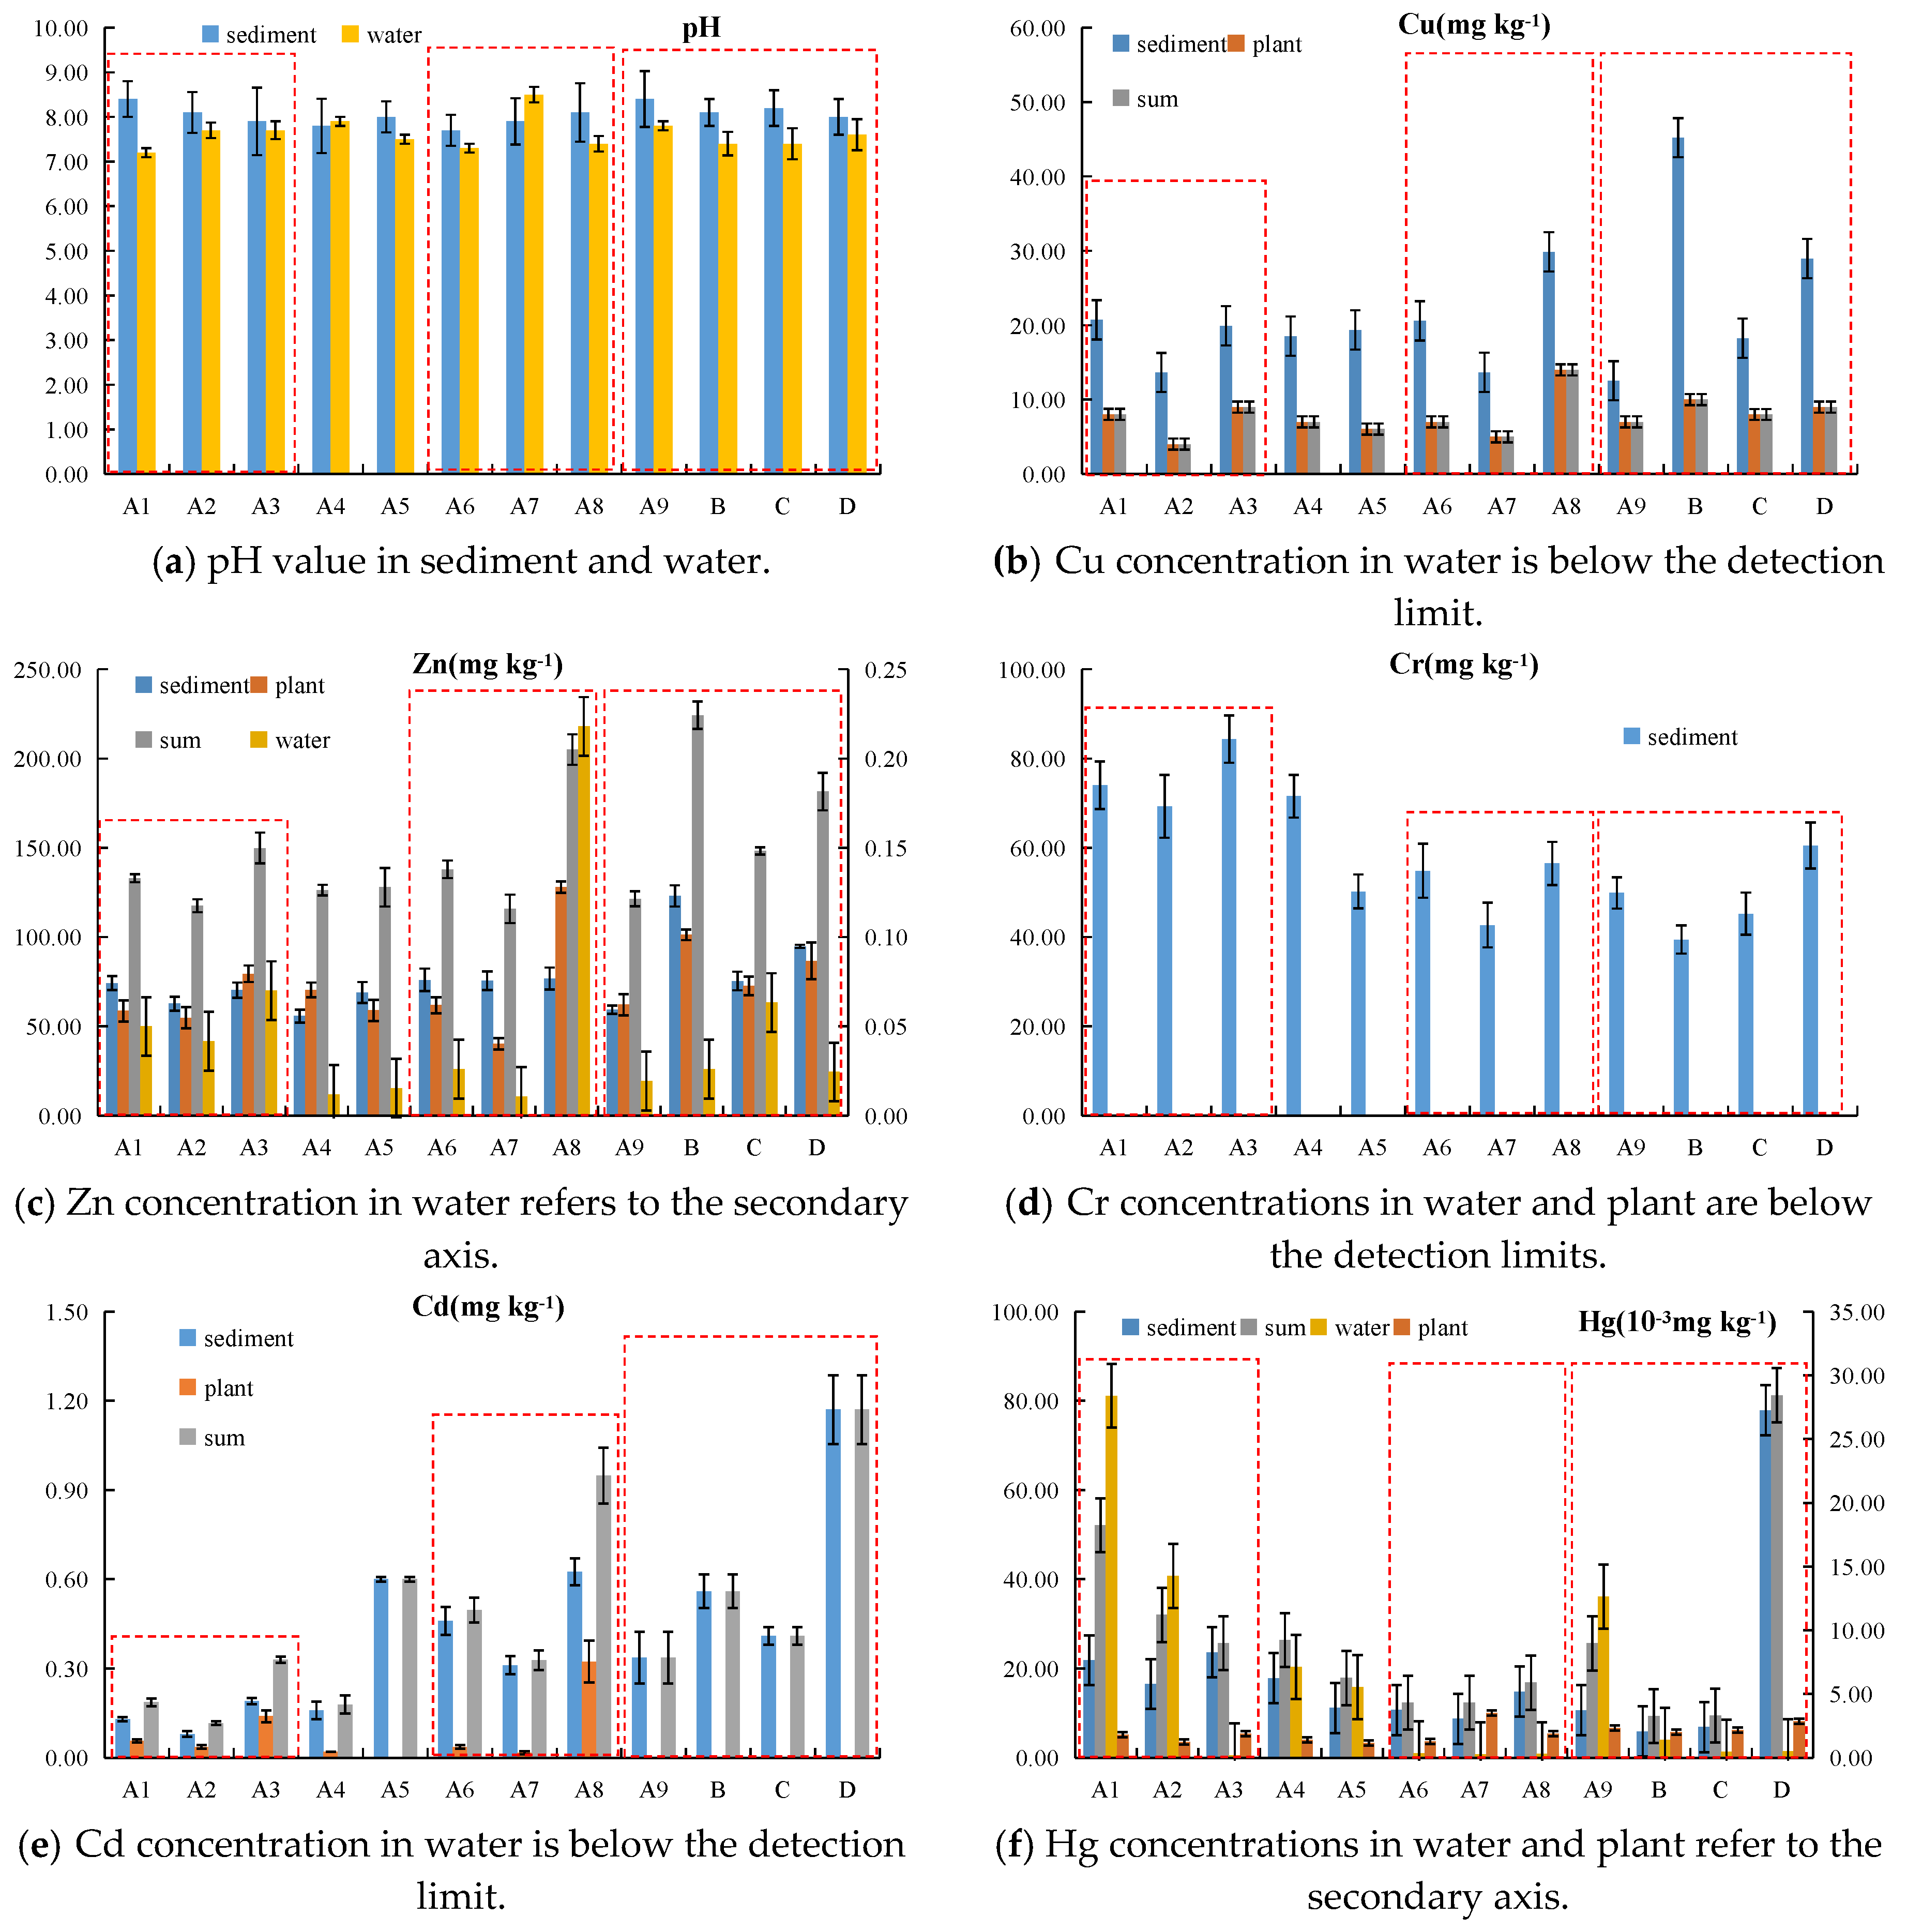
Figure 2 presents the changes in heavy metal content and pH in sediment, overlying water, and vegetation. From Figure 2a, it can be seen that the pH range of sediment was 7.7–8.4, indicating that it was weakly basic. This result is consistent with the results of research on high water table mines in eastern China [18,19,20]. The slightly high pH of sediment can be attributed to many factors, including climatic characteristics, parent material of the soil, soil cations, and organic acids released during organic matter accumulation and decomposition [21,22]. Specifically, Pei County is located north of the Yangtze River, where precipitation is low, leaching is weak, and soil basic ion content is high. In addition, the parent material of the soil is fluvo-aquic soil, in which organic matter content is low and free calcium carbonate content is high. The existence of carbonate soils causes the pH to be basic and the precipitation in the form of metal oxides. Therefore, the soil of this region tends to be basic.
In the sediment, the AN, AP, AK, and SOC concentrations were 0.2–10.2 mg kg−1, 4.3–15.8 mg kg−1, 5.2–27.8 mg kg−1, and 1.22–7.56 g kg−1, respectively. AN, AP, AK and SOC concentrations in the sediment could act as an important indicator of the health of the ecological system.
In the sediment, the Cu, Zn, Cr, Cd, Hg, As, and Pb concentrations were 12.54–45.21 mg kg−1, 55.86–123.00 mg kg−1, 39.44–84.34 mg kg−1, 0.08–1.17 mg kg−1, 5.92 × 10⁻³–77.88 × 10⁻³ mg kg−1, 6.02–14.70 mg kg−1, and 14.50–32.40 mg kg−1, respectively. By referencing the “Soil Environmental Quality in the Agricultural Land Soil Contamination Risk Management Control Standards,” it can be seen, with the exception of Cd content in the control region exceeding the limits, the levels of the other heavy metals were below the soil contamination risk management threshold. The assessment results were not encouraging; however, when the soil background values of Jiangsu Province were used as the basis for assessment. In the sediment, Cu, Zn, Cr, Cd, Hg, As, and Pb exceeded limits by 75%, 100%, 42%, 92%, 50%, 58%, and 67%, respectively. This indicates that the soil heavy metal content in Pei County is relatively low, and heavy metal content exceeding limits is the outcome of long-term exogenous input [23]. The reason Cu and Zn exceeded the limits is that high levels of Cu and Zn are currently present in feed additives, and long-term use, therefore, increases heavy metal content in the sediment. In addition, a large number of studies have shown that mining, the application of chemical fertilizers, and wastewater discharge may lead to heavy metal contamination [18,24,25]. According to reports, chemical fertilizers with poor calcium superphosphate contain trace amounts of As and Cd [26], while some pesticides contain Pb and Hg, which will enter the natural environment after application.
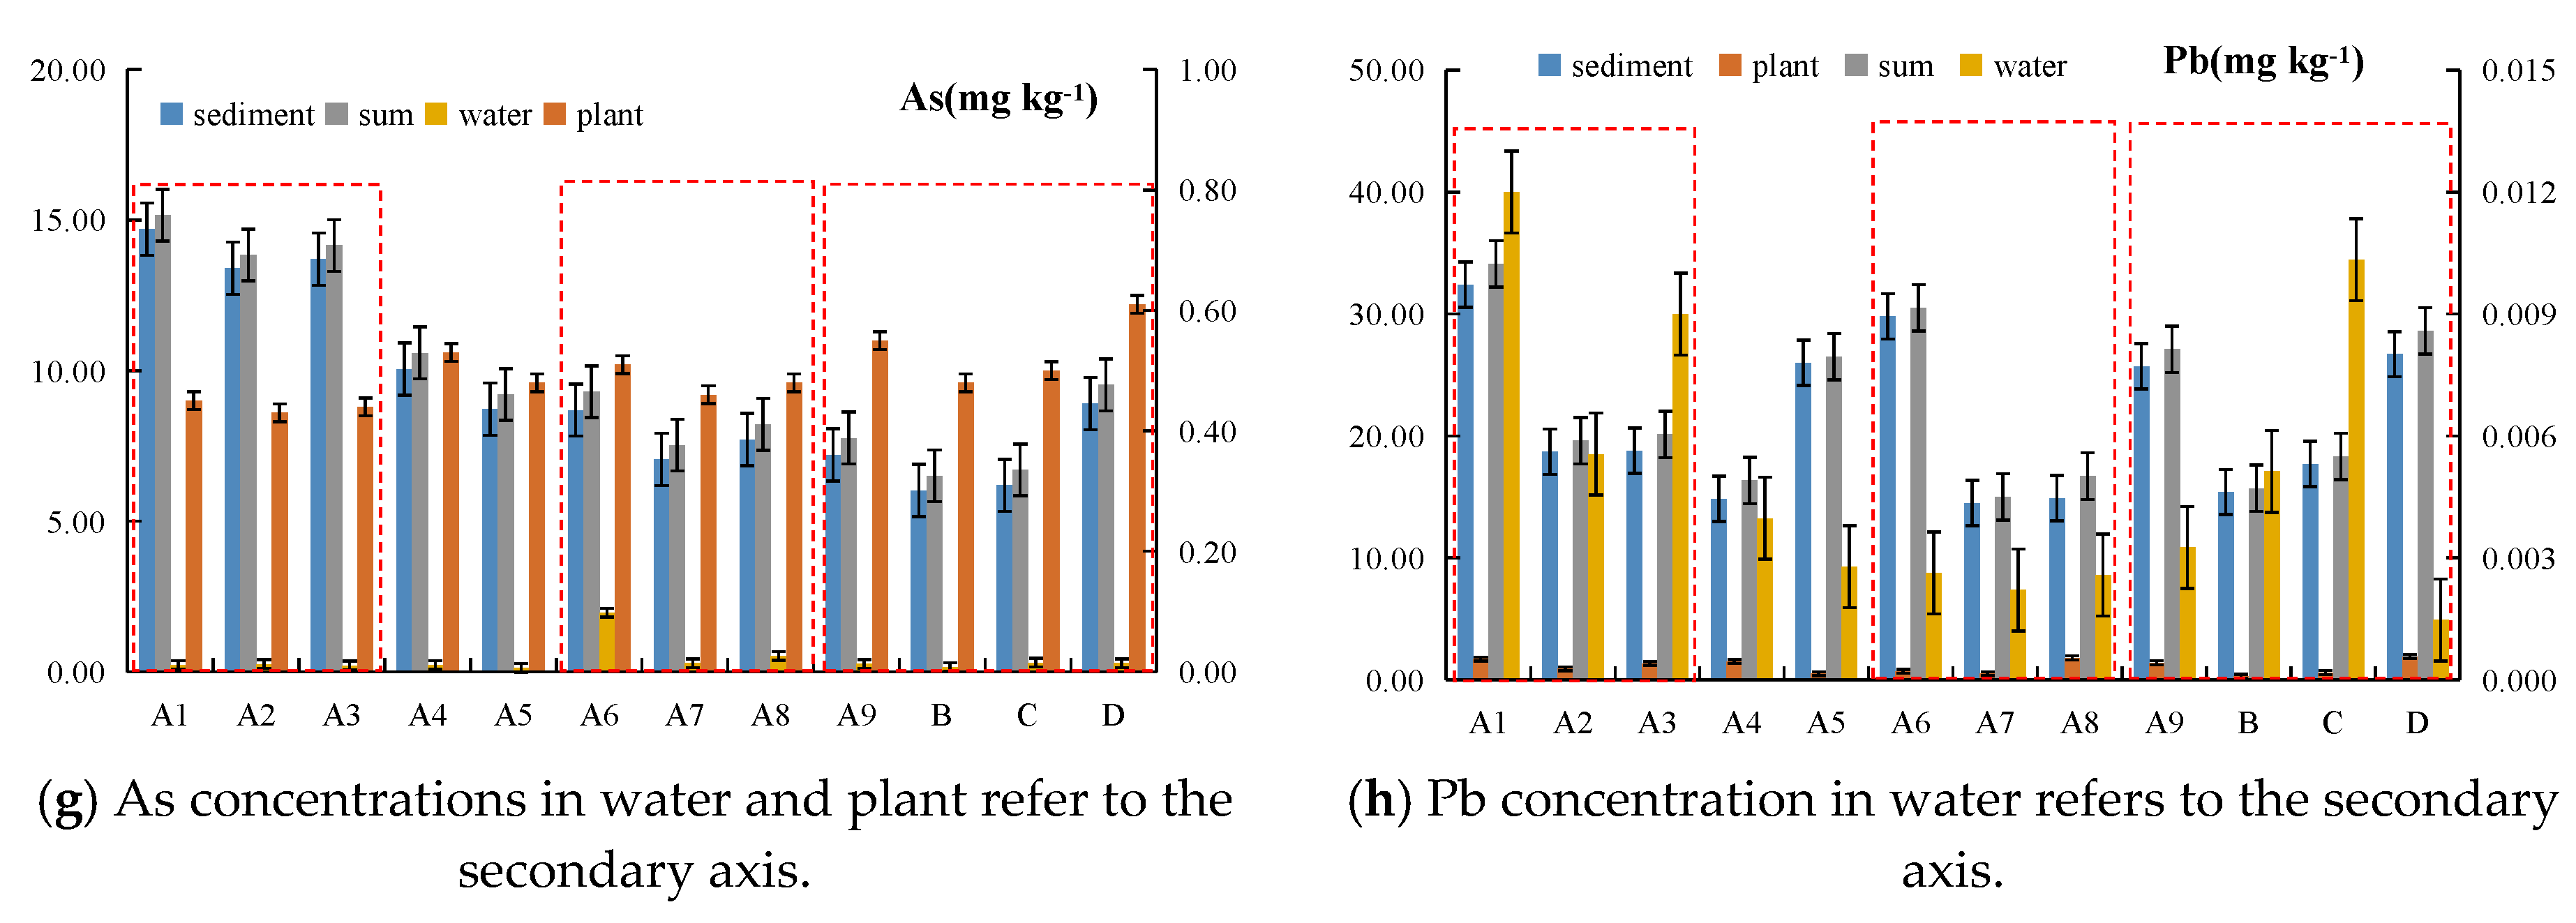
In water bodies, Cu, Cr, and Cd levels were below the detection limits, while Zn, Hg, As, and Pb levels were 0.01–0.22 mg kg−1, 0.12 × 10⁻³–28.39 × 10⁻³ mg kg−1, 0.01–0.10 mg kg−1, and 0.001–0.01 mg kg−1, respectively. Among all heavy metals detected, the levels of Zn, Hg, and Pb were below the Class III limit of China’s Environmental Quality Standards for Surface Water (GB 3838–2002), while As content slightly exceeded the limit. This was mainly due to high As content in water from the Longgu development zone wastewater treatment plant that was collected in the western water inlet A4 of the Anguo wetland and exceeded the limit by a factor of 9.8.
In vegetation from all sample plots, Cr and Cd from some sample plots were below the detection limits, while Cu, Zn, Hg, As, and Pb levels were 4.01–14.00 mg kg−1, 40.29–127.95 mg kg−1, 1.18 × 10⁻³–3.51 × 10⁻³ mg kg−1, 0.43–0.61 mg kg−1, and 0.30–1.92 mg kg−1, respectively. From the National Food Safety Standard Contaminant Limits in Food (GB2762-2017), it can be seen the vegetation Hg level was within the clean range. Pb content, however, severely exceeded standard limits, particularly in the control region and the Anguo wetland water inlet, where it exceeded the limit by factors of 19.21 and 17.00, respectively. This is mainly because Pb is easily transported into plants, and high levels of Pb are absorbed by the root system into vegetation. In addition, studies have revealed that root absorption is not the only pathway by which heavy metals are enriched in vegetation, with migration and transformation of heavy metals at the air–plant interface also playing important roles in heavy metal enrichment [27]. Sediment, overlying water, and vegetation were considered as a whole, with Csum representing the sum of different heavy metals in sediment, overlying water, and vegetation. The Csum ranges of Cu, Zn, Cr, Cd, Hg, As, and Pb were 17.66–55.21 mg kg−1, 115.80–224.29 mg kg−1, 39.44–84.34 mg kg−1, 0.12–1.17 mg kg−1, 9.37 × 10⁻³–81.24 × 10⁻³ mg kg−1, 6.51–15.16 mg kg−1, and 15.00–34.11 mg kg−1, respectively.
4.2. Heavy Metal Spatial Distribution
We used the Anguo wetland outlet A9 to represent wetlands for comparison with the aquaculture pond B, fishery–solar hybrid project region C, and control region D. There are two main reasons for using A9 to represent wetland. The first reason is that A9 represents the enrichment level of heavy metals in sediment after constructed wetlands have received wastewater. The second reason is to maintain consistency with the analysis of heavy metals in water. The following text will compare the heavy metal pollution levels in water at the A9 sampling point after wetland treatment. As shown in Figure 2b–c, the Cu and Zn content in sediment from different sample plots exhibited identical relative relationships: B > D > C > A9. This indicates that Cu and Zn may have identical pollution sources, and Cu and Zn levels are higher in the aquaculture pond. These findings are consistent with the results of [28]. Studies have determined that long-term usage of bait in aquaculture will increase Cu and Zn content in sediment, causing these heavy metals to exceed limits.
From Figure 2e–h, it can be seen that Cr, Hg, As, and Pb displayed identical patterns, indicating that the pollution sources of these heavy metals may be identical. These distribution patterns are insufficient to demonstrate that the pollution sources are indeed the same, and further study is required to determine whether these heavy metals are associated in order to confirm that they share the same pollution sources. Cr, Hg, As, and Pb levels in the Anguo wetland A, aquaculture pond B, and fishery–solar hybrid project region C were all lower than those of control region D, demonstrating the advantages of these three coal mining subsidence pond reutilization methods. The sources of heavy metals in coal mining subsidence regions may be due to coal mining, pesticide application, domestic sewage, and industrial wastewater discharge [18,29]. First, although the Anguo wetland A receives water from the Longgu development zone and the Pei County development zone wastewater treatment plant, the heavy metal content in the water from these zones was not high, and its effects on sediment heavy metal accumulation are minimal. Second, a large number of reeds were planted in the Anguo wetland, which exerts significant absorption effects on Cd and other heavy metals [30]. This type of environmental intervention also decreases heavy metal content in wetland sediment. Some heavy metals in aquaculture pond B will enter aquatic animals via food chains [31,32]. Therefore, sediment heavy metal content in the aquaculture pond is lower than the control region. In the fishery–solar hybrid project region B, solar power is considered a clean energy source. Under normal circumstances, solar-powered batteries do not pollute the environment and will not increase heavy metal accumulation in sediment [33,34]. Since control region D is low-lying, heavy metals produced from coal mining and tailing accumulation will enter into water bodies through surface runoff [35]. In addition, the application of large amounts of pesticides in farmlands surrounding subsidence ponds is also an important source of heavy metals that cannot be ignored. Given that heavy metals are highly stable and difficult to degrade, heavy metals in water bodies will be enriched in sediment. Therefore, the Cr, Hg, As, and Pb levels in control region D were higher than in other regions.
With the exception of sample plots that were lower than the detection limits, the heavy metal content in the corresponding plants of various sample plots exhibited patterns identical to those of sediment. This is mainly because heavy metals in vegetation originate in sediment, from which they are absorbed and enriched by root systems into vegetation [36,37]. To some extent, the higher the heavy metal content in sediment, the higher the heavy metal content in vegetation [38]. During application, some heavy metals will enter the soil. In overlying water, heavy metal content was significantly lower than heavy metal content in sediment and vegetation, which is consistent with the results of many related studies. For example, [39] studied heavy metals in the sediment, water bodies, and water grasses of Pulicat Lake, India, finding that the Cd and Cr levels in sediment are far higher than the heavy metal content in water bodies. [40] studied the distribution characteristics of heavy metals in Uluabat Lake, Turkey, discovering that the heavy metal content in the overlying water was significantly lower than the heavy metal content in the sediment. The main reason for this phenomenon is that heavy metals in overlying water will be adsorbed to suspended matter through complexation. In addition, the results also revealed that heavy metals in overlying water did not exhibit patterns identical to those of sediment and vegetation. Studies found that as flow occurs in a water body, heavy metals in overlying water will be adsorbed within a distance of 10 km under normal circumstances [41]. In contrast to heavy metals in sediment and vegetation that are the result of long-term accumulation, heavy metal content in overlying water tends to undergo real-time changes. Therefore, it is not difficult to describe the differences between heavy metal content in overlying water versus that in sediment and vegetation.
When Csum was used as a study subject, the variation trends of Cu, Zn, and Cd in the system consisting of sediment, overlying water, and vegetation were identical, and the variation trends of As, Cr, Hg, and Pb were identical. This proves that the two types of heavy metals may have different pollution sources.
In the two independent wetland systems of the Anguo wetland, the heavy metal content of sediment, overlying water, and vegetation displayed identical trends, while Cu, Zn, and Cd levels manifested the following relative pattern: secondary surface flow region > sediment > primary surface flow region. Meanwhile, As and Pb levels exhibited the following pattern: sediment > secondary surface flow region > primary surface flow region. In addition, the heavy metal content in the overlying water of the Anguo wetland outlet was lower than that of the water inlet, indicating that the joint effects of wetland surface flow and aquatic plants can effectively purify the 50,000 tons of tailings that enter the Anguo wetland daily from the Pei County and Longgu development zones.
4.3. Assessment of Nemerow’s Synthetic Pollution Index
Table 1 shows the calculation results for Nemerow’s synthetic pollution index, in which bold fonts indicate index values >1. It is evident that, with the exception of control region D, Nemerow’s indices of sediment at all sampling points were <1, indicating that the sediment was relatively clean. In contrast, the water quality Nemerow’s synthetic pollution index analysis results revealed that the water quality of the Anguo wetland water inlet was poor and is severely polluted. This is mainly due to As content in the Longkou River exceeding limits, which consists of recycled water obtained following treatment of wastewater from the Longgu development zone and sewage from surrounding residential areas. After purification in the primary and secondary surface flow regions of the Anguo wetland, water from the Anguo wetland outlet was significantly improved and reached a clean level. This also shows that the purification effects of the Anguo wetland are relatively good. In addition, the fishery–solar hybrid project region and the control region were mildly polluted. It is worth noting that the Pplant values of all sampling points were >3, showing that there is severe heavy metal contamination in vegetation. Our analysis indicates that this is because the Pb content in vegetation severely exceeded limits. Heavy metals are absorbed by the root system, from which they flow up and accumulate in the vegetation. Additionally, Pb that enters vegetation from the atmosphere cannot be overlooked. Coal mining, vehicle exhaust, and industrial production [42] may increase atmospheric Pb content in the sampling plot, and atmospheric Pb is enriched in particulate matter, which enters vegetation via stomata in the plants’ epidermis [43]. Since Pplant exceeded the pollution limits, this caused Nemerow’s synthetic pollution index of the aquatic system to exceed limits, indicating that the system is in a polluted state.
4.4. Geostatistical Analyses of Sediment Heavy Metals
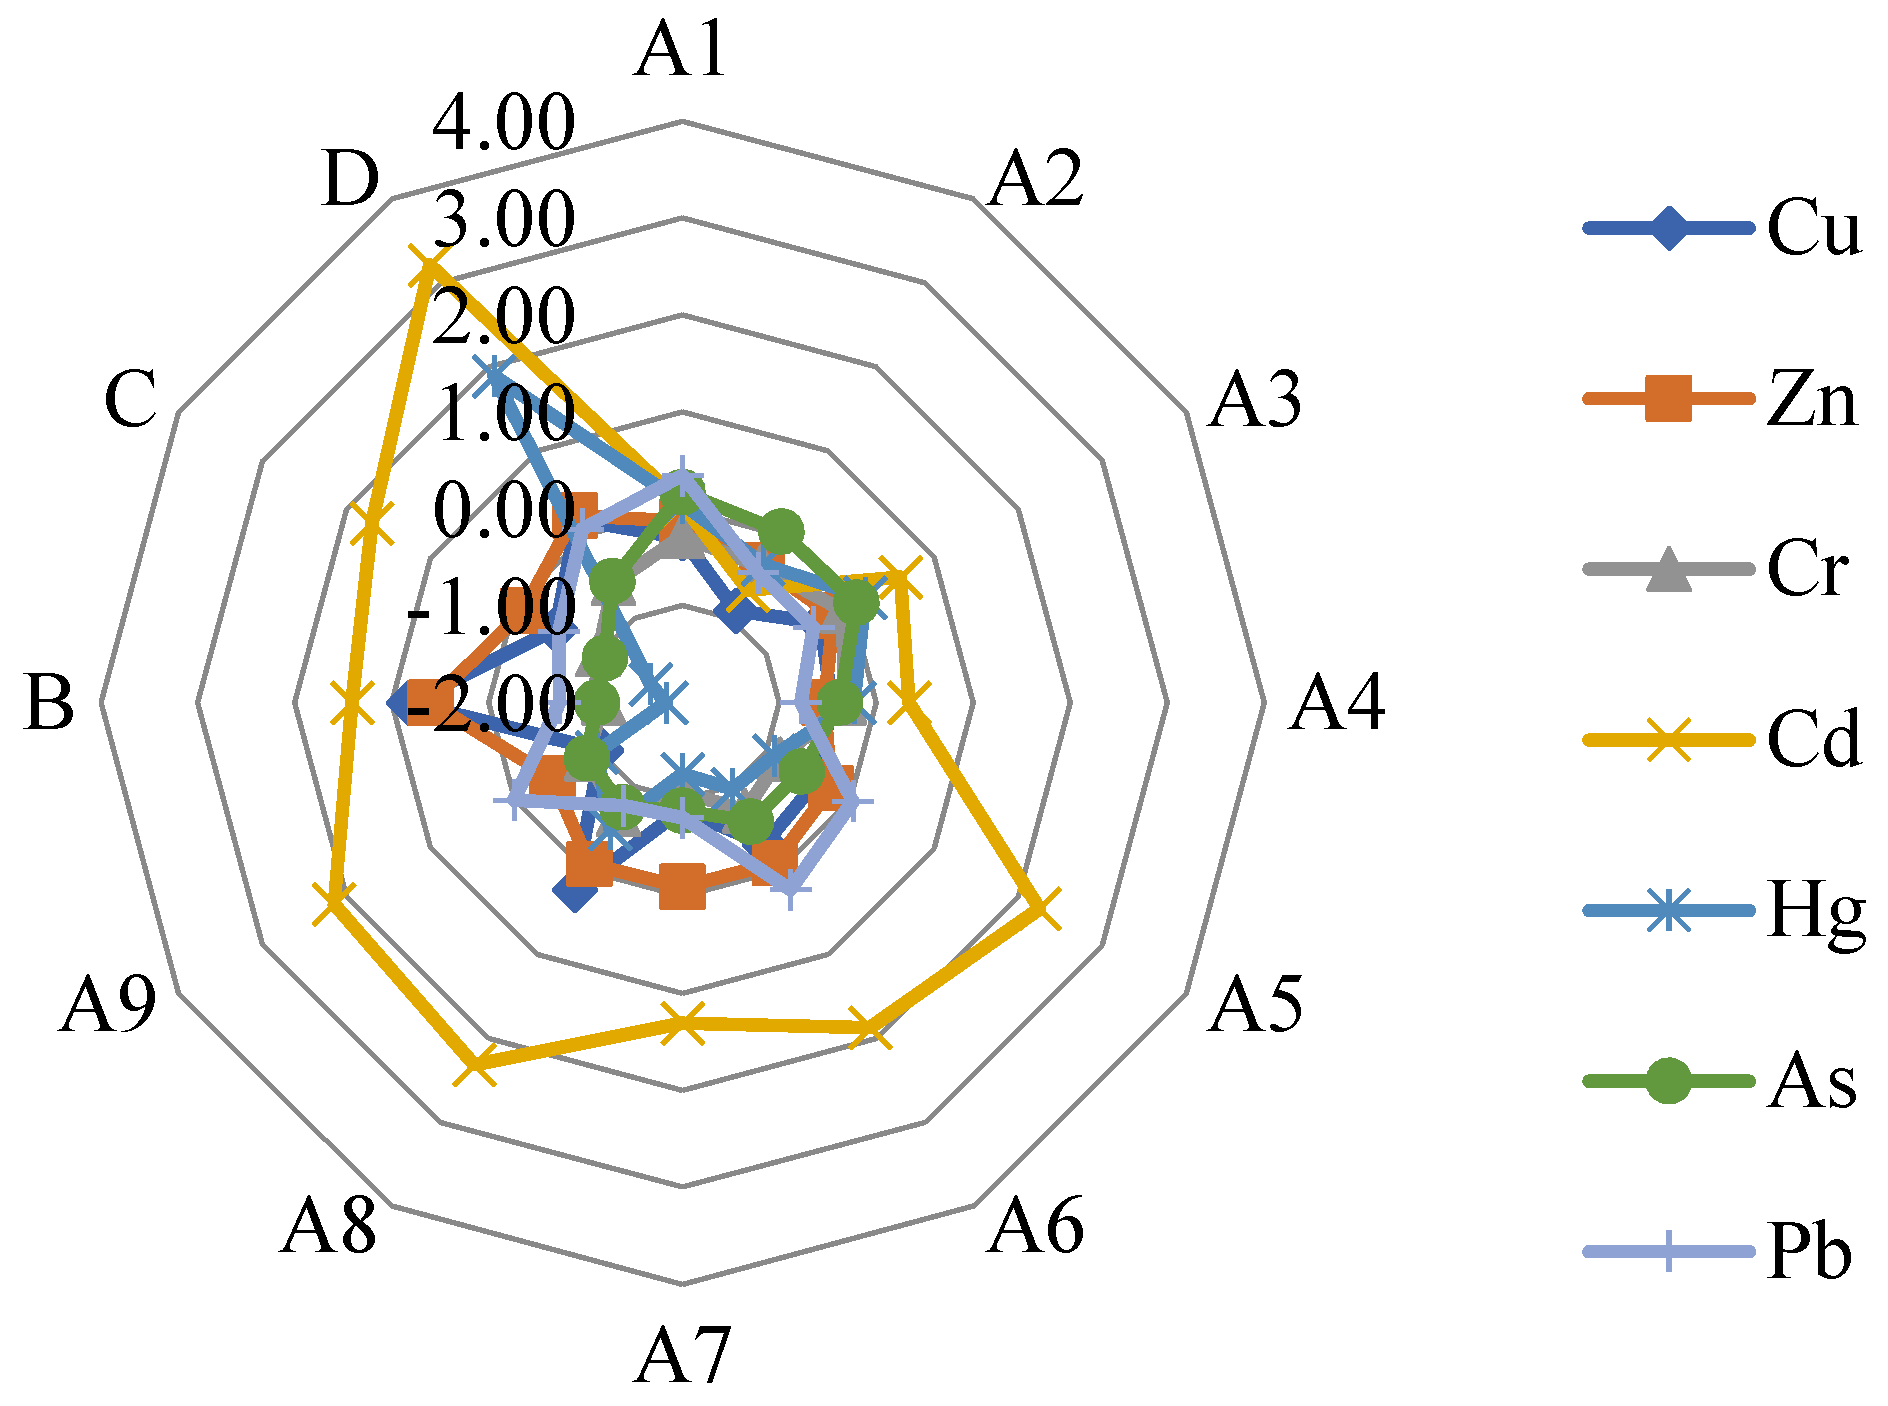
Figure 3 presents the Igeo of various heavy metals. From this figure, it can be seen that the Cr values at all sampling points were within clean levels; Cu, Zn, Hg, As, and Pb at most sampling points were at clean levels, while other sampling points were at mild-moderate pollution levels. Among all heavy metals, the Cd contamination levels were more severe, with 33%, 25%, and 8.3% of sampling points at moderate pollution, moderate–high pollution, and high pollution levels, respectively. Sediment Cd mainly originates from coal mining, traffic, atmospheric deposition, fertilizer application, and the use of Cd-containing pesticides [44]. Cd is an accompanying element in coal mining that tends to undergo migration and was found to be enriched in sediment compared with other heavy metals, resulting in Cd content exceeding limits.
4.5. Pearson’s Correlation, PCA, and HCA
Table 2 lists the Pearson’s correlation coefficient of heavy metals and other physicochemical properties. Since soil pH is one of the important physical characteristics of soil and strongly affects heavy metal adsorption sites and adsorption stability, many studies have reported the impact of pH on heavy metals [45,46]. Imoto et al. [47] employed multivariate regression to study the effects of pH on Cd and Pb adsorption and derived an adsorption formula. Their results revealed that soil pH greatly affects heavy metal adsorption. Bang et al. [48] demonstrated that soil pH changes the surface charge of heavy metal adsorbents, which alters the adsorption of heavy metals by soil organic matter. In this study, the pH of the aquatic ecosystem was found to be negatively correlated with most heavy metals. These results are consistent with previous studies [49,50]. The specific reason may have to do with the basic pH of the study site. In a basic soil solution, heavy metals in the soil will form insoluble hydroxides through complexation, and the metallic ion concentration in the soil solution will decrease. Within a certain pH range, the higher the soil pH, the greater the solubility of soil organic matter and the stronger the metal complexation ability. This causes a large number of heavy metal ions to be in a more stable bound state in the form of hydroxides [51]. Due to the electron structure of heavy metal ions, however, heavy metal ions and hydroxide ions exist in the form of water and ions. The higher the soil pH, the more favorable the hydrolysis reaction, which decreases heavy metal concentration in soil solution [52].
There is a strong interaction among sediments elements in the natural environment. The results showed that AN, AP and AK have strong influences on the concentrations of As and Cr via physical sorption and precipitation. SOC was positively correlated with Cu and Zn, which is similar to the studies reported by Liao J [53] and Katalin Juhos [54].
In the aquatic ecosystem, the correlation coefficients of Cu-Zn, Cu-Cd, Cu-Hg, Zn-Cd, Zn-Hg and Cd-Hg were 0.90, 0.53, 0.17, 0.55, 0.19, and 0.64, respectively, while the correlation coefficients of As-Cr, As-Pb, and Cr-Pb were 0.91, 0.18, and 0.33, respectively. These results show that Cu, Zn, Cd and Hg may have identical pollution sources, and As, Cr, and Pb may have identical pollution sources, which is consistent with the analysis results of the preceding section.
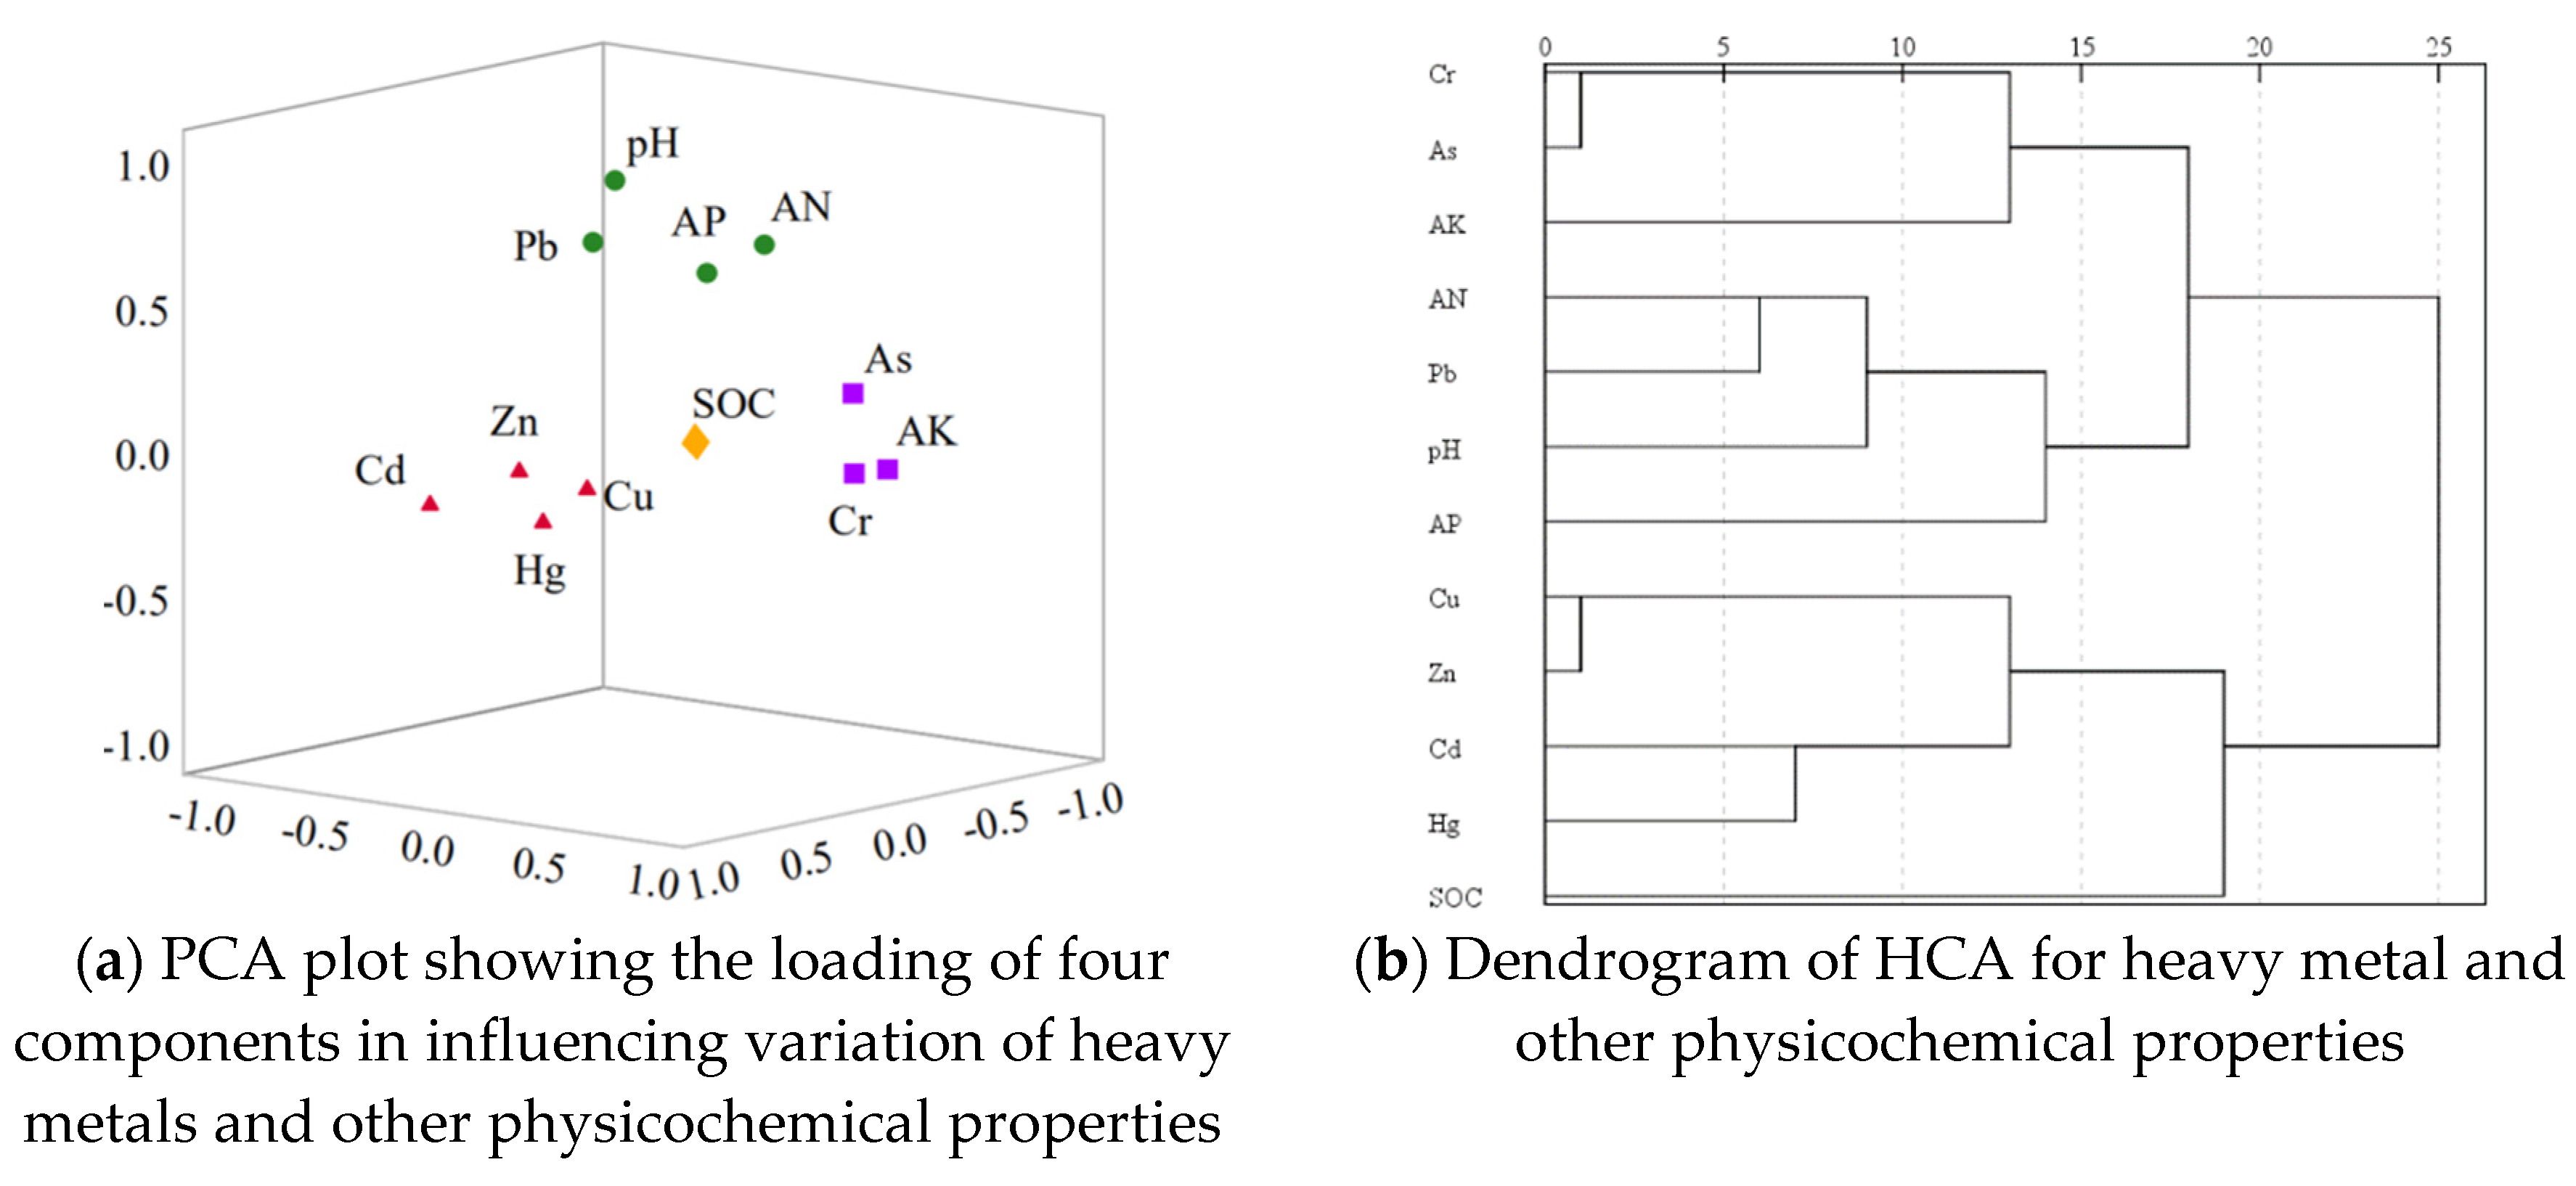
The Kaiser-Meyer-Olkin (KMO) value (0.517) of the PCA and Bartlett test results indicate that principal component analysis can be carried out on the data. Four principal components were extracted based on eigenvalues (eigenvalues >1), which explained 80.89% of the total variance. PC1 accounted for 33.70% of the total variance and displayed strong positive correlations with As, Cr, AK, as seen in Figure 4a. PC2 explained 19.81% of the total variance and exhibited strong positive correlations with Pb, AN, AP and pH. PC3 explained 14.61% of the total variance and showed a strong positive correlation with Cu, Zn, Cd, and Hg. PC4 explained 12.76% of the total variance and exhibited strong positive correlations with SOC. Based on the above results, we can deduce that Cu and Zn have a common source and As and Cr have a common source. Figure 4b presents the HCA results. Evidently, all indicators clustered into four categories: Category 1, consisting of As, Cr, AK; Category 2, consisting of Pb, AN, AP and pH; Category 3, consisting of Cu, Zn, Cd, and Hg; and Category 4, consisting of SOC. This result is identical to the Pearson’s correlation and PCA results.
In combination with the distribution patterns of heavy metals, it can be seen that Cu and Zn, was the most prevalent in aquaculture pond B, while As and Cr predominated in control region D. It is well known that heavy metal sources are both natural and anthropogenic. Natural sources include rock weathering and soil erosion, while anthropogenic sources include coal mining, agriculture, and industrial production. For example, waste heaps are eroded by wind to form dust, which is suspended in the air and deposits on the land surrounding the waste heap. Coal gangue undergoes erosion and leaching, causing heavy metals to enter the soil via surface runoff caused by precipitation. In addition, domestic sewage, the application of pesticides and chemical fertilizers, aquaculture, and tourism will also result in heavy metal accumulation [55]. Thus, aquaculture can be interpreted as the main source of Cu and Zn, including long-term bait usage. Meanwhile, As and Cr mainly originate from atmospheric deposition, coal mining, and leaching.
5. Conclusions
The present study analyzed the heavy metal distributions in water bodies, sediment, and vegetation in subsidence ponds with different resource reutilization methods in China. Multivariate statistical analysis, including Pearson’s correlation analysis, principal component analysis and hierarchical cluster analysis, were conducted to identify the pattern of heavy metal concentrations and the potential sources. The results showed that levels of heavy metals were below the soil contamination risk management thresholds, except Cd in the control region by referencing the GB15618 2018. The assessment results of heavy metals exceeded limits by varying degrees when the soil background values of Jiangsu Province were used as the basis for assessment, however. This indicates that the soil heavy metal content in Pei County is relatively low, and heavy metal content exceeding limits is the outcome of long-term exogenous input. In water bodies, the levels of Zn, Hg, and Pb were below Class III of China’s Environmental Quality Standards for Surface Water (GB 3838–2002), while As content slightly exceeded the limit. In vegetation, Pb content severely exceeded limits, particularly in the control region and the Anguo wetland inlet.
Pearson’s correlation, PCA, and HCA analysis results revealed that Cu and Zn are the most prevalent in aquaculture pond B and mainly originate from aquaculture, and As and Cr predominate in control region D and mainly originate from atmospheric deposition, coal mining, and leaching.
In addition, the heavy metal distribution patterns indicated that the joint effects of wetland surface flow and aquatic plants could effectively purify the 50,000 tons of tailings that enter the Anguo wetland daily from the Pei County and Longgu development zones. Some degree of heavy metal enrichment in the sediment and vegetation of the Anguo wetland is unavoidable, however, although the degree of enrichment was still found to be lower than that of the control region. In the aquaculture pond B, Cu and Zn levels exceeded limits, and they should thus be considered when selecting bait in the future. Solar-powered batteries do not cause environmental pollution under normal circumstances. Therefore, these models should be considered during resource reutilization of subsidence ponds based on the actual conditions.
Author Contributions
Methodology, M.T.; software, K.W.; investigation, Z.X. and H.L.; writing—original draft preparation, M.T.; Methodology, funding acquisition, J.Q. All authors have read and agreed to the published version of the manuscript.
Funding
This study was funded by the Open Research Fund of Jiangsu Key Laboratory of Resources and Environmental Information Engineering, China University of Mining and Technology (grant number JS201801), Research on the technologies for controlling land and water resources in the Huang-Huai-Hai coal mining subsidence area under the Ministry of Natural Resources of the People’s Republic of China (grant number 2018-01-34), and the Fundamental Research Funds for the Central Universities (grant number 2017XKZD14).
Conflicts of Interest
The authors declare no conflict of interest.
References
- Xiao, W.; Hu, Z.; Chugh, Y.P.; Zhao, Y. Dynamic subsidence simulation and topsoil removal strategy in high groundwater table and underground coal mining area: A case study in Shandong Province. Int. J. Min. Reclam. Environ. 2013, 28, 250–263. [Google Scholar] [CrossRef]
- Hou, Q.; Yang, Z.; Ji, J.; Yu, T.; Chen, G.; Li, J.; Xia, X.; Zhang, M.; Yuan, X. Annual net input fluxes of heavy metals of the agro-ecosystem in the Yangtze River delta, China. J. Geochem. Explor. 2014, 139, 68–84. [Google Scholar] [CrossRef]
- Zhong, S.; Wei, C.; Liu, B.; Zhang, W.; Du, J.; Zhang, S. Restoration technologies of damaged paddy in hilly post-mining and subsidence-stable area of Southwest China. Int. J. Agric. Biol. Eng. 2015, 8, 46–57. [Google Scholar]
- Zhang, Q.; Wang, F.; Wang, R. Research Progress of Ecological Restoration for Wetlands in Coal Mine Areas. Procedia Environ. Sci. 2011, 10, 1933–1938. [Google Scholar] [CrossRef] [Green Version]
- Xie, K.; Zhang, Y.; Yi, Q.; Yan, J. Optimal resource utilization and ecological restoration of aquatic zones in the coal mining subsidence areas of the Huaibei Plain in Anhui Province, China. Desalin. Water Treat. 2013, 51, 4019–4027. [Google Scholar] [CrossRef]
- Vymazal, J.; Švehla, J. Iron and manganese in sediments of constructed wetlands with horizontal subsurface flow treating municipal sewage. Ecol. Eng. 2013, 50, 69–75. [Google Scholar] [CrossRef]
- Yang, J.; Yu, Z.; Yi, P.; Aldahan, A. Assessment of groundwater quality and 222Rn distribution in the Xuzhou region, China. Environ. Monit. Assess. 2018, 190, 549. [Google Scholar] [CrossRef]
- Wang, Z.; Hong, C.; Xing, Y.; Wang, K.; Li, Y.; Feng, L.; Ma, S. Spatial distribution and sources of heavy metals in natural pasture soil around copper-molybdenum mine in Northeast China. Ecotoxicol. Environ. Saf. 2018, 154, 329–336. [Google Scholar] [CrossRef]
- Ministry of Ecology and Environment of the People’s Republic of China (MEE). Soil Environmental Quality Risk Control Standard for Soil Contamination of Agricultural Land; GB15618-2018; Ministry of Ecology and Environment of the People’s Republic of China: Beijing, China, 2018.
- Zhen, H.; Jia, L.; Huang, C.; Qiao, Y.; Li, J.; Li, H.-F.; Chen, Q.; Wan, Y. Long-term effects of intensive application of manure on heavy metal pollution risk in protected-field vegetable production. Environ. Pollut. 2020, 263, 114552. [Google Scholar] [CrossRef]
- Huang, Y.; Chen, Q.; Deng, M.; Japenga, J.; Li, T.; Yang, X.; He, Z. Heavy metal pollution and health risk assessment of agricultural soils in a typical peri-urban area in southeast China. J. Environ. Manag. 2018, 207, 159–168. [Google Scholar] [CrossRef]
- Muller, G. Index of Geoaccumulation in sediments of the Rhine River. Geo. J. 1969, 2, 108–118. [Google Scholar]
- Loska, K.; Wiechuła, D.; Korus, I. Metal contamination of farming soils affected by industry. Environ. Int. 2004, 30, 159–165. [Google Scholar] [CrossRef]
- Zhang, X.; Wei, S.; Sun, Q.; Wadood, S.A.; Guo, B. Source identification and spatial distribution of arsenic and heavy metals in agricultural soil around Hunan industrial estate by positive matrix factorization model, principle components analysis and geo statistical analysis. Ecotoxicol. Environ. Saf. 2018, 159, 354–362. [Google Scholar] [CrossRef] [PubMed]
- Young, F.J.; Hammer, R. Defining Geographic Soil Bodies by Landscape Position, Soil Taxonomy, and Cluster Analysis. Soil Sci. Soc. Am. J. 2000, 64, 989–998. [Google Scholar] [CrossRef] [Green Version]
- Steinhorst, R.K.; Williams, R.E. Discrimination of Groundwater Sources Using Cluster Analysis, MANOVA, Canonical Analysis and Discriminant Analysis. Water Resour. Res. 1985, 21, 1149–1156. [Google Scholar] [CrossRef]
- Ortega-Guerrero, A. Origin and geochemical evolution of groundwater in a closed-basin clayey aquitard, Northern Mexico. J. Hydrol. 2003, 284, 26–44. [Google Scholar] [CrossRef]
- Tan, M.; Zhao, H.; Li, G.; Qu, J.-F. Assessment of potentially toxic pollutants and urban livability in a typical resource-based city, China. Environ. Sci. Pollut. Res. 2020, 27, 18640–18649. [Google Scholar] [CrossRef]
- Cheng, W.; Bian, Z.; Dong, J.-H.; Lei, S.-G. Soil properties in reclaimed farmland by filling subsidence basin due to underground coal mining with mineral wastes in China. Trans. Nonferr. Met. Soc. China 2014, 24, 2627–2635. [Google Scholar] [CrossRef]
- Li, Y.; Chen, L.; Wen, H. Changes in the composition and diversity of bacterial communities 13 years after soil reclamation of abandoned mine land in eastern China. Ecol. Res. 2014, 30, 357–366. [Google Scholar] [CrossRef]
- Abakumov, E.V.; Cajthaml, T.; Brus, J.; Frouz, J. Humus accumulation, humification, and humic acid composition in soils of two post-mining chronosequences after coal mining. J. Soils Sediments 2012, 13, 491–500. [Google Scholar] [CrossRef]
- Slessarev, E.W.; Lin, Y.; Bingham, N.L.; Johnson, J.E.; Dai, Y.; Schimel, J.P.; Chadwick, O.A. Water balance creates a threshold in soil pH at the global scale. Nat. Cell Biol. 2016, 540, 567–569. [Google Scholar] [CrossRef] [PubMed]
- Sun, R.; Yang, J.; Xia, P.; Wu, S.; Lin, T.; Yi, Y. Contamination features and ecological risks of heavy metals in the farmland along shoreline of Caohai plateau wetland, China. Chemosphere 2020, 254, 126828. [Google Scholar] [CrossRef] [PubMed]
- Cruz, A.C.F.; Gusso-Choueri, P.; De Araujo, G.S.; Campos, B.G.; Abessa, D.M.D.S. Levels of metals and toxicity in sediments from a Ramsar site influenced by former mining activities. Ecotoxicol. Environ. Saf. 2019, 171, 162–172. [Google Scholar] [CrossRef] [PubMed]
- Zhou, Z.; Wang, Y.; Liu, A.; Yang, H.; Liu, A.; Li, M.; Niu, X. Historical Evolution of Sources and Pollution Levels of Heavy Metals in the Sediment of the Shuanglong Reservoir, China. Water 2020, 12, 1855. [Google Scholar] [CrossRef]
- Williams, C.; David, D. The effect of superphosphate on the cadmium content of soils and plants. Soil Res. 1973, 11, 43–56. [Google Scholar] [CrossRef]
- Bi, X.; Feng, X.; Yang, Y.; Li, X.; Shin, G.P.; Li, F.; Qiu, G.; Li, G.; Liu, T.; Fu, Z. Allocation and source attribution of lead and cadmium in maize (Zea mays L.) impacted by smelting emissions. Environ. Pollut. 2009, 157, 834–839. [Google Scholar] [CrossRef] [Green Version]
- Krčmar, D.; Grba, N.; Isakovski, M.K.; Varga, N.; Spasojević, J.; Agbaba, J.; Dalmacija, B.D. Multicriteria to estimate the environmental risk of sediment from the Obedska Bog (Northern Serbia), a reservation area on UNESCO’s list. Int. J. Sediment Res. 2020, 35, 527–539. [Google Scholar] [CrossRef]
- Gao, Z. Evaluation of heavy metal pollution and its ecological risk in one river reach of a gold mine in Inner Mongolia, Northern China. Int. Biodeterior. Biodegrad. 2018, 128, 94–99. [Google Scholar] [CrossRef]
- Eid, E.M.; Shaltout, K.H.; Al-Sodany, Y.M.; Haroun, S.A.; Galal, T.M.; Ayed, H.; Khedher, K.M.; Jensen, K. Common reed (Phragmites australis (Cav.) Trin. ex Steudel) as a candidate for predicting heavy metal contamination in Lake Burullus, Egypt: A biomonitoring approach. Ecol. Eng. 2020, 148, 148. [Google Scholar] [CrossRef]
- Ju, Y.-R.; Chen, C.-F.; Chuang, X.-Y.; Lim, Y.C.; Chen, C.-W.; Dong, C.-D. Biometry-dependent metal bioaccumulation in aquaculture shellfishes in southwest Taiwan and consumption risk. Chemosphere 2020, 253, 126685. [Google Scholar] [CrossRef]
- Thangaraj, S.; Yuvaraj, P.; Damotharan, P.; Karthikeyan, V.; Jha, D.K.; Dharani, G.; Balasubramanian, T.; Kirubagaran, R. Assessment of trace metal contamination in the marine sediment, seawater, and bivalves of Parangipettai, southeast coast of India. Mar. Pollut. Bull. 2019, 149, 149. [Google Scholar] [CrossRef]
- Rahim, M.; Yoshino, J.; Yasuda, T. Evaluation of solar radiation abundance and electricity production capacity for application and development of solar energy. Int. J. Energy Environ. 2012, 3, 687–700. [Google Scholar]
- Şener, Ş.E.C.; Sharp, J.L.; Anctil, A. Factors impacting diverging paths of renewable energy: A review. Renew. Sustain. Energy Rev. 2018, 81, 2335–2342. [Google Scholar] [CrossRef]
- Chen, G.; Wang, X.; Wang, R.; Liu, G. Health risk assessment of potentially harmful elements in subsidence water bodies using a Monte Carlo approach: An example from the Huainan coal mining area, China. Ecotoxicol. Environ. Saf. 2019, 171, 737–745. [Google Scholar] [CrossRef] [PubMed]
- Tripathi, R.D.; Tripathi, P.; Dwivedi, S.; Kumar, A.; Mishra, A.; Chauhan, P.S.; Norton, G.J.; Nautiyal, C.S. Roles for root iron plaque in sequestration and uptake of heavy metals and metalloids in aquatic and wetland plants. Metallomics 2014, 6, 1789–1800. [Google Scholar] [CrossRef]
- Fawzy, M.; Badr, N.E.-S.; El-Khatib, A.; Abo-El-Kassem, A. Heavy metal biomonitoring and phytoremediation potentialities of aquatic macrophytes in River Nile. Environ. Monit. Assess. 2012, 184, 1753–1771. [Google Scholar] [CrossRef]
- Pramer, D. Soil Biology. Soil Sci. Soc. Am. J. 1968, 32, 345–368. [Google Scholar] [CrossRef]
- Kamala-Kannan, S.; Batvari, B.P.D.; Lee, K.J.; Kannan, N.; Krishnamoorthy, R.; Shanthi, K.; Jayaprakash, M. Assessment of heavy metals (Cd, Cr and Pb) in water, sediment and seaweed (Ulva lactuca) in the Pulicat Lake, South East India. Chemosphere 2008, 71, 1233–1240. [Google Scholar] [CrossRef]
- Barlas, N.; Akbulut, N.; Aydoğan, M. Assessment of Heavy Metal Residues in the Sediment and Water Samples of Uluabat Lake, Turkey. Bull. Environ. Contam. Toxicol. 2005, 74, 286–293. [Google Scholar] [CrossRef]
- MacKenzie, A.; Pulford, I. Investigation of contaminant metal dispersal from a disused mine site at Tyndrum, Scotland, using concentration gradients and stable Pb isotope ratios. Appl. Geochem. 2002, 17, 1093–1103. [Google Scholar] [CrossRef]
- Li, Q.; Cheng, H.; Zhou, T.; Lin, C.; Guo, S. The estimated atmospheric lead emissions in China, 1990–2009. Atmos. Environ. 2012, 60, 1–8. [Google Scholar] [CrossRef]
- Feng, J.; Wang, Y.; Zhao, J.; Zhu, L.; Bian, X.; Zhang, W. Source attributions of heavy metals in rice plant along highway in Eastern China. J. Environ. Sci. 2011, 23, 1158–1164. [Google Scholar] [CrossRef]
- Li, B.; Xiao, R.; Wang, C.-Q.; Cao, L.; Zhang, Y.; Zheng, S.; Yang, L.; Guo, Y. Spatial distribution of soil cadmium and its influencing factors in peri-urban farmland: A case study in the Jingyang District, Sichuan, China. Environ. Monit. Assess. 2016, 189. [Google Scholar] [CrossRef] [PubMed]
- Equeenuddin, S.M.; Tripathy, S.; Sahoo, P.K.; Panigrahi, M. Metal behavior in sediment associated with acid mine drainage stream: Role of pH. J. Geochem. Explor. 2013, 124, 230–237. [Google Scholar] [CrossRef]
- Ma, Y.; Wang, Y.; Chen, Q.; Li, Y.; Guo, D.; Nie, X.; Peng, X. Assessment of heavy metal pollution and the effect on bacterial community in acidic and neutral soils. Ecol. Indic. 2020, 117, 106626. [Google Scholar] [CrossRef]
- Imoto, Y.; Yasutaka, T. Comparison of the impacts of the experimental parameters and soil properties on the prediction of the soil sorption of Cd and Pb. Geoderma 2020, 376, 114538. [Google Scholar] [CrossRef]
- Bang, J.; Hesterberg, D. Dissolution of Trace Element Contaminants from Two Coastal Plain Soils as Affected by pH. J. Environ. Qual. 2004, 33, 891–901. [Google Scholar] [CrossRef]
- Buchter, B.; Davidoff, B.; Amacher, M.C.; Hinz, C.; Iskandar, I.K.; Selim, H.M. Correlation of freundlich Kd and n retention parameters with soils and elements. Soil Sci. 1989, 148, 370–379. [Google Scholar] [CrossRef]
- Elbana, T.A.; Selim, H.; Akrami, N.; Newman, A.; Shaheen, S.M.; Rinklebe, J. Freundlich sorption parameters for cadmium, copper, nickel, lead, and zinc for different soils: Influence of kinetics. Geoderma 2018, 324, 80–88. [Google Scholar] [CrossRef]
- Yu, H.-Y.; Liu, C.; Zhu, J.; Li, F.; Deng, D.-M.; Wang, Q.; Liu, C. Cadmium availability in rice paddy fields from a mining area: The effects of soil properties highlighting iron fractions and pH value. Environ. Pollut. 2016, 209, 38–45. [Google Scholar] [CrossRef]
- Caporale, A.G.; Violante, A. Chemical Processes Affecting the Mobility of Heavy Metals and Metalloids in Soil Environments. Curr. Pollut. Rep. 2016, 2, 15–27. [Google Scholar] [CrossRef] [Green Version]
- Liao, J.; Deng, S.; Liu, X.; Lin, H.; Yu, C.; Wei, C. Influence of soil evolution on the heavy metal risk in three kinds of intertidal zone of the Pearl River Estuary. Land Degrad. Dev. 2020. [Google Scholar] [CrossRef]
- Juhos, K.; Czigány, S.; Madarász, B.; Ladányi, M. Interpretation of soil quality indicators for land suitability assessment—A multivariate approach for Central European arable soils. Ecol. Indic. 2019, 99, 261–272. [Google Scholar] [CrossRef]
- Mestrinho, S.S.P.; Reitemajer, D.; Porciúncula, D.C.; Lyrio, R. Evaluation of the surface water quality in the Itapicuru river basin—State of Bahia, Brazil. Water Pollut. VIII Model. Monit. Manag. 2007, 103, 133–141. [Google Scholar] [CrossRef] [Green Version]
Figure 1.
Sampling sites in Pei County, China.

Figure 2.
Changes in heavy metal content and pH in sediment, overlying water, and vegetation of various sample plots.
Figure 2.
Changes in heavy metal content and pH in sediment, overlying water, and vegetation of various sample plots.


Figure 3.
Igeo values in various sample plots.

Figure 4.
PCA and HCA results for heavy metals and other physicochemical properties in sediments.


Table 1.
Nemerow’s synthetic pollution index analysis results for various sampling points.
| Psediment | Pwater | Pplant | P | |
|---|---|---|---|---|
| A1 | 0.55 | 0.84 | 12.56 | 4.65 |
| A2 | 0.49 | 0.94 | 6.68 | 2.70 |
| A3 | 0.51 | 0.77 | 9.85 | 3.71 |
| A4 | 0.38 | 0.81 | 11.07 | 4.09 |
| A5 | 0.56 | 0.48 | 3.81 | 1.62 |
| A6 | 0.44 | 7.19 | 5.22 | 4.28 |
| A7 | 0.30 | 1.03 | 3.75 | 1.69 |
| A8 | 0.58 | 1.92 | 13.51 | 5.33 |
| A9 | 0.52 | 0.96 | 10.54 | 4.01 |
| B | 0.33 | 0.56 | 2.34 | 1.08 |
| C | 0.39 | 1.11 | 4.57 | 2.02 |
| D | 1.06 | 1.03 | 14.43 | 5.51 |
The bold fonts indicate index values > 1.
Table 2.
Pearson’s correlation matrix for heavy metals and other physicochemical properties.
| pH | AN | AP | AK | SOC | Cu | Zn | Cr | Cd | Hg | As | Pb | |
|---|---|---|---|---|---|---|---|---|---|---|---|---|
| pH | 1.00 | |||||||||||
| AN | 0.51 | 1.00 | ||||||||||
| AP | 0.28 | 0.34 | 1.00 | |||||||||
| AK | −0.09 | 0.15 | −0.01 | 1.00 | ||||||||
| SOC | 0.08 | −0.12 | −0.03 | 0.20 | 1.00 | |||||||
| Cu | −0.02 | −0.35 | −0.26 | 0.08 | 0.36 | 1.00 | ||||||
| Zn | 0.01 | −0.35 | −0.28 | −0.15 | 0.10 | 0.90 ** | 1.00 | |||||
| Cr | −0.10 | 0.49 | 0.16 | 0.38 | −0.07 | −0.26 | −0.44 | 1.00 | ||||
| Cd | −0.11 | −0.40 | −0.28 | −0.48 | 0.21 | 0.53 | 0.55 | −0.39 | 1.00 | |||
| Hg | −0.07 | −0.03 | −0.20 | −0.42 | −0.10 | 0.17 | 0.19 | 0.33 | 0.64 * | 1.00 | ||
| As | 0.06 | 0.65 * | 0.43 | 0.36 | −0.21 | −0.30 | −0.38 | 0.91 ** | −0.50 | 0.22 | 1.00 | |
| Pb | 0.24 | 0.69 * | 0.41 | −0.30 | −0.33 | −0.17 | −0.10 | 0.18 | 0.16 | 0.31 | 0.33 | 1.00 |
* p < 0.05, ** p < 0.01 (two-tailed).
Publisher’s Note: MDPI stays neutral with regard to jurisdictional claims in published maps and institutional affiliations. |
© 2020 by the authors. Licensee MDPI, Basel, Switzerland. This article is an open access article distributed under the terms and conditions of the Creative Commons Attribution (CC BY) license (http://creativecommons.org/licenses/by/4.0/).
Share and Cite
MDPI and ACS Style
Tan, M.; Wang, K.; Xu, Z.; Li, H.; Qu, J. Study on Heavy Metal Contamination in High Water Table Coal Mining Subsidence Ponds That Use Different Resource Reutilization Methods. Water 2020, 12, 3348. https://doi.org/10.3390/w12123348
AMA Style
Tan M, Wang K, Xu Z, Li H, Qu J. Study on Heavy Metal Contamination in High Water Table Coal Mining Subsidence Ponds That Use Different Resource Reutilization Methods. Water. 2020; 12(12):3348. https://doi.org/10.3390/w12123348
Chicago/Turabian StyleTan, Min, Kun Wang, Zhou Xu, Hanghe Li, and Junfeng Qu. 2020. "Study on Heavy Metal Contamination in High Water Table Coal Mining Subsidence Ponds That Use Different Resource Reutilization Methods" Water 12, no. 12: 3348. https://doi.org/10.3390/w12123348
Note that from the first issue of 2016, this journal uses article numbers instead of page numbers. See further details here.