Application of the SCS–CN Method to the Hancheon Basin on the Volcanic Jeju Island, Korea


School of Civil, Environmental and Architectural Engineering, College of Engineering, Korea University, Seoul 02841, Korea
*
Author to whom correspondence should be addressed.
Water 2020, 12(12), 3350; https://doi.org/10.3390/w12123350
Submission received: 8 October 2020
/
Revised: 25 November 2020
/
Accepted: 25 November 2020
/
Published: 29 November 2020
(This article belongs to the Special Issue Soil Conservation Service Curve Number (SCS-CN) Method Current Applications, Remaining Challenges, and Future Perspectives)
Abstract
:This study investigates three issues regarding the application of the SCS–CN (Soil Conservation Service–Curve Number) method to a basin on the volcanic Jeju Island, Korea. The first issue is the possible relation between the initial abstraction and the maximum potential retention. The second is the determination of the maximum potential retention, which is also closely related to the estimation of CN. The third issue is the effect of the antecedent soil moisture condition (AMC) on the initial abstraction, maximum potential retention and CN. All of these issues are dealt with based on the analysis of several rainfall events observed in the Hancheon basin, a typical basin on Jeju Island. In summary, the results are that, firstly, estimates of initial abstraction, ratio , maximum potential retention, and CN were all found to be consistent with the SCS–CN model structure. That is, CN and the maximum potential retention showed a strong negative correlation, and the ratio and the maximum potential retention also showed a rather weak negative correlation. On the other hand, a significant positive correlation was found between CN and the ratio . Second, in the case where the accumulated number of days is four or five, the effect of antecedent precipitation amount is clear. The antecedent five-day rainfall amount for the AMC-III condition is higher than 400 mm, compared to the AMC-I condition of less than 100 mm. Third, an inverse proportional relationship is found between the AMC and the maximum potential retention. On the other hand, a clear linear proportional relation is found between the AMC and CN. Finally, the maximum potential retention for the Hancheon basin is around 200 mm, with the corresponding CN being around 65. The ratio between the initial abstraction and the maximum potential retention is around 0.3. Even though these results are derived by analyzing a limited number of rainfall events, they are believed to properly consider the soil characteristics of Jeju Island.
1. Introduction
Jeju Island, formed by volcanic activity, has totally different hydrological characteristics from those of the inland area of mainland Korea [1]. Basalt, a volcanic rock, shows high permeability, and thus low surface runoff [2]. This is the reason why most channels on Jeju Island are dry, and runoff occurs only when the rainfall intensity is high [3]. According to the Jeju Special Self-Governing Province [4], the mean runoff ratio is just 21%, which is far lower than that in the inland mainland area. Different from the slowly increasing runoff pattern in the inland mainland area, the runoff on Jeju Island shows an abruptly rising pattern after the soil layer is fully saturated [5].
Several problems are raised regarding the rainfall–runoff analysis of Jeju Island. In fact, these problems are mostly related to the rainfall loss by infiltration. The Soil Conservation Service–Curve Number (SCS–CN) method is a common method adopted by most rainfall–runoff analyses in Korea. However, application of the SCS–CN method to Jeju Island has always been problematic. First, it is not easy to determine the maximum potential retention. The problem is simply to determine the curve number (i.e., CN). Determination of CN is also closely related to the classification of the hydrological soil group for the given soil or soil series. There are five different classification rules in Korea, all of which derive different classification results, and thus different CNs. The second problem is related to the amount of initial abstraction. Generally, the amount of initial abstraction is assumed to be 20% of the maximum potential retention [6]. Although the Guideline for Design Flood Estimation in Korea [7] proposed the use of 40% for Jeju Island instead of 20%, this guideline is relied on only by a few case studies [8]. It is also important to consider that this ratio is dependent upon CN. Additionally, the impact of the antecedent moisture condition (AMC) is also ambiguous. High porous basalt soil infiltrates so fast that simply applying the AMC condition that is applied to the inland mainland area of Korea does not work for Jeju Island.
There have been many attempts to solve these issues. First, Ha et al. [9] showed the typical application procedure of the SCS–CN method. In the analysis of the variation of the effective rainfall due to the change of land use on Jeju Island, they estimated CN by applying the classification rule of hydrological soil group proposed by the Rural Development Administration (RDA) [10], the initial abstraction being 20% of the maximum potential retention. The AMC was determined by considering the antecedent five-day precipitation. However, in the study of Jung [11], even though the same classification rule of the RDA [10] was used, the estimated CN was additionally modified by considering the basin slope. The formula by Sharpley and Williams [12] was applied for this purpose, and, as a result, CN was increased by more than 10%. Also, they suggested that the initial abstraction should be 35–45% of the maximum potential retention depending on the basin. The application procedure of the SCS–CN method of Jung et al. [13] was similar to that of Jung [11]. However, to consider the porous volcanic soil of Jeju Island, they proposed the use of the intermediate value of CNs for AMC-II and AMC-III condition, even though the antecedent five-day precipitation was very high. Recently, however, Yang et al. [14] returned to using the typical procedure of the SCS–CN method. That is, the initial abstraction was assumed to be 20% of the maximum potential retention, and CN was determined by considering the AMC condition. CN was increased by considering the basin slope. As can be found in the above mentioned studies, the application of the SCS–CN method on Jeju Island so far has not been consistent.
Several cases can also be found of these issues in volcanic regions worldwide. Interestingly, their results are not consistent either. For example, Leta et al. [15] showed that 40% of the maximum potential retention was a good ratio for the initial abstraction in the Heeia basin, Hawaii. Most of the Heeia basin is covered by volcanic silty clay soils, and CN was also estimated to be very small at around 35–62 under normal condition (i.e., AMC-II condition). The Bathan basin in Saudi Arabia shows a different result [16]. Even though the Bathan basin lies in an arid volcanic region covered by basalt soil, the initial abstraction was estimated to be 20% of the maximum potential retention. CN was estimated very high at 78.5. In the application case of Kyushu Island in Japan, the initial abstraction was assumed to be 20% of the maximum potential retention, but CN was less than 70 [17]. In the application to the Naivasha basin in Kenya, the initial abstraction was assumed to be 20% of the maximum potential retention, but CN was very small at just 61 [18]. However, in the application to the La Lumbre and Montegrande basins in the Volcán de Colima, Mexico, the initial abstraction was assumed to be 20% of the maximum potential retention, but CN was very high at 75.5 [19].
The objective of this study is to investigate the above-mentioned issues of the SCS–CN method raised in application to the volcanic Jeju Island. First, this study investigates the possible relation between the initial abstraction and the maximum potential retention. Second, the proper value of the maximum potential retention of Jeju Island is estimated. As mentioned before, this issue is closely related to the estimation of CN, which is also dependent upon the classification rule of the hydrological soil group of soil or soil series. Finally, the effect of the AMC on CN is the third issue of interest. Because the soil on Jeju Island is porous and highly permeable, the typical AMC conditions used in the inland mainland area of Korea may not be applicable. In this study, these issues are dealt with based on the analysis of several rainfall events observed in the Hancheon basin. The Hancheon basin is a highly typical basin on Jeju Island, so the results derived in the analysis may be applicable to the other basins.
2. Theoretical Backgrounds
2.1. The SCS–CN Method
The SCS–CN method was developed by the U.S. Soil Conservation Service [6] and considers the soil, land use, vegetation, etc. to derive the curve number (CN) as a representative parameter for the hydrologic infiltration characteristics. CN ranges from 0 to 100.
The SCS–CN method assumes that the ratio between the actual retention () and the maximum potential retention () is the same as that between the direct runoff () and the total precipitation (). Here, the actual retention represents the precipitation portion that is not converted into the direct runoff, even after the runoff begins, i.e., :
However, in actual application, the above equations are modified somewhat by considering the initial abstraction (). Here, the initial abstraction is introduced to represent various losses, like interception and evaporation. As a result, the above equation becomes valid by replacing by :
Now the above Equation (2) can be arranged to represent the direct runoff:
The direct runoff, expressed as a function of and , is now simplified once more by introducing a linear relation [6]:
The ratio is generally assumed to be 0.2 [6].
With a given maximum potential retention, the direct runoff can be estimated from the total precipitation. The SCS also proposed using the CN to estimate the maximum potential retention. That is:
As can be expected, in the case that CN is zero, the maximum potential retention becomes infinite. On the other hand, a CN of 100 indicates that the impervious area needed for maximum potential retention becomes zero (i.e., ).
The initial abstraction is a key factor in determining the initiation of the direct runoff. However, its estimation involves much uncertainty, which results in error in the estimation of the direct runoff [6]. Especially in a large basin when the areal-average rainfall and runoff data are the only available information, the estimation of the initial abstraction becomes ambiguous. As mentioned earlier, the common assumption of the initial abstraction is 20% of the maximum potential retention [6]. However, many studies have disputed this linear assumption between the initial abstraction and maximum potential retention [20,21,22,23,24]. Another study proposed the range of 0–40% as the ratio between the initial abstraction and maximum potential retention [25]. Other studies, like that of Woodward et al. [20], showed how to determine the initial abstraction by analyzing the rainfall–runoff data. In fact, they defined the initial abstraction to be the total rainfall amount up to the starting point of the direct runoff. Based on the analysis of 134 basins in the US (United States), Woodward et al. [20] proposed just 5% of the maximum potential retention for the initial abstraction.
The maximum potential retention is the maximum volume of water to be stored within the basin soil profile. In early application of the SCS–CN method, the maximum potential retention was assumed to be constant for the given basin [26]. Theoretically, the maximum potential retention can be the volume of void in the soil profile, but it is also dependent upon the antecedent moisture condition. This is simply because recent precipitation can still remain within the void of the soil profile [25,27,28,29,30]. The maximum potential retention also varies depending on the vegetation, land use, antecedent precipitation, etc. [31]. As the maximum potential retention is defined as the maximum difference between the total precipitation and the direct runoff, it should be determined by analyzing their relation [30].
The antecedent moisture condition (AMC) thus plays an important role in the application of the SCS–CN method. The AMC simply defines the soil condition to control the infiltration capacity [31]. Three different concepts are generally cited for the AMC, which are the antecedent base-flow index (ABFI), soil moisture index (SMI), and antecedent precipitation index (API) [31]. The ABFI is based on the groundwater runoff, so it is difficult to link it to the soil moisture condition [6]. The SMI is generally applied to the long-term runoff analysis, and thus it is important to consider the evapotranspiration [32,33,34,35]. The API considers the precipitation amount during the antecedent 5 to 30 days. The duration can vary, depending on the soil and climate characteristics [25,36]. The SCS–CN method adopted the concept of API, and five days is considered as the proper period for the antecedent precipitation.
In the SCS–CN method, three different AMCs are defined separately for the growing season and the dormant season. The growing season in the US is from June to September, while the dormant season is from October to the following May. For each season, three AMCs are defined by the amount of antecedent five-day precipitation. AMC-I represents the dry condition, thus the direct runoff is minimized. On the other hand, AMC-III represents the wet condition, thus the direct runoff is maximized. AMC-II is the neutral condition in between the wet and dry conditions. These three conditions are considered in the SCS–CN method by controlling the CN. In fact, CN for AMC-III represents the highest CN among those derived by analyzing the sufficient length of rainfall–runoff data. On the other hand, the CN for AMC-I represent the lowest CN. The remaining CNs are then averaged to be CN for the AMC-II [37].
CN for AMC-II (or CN(II)) can be converted into CNs for AMC-I and ANC-III, i.e., AMC(I) and AMC(III), by the following two equations:
2.2. Estimation of CN by Analyzing the Rainfall–Runoff Data
It is possible to derive CN by analyzing the rainfall–runoff data. The derived CN varies greatly, depending on the rainfall event. Sometimes CN(I) can be estimated higher than CN(II). It is also possible that CN(III) is estimated smaller than CN(II) [38]. This is simply because the possible range of CN(II) is very wide [6,39]. When estimating CN from the observed rainfall–runoff data, some variation may not be avoidable. Based on previous studies [40,41,42,43], the CN of a basin is found to decrease as the total precipitation increases. Even though the standard pattern is general [40], another two patterns are also found [40,41,42]. Various methods for determining the representative CN for a basin have also been proposed by many studies [44,45,46,47].
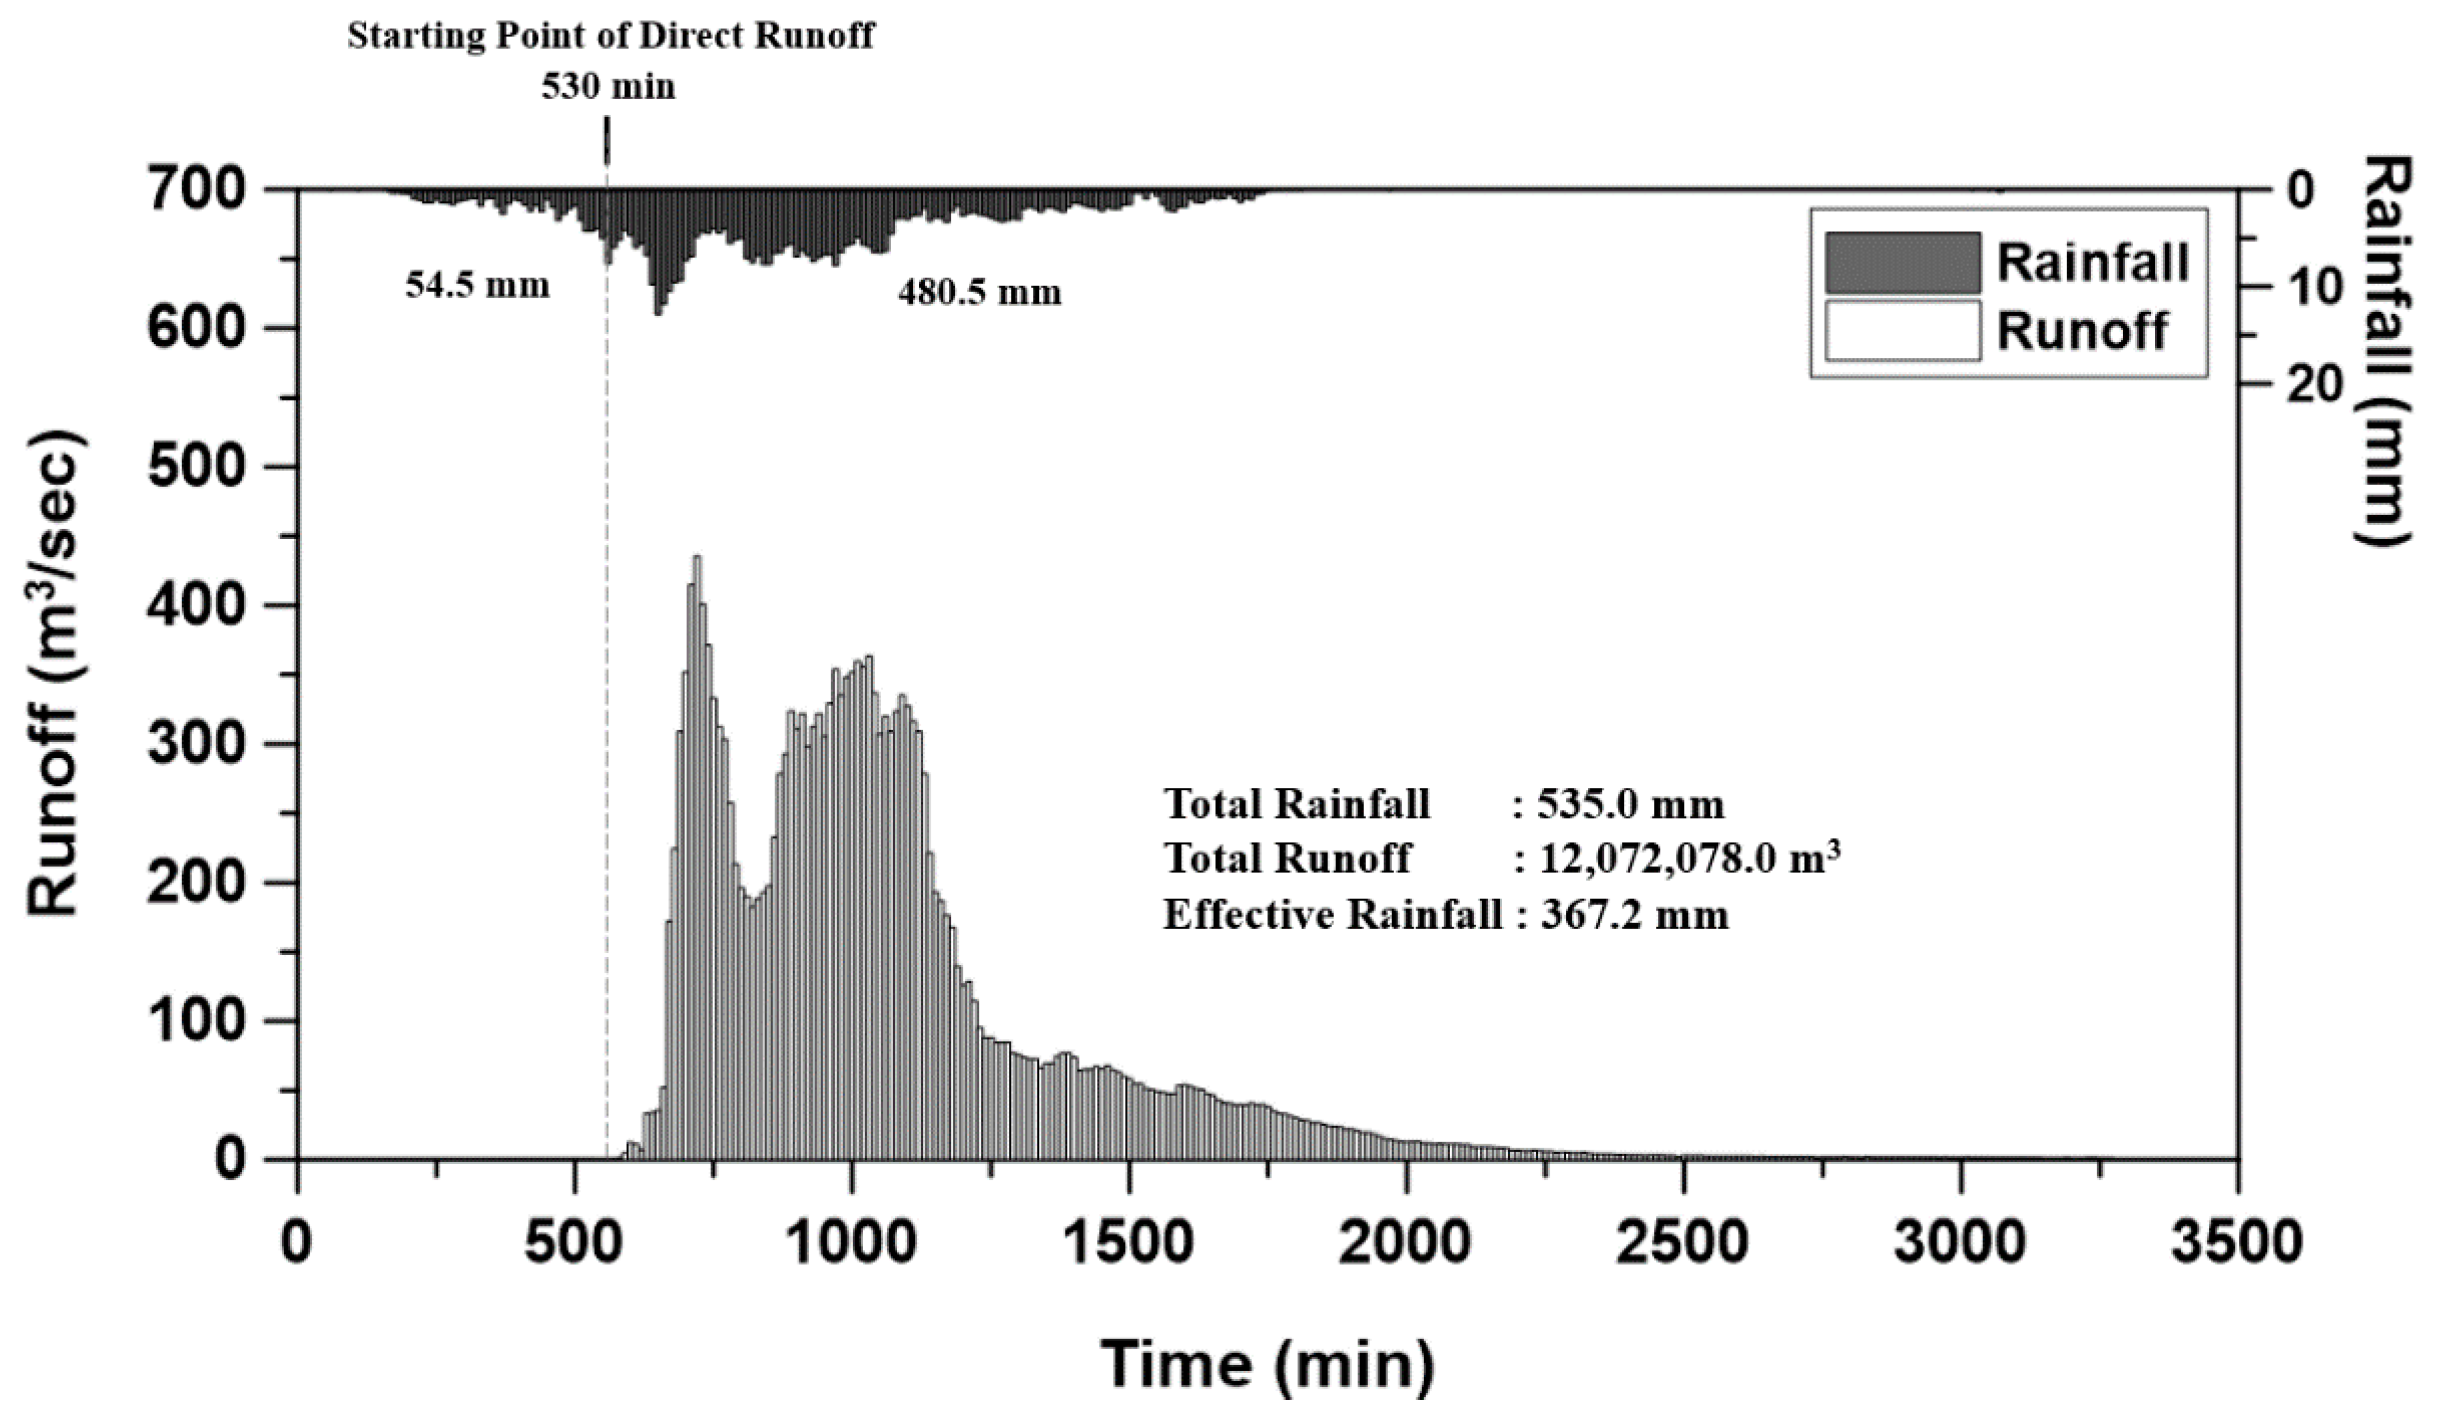
In fact, the estimation of CN for a rainfall event is straightforward if the ratio is fixed. Simply the CN can be estimated by solving Equations (4) and (5) with observed P and Q. However, if the ratio is unknown, the estimation of CN can be complicated, as these two parameters should be determined by solving the non-linear equation set. Obviously, there is no guarantee of deriving the optimal parameter set. Due to this reason, this study followed the step by step approach. The methodology for estimating CN by analyzing the rainfall–runoff data is summarized as in Figure 1. First, it is important to separate the direct runoff from the total runoff. Fortunately, the main stream of the Hancheon basin is mostly dry, even in the wet summer season. This is a general characteristic of the porous volcanic soil on Jeju Island. The runoff observed at the exit of the Hancheon basin could thus be assumed to be the direct runoff. Second, the initial abstraction is determined by following Woodward et al. [20]. That is, the initial abstraction is determined as the total precipitation amount from the beginning of the rainfall to the occurrence point of the direct runoff. Then the maximum potential retention is estimated by the following equation:
By substituting the initial abstraction estimated in the first step and the observed total precipitation and direct runoff into Equation (8), the maximum potential retention can be calculated. CN can also be calculated using the relation between the maximum potential retention and CN, as in Equation (5).
3. Study Basin and Rainfall Events
3.1. Study Basin
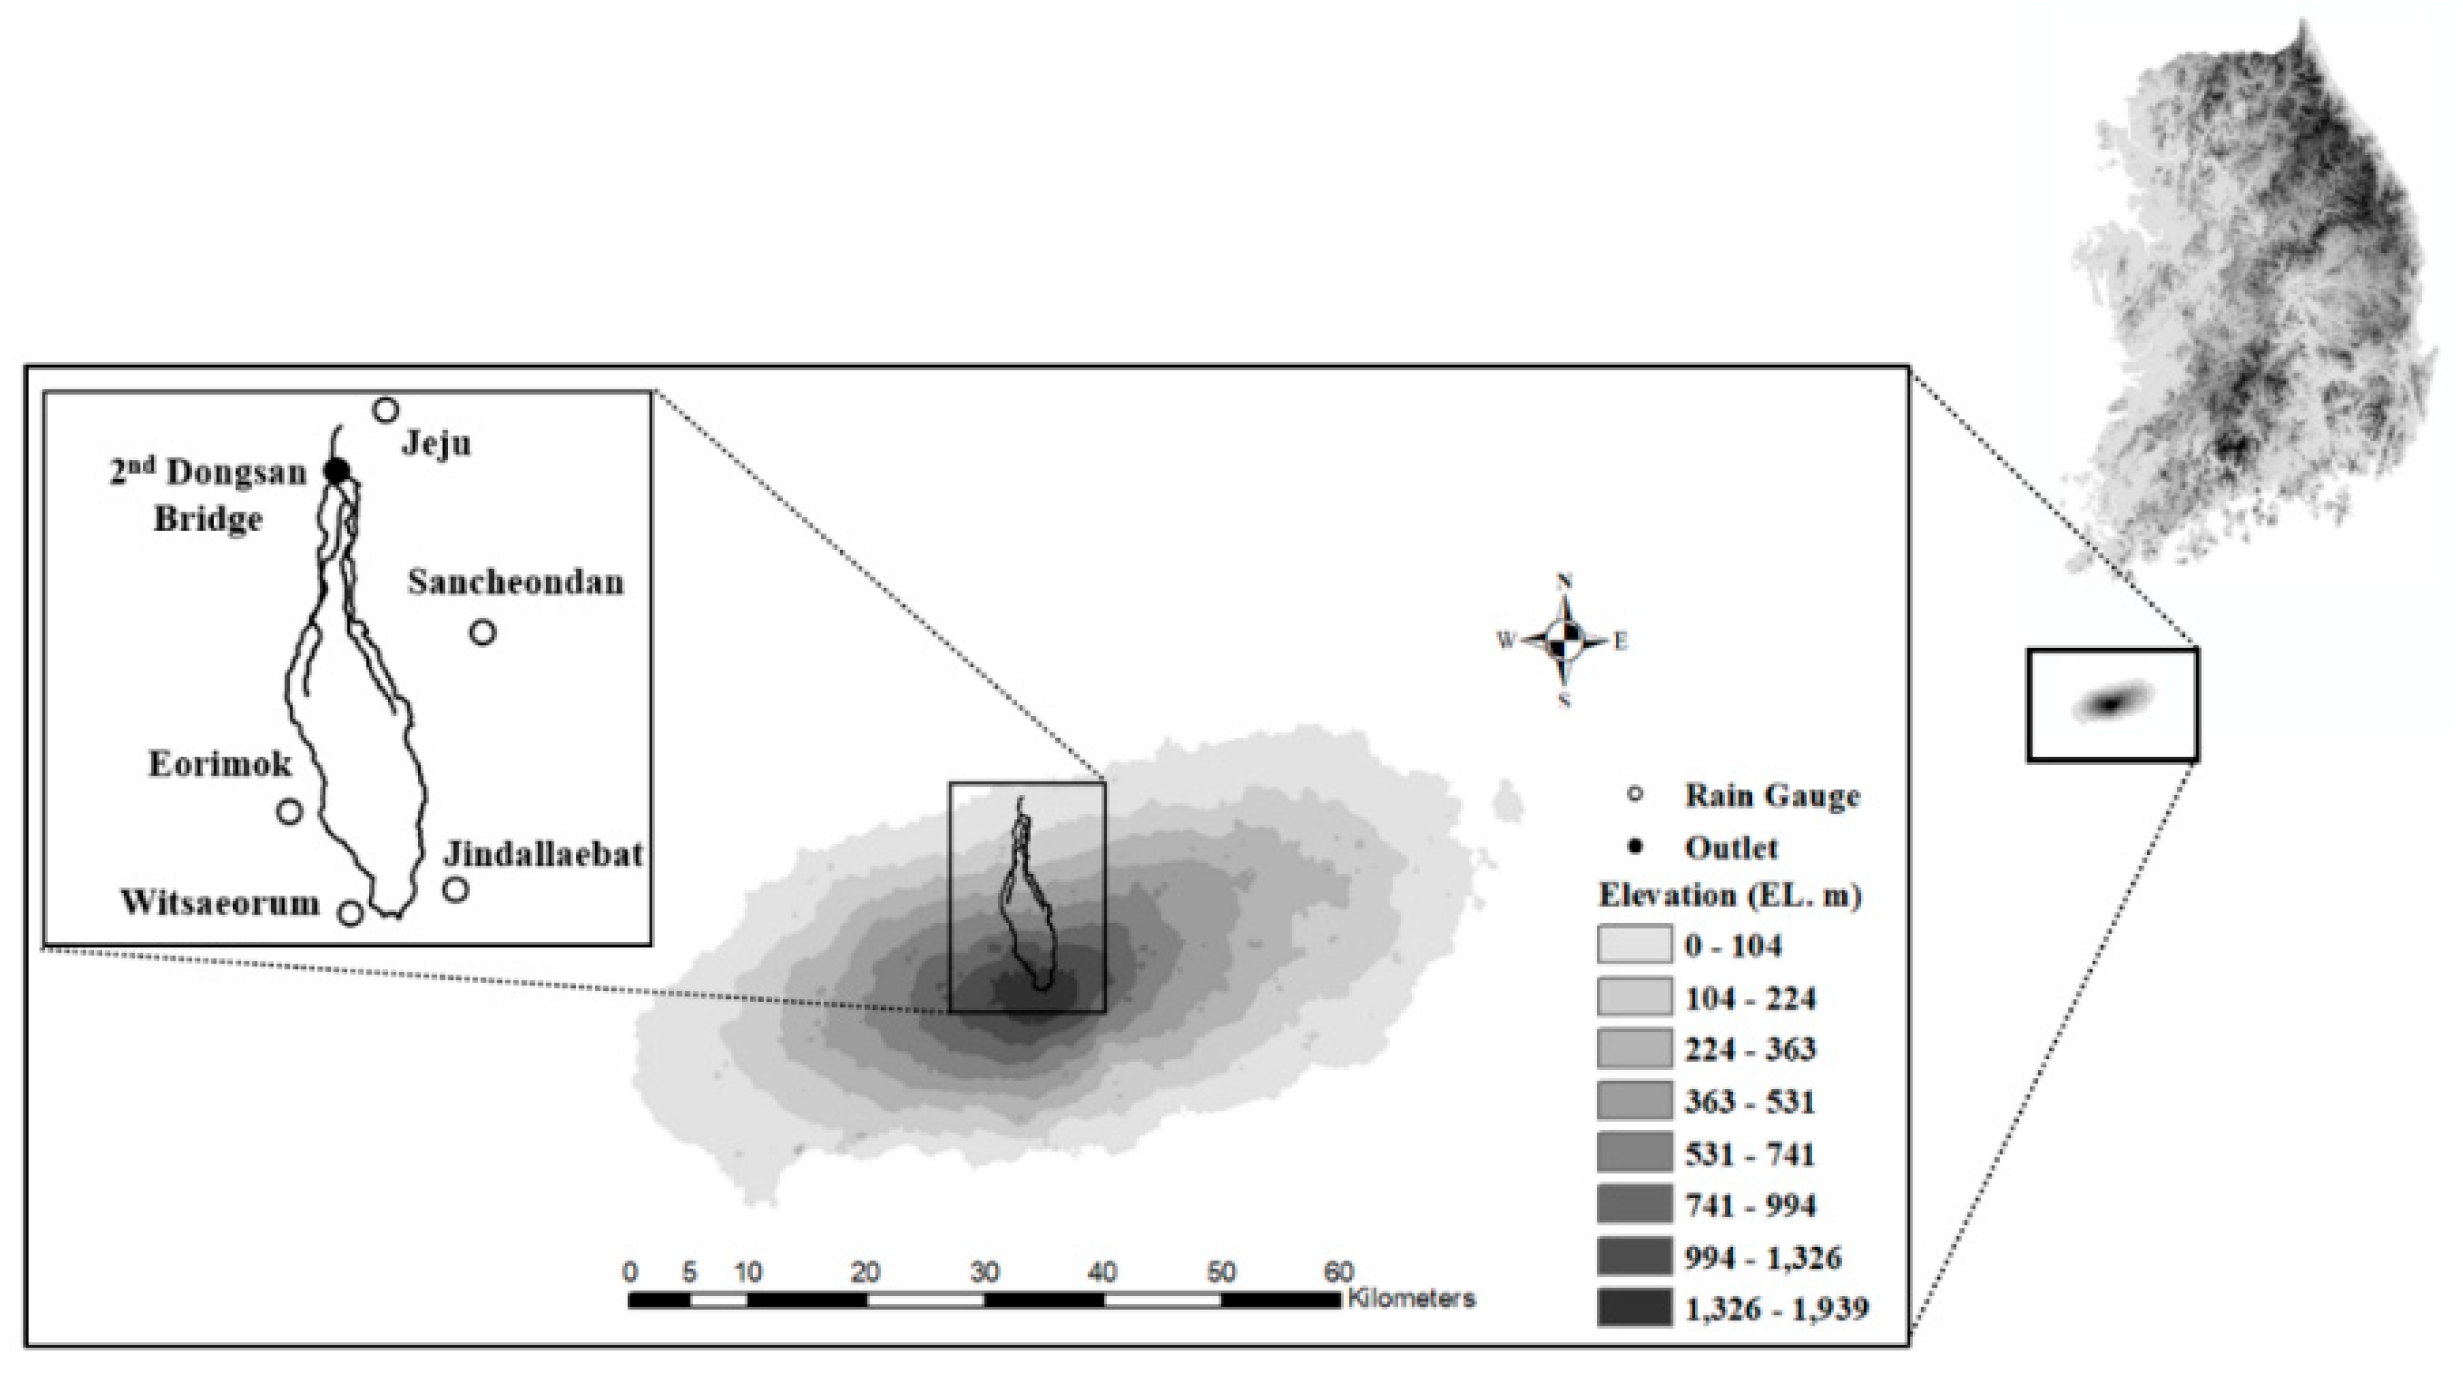
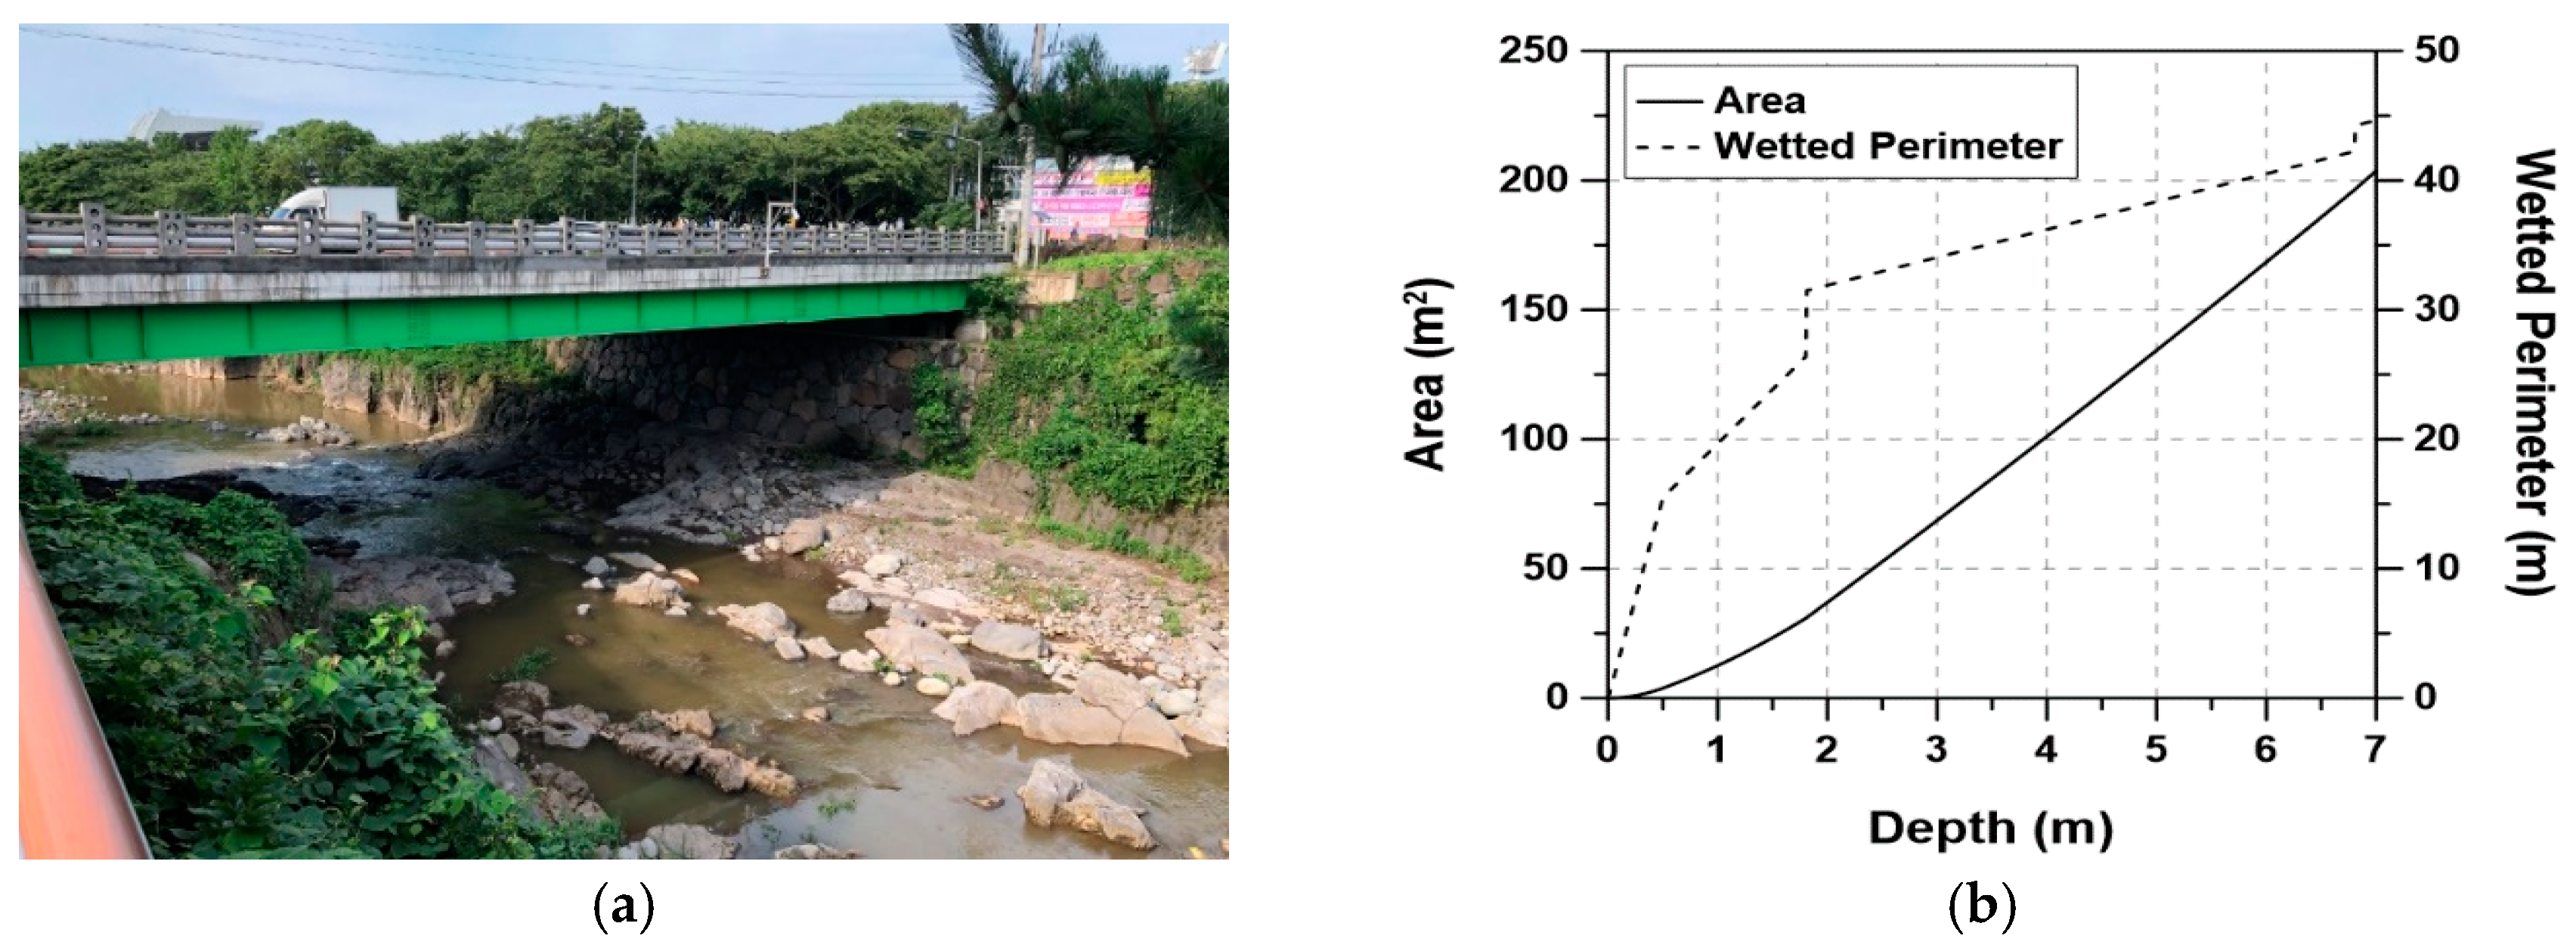
This study considers the Hancheon basin on Jeju Island, Korea (see Figure 2). Here, Hancheon is the name of the main channel of the Hancheon basin, which originates from Mount Halla, and runs to the seashore in Yongdam-dong. Hancheon is a dry river, which has runoff only during flooding. The upstream part of the basin is mostly forest, the middle stream area is farmland, and the downstream area is urban [4]. Hancheon riverbed is an eroded valley in the basaltic plateau, which has a deep rectangular cross-section, without any embankment. The Hancheon river at the exit of the basin is about 40 m wide and 7 m deep [48]. The area of the Hancheon basin is 32.88 km2; on the basis of the Second Dongsan Bridge, the channel length is 19.01 km, and the width of the basin is 1.75 km (i.e., the shape factor is 0.09) [13].
Figure 3 shows a picture and cross section of the Second Dongsan Bridge at the exit of the Hancheon basin. There is a surveillance video at the center of the Second Dongsan Bridge, whose image can be obtained from the home page of the Jeju Central Disaster and Safety Countermeasures Headquarters (https://www.jejusi.go.kr/bangjae/realcctv/river.do). An electromagnetic surface flowmeter is also placed at the center of this bridge, which measures both the flow velocity and the water stage every 10 min. The cross-section in Figure 3b was made using the survey data provided in the Master Plan for Local Rivers Management in Jeju-si and the preparation of river facility management [49].
3.2. Data
This study used the 10 min rainfall data obtained from four AWS (Automatic Weather Station) rain gauges around the Hancheon basin (i.e., Jeju (gauge number 184), Sancheondan (329), Eorimok (753), Jindallaebat (870), and Witsaeorum (871)). The areal-average data were then made by applying the Thiessen polygon method. The weighting applied to each rain gauge was Eorimok 48.89%, Sancheondan 22.96%, Jindallaebat 8.64%, Witsaeorum 10.19%, and Jeju 9.32%, respectively.
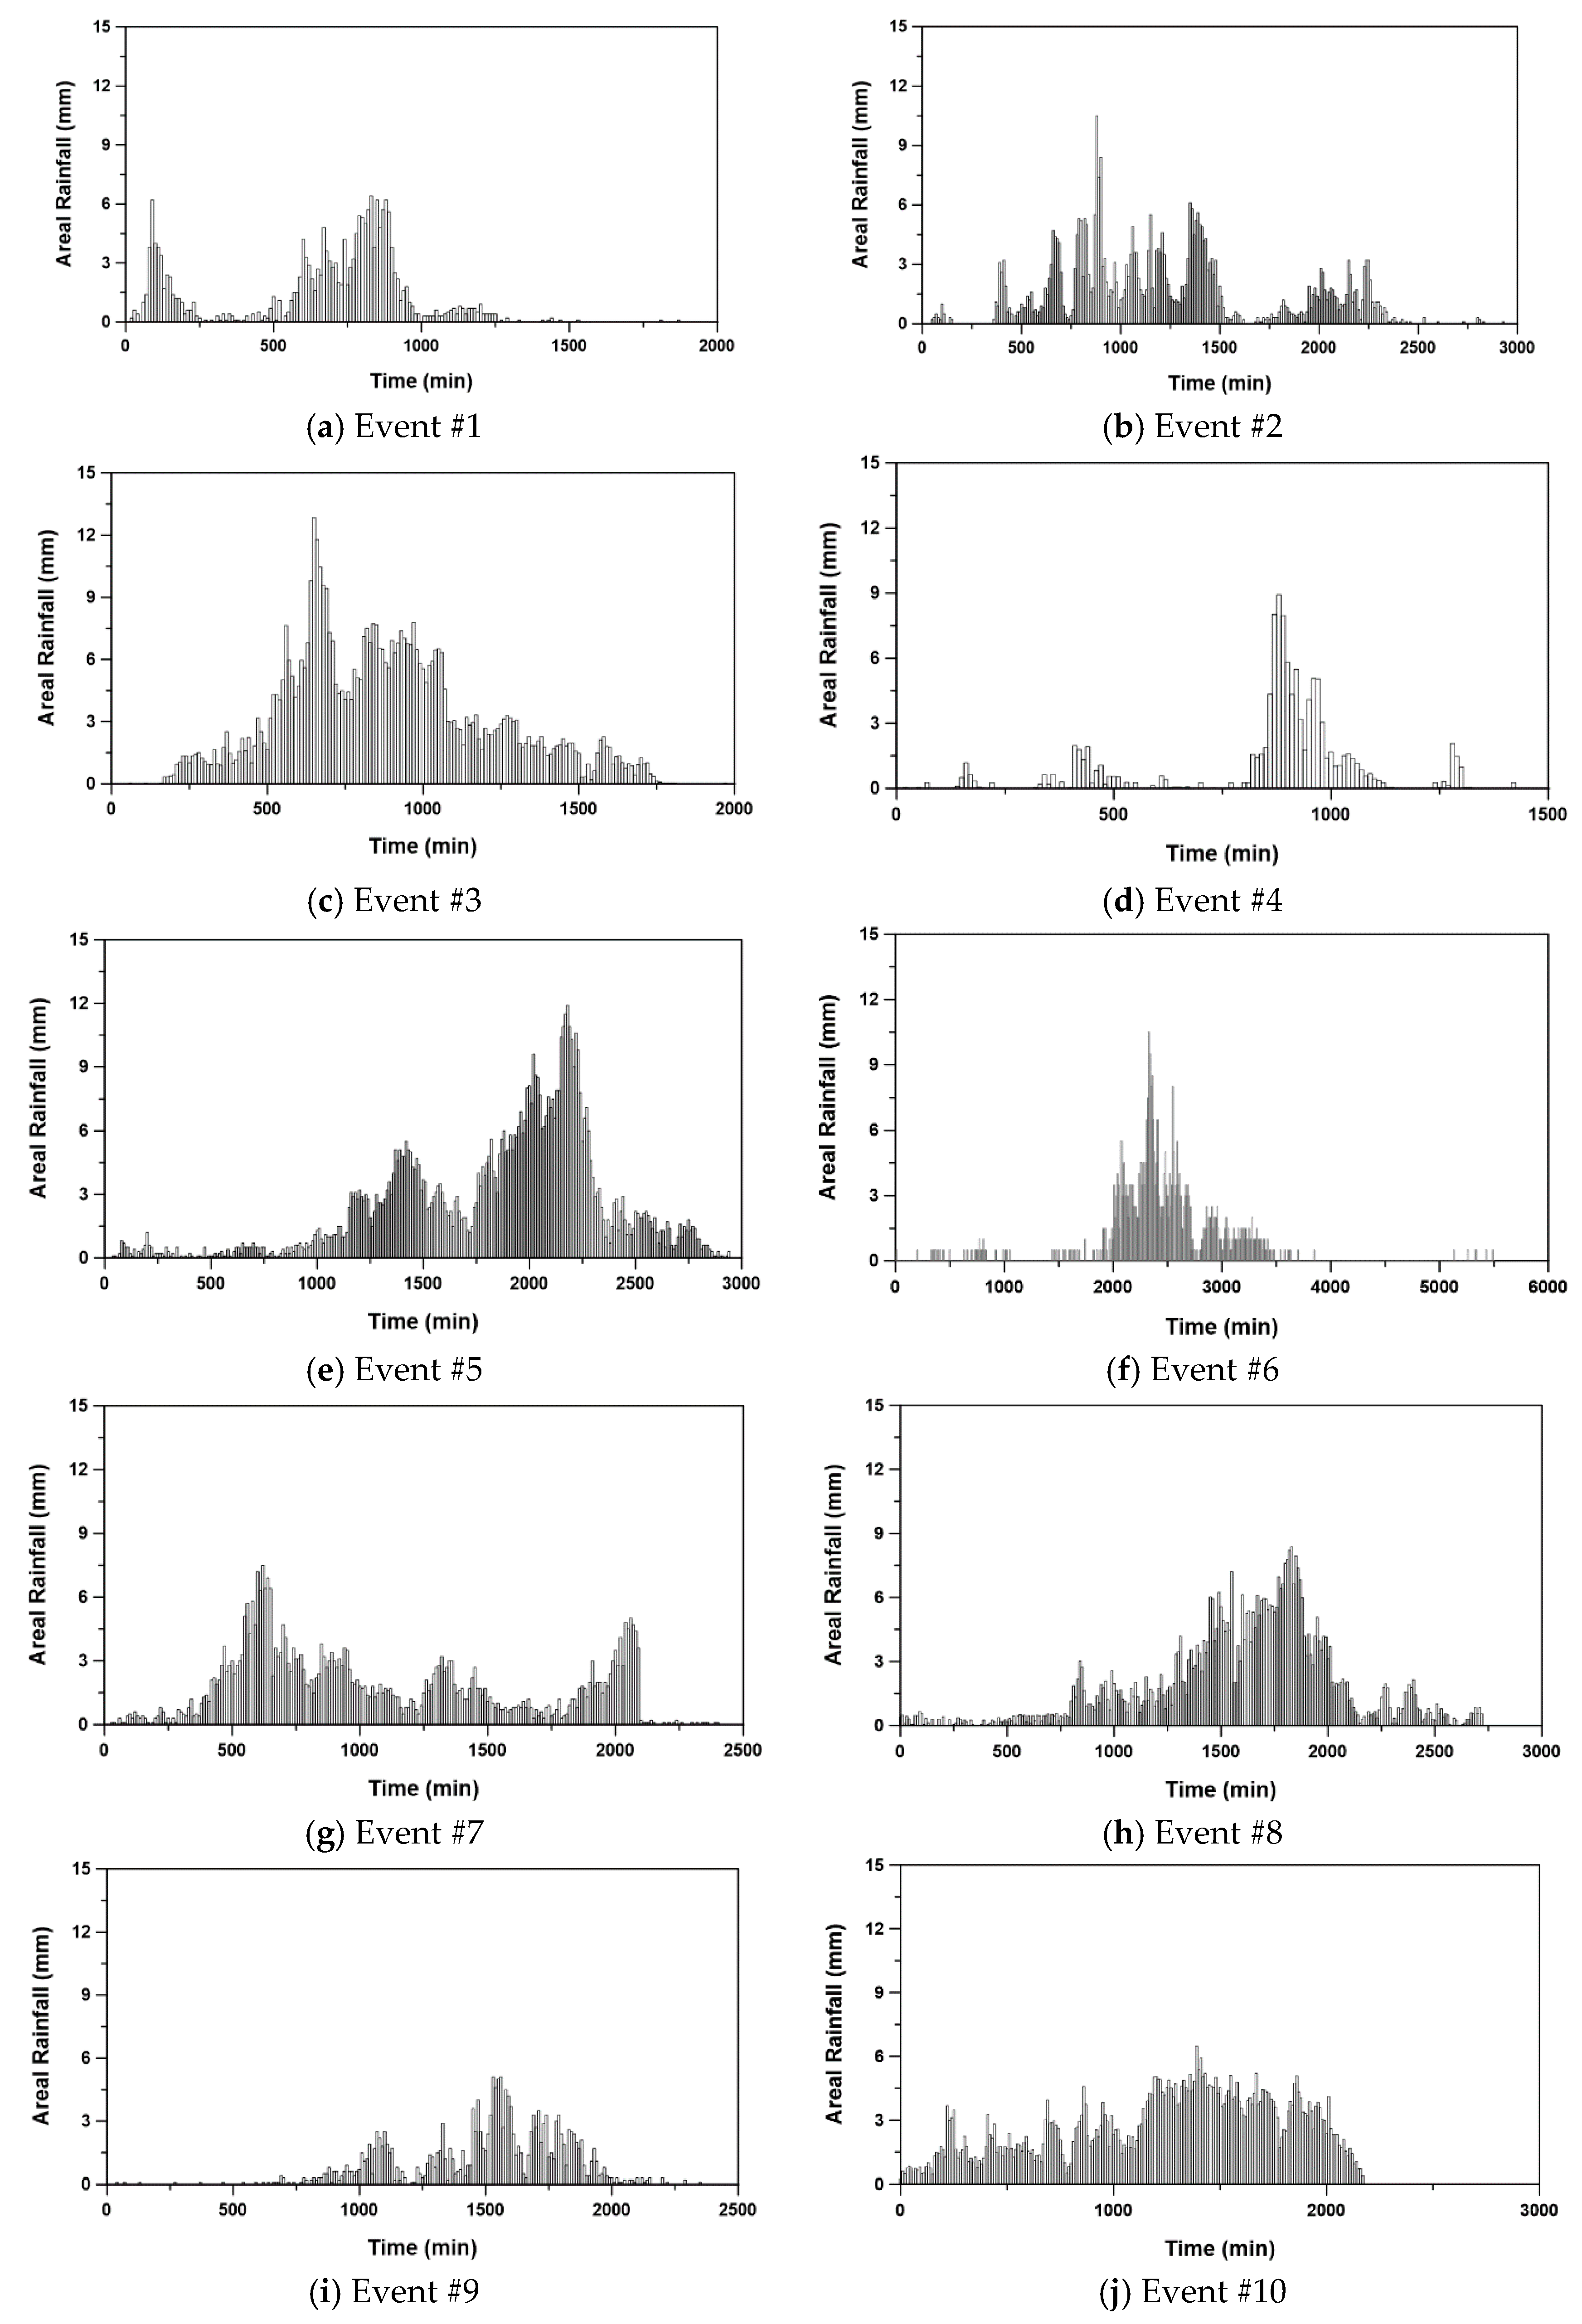
This study selected a total of ten rainfall events that occurred from 2012 to 2019 (Table 1). As the infiltration capacity of the soil in Jeju Island was known to be very high, only the rainfall events with their total precipitation higher than 100 mm were selected. Several events with significant problems in their runoff records were excluded. Among these selected rainfall events, nine events were caused by typhoons, while the remaining event was convective. In particular, Typhoon Bolaven, which passed the south-western part of Jeju Island in August 2012, recorded a maximum wind velocity of 49.6 m/s at the Seogwipo meteorological station, and a maximum total rainfall of 740.5 mm at the Witsaeorum meteorological station [50]. Based on the areal-average rainfall, the rainfall event #5 recorded the largest total rainfall amount of 691.5 mm, and the rainfall event #3 the highest one-hour rainfall intensity of 76.8 mm/h. The antecedent five-day precipitation for rainfall event #4, which was 564.8 mm, was the highest. Figure 4 compares the rainfall histogram of the rainfall events considered in this study.
The runoff data used were based on the water stage and surface velocity data measured by the electromagnetic surface flowmeter. As the electromagnetic surface flowmeter measures the surface velocity, this should be converted to the cross-sectional average velocity. There have been many studies to determine the conversion factor, or a constant to be used for converting the surface velocity into the cross-sectional average [51,52,53]. A similar study was also done in Korea for several streams in Jeju Island including the Hancheon [54]. Their result shows that the conversion factor should be 0.48 when the flow depth is lower than 0.5 m, 0.48–0.85 when the flow depth is in between 0.5 and 1.5 m, and 0.85 when the flow depth is higher than 1.5 m. In this study, this conversion factor was used for estimating the cross-sectional average velocity.
Table 2 summarizes the basic characteristics of the runoff data for the ten rainfall events considered. In fact, some portion of the data was missing; in particular, the entire surface velocity data for rainfall event #5 was missing. The missing portions of the data were interpolated by the data observed before and after the missing point. The mean depths of the rainfall events #3 and #5 were rather deep at 1.34 m and 1.43 m, respectively. Rainfall event #8 showed rather high flow velocity of 4.19 m/s.
4. Results and Discussions
4.1. Initial Abstraction and CN
The initial abstraction was determined as the rainfall amount from the beginning of the rainfall to the starting point of the direct runoff. However, as most of the time the Hancheon is a dry river, the starting point of the direct runoff coincides with the starting point of the total runoff. The effective rainfall depth was then calculated by dividing the total direct runoff volume by the basin area (i.e., 32.88 km2). CN could then be easily calculated using Equation (5). Figure 5 shows the procedure determining the initial abstraction from the rainfall–runoff data:
Table 3 summarizes the determined initial abstraction and CN for each rainfall event. CN varies widely from 44.0 to 80.1. As this wide variation was mainly caused by the AMC, the actual variation of CN may be smaller. For example, in the case that CN was estimated to be 80.1 (rainfall event #4), the antecedent five-day precipitation was over 500 mm. On the other hand, in the case of rainfall event #9, CN was estimated to be just 44.0, where the antecedent five-day precipitation was only about 100 mm. In fact, this antecedent five-day precipitation was not a small amount, but could be considered small in a porous basalt region (this issue will be investigated later). Overall, by considering the four rainfall events with more than 100 mm of antecedent five-day rainfall amount, the representative value of CN was assumed to be a little higher than 60.
The maximum potential retention mostly controls the CN, so the variation of the maximum potential retention indicates the variation of CN. However, as the maximum potential retention is dependent on the soil moisture content, it becomes small in the case that CN is high, and vice versa. This relation is also what the SCS-CN method explains, such as in Equation (5). Table 3 also confirms this tendency. For example, rainfall event #4 shows the smallest maximum potential retention of 63.0 mm, but the highest CN of 80.1. Rainfall event #10 shows the highest maximum potential retention of 415.2 mm, but CN was very small at 38.0. The initial abstraction, which is also linearly proportional to the maximum potential retention, could vary, depending on the maximum potential retention.
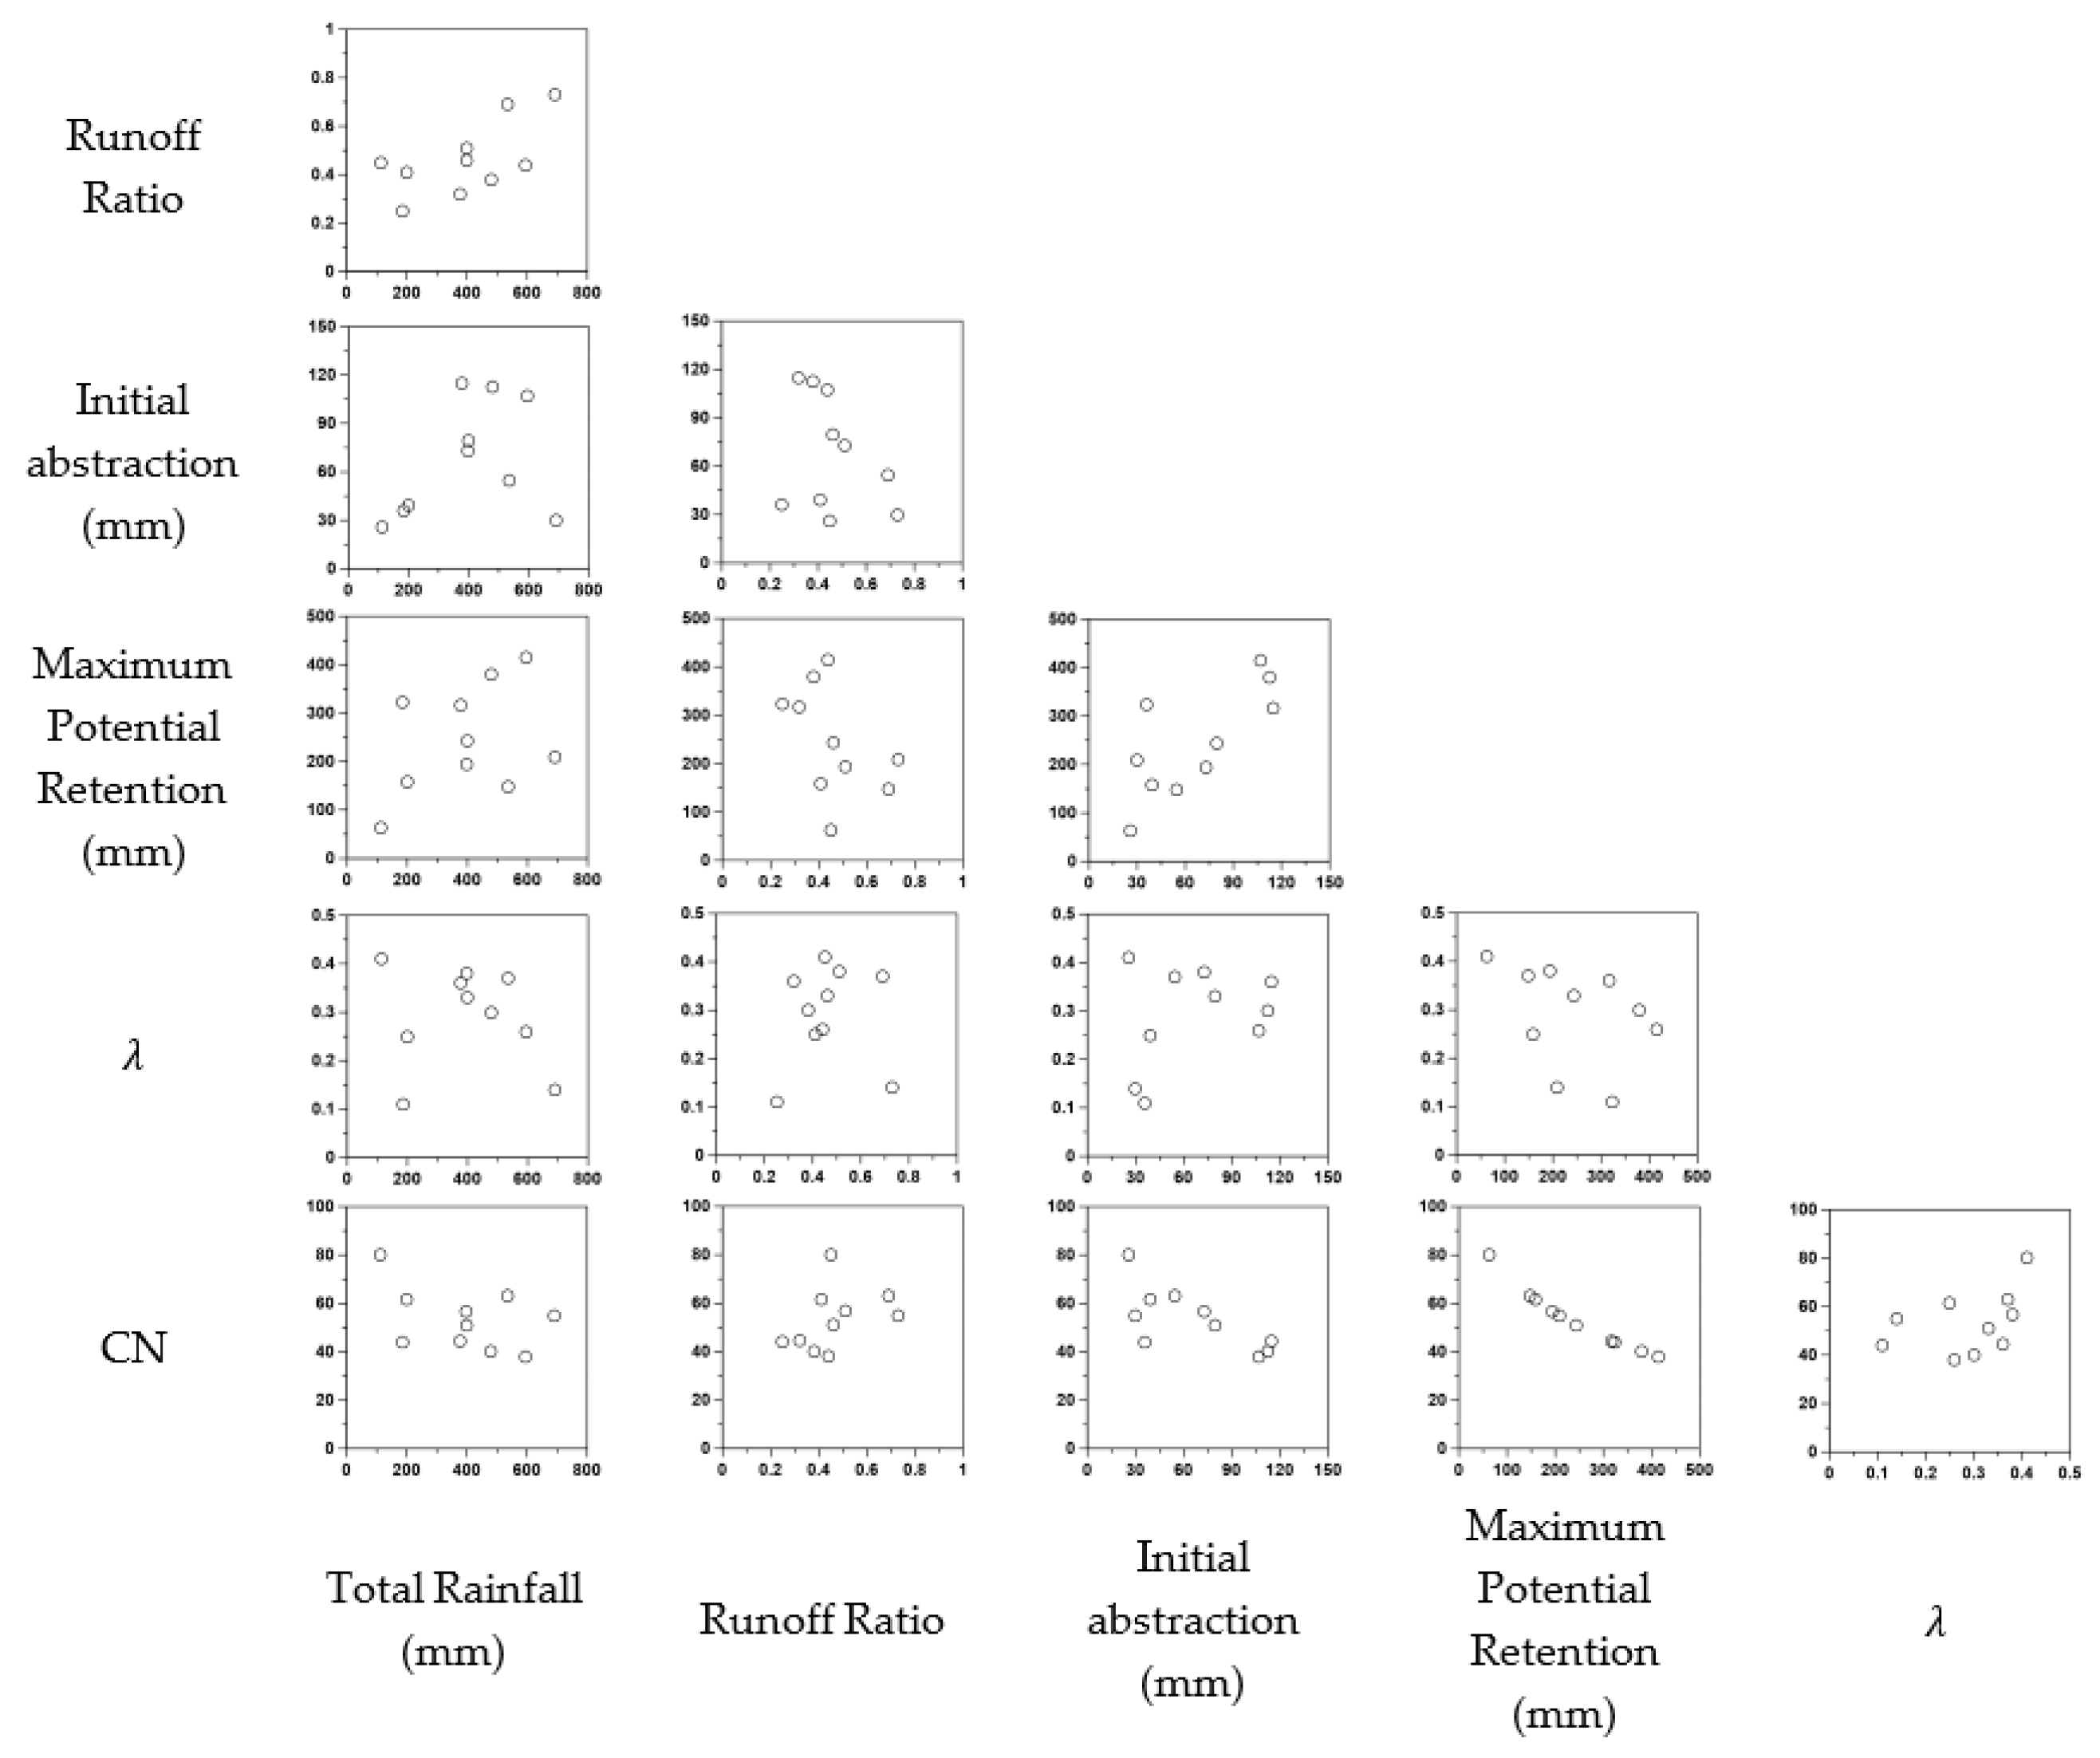
The relation among many variables related to the SCS–CN method can be investigated using the scatterplot (Figure 6). This investigation is also useful to validate the consistency between the estimated variables and the SCS–CN model structure. In this study, the total precipitation, runoff ratio, maximum potential retention, ratio , and CN were considered. Among the possible relations, the clearest relation could be found between CN and the maximum potential retention. As mentioned earlier, their negative correlation is what the SCS–CN method adopts. That is, the higher the CN, the smaller the maximum potential retention. Additionally, even though the correlation is rather weak, the negative correlation between the ratio and the maximum potential retention was also noticeable. This relation can also be explained by the definition of the initial abstraction. These two negative correlations also indicate the significant positive relation between CN and the ratio , which can also be confirmed in Figure 6. Also, as the multiplication of the maximum potential retention and the ratio becomes the initial abstraction, no clear relation might be expected between the initial abstraction and CN. The same applies between the total precipitation and CN, and between the runoff ratio and CN. Based on this interpretation, the result summarized in Table 3 can be accepted as valid and consistent with the SCS–CN method.
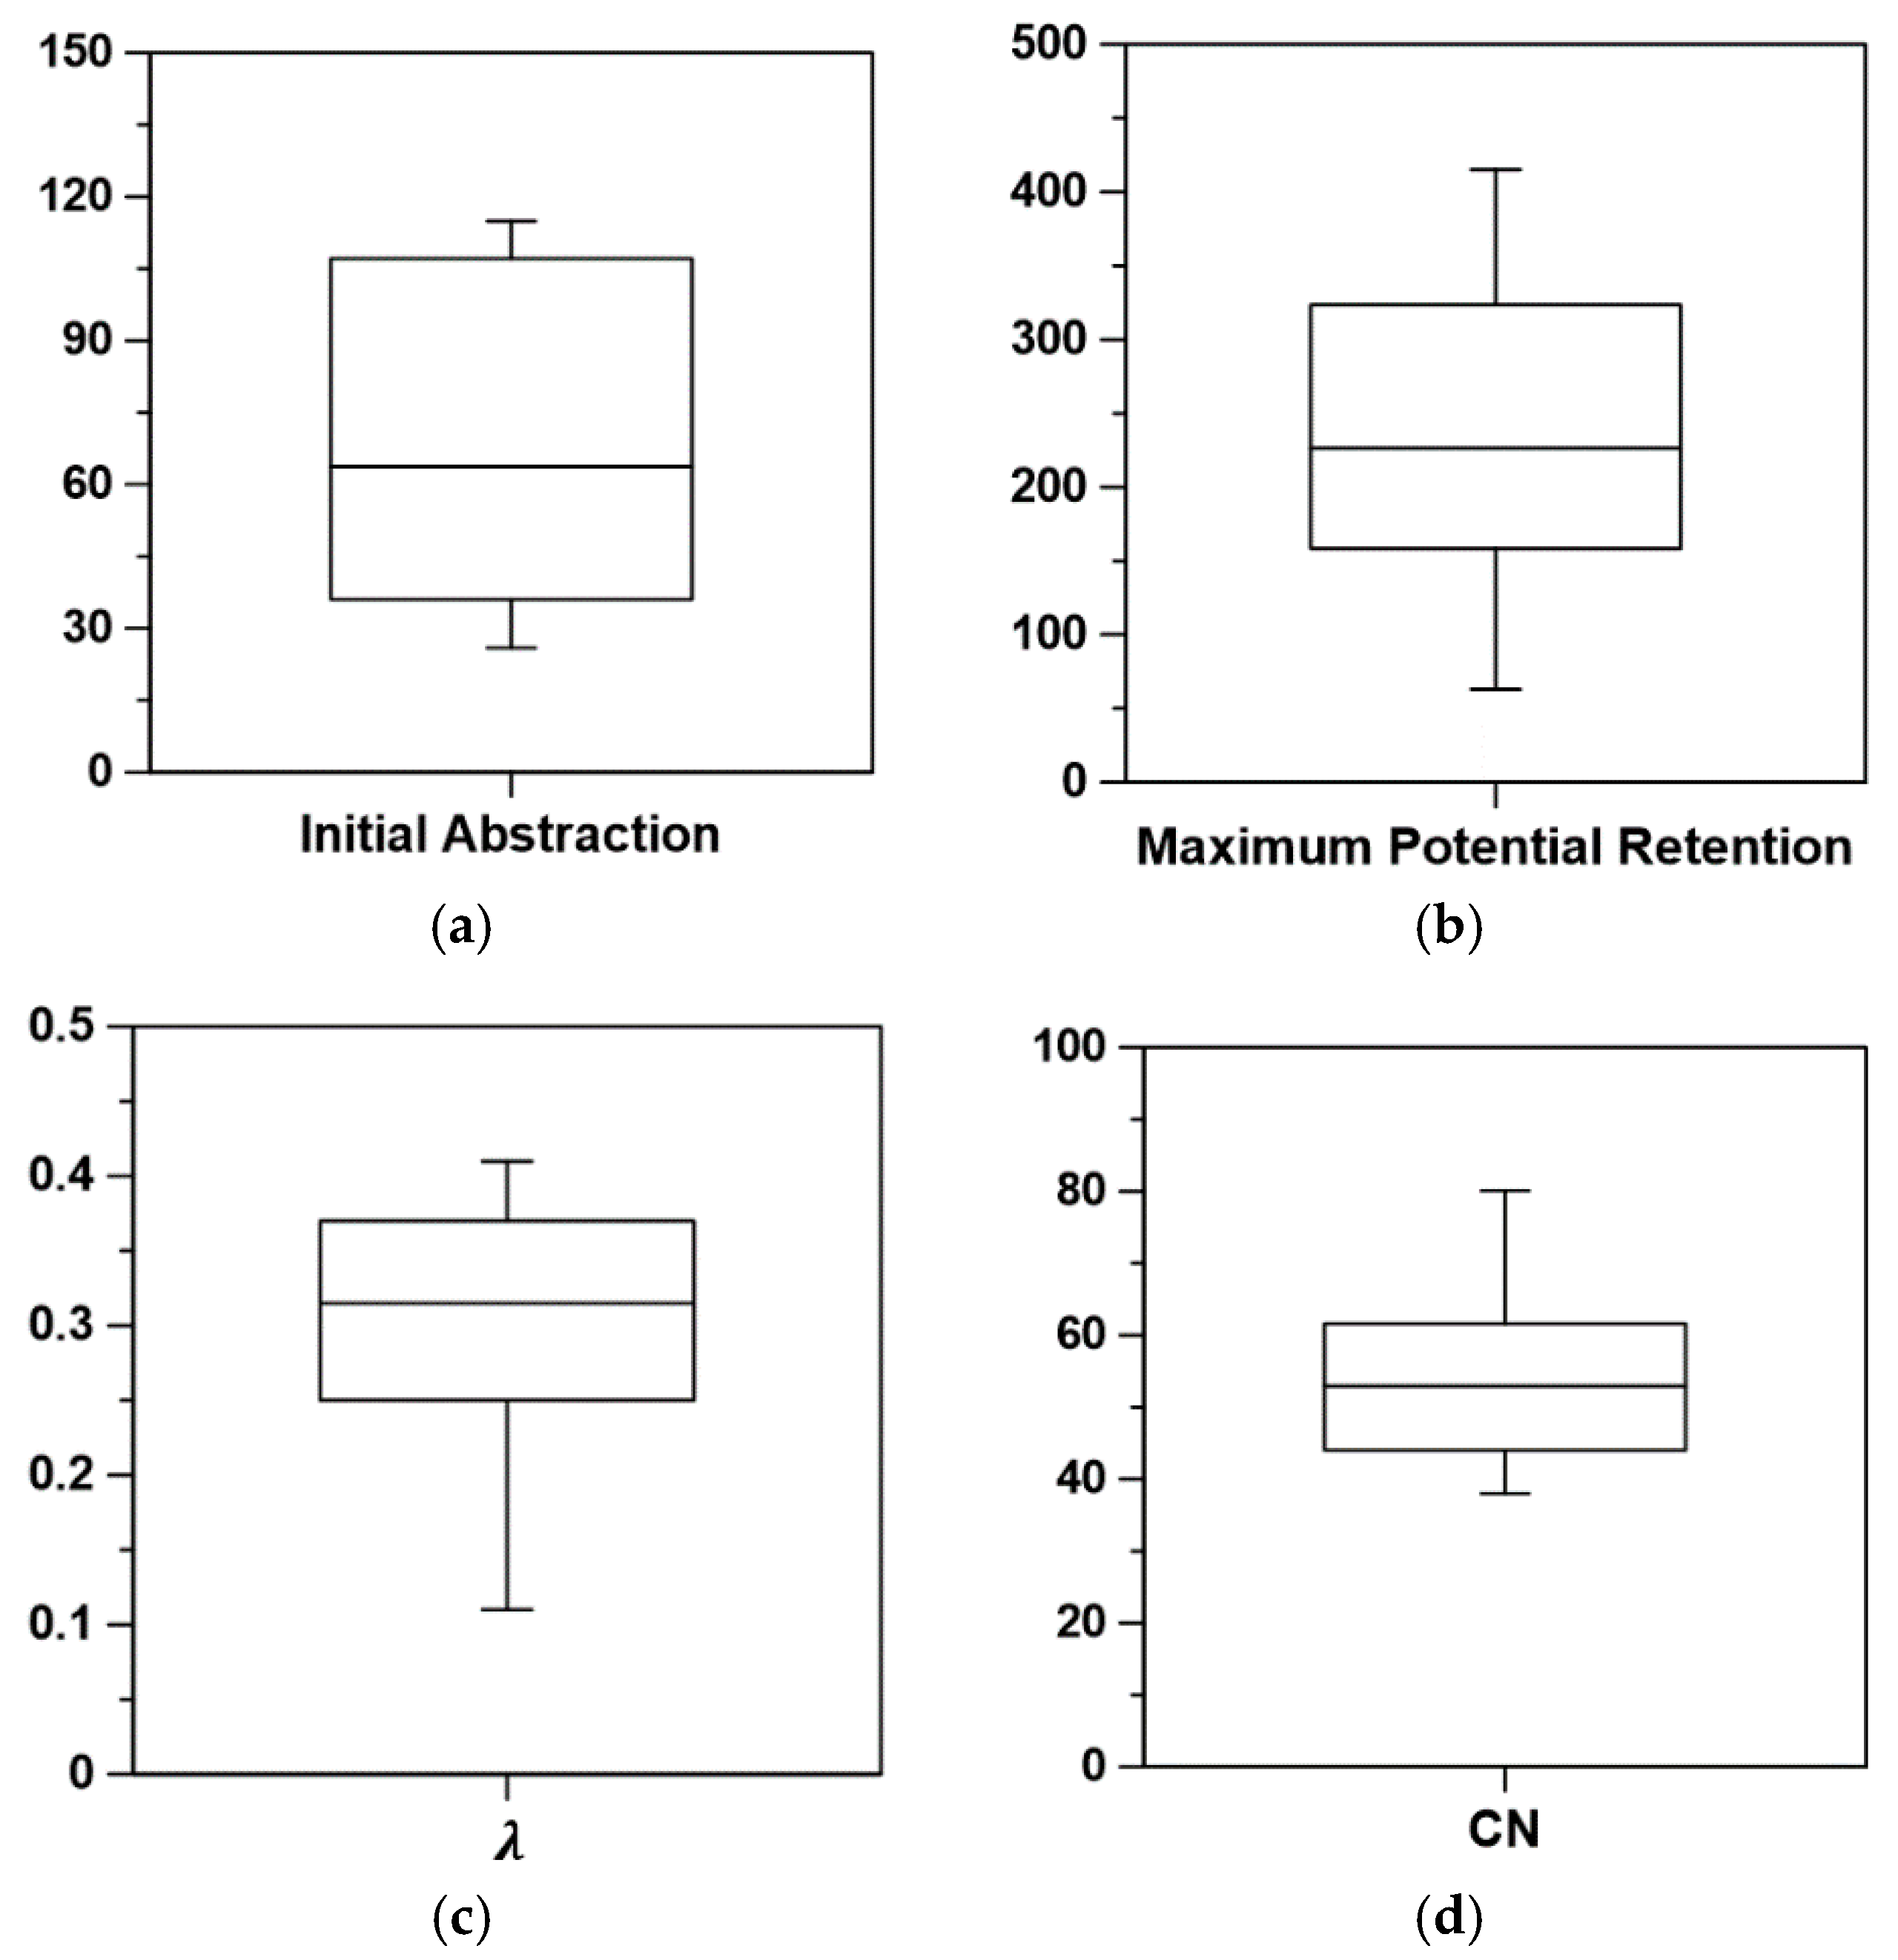
The basic characteristics of the determined initial abstraction, maximum potential retention, ratio , and CN can be easily investigated using the box plot (Figure 7). Table 4 also summarizes the important statistics of the box plot. The box plot shows that the data are not so strongly skewed. There is no outlier detected in all four cases. Symmetricity is strong in the initial abstraction and the maximum potential retention. Even though slightly longer tails are found in the ratio and CN, these are mainly due to one or two estimates. For the initial abstraction, the median is 63.7 mm, the first quartile is 36.0 mm, and the third quartile is 107.1 mm. For the maximum potential retention, the median is 226.2 mm, the first quartile is 158.4 mm, and the third quartile is 323.4 mm. The median of ratio λ is 0.32, while the first quartile is 0.25, and the third quartile is 0.37. Finally, the median of CN is 53.0, while the first quartile is 44.0, and the third quartile of 61.6.
4.2. Effect of AMC
As mentioned earlier, most variables considered in the SCS–CN method are highly dependent upon the AMC condition. In fact, this investigation of the behavior of these variables with respect to the AMC condition is especially important, as it can provide important tips for determining their representative values. In the previous analysis, it was possible to see their correlation structures and relative behaviors, but it was impossible to determine their representative values.
As the SCS–CN method accepts the concept of API, it should also be important to determine the number of days of antecedent precipitation. The generally accepted period is five days. However, as the Hancheon basin is in a porous basalt region, a slightly shorter period may be more appropriate. This part of the study also aims at this issue, which was investigated as a form of sensitivity analysis. A total of five cases from one to five days were examined in this study. As variables of interest, the maximum potential retention, ratio , and CN were considered. In fact, the initial abstraction is related to the AMC condition via all of the three variables to be analyzed.
Table 5 summarizes the antecedent precipitation amount depending on the number of antecedent days to be considered. Basically, the antecedent five-day precipitation amount for rainfall events #5, #6, #7, #8, and #10 was relatively small; in particular, the antecedent precipitation amount for rainfall event #8 and #10 was zero. On the other hand, rainfall events #3 and #4 show a very large antecedent five-day precipitation amount, whose values were 392.2 mm and 564.8 mm, respectively. If considering a slightly shorter period like three days, the antecedent precipitation amount can, in general, become smaller. For example, the antecedent precipitation amount of rainfall events #1, #3, and #9 became much smaller, at 68.0 mm, 47.4 mm, and 49.7 mm, respectively. In particular, the antecedent precipitation amount for rainfall event #3 decreased from 392.2 mm to 47.4 mm.
Additionally, the runoff ratio also shows the problem of using the antecedent five-day precipitation amount (see Table 3). The runoff ratios for rainfall events #3, #5, and #7 were estimated to be higher than 0.5, but the others to be less than 0.5. The generally accepted idea is that the runoff ratio is proportional to the antecedent precipitation amount. However, rainfall event #5 showed the highest runoff ratio of 0.73, even though the antecedent five-day precipitation amount was just 10.7 mm. On the other hand, the antecedent five-day precipitation amount of rainfall event #4 was 564.8 mm, but the runoff ratio was 0.45. Basically, the runoff ratio in the Hancheon basin seems to be affected in a complex manner by the rainfall characteristics, including the AMC. For example, the duration of rainfall event #4 was 26 h, but for rainfall event #5, it was 52 h. However, as the total rainfall was 113.0 mm for rainfall event #4 and 691.5 mm for rainfall event #5, the maximum rainfall intensity was (49.2 and 71.4) mm/h, respectively.
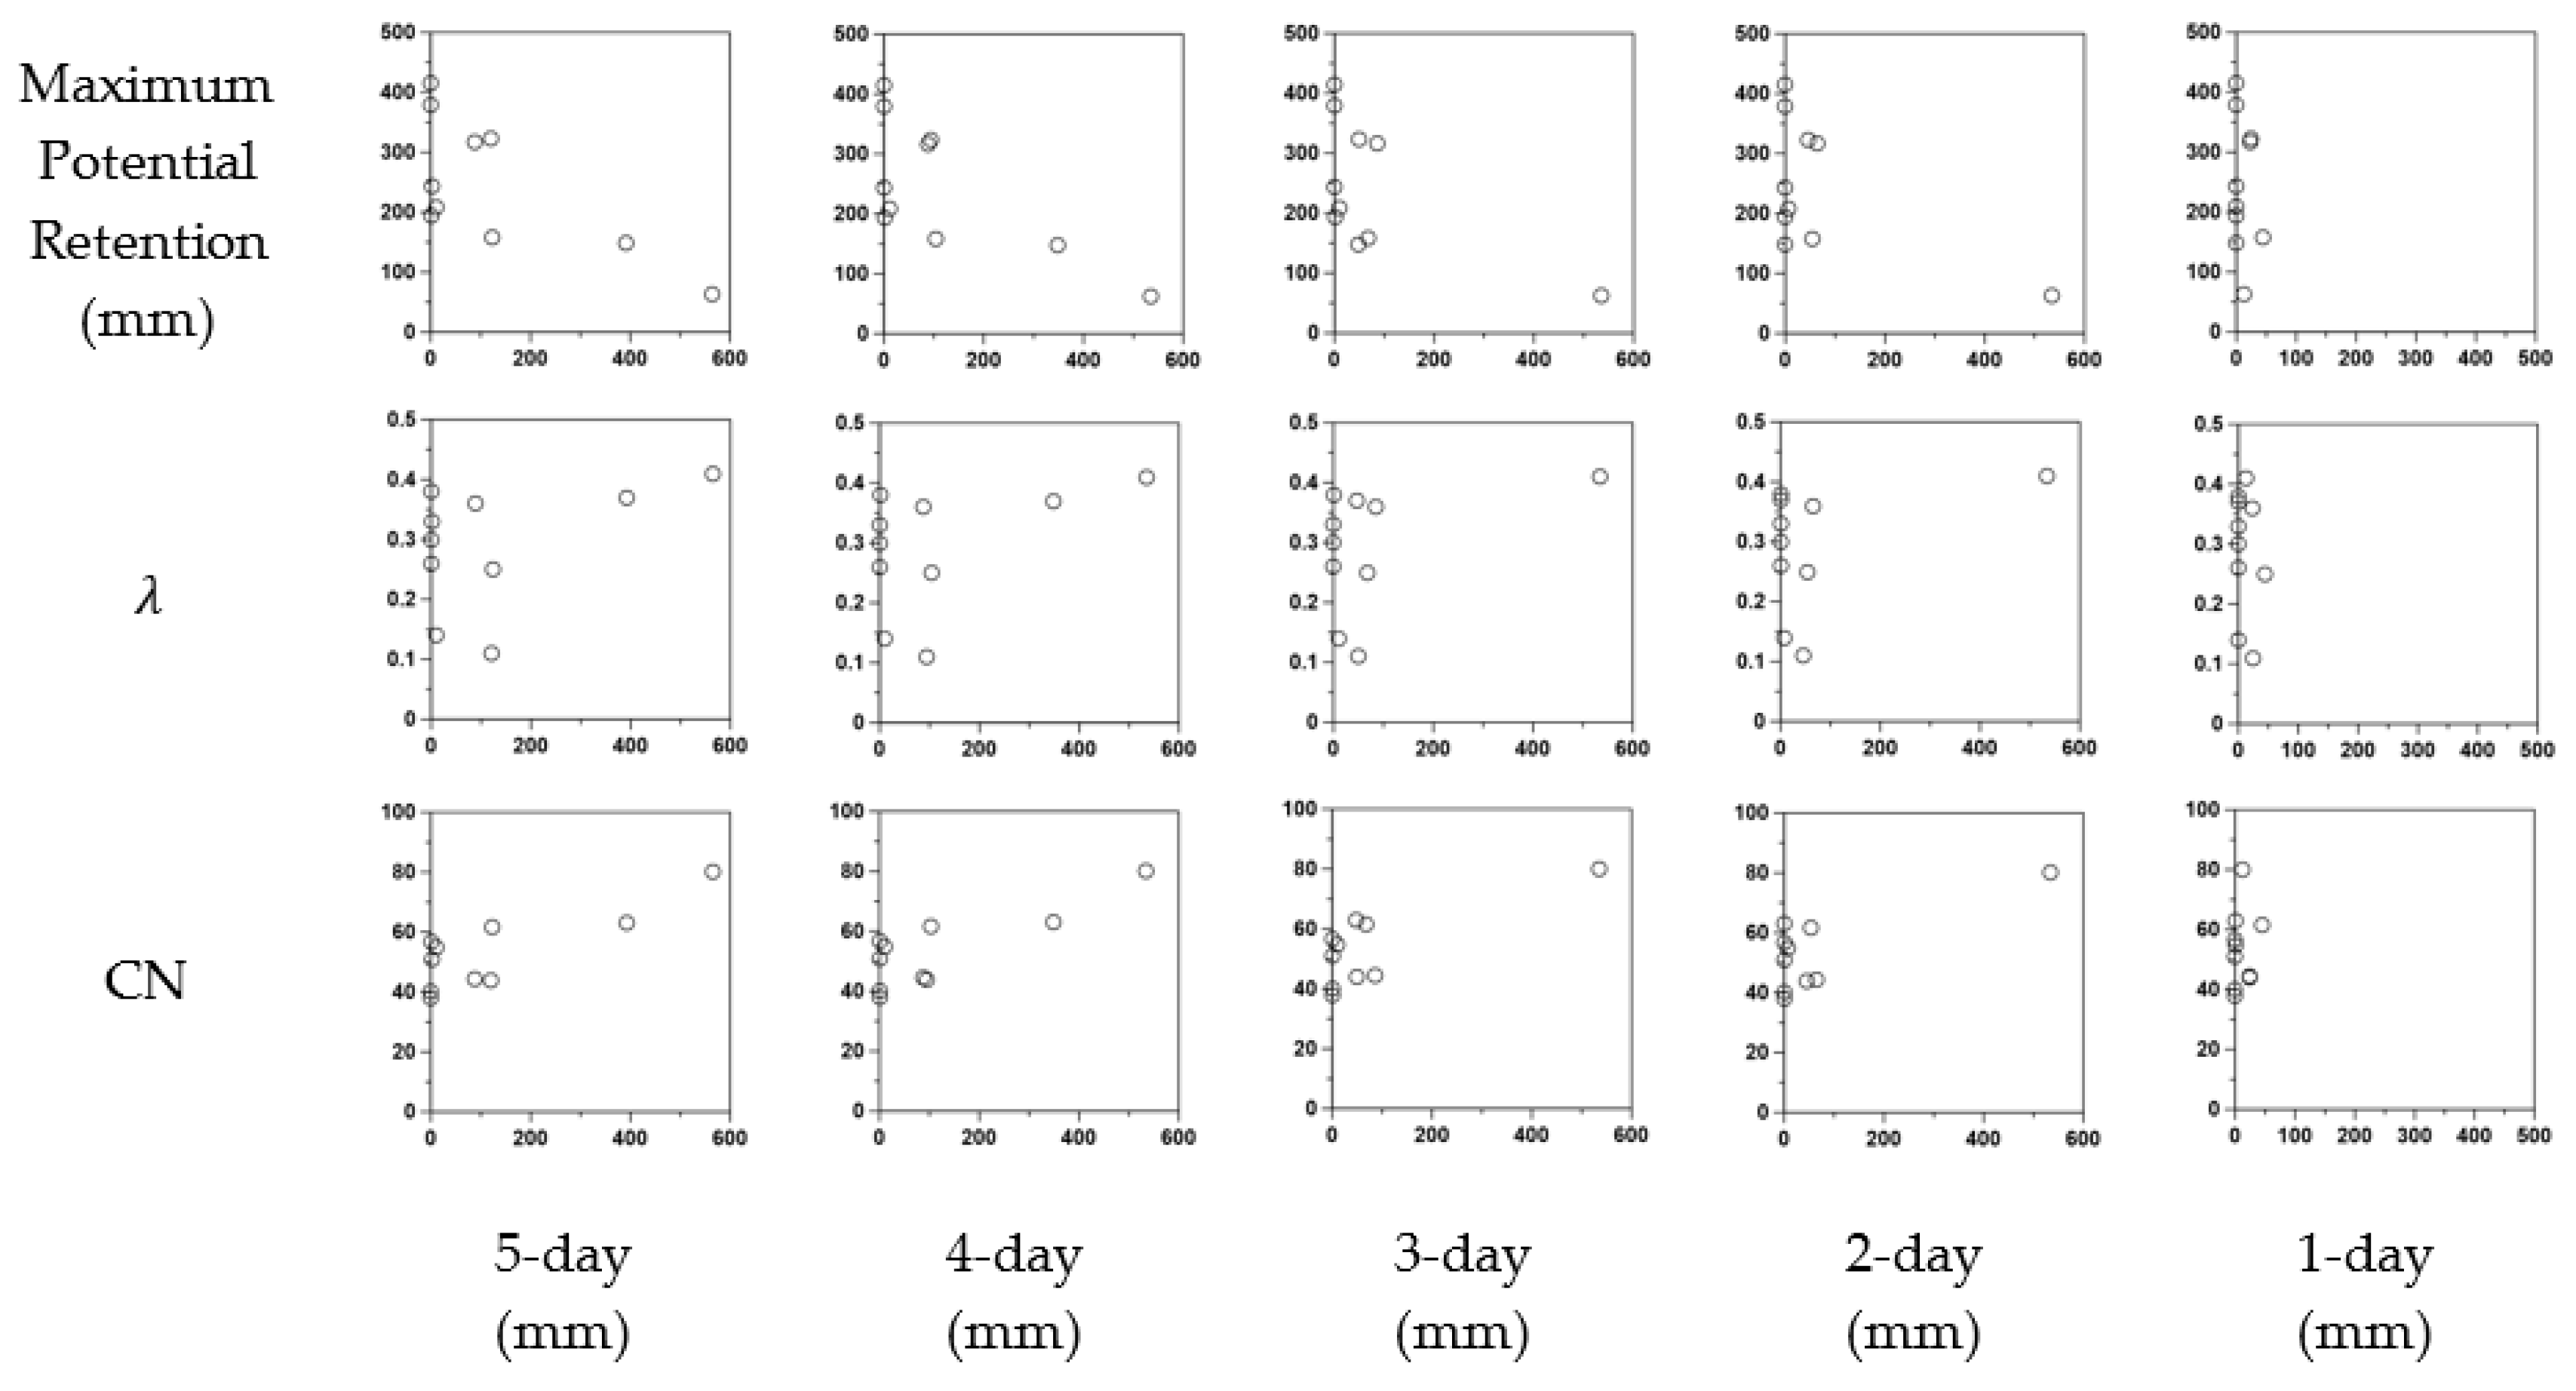
Figure 8 shows the behavior of these three variables, i.e., the maximum potential retention, ratio , and CN with respect to the antecedent precipitation amount. As can be seen in this figure, the effect of the antecedent precipitation amount becomes clear if the number of days is four or five. In fact, this result is disappointing, as the authors expected a much shorter period, as the Hancheon basin lies in a basalt region. The difference between four or five days was also not clear. The antecedent five-day rainfall amount for the AMC-III condition was found to be higher than 400 mm; on the other hand, that for the AMC-I condition must be less than 100 mm. In fact, this condition for the AMC is far different from that applied to the inland area of mainland Korea. During the growing season in Korea, the antecedent five-day rainfall amount for the AMC-III condition is just 53 mm, while that for the AMC-I condition is 36 mm. Even though the AMC condition for Jeju Island was roughly estimated with a limited number of rainfall events, it was believed to consider adequately the soil characteristics of Jeju Island.
The effect of AMC can be found when considering the antecedent four- or five-day precipitation amount. As mentioned earlier, it was not possible to distinguish these two cases, due to the limited number of rainfall events considered in this study. First of all, an inverse proportional relationship could be found between the AMC and the maximum potential retention. On the other hand, a clear linear proportional relation was found between the AMC and ratio , and between the AMC and CN. The maximum potential retention was found to vary from a maximum 300 mm to a minimum 100 mm, which might correspond to the AMC-I and AMC-III conditions, respectively. Under the AMC-II condition, the maximum potential retention might be around 200 mm. The ratio was found to vary in the range of 0.2 to 0.4, which might also correspond to the AMC-III and AMC-I conditions, respectively. Their mean value 0.3 might correspond to the AMC-II condition. Lastly, the CN for the AMC-I condition might be 45, and that for the AMC-III condition might be around 80. The CN for the AMC-II condition might be around 65. That is, the CN(I) is near the minimum value of estimated CN values and the CN(III) is near the maximum value. Finally, the CN(II) is the mean value determined for the range of antecedent five-day rainfall amounts between 100 mm and 400 mm. In fact, these CN values under different AMC conditions match well with those given by the SCS–CN method. That is, if the CN value is 65 under the AMC-II condition, the CN(I) and CN(III) become 43.8 and 81.0, respectively [6].
4.3. Classification Rules for Hydrological Soil Group
The hydrological soil group is a key factor in the determination of CN. In general, four different hydrological soil groups are used to represent the infiltration capacity of a soil, where Group A represents the highest infiltration capacity, and Group D the lowest. Groups B and C are in between the two [6]. The hydrological soil group is determined using the reconnaissance soil map or detailed soil map. Various characteristics of the soil provided by these soil maps are used to classify the soil into those four hydrologic soil groups. However, how to consider these soil characteristics to classify the soil or soil series into four different hydrological soil groups is dependent upon the classification rule. That is, the classification rule is not unique, and thus there can be many different classification rules for this same purpose. In Korea, a total of five classification rules are available, among which one is based on the reconnaissance soil map, while the remaining four are based on the detailed soil map.
The classification rule using the reconnaissance soil map is the same as that of the SCS [6]. The reconnaissance soil map provides rather brief information about the soil, among which the main characteristic considered for the determination of the hydrologic soil group is permeability. Permeability is the soil characteristic that controls both the infiltration and drainage capacity.
The four classification rules using the detailed soil map are given by Hu and Jung [55], Jung et al. [56], the Rural Development Administration (RDA) [10], and Lee et al. [57]. First, the classification rule by Hu and Jung [55] considers both the classification rule of the SCS and that in the Soil Survey Manual of the US Department of Agriculture. By considering the soil characteristics, such as infiltration capacity, drainage capacity, permeability, and soil texture in the soil series of the detailed soil map, they could classify these into four hydrologic soil groups.
Jung et al. [56] complemented the classification rule by Hu and Jung [55] and proposed a new system. The most important change of the new system is that it is based on a points system. As a result, the system could exclude subjective judgement, to make the classification result more consistent. Additionally, the authors introduced a new factor of ‘impervious layer’ to consider the shallow soil depth in Korea. Permeability was also excluded, as it has a similar characteristic to the drainage capacity. As a result, a total of four soil characteristics are evaluated separately by points from 1 to 4. The point of each soil characteristic is then added to derive the total score. If the total score is higher than or equal to 13, the soil series is classified as Group A. On the other hand, if the total point is less than or equal to 7, the soil series is classified as Group D.
RDA [10] additionally complemented the previous studies by considering the in situ experimental results of infiltration and permeability. The in situ experiment was carried out for 58 soil series, which includes 16 forest soils, 17 paddy soils, and 25 farmland and upland soils. Based on these in situ experiment results, the soil series were reclassified to have similar infiltration and permeability characteristics. Additionally, to consider the shallow soil depth in Korea, soil over the impervious layer was classified into Group D, and soil on the limestone into Group C.
Finally, Lee et al. [57] proposed a new method to consider the revised information of the soil series. The revision of the soil series has been carried out by the RDA continuously since 2007 but has not been considered so far in the classification of the hydrologic soil group. In fact, the new classification rule by Lee et al. [57] is basically the same as that by Jung et al. [56] but considered the revision result of the soil series during the last 10 years.
In this study, all five different classification rules were applied to the Hancheon basin to estimate CN. The result shows that the CN using the reconnaissance soil map is 70. Also, the CN as defined by Hu and Jung [55] is 78, that by Jung et al. [56] is 70, that based on the RDA [10] is 77, and that by Lee et al. [57] is 68. As the estimated CN with the observed rainfall–runoff data was around 65, the classification rule by Lee et al. [57] can be assumed to be close to the observed. There has been large variation in the estimated CN depending on the classification rule, so it is just as well that the most recent is closer to the observed.
5. Conclusions
This study investigated three issues in the application of the SCS–CN method to a basin on the volcanic Jeju Island, Korea. The first issue was the possible relation between the initial abstraction, and the maximum potential retention. Determining a proper value for the maximum potential retention was another important issue, which was also closely related to the estimation of CN. The classification rule of the hydrological soil group of soil or soil series was related to this issue. The effects of the AMC on the initial abstraction, maximum potential retention, and CN were the last issues of interest in this study. All of these issues were dealt with based on the analysis of several rainfall events observed in the Hancheon basin, a typical basin on Jeju Island. The results are summarized as follows.
First, estimates of initial abstraction, ratio , maximum potential retention, and CN were all found to be consistent with the SCS–CN model structure. That is, CN and the maximum potential retention showed a strong negative correlation, and the ratio and the maximum potential retention also showed rather weak negative correlation. On the other hand, a significant positive correlation was found between CN and the ratio , which was mainly due to the negative correlations between CN and the maximum potential retention and between the ratio and the maximum potential retention. As the multiplication of the maximum potential retention and the ratio becomes the initial abstraction, no clear relation could be found between the initial abstraction and CN. The same also applied between the total precipitation and CN, and between the runoff ratio and CN.
Second, the effect of the antecedent precipitation amount was found to be clear if the number of days is four or five. The difference between four and five days was also not clear. The antecedent five-day rainfall amount for the AMC-III condition was found to be higher than 400 mm; on the other hand, that for the AMC-I condition must be less than 100 mm. Even though the AMC condition for Jeju Island was roughly estimated with a limited number of rainfall events, it was believed to consider properly the soil characteristics of Jeju Island. In fact, this condition for the AMC is far different from that applied to the inland area of mainland Korea. During the growing season in Korea, the antecedent five-day rainfall amount for the AMC-III condition is just 53 mm, while that for the AMC-I condition is 36 mm.
Third, an inverse proportional relationship could be found between the AMC and maximum potential retention. On the other hand, a clear linear proportional relation was found between the AMC and ratio , and another between the AMC and CN. The maximum potential retention was found to be around 200 mm under the AMC-II condition, and the ratio was found to be around 0.3. Also, the CN for the AMC-II condition might be around 65. Additionally, among the five classification rules available in Korea, the classification rule proposed by Lee et al. [57] was found to provide the closest CN to the observed. This result is especially meaningful, as the classification rule proposed by Lee et al. [57] is the most recent. In fact, there have been large overestimations of the CN by up to 78.
In fact, these results derived in the Hancheon basin are all surprising. Especially, the size of the initial abstraction was found to be much higher in the Hancheon basin than for others in the inland area of the Korean Peninsula. The size of the maximum potential retention was also found to be larger, and the ratio was also higher, 0.3 rather than 0.2 in the inland area. The role of AMC was also very different. Due to the different soil characteristics of the volcanic Jeju Island, an extremely high antecedent 5-day precipitation amount was found to be valid for defining the AMC-III condition. Interestingly, some of these results were also mentioned in Leta et al. [15]. However, any comment about the AMC could not be found.
Finally, it should be mentioned that the above results were derived by analyzing a limited number of rainfall events. The analysis was also limited to just one basin, even though the authors assumed this basin to be representative of the other river basins on Jeju Island. Despite the practical limitations, the authors are positive about the results derived in this study. With more rainfall events in various river basins in Jeju Island, the results could be consolidated further. This should be future work for the authors of this study.
Author Contributions
C.Y. conceived and designed the idea of this research and wrote the manuscript. M.K. collected the runoff data and rain gauge data and applied the SCS–CN method. All authors have read and agreed to the published version of the manuscript.
Funding
This work was supported by the National Research Foundation of Korea (NRF) grant funded by the Korea government (Ministry of Science and ICT, MSIT) (No. 2020R1A2C200871411).
Conflicts of Interest
The authors declare no conflict of interest.
References
- Kar, K.K.; Yang, S.K.; Lee, J.H. Assessing unit hydrograph parameters and peak runoff responses from storm rainfall events: A case study in Hancheon Basin of Jeju Island. JESI 2014, 24, 437–447. [Google Scholar] [CrossRef] [Green Version]
- Lau, L.S.; Mink, J.F. Hydrology of the Hawaiian Islands; University of Hawaii Press: Honolulu, HI, USA, 2006. [Google Scholar]
- Kim, C.G.; Kim, N.W. Evaluation and complementation of observed flow in the Hancheon watershed in Jeju Island using a physically-based watershed model. J. Korea Water Resour. Assoc. 2016, 49, 951–959. [Google Scholar]
- Jeju Special Self-Governing Province. Comprehensive Investigation of Hydrogeology and Groundwater Resources in Jeju Island (III); Jeju Special Self-Governing Province: Jeju, Korea, 2003.
- Jung, W.; Yang, S. Simulation on runoff of rivers in Jeju Island using SWAT model. JESI 2009, 18, 1045–1055. [Google Scholar]
- Soil Conservation Service (SCS). National Engineering Handbook—Section 4: Hydrology; SCS: Washington, DC, USA, 1972.
- Ministry of Environment (ME). Design Flood Estimation Tips; ME: Sejong, Korea, 2019.
- Jeju Special Self-Governing Province. Establishment of Jeju-Type River Master Plan and Development of River Facility Management Manual; Jeju Special Self-Governing Province: Jeju, Korea, 2013.
- Ha, K.; Park, W.; Moon, D. Estimation of direct runoff variation according to land use changes in Jeju Island. Econ. Environ. Geol. 2009, 42, 343–356. [Google Scholar]
- Rural Development Administration (RDA). Agro-Environment Research 2006; RDA: Jeonju, Korea, 2007; pp. 141–176.
- Jung, W. The Estimation of Parametric Runoff Characteristics and Flood Discharge Based on Riverine in-situ Measurements in Jeju Island. Ph.D. Thesis, Jeju National University, Jeju, Korea, 2013. [Google Scholar]
- Sharpley, A.N.; Williams, J.R. EPIC-Erosion/Productivity Impact Calculator: 1. Model Documentation; USDA: Washington, DC, USA, 1990.
- Jung, W.; Yang, S.; Kim, D. Flood discharge to decision of parameters in Han Stream watershed. JESI 2014, 23, 533–541. [Google Scholar] [CrossRef]
- Yang, S.; Kim, M.; Kang, B.; Kim, Y.; Kang, M. Estimation of flood discharge based on observation data considering the hydrological characteristics of the Han Stream basin in Jeju Island. JESI 2017, 26, 1321–1331. [Google Scholar] [CrossRef]
- Leta, O.T.; El-Kadi, A.I.; Dulai, H.; Ghazal, K.A. Assessment of climate change impacts on water balance components of Heeia watershed in Hawaii. J. Hydrol. Reg. Stud. 2016, 8, 182–197. [Google Scholar] [CrossRef] [Green Version]
- Alahmadi, F.; Rahman, N.A.; Yusop, Z. Hydrological modeling of ungauged arid volcanic environments at upper Bathan catchment, Madinah, Saudi Arabia. J. Teknol. 2016, 789, 9–14. [Google Scholar]
- Shehata, M.; Mizunaga, H. Flash flood risk assessment for Kyushu Island, Japan. Environ. Earth Sci. 2018, 77, 76. [Google Scholar] [CrossRef]
- Odongo, V.O.; Mulatu, D.W.; Muthoni, F.K.; van Oel, P.R.; Meins, F.M.; van der Tol, C.; Skidmore, A.K.; Groen, T.A.; Becht, R.; Onyando, J.O.; et al. Coupling socio-economic factors and eco-hydrological processes using a cascade-modeling approach. J. Hydrol. 2014, 518, 49–59. [Google Scholar] [CrossRef]
- Capra, L.; Coviello, V.; Borselli, L.; Márquez-Ramírez, V.H.; Arámbula-Mendoza, R. Hydrological control of large hurricane-induced lahars: Evidence from rainfall-runoff modeling, seismic and video monitoring. Nat. Hazards Earth Syst. Sci. 2018, 18, 781–794. [Google Scholar] [CrossRef] [Green Version]
- Woodward, D.E.; Hawkins, R.H.; Jiang, R.; Hjelmfelt, A.T., Jr.; Van Mullem, J.A.; Quan, Q.D. Runoff curve number method: Examination of the initial abstraction ratio. In Proceedings of the World Water & Environmental Resources Congress 2003, Philadelphia, PA, USA, 23–26 June 2003; pp. 1–10. [Google Scholar]
- Baltas, E.A.; Dervos, N.A.; Mimikow, M.A. Technical note: Determination of the SCS initial abstraction ratio in an experimental watershed in Greece. Hydrol. Earth Syst. Sci. 2007, 11, 1825–1829. [Google Scholar] [CrossRef] [Green Version]
- Beck, H.E.; de Jue, R.A.M.; Schellekens, J.; van Dijk, A.I.J.M.; Bruijnzeel, L.A. Improving curve number based strom runoff estimates using soil moisture proxies. IEEE J. Sel. Top. Appl. Earth Obs. Remote Sens. 2009, 2, 250–259. [Google Scholar] [CrossRef]
- Shi, Z.H.; Chen, L.D.; Fang, N.F.; Qin, D.F.; Cai, C.F. Research on the SCS-CN initial abstraction ratio using rainfall-runoff event analysis in the Three Gorges Area, China. Catena 2009, 77, 1–7. [Google Scholar] [CrossRef]
- Yuan, Y.; Nie, W.; McCutcheon, S.C.; Taguas, E.V. Initial abstraction and curve numbers for semiarid watersheds in Southeastern Arizona. Hydrol. Process. 2014, 28, 774–783. [Google Scholar] [CrossRef]
- Ponce, V.M.; Hawkins, R.H. Runoff curve number: Has it reached maturity? J. Hydrol. Eng. 1996, 1, 11–19. [Google Scholar] [CrossRef]
- Babu, P.S.; Mishra, S.K. Improved SCS-CN–inspired model. J. Hydrol. Eng. 2012, 17, 1164–1172. [Google Scholar] [CrossRef]
- Hjelmfelt, A.T.; Kramer, K.A.; Burwell, R.E. Curve numbers as random variables. In Proceedings of the International Symposium on Rainfall-Runoff Modeling; Water Resources Publishing: Littleton, CO, USA, 1982; pp. 365–373. [Google Scholar]
- Sorooshian, S.; Duan, Q.; Gupta, V.K. Calibration of rainfall-runoff models: Application of global optimization to the Sacramento Soil Moisture Accounting Model. Water Resour. Res. 1993, 29, 1185–1194. [Google Scholar] [CrossRef]
- Yuan, Y.; Mitchell, J.K.; Hirschi, M.C.; Cooke, R.A. Modified SCS curve number method for predicting subsurface drainage flow. Trans. ASABE 2001, 44, 1673–1682. [Google Scholar] [CrossRef]
- Hawkins, R.H.; Ward, T.J.; Woodward, D.E.; Van Mullem, J.A. Curve Number Hydrology: State of the Practice; ASCE: Reston, VA, USA, 2008. [Google Scholar]
- Mishra, S.K.; Singh, V.P. Soil Conservation Service Curve Number (SCS-CN) Methodology; Springer: Berlin, Germany, 2003. [Google Scholar]
- Williams, J.R.; LaSeur, W.V. Water yield model using SCS curve numbers. J. Hydr. Eng. Div. 1976, 102, 1241–1253. [Google Scholar]
- Hawkins, R.H. Runoff curve numbers with varying site moisture. J. Irrig. Drain. Div. 1978, 104, 389–398. [Google Scholar]
- Soni, B.; Mishra, G.C. Soil Water Accounting Using SCS Hydrological Soil Classification; National Institute of Hydrology: Roorkee, India, 1985.
- Mishra, S.K.; Goel, N.K.; Seth, S.M.; Srivastava, D.K. An SCS-CN-based long-term daily flow simulation model for a hilly catchment. In Proceedings of the International Symposium Hydrology of Ungauged Streams in Hilly Regions for Small Hydro Power Development, New Delhi, India, 9–10 March 1998; pp. 9–10. [Google Scholar]
- Chen, C.L. An evaluation of the mathematics and physical significance of the soil conservation service curve number procedure for estimating runoff volume. In Proceedings of the International Symposium on Rainfall-Runoff Modeling, Mississippi State, MS, USA, 18–21 May 1982; pp. 387–418. [Google Scholar]
- Rallison, R.E.; Miller, N. Past, present, and future SCS runoff procedure. In Rainfall-Runoff Relationship; International Symposium on Rainfall-Runoff Modeling: Littleton, CO, USA, 1982; pp. 353–364. [Google Scholar]
- Park, C.H.; Yoo, C.; Kim, J.H. Sensitivity analysis of runoff curve number to the rainfall conditions. J. Korea Soc. Civ. Eng. B. 2005, 25, 501–508. [Google Scholar]
- Yoo, C.; Park, C.H.; Kim, J.H. Revised AMC for the application of SCS method: 2. Revised AMC. J. Korea Water Resour. Assoc. 2005, 38, 963–972. [Google Scholar] [CrossRef]
- Hawkins, R.H. Asymptotic determination of runoff curve numbers from data. J. Irrig. Drain. Eng. 1993, 119, 334–345. [Google Scholar] [CrossRef]
- Rezaei-Sadr, H. Influence of coarse soils with high hydraulic conductivity on the applicability of the SCS-CN method. Hydrol. Sci. J. 2017, 62, 843–848. [Google Scholar] [CrossRef]
- Santikari, V.P.; Murdoch, L.C. Including effects of watershed heterogeneity in the curve number method using variable initial abstraction. Hydrol. Earth Syst. Sci. 2018, 22, 4725–4743. [Google Scholar] [CrossRef] [Green Version]
- Soulis, K.X. Estimation of SCS curve number variation following forest fires. Hydrol. Sci. J. 2018, 63, 1332–1346. [Google Scholar] [CrossRef]
- Soulis, K.X.; Valiantzas, J.D. SCS-CN parameter determination using rainfall-runoff data in heterogeneous watersheds-the two-CN system approach. Hydrol. Earth Syst. Sci. 2012, 16, 1001–1015. [Google Scholar] [CrossRef] [Green Version]
- Soulis, K.X.; Valiantzas, J.D. Identification of the SCS-CN parameter spatial distribution using rainfall-runoff data in heterogeneous watersheds. Water Resour. Manag. 2013, 27, 1737–1749. [Google Scholar] [CrossRef]
- Bonta, J.V. Determination of watershed curve number using derived distribution. J. Irrig. Drain. Eng. 1997, 123, 28–36. [Google Scholar] [CrossRef]
- Ajmal, M.; Waseem, M.; Ahn, J.H.; Kim, T.W. Runoff estimation using the NRCS slope-adjusted curve number in mountainous watersheds. J. Irrig. Drain. Eng. 2016, 142, 04016002. [Google Scholar] [CrossRef]
- Yang, S.; Kim, D.; Jung, W. Rainfall-Runoff characteristics in a Jeju stream considering antecedent precipitation. JESI 2014, 23, 553–560. [Google Scholar]
- Jeju Special Self-Governing Province. Master Plan for Local Rivers Management in Jeju-si and Preparation of River Facility Management; Jeju Special Self-Governing Province: Jeju, Korea, 2018.
- Korea Meteorological Administration (KMA). 2012 Typhoon Analysis Report; KMA: Seoul, Korea, 2013. [Google Scholar]
- Costa, J.E.; Spicer, K.R.; Cheng, R.T.; Haeni, F.P.; Melcher, N.B.; Thurman, E.M.; Plant, W.J.; Keller, W.C. Measuring stream discharge by non-contact methods: A proof-of-concept experiment. Geophys. Res. Lett. 2000, 27, 553–556. [Google Scholar] [CrossRef]
- Hauet, A.; Kruger, A.; Krajewski, W.F.; Bradley, A.; Muste, M.; Creutin, J.D.; Wilson, M. Experimental system for real-time discharge estimation using an image-based method. J. Hydrol. Eng. 2008, 13, 105–110. [Google Scholar] [CrossRef]
- Le Coz, J.; Hauet, A.; Pierrefeu, G.; Dramais, G.; Camenen, B. Performance of image-based velocimetry (LSPIV) applied to flash-flood discharge measurements in Mediterranean rivers. J. Hydrol. 2010, 394, 42–52. [Google Scholar] [CrossRef] [Green Version]
- Kim, D.; Yang, S.; Jung, W. Error analysis for electromagnetic surface velocity and discharge measurement in rapid mountain stream flow. JESI 2014, 23, 543–552. [Google Scholar]
- Hu, K.S.; Jung, J.H. Hydrologic classification and its application of the Korean soil. J. Korean Soc. Agric. Eng. 1987, 4, 48–61. [Google Scholar]
- Jung, J.H.; Jang, S.P.; Kim, J.I.; Jung, Y.T.; Hu, K.S.; Park, H. Classification of hydrologic soil group to estimate runoff ratio. J. Korean Soc. Agric. Eng. 1995, 27, 12–23. [Google Scholar]
- Lee, Y.; Kang, M.; Park, C.; Yoo, C. Suggestion of classification rule of hydrological soil groups considering the results of the revision of soil series: A case study on Jeju Island. J. Korea Water Resour. Assoc. 2019, 52, 35–49. [Google Scholar]
Figure 1.
The procedure adopted in this study for estimating the parameters of the Soil Conservations Service–Curve Number (SCS–CN) method.
Figure 1.
The procedure adopted in this study for estimating the parameters of the Soil Conservations Service–Curve Number (SCS–CN) method.

Figure 2.
Location of the Hancheon basin in the Jeju Island, Korea (the empty circle represents the rain gauge and the solid circle the stage gauge at the exit of the basin).
Figure 2.
Location of the Hancheon basin in the Jeju Island, Korea (the empty circle represents the rain gauge and the solid circle the stage gauge at the exit of the basin).

Figure 3.
Picture of the Second Dongsan Bridge (a) and the relation curves of depth-area and depth-wetted perimeter (b).
Figure 3.
Picture of the Second Dongsan Bridge (a) and the relation curves of depth-area and depth-wetted perimeter (b).

Figure 4.
Temporal distribution of the areal-average rainfall over the Hancheon basin for the rainfall events considered in this study.
Figure 4.
Temporal distribution of the areal-average rainfall over the Hancheon basin for the rainfall events considered in this study.

Figure 5.
Determination of the initial abstraction in this study (rainfall event #3).

Figure 6.
Scatter plots among total rainfall, runoff ratio, initial abstraction, maximum potential retention, and curve number (CN).
Figure 6.
Scatter plots among total rainfall, runoff ratio, initial abstraction, maximum potential retention, and curve number (CN).

Figure 7.
Box-plots of (a) initial abstraction, (b) maximum potential retention, (c) , and (d) CN.

Figure 8.
Change of maximum potential retention, , and CN depending on the antecedent n-day rainfall amount.
Figure 8.
Change of maximum potential retention, , and CN depending on the antecedent n-day rainfall amount.


Table 1.
Basic characteristics of the rainfall events considered in this study (these statistics are all for areal average rainfall).
Table 1.
Basic characteristics of the rainfall events considered in this study (these statistics are all for areal average rainfall).
| Rainfall Event # | Time (Duration) | Total Rainfall (mm) | Maximum Intensity (mm/h) | Mean Intensity (mm/h) | Comments |
|---|---|---|---|---|---|
| 1 | 18 July 2012. 06:00–19 July 2012. 16:00 (34 h) | 200.0 | 38.4 | 5.9 | Typhoon Khanun |
| 2 | 23 August 2012. 02:00–25 August 2012. 03:00 (49 h) | 377.7 | 63.0 | 7.7 | Convective |
| 3 | 27 August 2012. 12:00–28 August 2012. 17:00 (29 h) | 535.0 | 76.8 | 18.4 | Typhoon Bolaven |
| 4 | 29 August 2012. 14:00–30 August 2012. 16:00 (26 h) | 113.0 | 49.2 | 4.0 | Typhoon Tembin |
| 5 | 15 September 2012. 19:00–17 September 2012. 23:00 (52 h) | 691.5 | 71.4 | 13.3 | Typhoon Sanba |
| 6 | 31 July 2014. 16:00–04 August 2014. 12:00 (92 h) | 400.0 | 70.8 | 4.4 | Typhoon Nakri |
| 7 | 22 August 2018. 13:00–24 August 2018. 05:00 (40 h) | 398.2 | 45.0 | 10.0 | Typhoon Soulik |
| 8 | 4 October 2018. 16:00–6 October 2018. 14:00 (46 h) | 480.0 | 50.4 | 10.5 | Typhoon Kong-rey |
| 9 | 6 September 2019. 00:00–7 September 2019. 16:00 (40 h) | 185.2 | 30.6 | 4.6 | Typhoon Lingling |
| 10 | 21 September 2019. 08:00–22 September 2019. 20:00 (36 h) | 594.5 | 39.0 | 16.4 | Typhoon Tapah |
Table 2.
Basic runoff characteristics of the rainfall events in Table 1.
Table 2.
Basic runoff characteristics of the rainfall events in Table 1.
| Rainfall Event# | Mean | Maximum | ||||
|---|---|---|---|---|---|---|
| Flow Velocity (m/s) | Depth (m) | Discharge (m3/s) | Flow Velocity (m/s) | Depth (m) | Discharge (m3/s) | |
| 1 | 2.39 | 0.82 | 98.70 | 4.90 | 2.73 | 187.43 |
| 2 | 2.85 | 0.92 | 55.42 | 7.24 | 2.72 | 203.33 |
| 3 | 2.89 | 1.34 | 133.79 | 7.07 | 4.18 | 422.71 |
| 4 | 2.23 | 0.56 | 53.53 | 5.87 | 2.66 | 134.48 |
| 5 | n/a | 1.43 | n/a | n/a | 4.52 | n/a |
| 6 | 2.29 | 0.92 | 50.11 | 4.65 | 2.48 | 230.28 |
| 7 | 3.22 | 0.94 | 89.88 | 7.23 | 2.74 | 289.52 |
| 8 | 4.19 | 0.88 | 99.57 | 7.34 | 2.53 | 304.20 |
| 9 | 2.07 | 0.79 | 39.51 | 7.25 | 1.80 | 106.88 |
| 10 | 3.28 | 1.10 | 87.13 | 7.31 | 2.46 | 188.75 |
Table 3.
Estimates of initial abstraction, maximum potential retention, and CN along with other basic information.
Table 3.
Estimates of initial abstraction, maximum potential retention, and CN along with other basic information.
| Rainfall Event# | Antecedent Five-Day Rainfall (mm) | Total Rainfall (mm) | Direct Runoff (mm) | Runoff Ratio | Initial Abstraction (mm) | Maximum Potential Retention (mm) | CN | |
|---|---|---|---|---|---|---|---|---|
| 1 | 123.8 | 200.0 | 81.0 | 0.41 | 39.2 | 158.4 | 0.25 | 61.6 |
| 2 | 88.4 | 377.7 | 119.1 | 0.32 | 114.9 | 317.1 | 0.36 | 44.5 |
| 3 | 392.2 | 535.0 | 367.2 | 0.69 | 54.5 | 148.3 | 0.37 | 63.1 |
| 4 | 564.8 | 113.0 | 50.5 | 0.45 | 25.9 | 63.0 | 0.41 | 80.1 |
| 5 | 10.7 | 691.5 | 502.6 | 0.73 | 29.8 | 208.8 | 0.14 | 54.9 |
| 6 | 2.2 | 400.0 | 182.1 | 0.46 | 79.5 | 243.6 | 0.33 | 51.0 |
| 7 | 1.0 | 398.2 | 203.7 | 0.51 | 72.9 | 194.2 | 0.38 | 56.7 |
| 8 | 0.0 | 480.0 | 180.7 | 0.38 | 112.6 | 379.6 | 0.30 | 40.1 |
| 9 | 120.5 | 185.0 | 47.1 | 0.25 | 36.0 | 323.4 | 0.11 | 44.0 |
| 10 | 0.0 | 594.5 | 263.2 | 0.44 | 107.1 | 415.2 | 0.26 | 38.0 |
Table 4.
Quartiles of initial abstraction, maximum potential retention, and CN.
| Initial Abstraction (mm) | Maximum Potential Retention (mm) | CN | ||
|---|---|---|---|---|
| Minimum | 25.9 | 63.0 | 0.11 | 38.0 |
| Frist Quartile | 36.0 | 158.4 | 0.25 | 44.0 |
| Median | 63.7 | 226.2 | 0.32 | 53.0 |
| Third Quartile | 107.1 | 323.4 | 0.37 | 61.6 |
| Maximum | 114.9 | 415.2 | 0.41 | 80.1 |
Table 5.
Antecedent n-day rainfall amount for each rainfall event considered in this study.
| Rainfall Event# | 5-day (mm) | 4-day (mm) | 3-day (mm) | 2-day (mm) | 1-day (mm) |
|---|---|---|---|---|---|
| 1 | 123.8 | 103.5 | 68.0 | 54.3 | 44.6 |
| 2 | 88.4 | 88.0 | 85.7 | 64.5 | 23.7 |
| 3 | 392.2 | 348.8 | 47.4 | 0.2 | 0.1 |
| 4 | 564.8 | 534.9 | 534.8 | 534.2 | 12.3 |
| 5 | 10.7 | 10.7 | 10.7 | 7.0 | 0.2 |
| 6 | 2.2 | 0.5 | 0.0 | 0.0 | 0.0 |
| 7 | 1.0 | 1.0 | 1.0 | 0.0 | 0.0 |
| 8 | 0.0 | 0.0 | 0.0 | 0.0 | 0.0 |
| 9 | 120.5 | 94.6 | 49.7 | 45.6 | 24.1 |
| 10 | 0.0 | 0.0 | 0.0 | 0.0 | 0.0 |
Publisher’s Note: MDPI stays neutral with regard to jurisdictional claims in published maps and institutional affiliations. |
© 2020 by the authors. Licensee MDPI, Basel, Switzerland. This article is an open access article distributed under the terms and conditions of the Creative Commons Attribution (CC BY) license (http://creativecommons.org/licenses/by/4.0/).
Share and Cite
MDPI and ACS Style
Kang, M.; Yoo, C. Application of the SCS–CN Method to the Hancheon Basin on the Volcanic Jeju Island, Korea. Water 2020, 12, 3350. https://doi.org/10.3390/w12123350
AMA Style
Kang M, Yoo C. Application of the SCS–CN Method to the Hancheon Basin on the Volcanic Jeju Island, Korea. Water. 2020; 12(12):3350. https://doi.org/10.3390/w12123350
Chicago/Turabian StyleKang, Minseok, and Chulsang Yoo. 2020. "Application of the SCS–CN Method to the Hancheon Basin on the Volcanic Jeju Island, Korea" Water 12, no. 12: 3350. https://doi.org/10.3390/w12123350
Note that from the first issue of 2016, this journal uses article numbers instead of page numbers. See further details here.