Historical and Projected Changes to the Stages and Other Characteristics of Severe Canadian Prairie Droughts


1
Watershed Hydrology and Ecology Research Division, Environment and Climate Change Canada, Saskatoon, SK S7N 3H5, Canada
2
Department of Environment and Geography, University of Manitoba, Winnipeg, MB R3T 2N2, Canada
3
Department of Geography and Planning, University of Saskatchewan and Saskatchewan Research Council, Saskatoon, SK S7K 1M2, Canada
*
Author to whom correspondence should be addressed.
Water 2020, 12(12), 3370; https://doi.org/10.3390/w12123370
Submission received: 26 October 2020
/
Revised: 24 November 2020
/
Accepted: 26 November 2020
/
Published: 1 December 2020
(This article belongs to the Special Issue Past and Future Trends and Variability in Hydro-Climatic Processes)
Abstract
:Large-area, long-duration droughts are among Canada’s costliest natural disasters. A particularly vulnerable region includes the Canadian Prairies where droughts have, and are projected to continue to have, major impacts. However, individual droughts often differ in their stages such as onset, growth, persistence, retreat, and duration. Using the Standardized Precipitation Evapotranspiration Index, this study assesses historical and projected future changes to the stages and other characteristics of severe drought occurrence across the agricultural region of the Canadian Prairies. Ten severe droughts occurred during the 1900–2014 period with each having unique temporal and spatial characteristics. Projected changes from 29 global climate models (GCMs) with three representative concentration pathways reveal an increase in severe drought occurrence, particularly toward the end of this century with a high emissions scenario. For the most part, the overall duration and intensity of future severe drought conditions is projected to increase mainly due to longer persistence stages, while growth and retreat stages are generally shorter. Considerable variability exists among individual GCM projections, including their ability to simulate observed severe drought characteristics. This study has increased understanding in potential future changes to a little studied aspect of droughts, namely, their stages and associated characteristics. This knowledge can aid in developing future adaptation strategies.
1. Introduction
Droughts are among the world’s most significant hazards, often affecting more people and are frequently more costly than any other form of natural disaster [1]. While many natural disasters have direct and immediate impacts, those from drought can also be indirect and spread over long durations and large areas, thus making any preparations or efficient response difficult. The environmental impacts from major drought episodes are varied but often include reduced water quality, wetland loss, soil erosion and degradation, and ecological habitat destruction. Economic effects include decreased agricultural production and hydro-electric power generation and increased freshwater transportation costs, e.g., [2,3,4]. Improved understanding of the features of drought is critical for the management of such impacts.
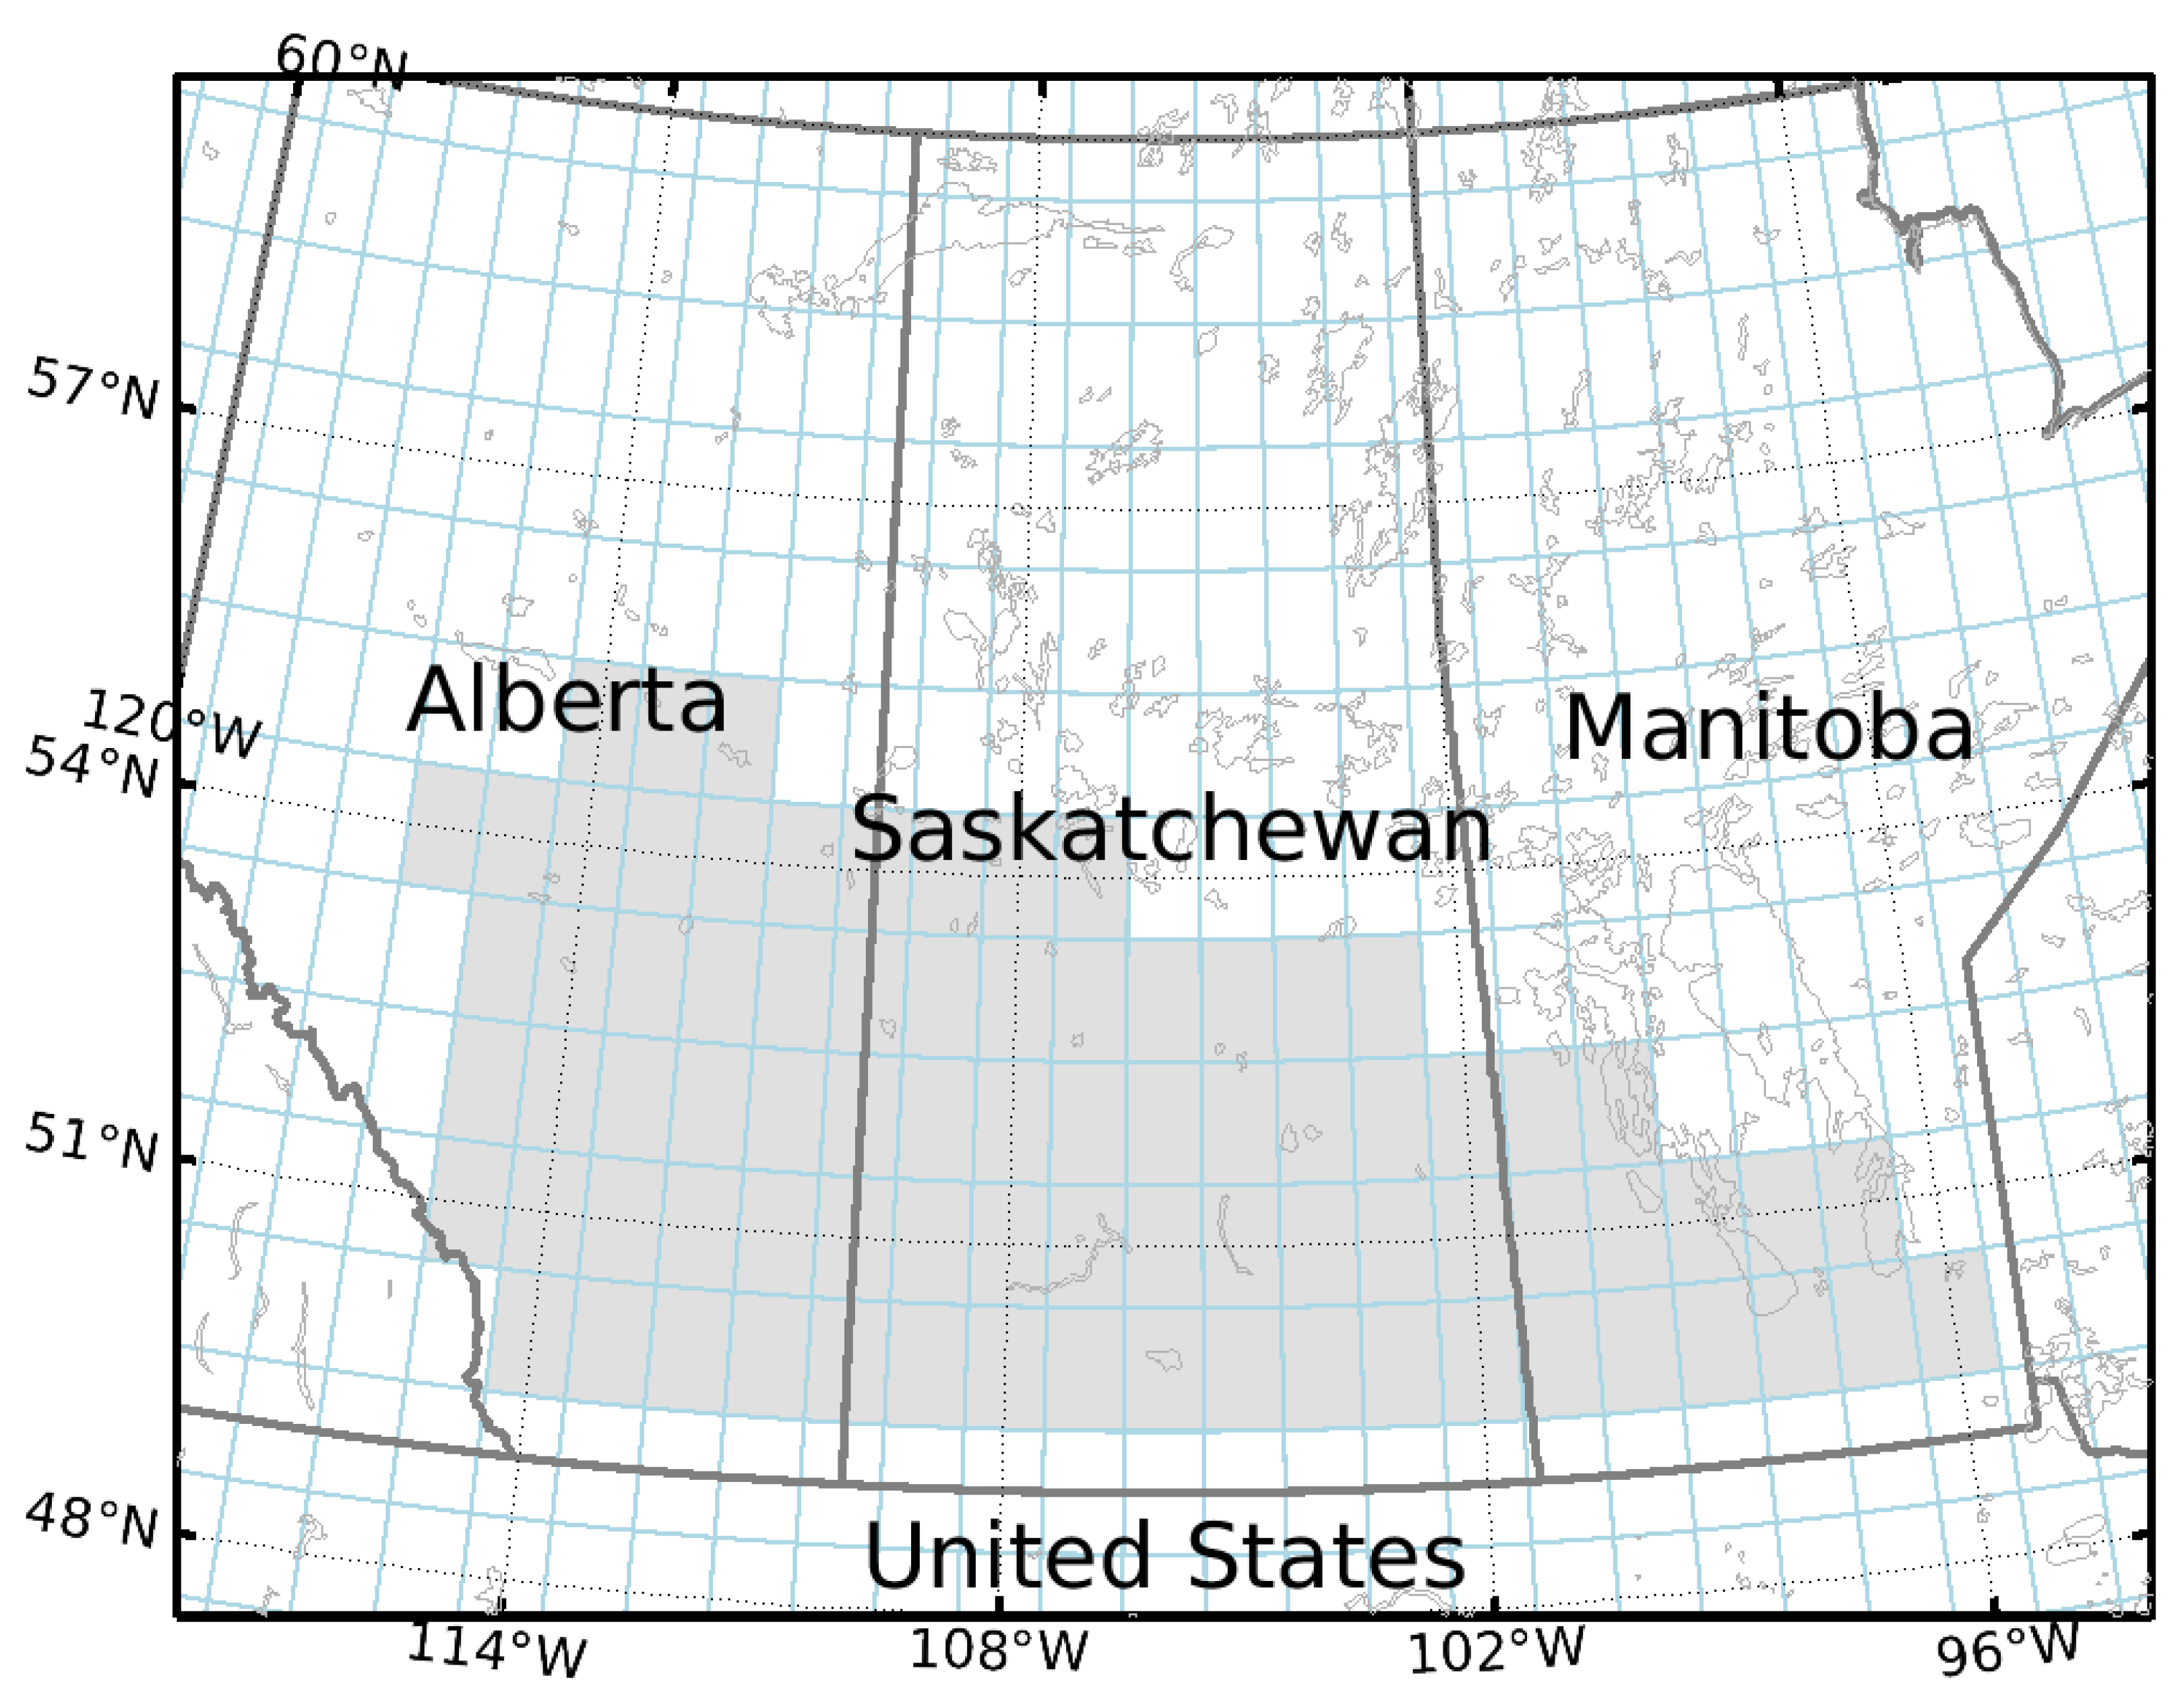
Although most areas of Canada periodically experience drought, the agricultural regions of the Canadian Prairies (Figure 1) are most susceptible mainly because of frequent drought occurrence and their economic dependence on agriculture, e.g., [5]. A variety of drought indicators at various temporal scales have identified large area, multi-year dry episodes across this region during the last century, e.g., [4,5,6,7]. Many studies have also used these indicators to examine projected future changes to Canadian Prairie droughts using a variety of climate models. For example, output from three global climate models (GCMs) incorporating high (A2), medium–high (A1B), and medium (B2) emission scenarios were used to project future (2011–2100) summer Palmer Drought Severity Index (PDSI) values for the southern Canadian Prairies. More persistent droughts were projected, particularly after 2040, and multi-year droughts lasting at least a decade were expected to become more probable [8]. Many studies also revealed considerable differences among individual climate model projections, e.g., [9,10,11]. Future annual and summer Standardized Precipitation Evapotranspiration Index (SPEI) changes over all western Canadian river basins were assessed with six GCMs for the periods 2041–2070 and 2071–2100 (relative to 1971–2000), using medium emission (representative concentration pathway (RCP) 4.5) and high emission (RCP 8.5) scenarios. Southern watersheds showed a gradual increase in annual water deficit throughout the 21st century, while the opposite was true for northern basins. For summer, however, all river basins except those in the extreme north are expected to experience decreasing water availability [12]. Canada-wide 21st century drought projections were assessed on seasonal to annual scales based on the SPEI using bias-corrected temperature and precipitation projections from 29 GCMs participating in the Coupled Model Inter-comparison Project Phase Five (CMIP5) with three different forcing scenarios (RCP 2.6, RCP 4.5 and RCP 8.5). Over the Prairies, results showed increased drying in summer and particularly, annual scales [13]. The drying was most pronounced at the end of this century under the higher emission scenarios. Using this same SPEI information, it was also pointed out that the tendency for drought is expected to accelerate mid-century [14].
All of these studies examined droughts on fixed scales with little or no attention to their temporal and spatial evolution. These features are important since individual droughts differ dramatically in terms of onset, growth, persistence, spatial extent, termination, duration, and severity; these characteristics directly affect their impacts and subsequently, potential adaptation measures. An earlier study attempted to address some of these aspects by devising and applying a new drought stages concept applied to severe historical droughts over the agricultural region of the Canadian Prairies. Using the PDSI and Standardized Precipitation Index (SPI) as drought indicators, they classified several severe droughts and found that each was unique in terms of onset, growth, persistence, spatial extent, and termination [15].
The objective of this investigation is to expand on [15] by using the SPEI and assessing historical and projected future changes to these drought stages and other characteristics using bias corrected temperature and precipitation outputs from the same 29 CMIP5 GCMs incorporated by [13]. Section 2 discusses the data and methodology used in this analysis while Section 3 assesses historical and modelled temporal and spatial aspects of Canadian Prairie droughts. Section 4 provides discussion and concluding remarks.
2. Materials and Methods
The study area is analogous to [15] and comprises the agricultural region of the Canadian Prairies (Figure 1). The topography of this area is a plain with relatively low relief and is not a main climatic factor. Data included those incorporated by [13] who used the SPEI as a drought index [16]. The formulation of SPEI is similar to SPI, but is based on the difference between precipitation and potential evapotranspiration (PET), rather than precipitation alone [16]. As such, SPEI represents a climatic water balance and should be interpreted as a relative measure of surface water deficit (negative values) or surplus (positive values) with respect to the hydro-climate of a specified reference period. Specifically, SPEI at a location gives the number of standard deviations from which the precipitation minus PET departs from mean values over the reference period. Various estimates of PET are available ranging from strictly temperature based approaches (e.g., Thornthwaite) to comprehensive methods that require extensive amounts of data including wind speed, solar radiation, relative humidity, and temperature (e.g., Penman–Monteith). For this study, PET was calculated using the modified Hargreaves method [17]. It has the advantage of only requiring monthly total precipitation and monthly mean minimum and maximum temperature as input, and has been shown to produce comparable results to those obtained using Penman–Monteith [13,17]. Historical SPEI (1900–2014) were determined using monthly gridded temperature and precipitation from the Canadian Gridded Dataset (CANGRD); a gridded climate dataset based on interpolated station data from the Adjusted and Homogenized Canadian Climate Data [18]. The reference period of 1950 to 2005 was used to standardize SPEI values (historical and modelled). Modelled SPEI were calculated using temperature and precipitation output from 29 CMIP5 GCMs, which are listed on the Canadian Climate Data and Scenarios website [19]. The SPEI were determined from bias-corrected temperature and precipitation. Specifically, a multivariate bias correction (MBC) algorithm that corrects marginal distributions and Pearson correlation dependence structure (MBCp) [20] were applied on all GCM temperature and precipitation data for the full time period of each simulation (1900–2100) (see [13] for specific details). In addition, a range of emission scenarios were used to understand the potential spread across possible future emission pathways. These pathways represent possible future atmospheric concentrations of greenhouse gases and aerosols based on plausible combinations of projected population growth, economic activity, energy intensity, and socio-economic development. Representative concentration pathways (RCPs [21]) are a set of emission scenarios that are used as input for CMIP5 projections. For this analysis, three RCPs were used that include low (RCP 2.6), intermediate (RCP 4.5), and high (RCP 8.5). SPEI were calculated for the 1900 to 2100 period for each GCM and RCP. Three GCM time periods were assessed: Historical (1900–2005), Near Future (2021–2060), and Far Future (2061–2100). Since model resolution varies, data from each of the 29 models (as well as the historical CANGRD) were re-gridded to a common 1° × 1° resolution. A total of 80 grids were chosen that approximate the agricultural region as defined by Statistics Canada [22] (Figure 1).
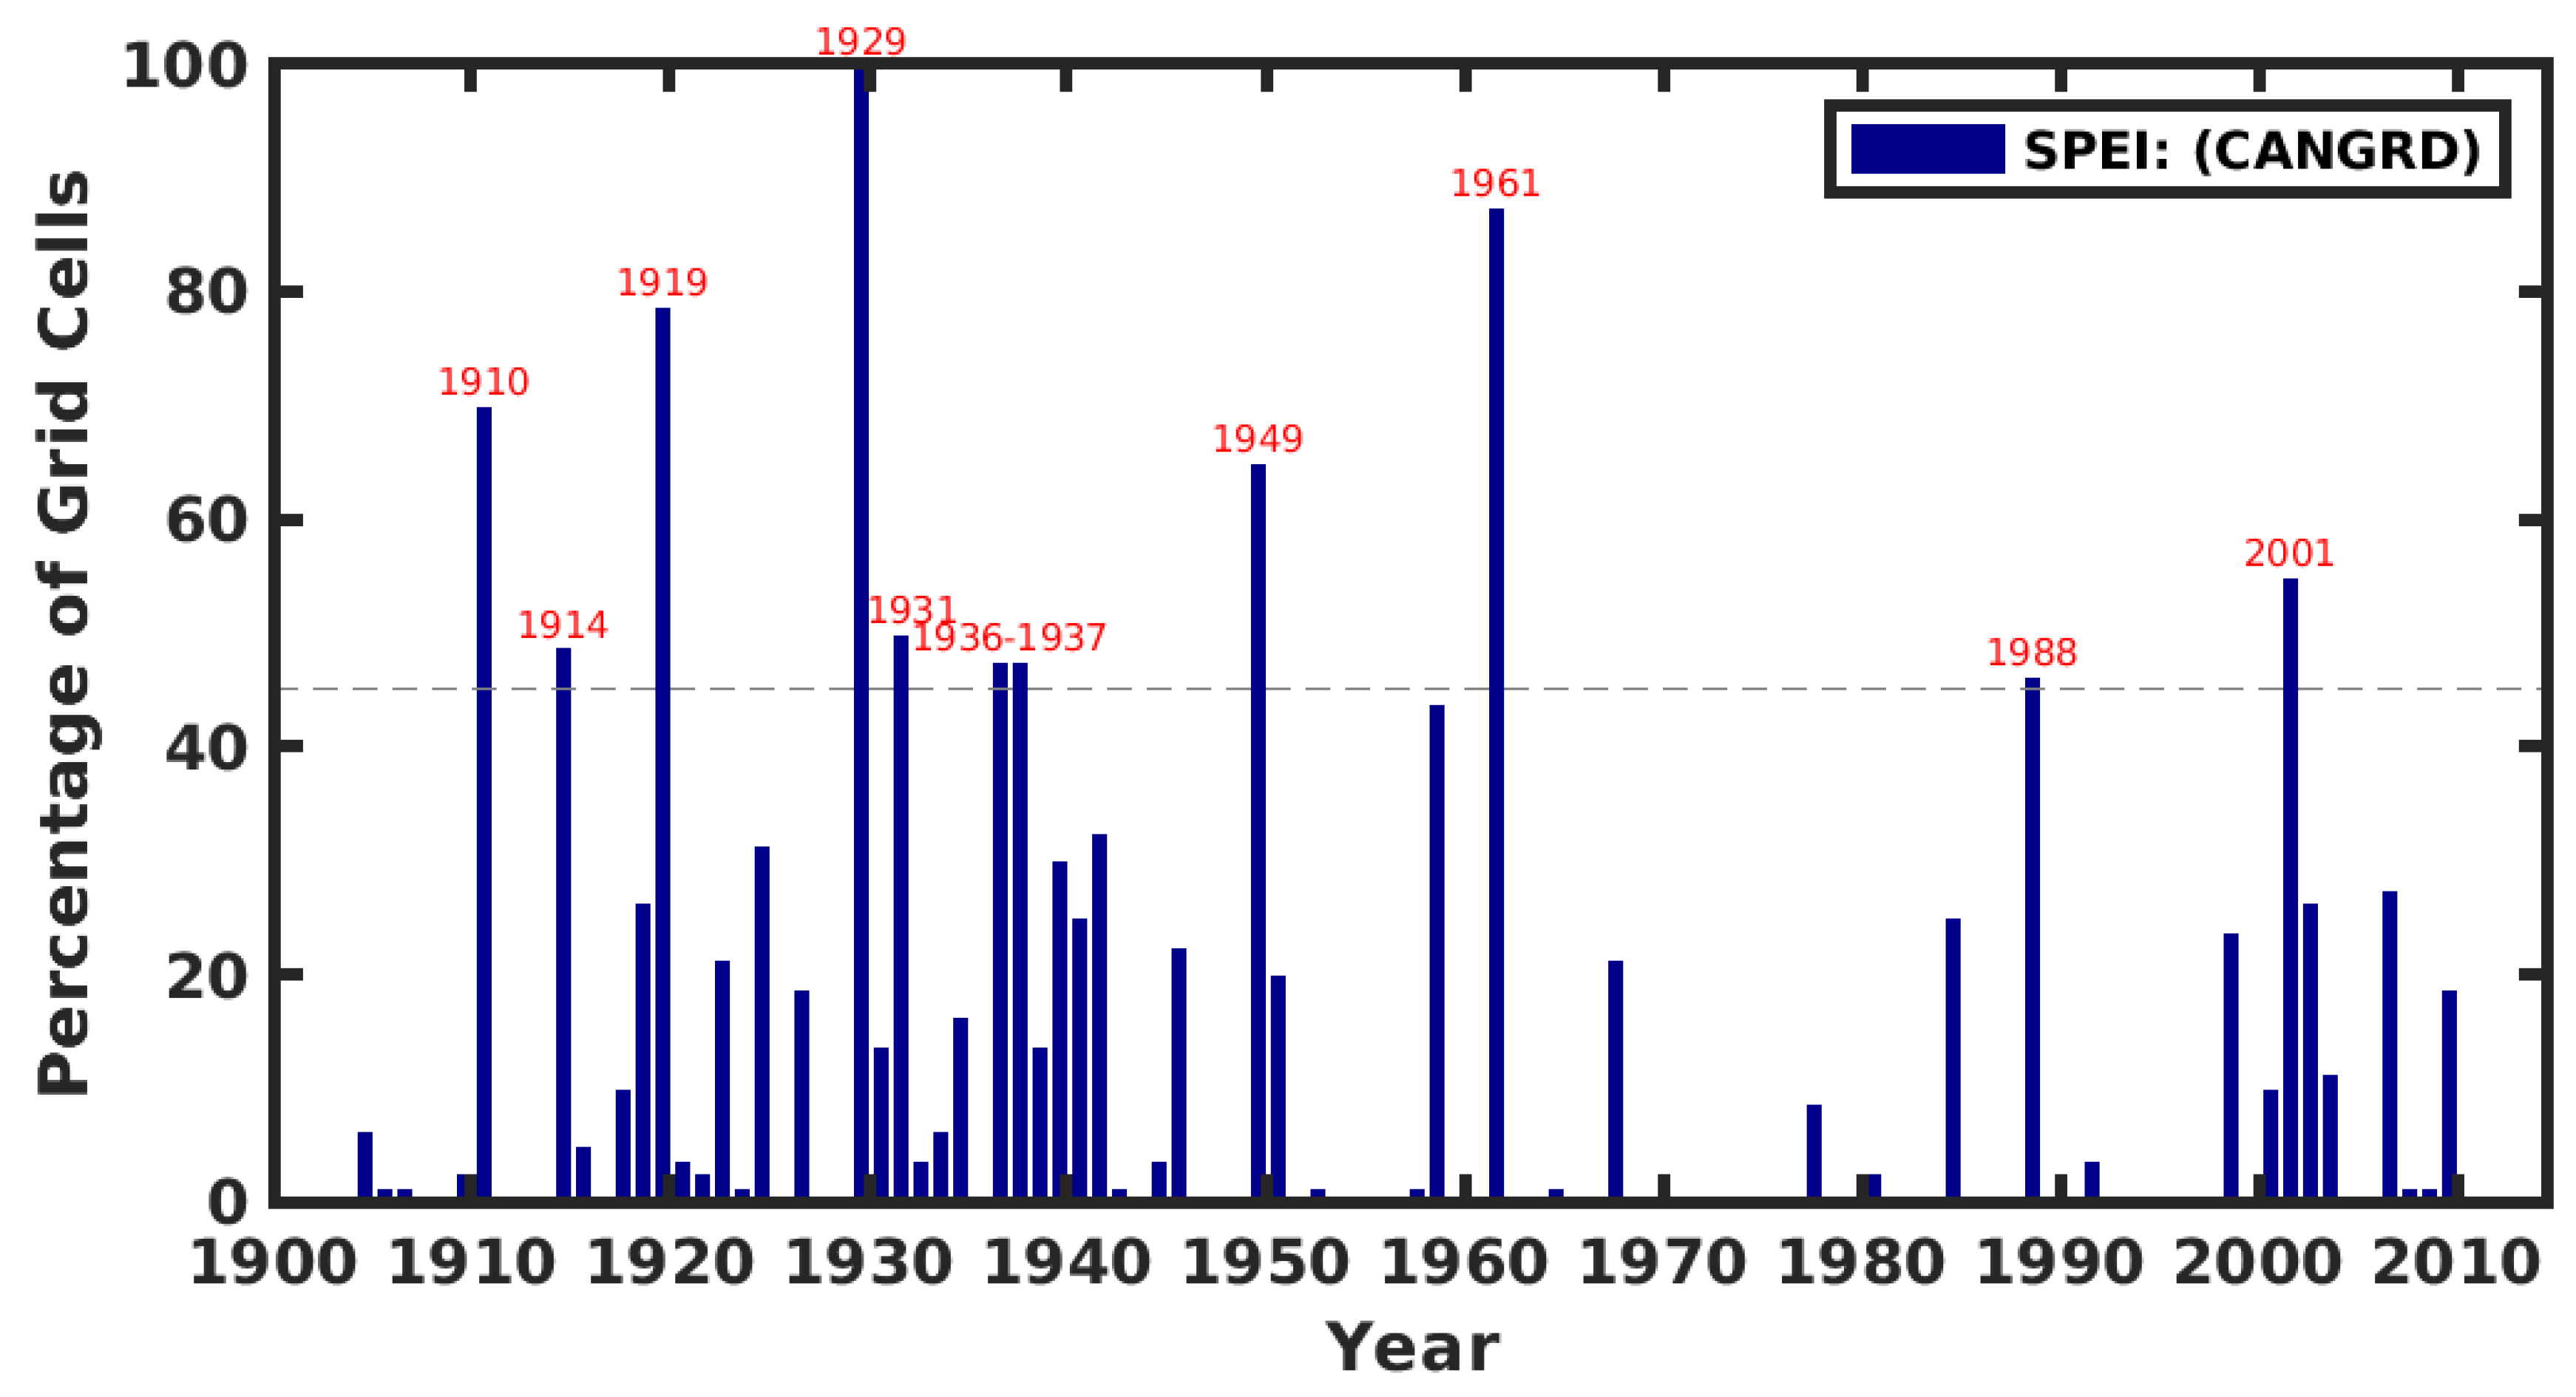
The first step in the analysis was to identify historical severe drought periods over the study area between 1900–2014 using CANGRD. The methodology was based on [15] who calculated the percentage of grid cells within the agricultural region of the Canadian Prairies in severe drought or worse (severe drought defined as SPI < −1.5) during the 12-month agricultural year (September through August). The agricultural year was used since it coincides with agricultural production in the study area, and because a large input of water is supplied by spring snow melt accumulated over the winter season. This 12-month interval, therefore, covers both water supply and demand periods. For this study, severe droughts were identified when 45% or more of the 80 grid cells within the study area were in severe drought or worse (defined as SPEI < −1.5 [16]) during the agricultural year. Note that higher and lower thresholds (including 50%) were examined, however, the 45% threshold was able to capture all of the well-known major Canadian Prairie droughts such as those in the 1930s and late 1980s without including more minor ones. This procedure was used to identify severe droughts using the 12-month agricultural SPEI. Each of these episodes were subsequently examined in greater detail, as described below.
The second step involved quantifying the stages and other characteristics of each of these identified severe droughts. The six drought stages (Table 1) included (1) Onset, (2) Growth, (3) Persistence, (4) Peak, (5) Retreat, and (6) Termination. The stages were based upon thresholds of the percentage of grid cells within the agricultural region of the Prairies that were encompassed by severe drought or worse (SPEI < −1.5). Note that the 10% and 50% thresholds in Table 1 were chosen by [15] from their examination of several spatial maps associated with the high-impact 1999–2005 Prairie drought. Based on this assessment, it was decided that the 10% criterion coincided with the drought’s onset and termination, while the 50% value was a critical threshold for categorizing the drought’s persistence.
Three other individual drought characteristics were also calculated including Duration (number of months when the area in severe drought was ≥10%), Severity (average SPEI value over the study area for the entire duration of the drought), and Intensity (duration multiplied by the severity) (Table 2). Finally, two ”summary” characteristics were determined for all identified droughts. These included a map of the average SPEI for all droughts during their entire duration, and the percentage of severe droughts with their peak value during the growing season of May to August. The former is used to assess the preferred spatial extent of all droughts while the latter was chosen since the greatest impacts are often associated with growing season droughts, e.g., [23] (i.e., when socio-economic and environmental freshwater demands are the greatest). Note, that if a given drought peaked multiple times, it was considered as peaking during the growing season if any of these peaks occurred from May to August. Quantification of all these stages and other characteristics was then carried out for each of the 29 GCMs for the historical, near future, and far future (2061–2100) periods for the three RCPs.
3. Results
3.1. Historical Observed Droughts
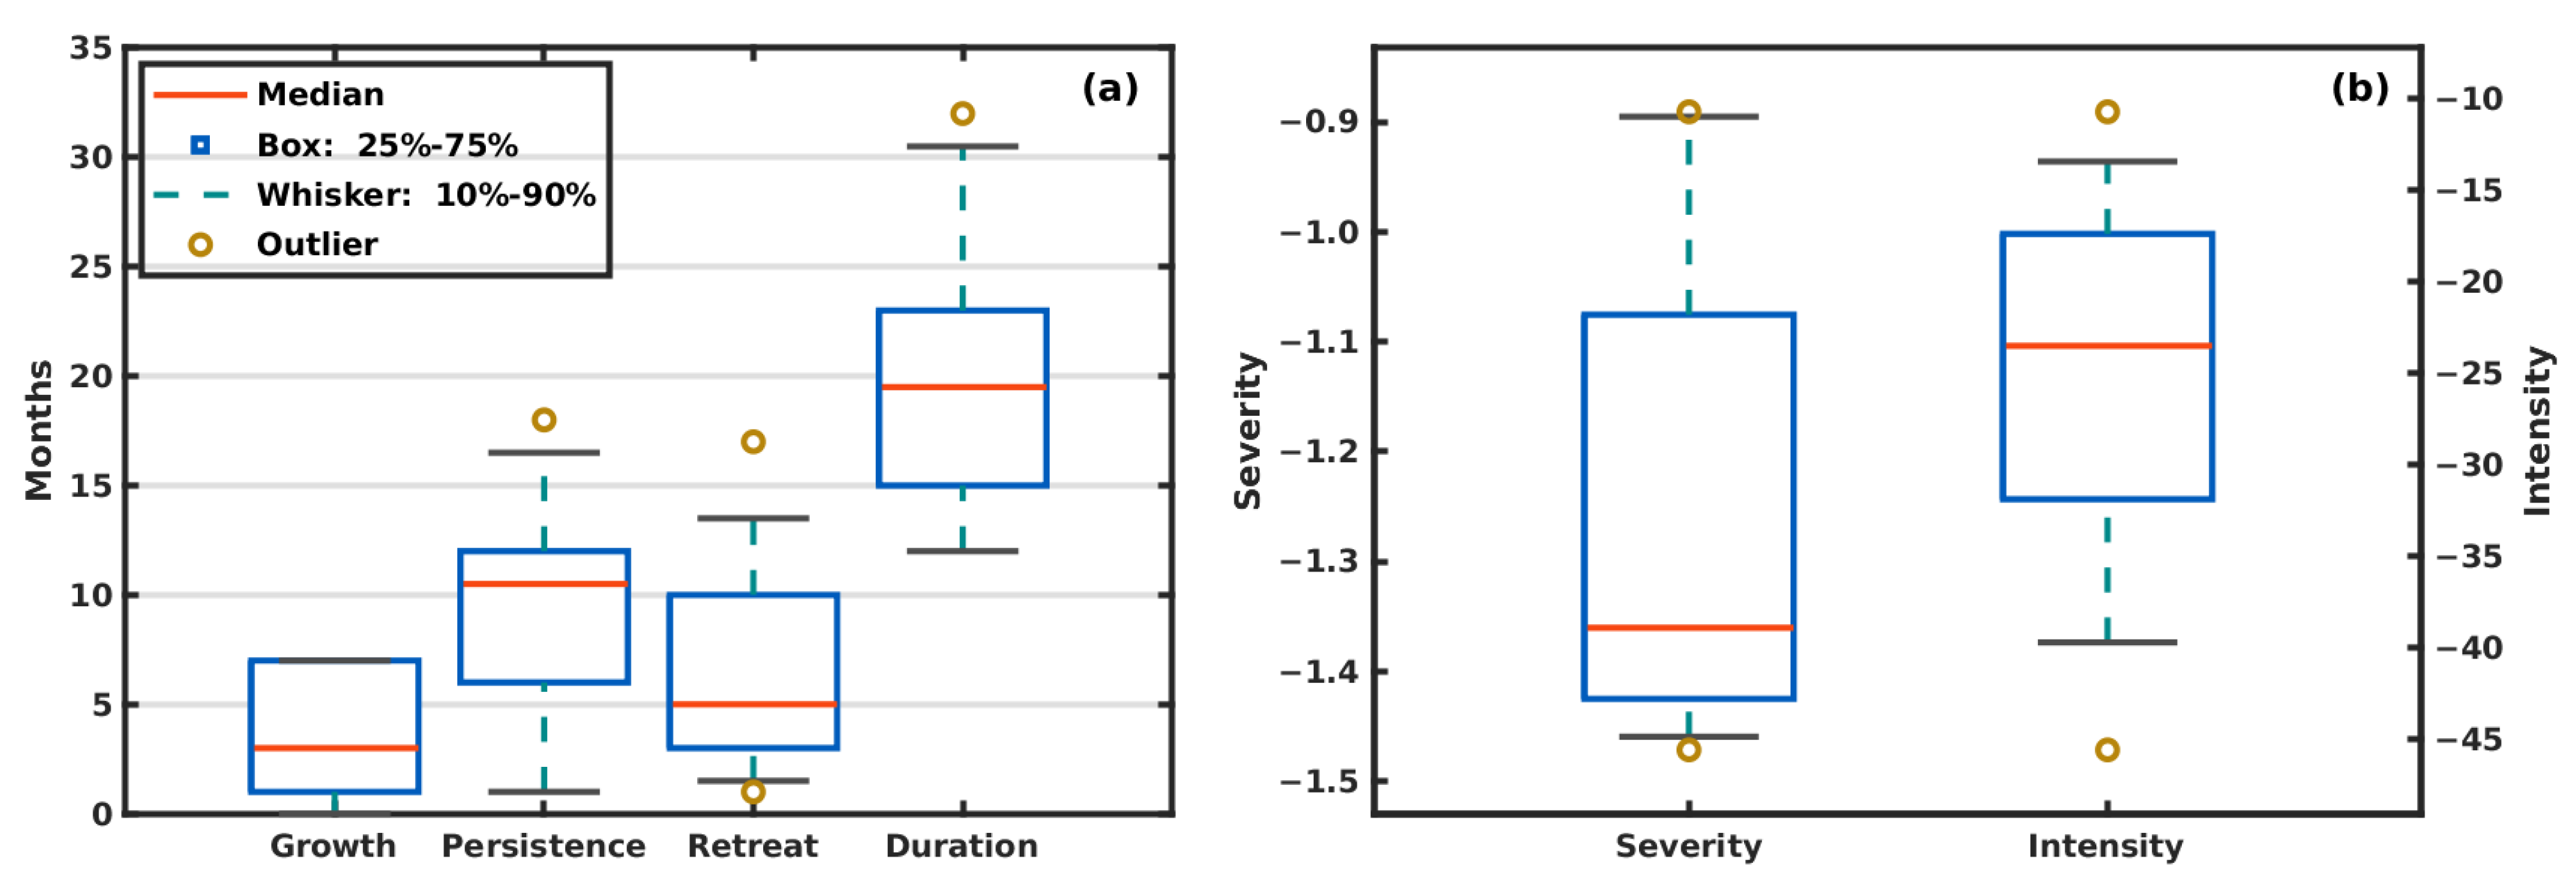
Using CANGRD, ten severe droughts were identified during the historical period (1900 to 2014) as they reached the 45% area criterion (Figure 2). Most of these droughts occurred in the first half of the period with seven of the ten occurring before 1958. The majority of these events have been recognized in other historical Canadian Prairie drought studies, e.g., [6,7,15,24]. Individual drought characteristics and summary statistics for these ten droughts are provided in Table 3 and Figure 3, respectively. In terms of stages (Table 1), growth ranges from zero months or no identifiable growth stage (1914–1915 and 2001–2003), to three events having a growth stage as long as seven months. A zero growth signifies that the drought jumped from the onset stage right into the persistence stage. These rapid or non-existent growth stages often signify “flash drought” conditions, e.g., [25,26] that may be particularly devastating as the warning and preparation time is greatly diminished, especially compared with the median growth length of three months.
Persistence relates to the period when severe drought (SPEI < −1.5) encompasses over 50% of the study area. It is an important indicator with respect to the prolonged existence of severe drought conditions and resultant impacts and adaptations. Once again, this stage varies dramatically among the droughts from only one month in 1914–1915 and 1988–1989 to 18 months in 1917–1920. Median persistence for all these droughts is 10.5 months. Within the persistence stage is the peak or maximum extent of severe drought conditions that is indicative of the spatial extent of the most severe conditions. Larger droughts tend to cause greater impacts and significant challenges for adaptation and result in increased vulnerabilities compared with smaller area droughts. These peaks range from a low of 49% in 1914–1915 and 51% in 1988–1989, to drought encompassing the entire study area in 1928–1930. This 100% coverage caused extreme impacts and led to the start of the “dirty thirties” across the Prairies, e.g., [27] with two more severe droughts identified during this decade. The median peak areal extent of these droughts is nearly 80%. The most common timing of peak areal extent occurs during the May to August growing season when nine of ten droughts peaked. June was the preferred month (3/10 events), which can be particularly devastating as this is the month when agricultural crops require the most water and, on average, has the highest precipitation, e.g., [23]. Only one drought (2001–2003) peaked outside the growing season.
Finally, the retreat stage signifies how long it takes conditions to return to normal. Retreat ranges from one month in 1960–1962 to 17 months in 1948–1951. Rapid retreats and ultimate termination of drought conditions are sometimes associated with severe precipitation events that can also have devastating impacts, e.g., [28]. The median retreat stage is five months.
The growth, persistence, and retreat combined provide the drought duration (Table 2), which is an important metric since longer events tend to cause greater losses as storage of water and other adaptive resources are depleted. The median duration of identified events is 19.5 months; however, they vary considerably. This includes several shorter-term events of 15 months or less (1910–1911, 1914–1915, 1931–1932, 1988–1989) and two extended droughts of 29 (1948–1951) and 32 (1917–1920) months. Note that the 1928–1930 and 1931–1932 droughts occurred in rapid succession (with a combined duration of 38 months) and thus, would have more severe impacts. However, since the percentage of grid cells in severe drought dropped below the 10% threshold, these were considered two separate events.
Drought severity and intensity (Table 2) also displayed key features. Drought severity is directly associated with impacts and these severities are mostly consistent ranging from −0.89 in 1914–15 to −1.47 in 1936–1938. Other high severity droughts (lower than the median value of −1.36) included those in 1910–1911, 1917–1920, 1928–1930, and 1960–1962. In this study, intensity was defined as a combination of duration and severity. The greatest value (by far) was associated with the 1917–1920 event, which had the longest duration and the third highest severity. The second and third most intense droughts were the events of 1936–1938 and 1928–1930, respectively, again emphasizing the 1930s as a severe drought decade in this region.
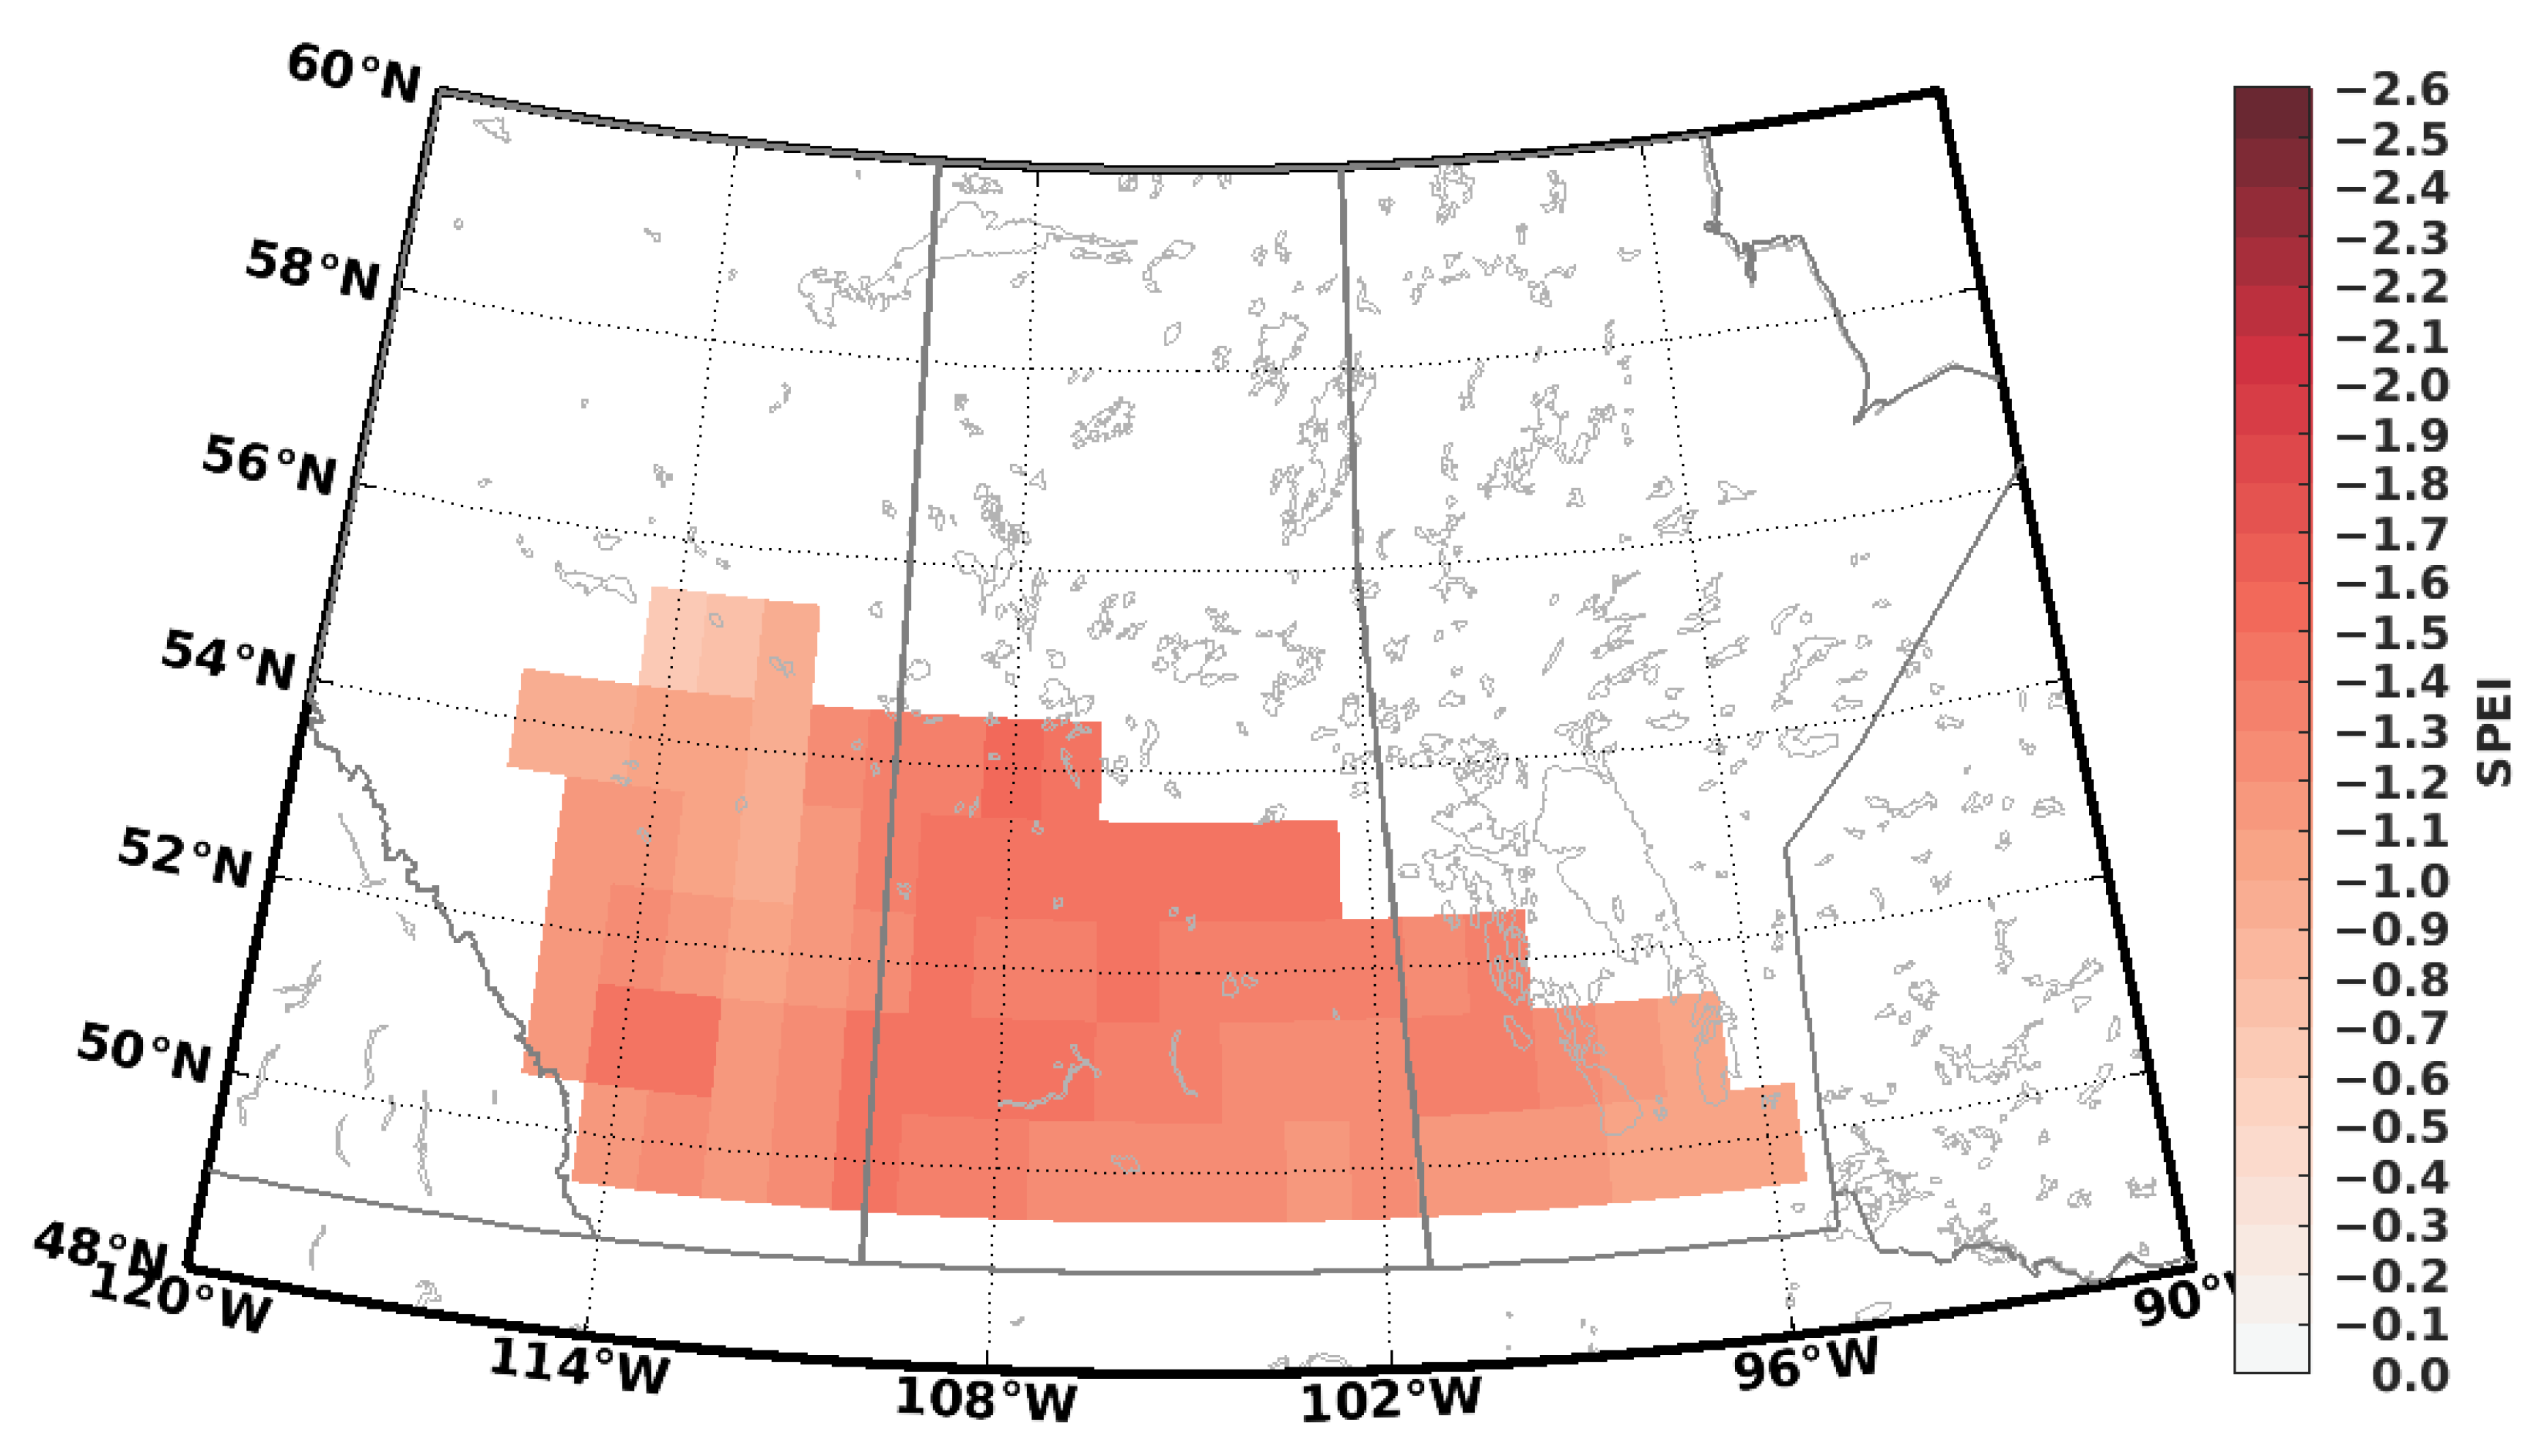
An indication of the preferred spatial extent of historical droughts is evident in Figure 4 that provides the combined severity for all ten droughts. Regions of most extreme SPEI values are located in central Alberta and west central Saskatchewan northward into northwest Saskatchewan. As with the temporal characteristics, the individual spatial features of these droughts also varied considerably (not shown). For example, the driest region was usually located in Alberta and Saskatchewan with the exception of 1914–1915 and 1931–1932 when it was centred in southwestern and southern Saskatchewan, respectively, and during 1910–1911 when it persisted in Alberta. The only event that was centred in eastern Saskatchewan and Manitoba was in 1960–1962. Overall, northern and southern Alberta tended to have similar frequencies for the driest regions. Central to northwest Saskatchewan was also associated with higher frequencies when compared to the south.
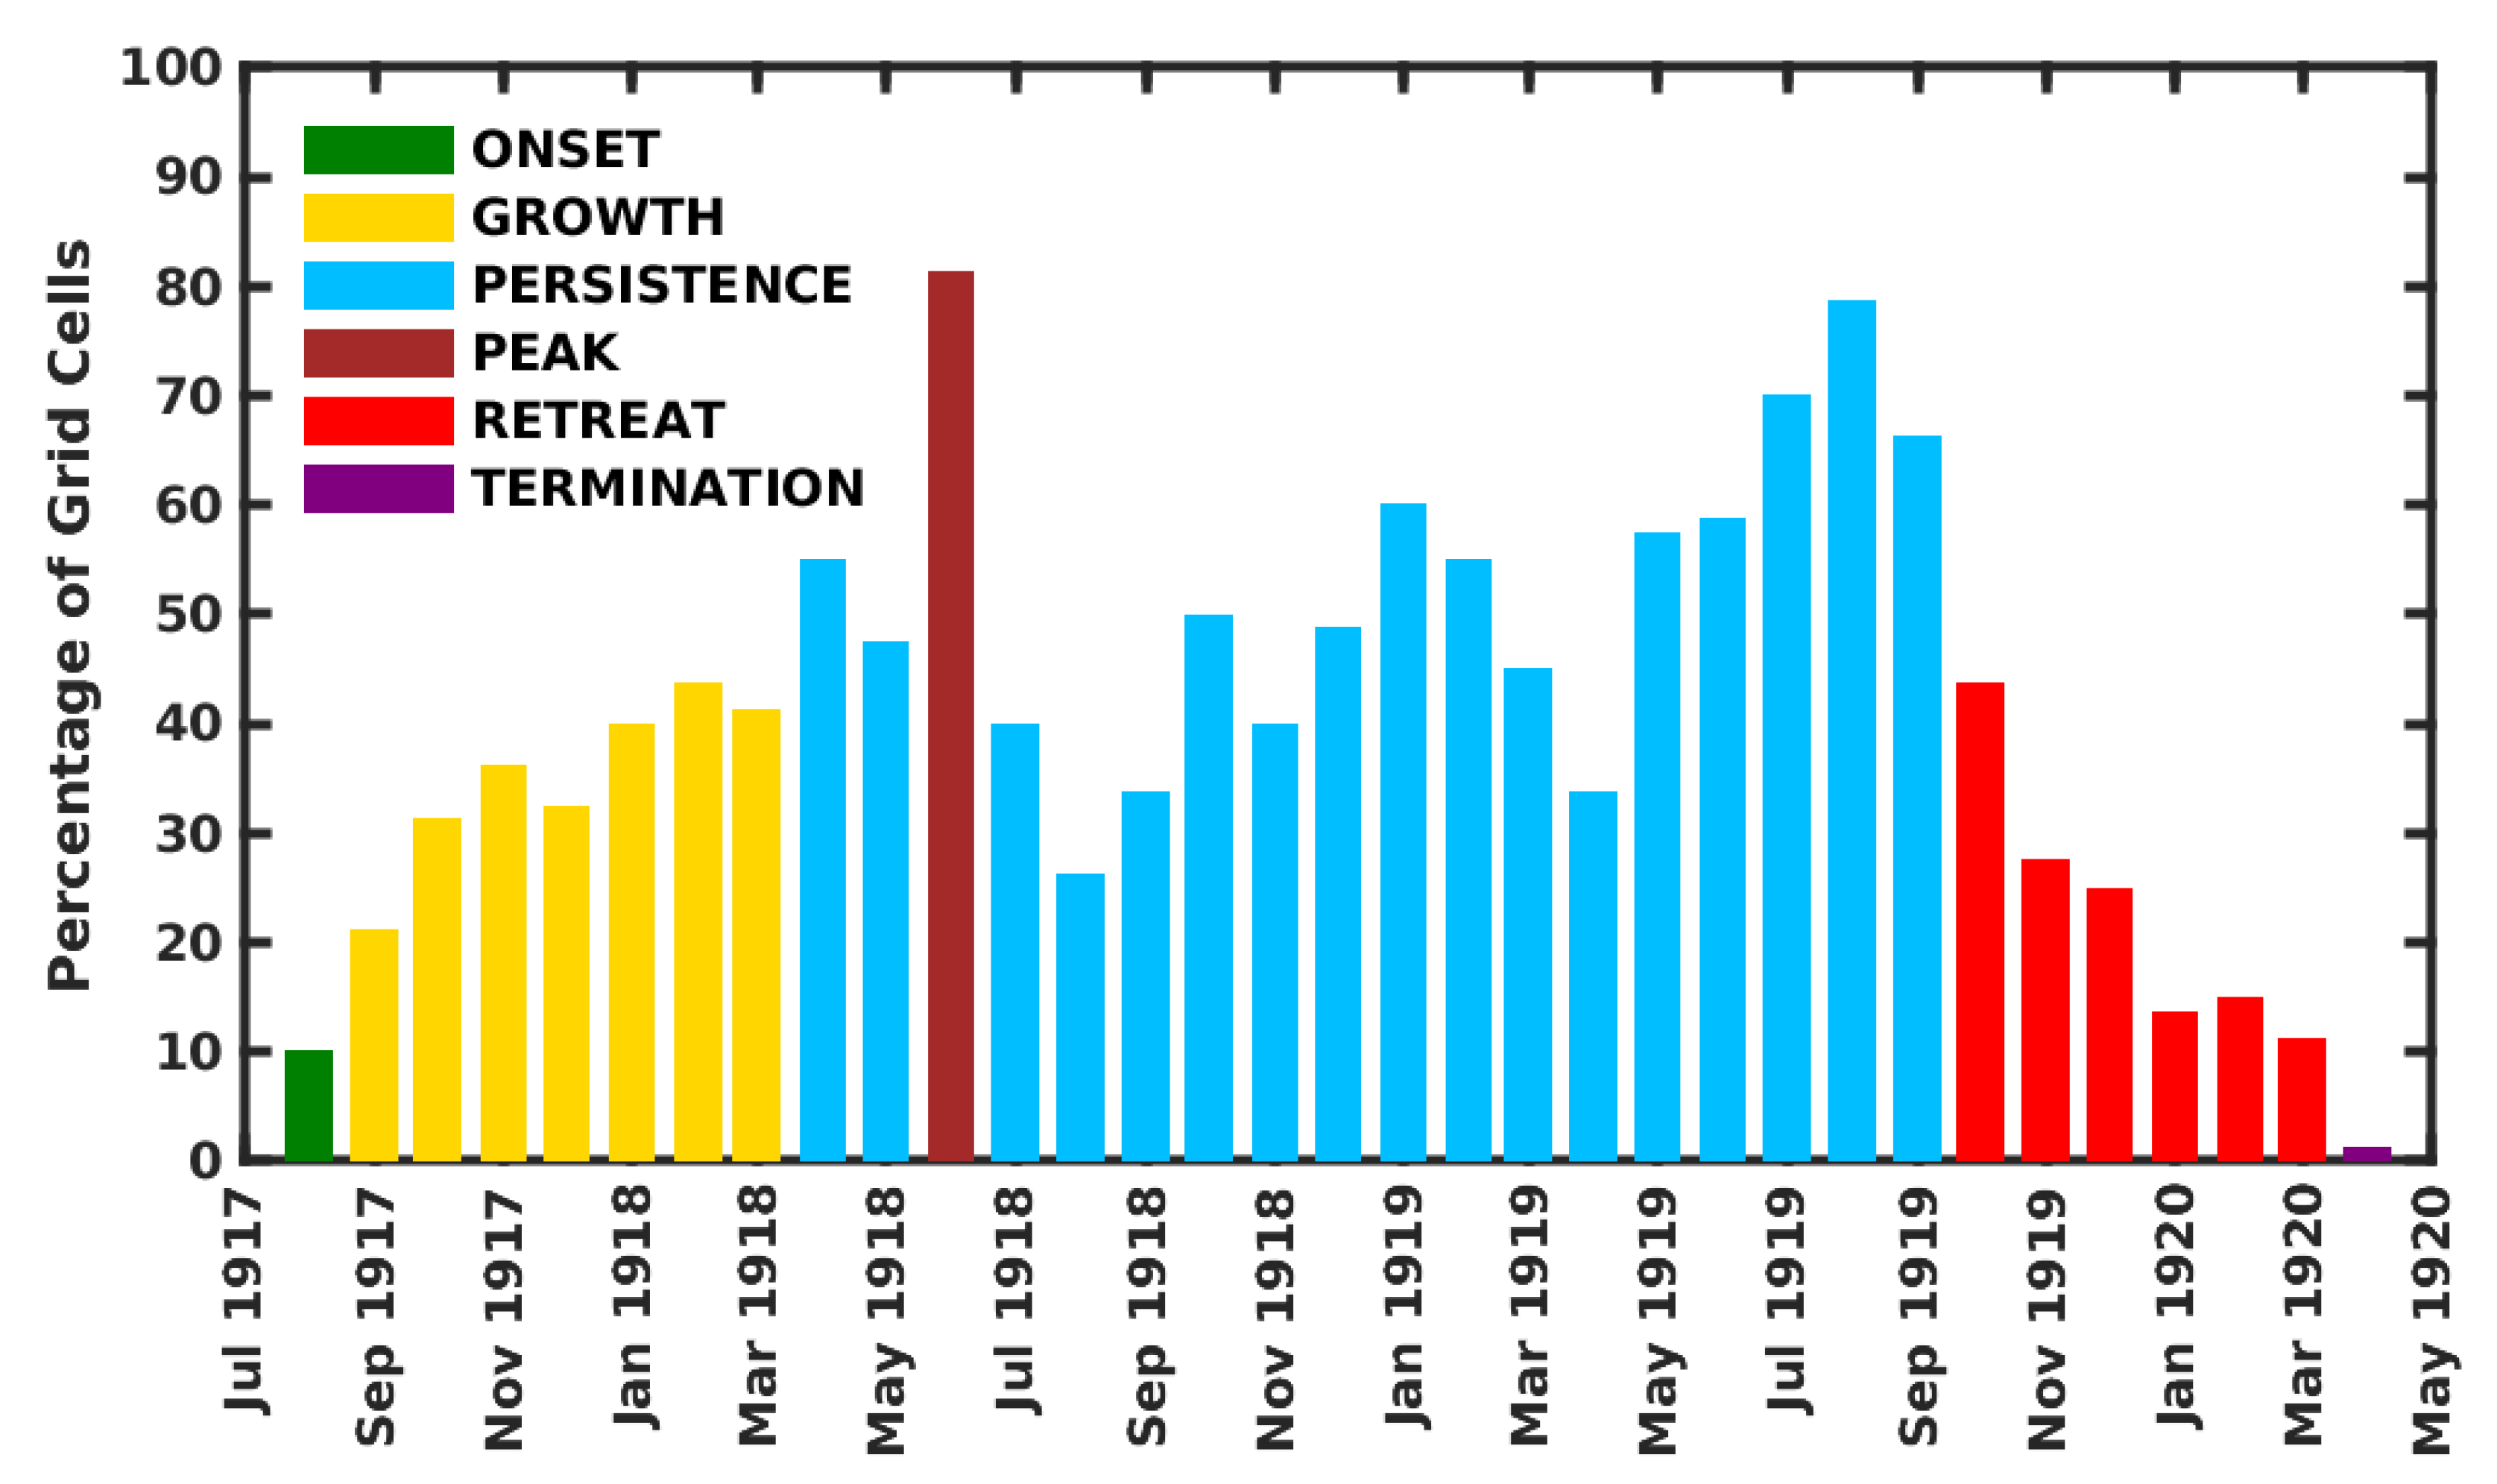
An example of the drought stages for the highest intensity drought (1917–1920) is provided in Figure 5. The drought was initiated in August of 1917 with an extended growth stage of seven months. The persistence stage (when the area in severe drought was >50%) started in April 1918 and lasted for 18 months (longest of all historical droughts). During this persistence, area in severe drought varied, peaking quickly in June 1918 (81% of the area) with secondary peaks in January 1919 and August 1919. Note that the % area in severe drought dropped below 50% during some months but returned to >50% and thus were still considered as part of the persistence stage. Retreat began in October 1919 and lasted for six months with the drought terminating in April 1920. The episode was 32 months with an average SPEI of −1.42 during the entire period. Other severe droughts (not shown) were associated with similar tendencies, although the length of the various stages and overall durations varied considerably.
3.2. GCM Projected Droughts
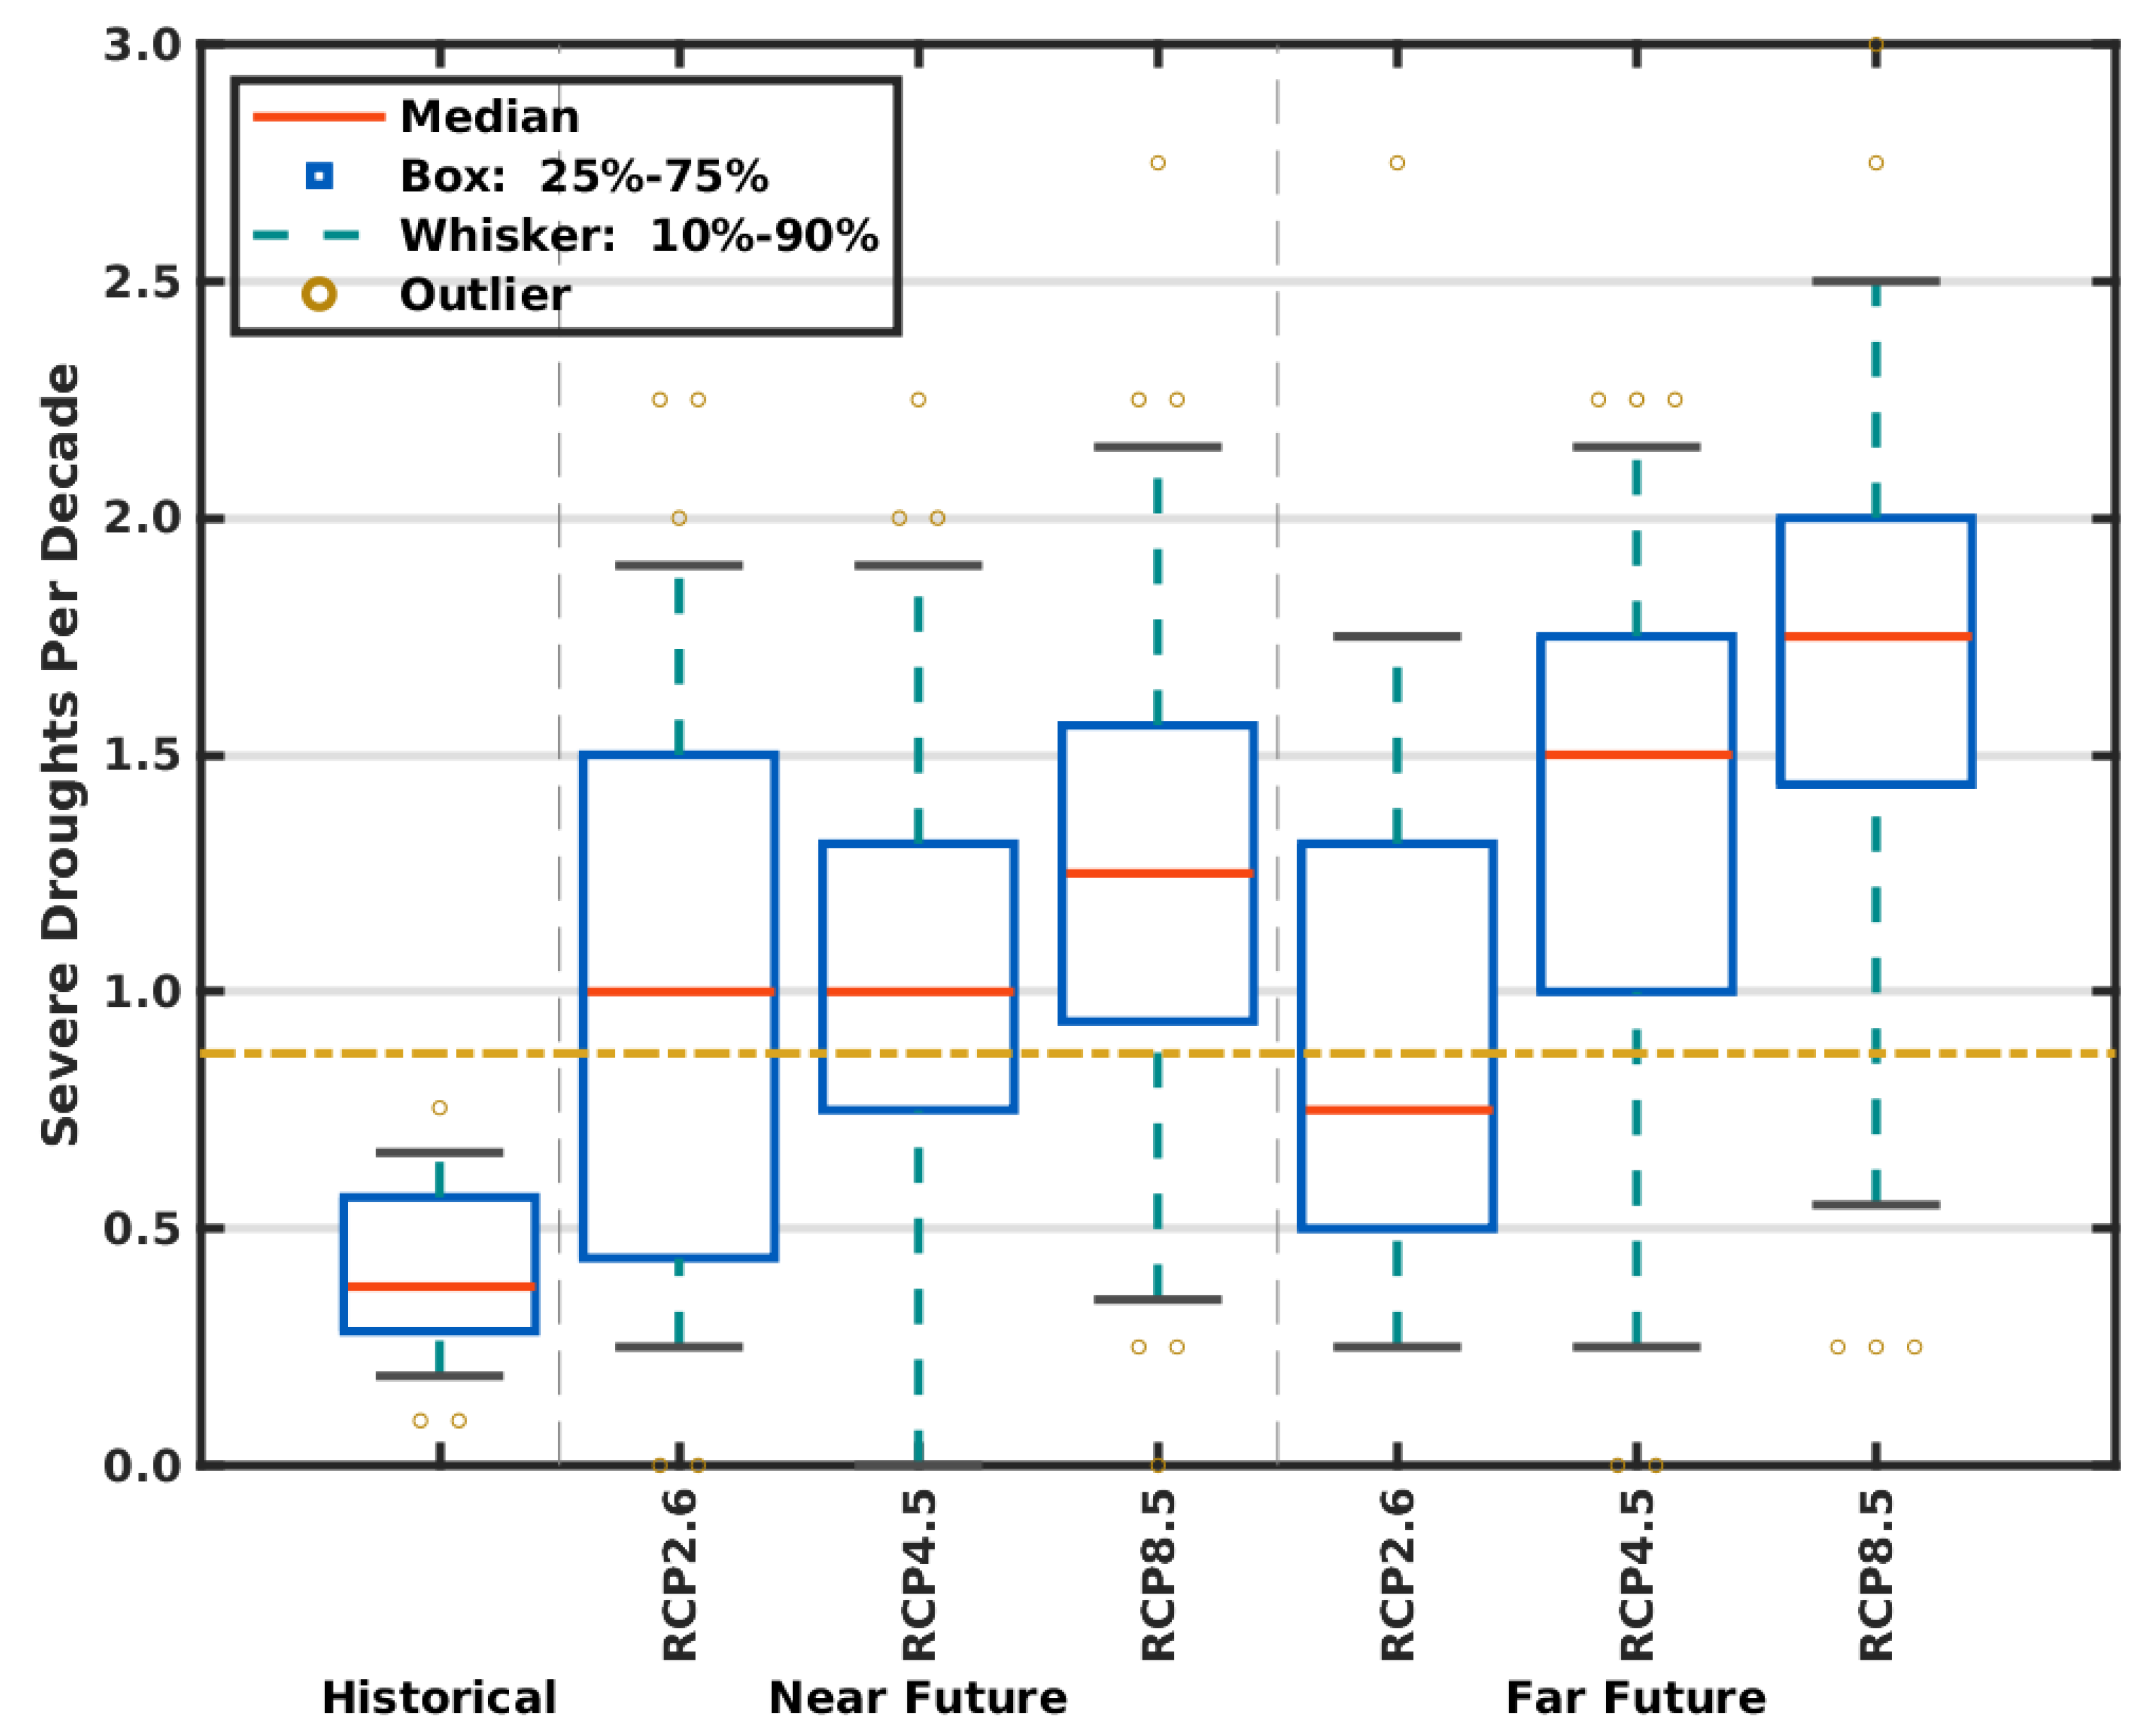
Figure 6 shows the projected average number of severe droughts (per decade) during the historical, and near/far future periods for the three RCP emission pathways for all 29 GCMs. The median value for the modelled historical period is 0.40 severe droughts/decade, which is considerably less than the observed 0.87 using CANGRD. There is also substantial variability among the models ranging from a low of 0.09 to a maximum of 0.75/decade (which is still less than observed). Therefore, all GCMs underestimate the number of severe droughts with the majority (20 of 29) simulating less than half of the observed events.
For the near future (2021–2060), the 29 GCMs show a frequency range of zero to 2.75 severe droughts/decade with little difference between RCPs 2.6 and 4.5 and slightly higher values for RCP 8.5. The median number of events are 1.02, 0.98, and 1.27/decade, respectively, which is slightly higher than the observed 0.87 and considerably higher than the historically modelled 0.40. The various RCPs are associated with noticeably greater differences in the far future (2061–2100) with median values of 0.92, 1.33, and 1.68/decade for RCPs 2.6, 4.5, and 8.5, respectively. For RCP 8.5, this is over four times the modelled historical and almost twice that from the observed CANGRD. However, RCP 2.6 is nearly identical to what was observed, thus highlighting the sensitivity of projected severe drought to future emissions. The range in the number of severe droughts for the far future is zero to 3.00 per decade and, in fact, all future projections for the 29 GCMs show considerable variability among the individual models as evident in the box and whisker plots in Figure 6. This, along with the large under-estimation of actual observed severe droughts suggest large uncertainty in future drought projections.
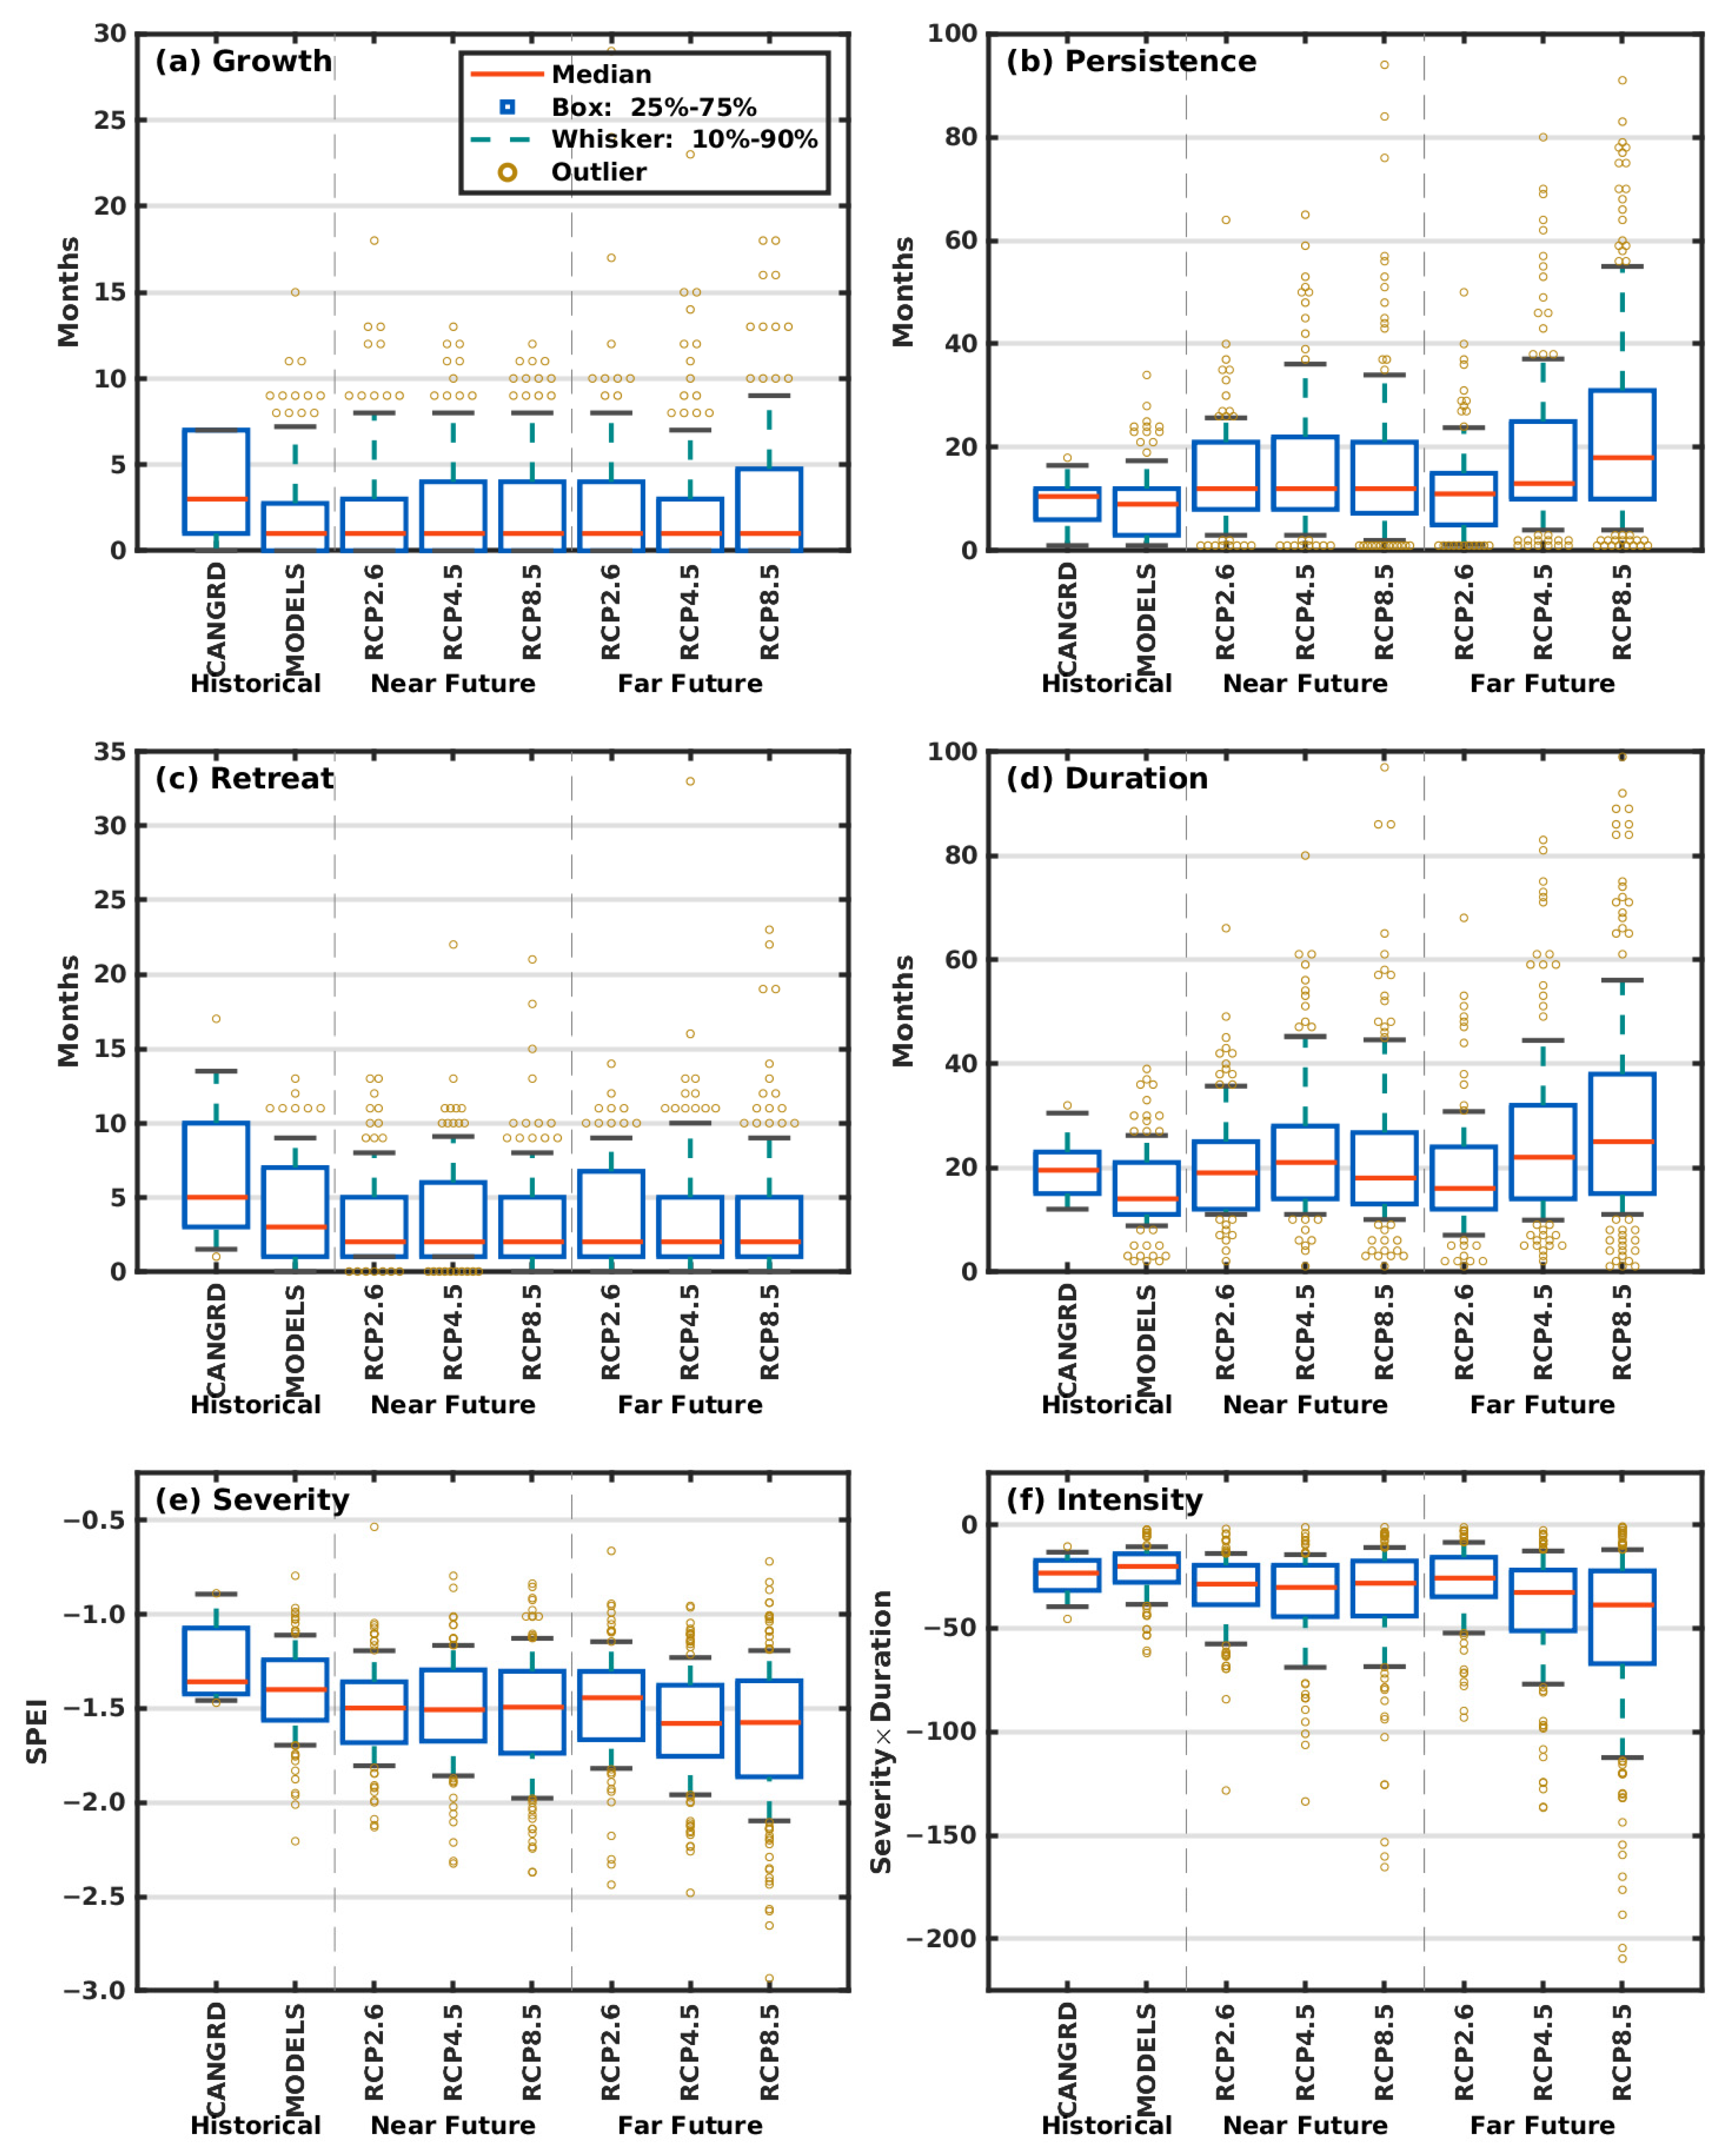
Near and far future projections of individual drought stages and other characteristics (growth, persistence, retreat, duration, severity, intensity) are given in Figure 7a–f. For growth, there is little difference in model projections among the historical, near, and far future for all RCPs. The median value is around one month for all periods considered with a slightly greater range of variability in the far future with some modelled values exceeding 20 months. Note the observed CANGRD value is three months which is longer than any of the simulations. This may be an indication of more flash droughts in the future, e.g., [25,26], that may be particularly devastating, as the warning and preparation time is greatly diminished. However, more research is required to assess the robustness of the growth stage analysis.
For persistence, Figure 7b shows that the median observed value of 10.5 months is well simulated for the historical period (median of nine months). For the near future, median values for all RCPs project a small increase to 12 months with a slightly higher range for RCPs 4.5 and 8.5. As with the number of severe droughts, persistence values for the far future are more scenario dependent with a general increase in median persistence from 11 to 13 to 18 months in association with RCPs 2.6, 4.5, and 8.5. There is also a greater range in projections compared to the near future. For the worst-case scenario, this translates to an average increase in persistence of around eight months (from observed), which can have huge impacts, especially if back to back growing seasons are impacted (i.e., when plant growth and water demands are high). The seriousness of drought impacts depends on several characteristics of the events, especially persistence and severity. Longer drought durations tend to cause greater losses as storage of water and other resources are depleted. As reported in the literature, e.g., [3], events longer than two years consume much of the adaptive resources and inflict much more damage than shorter droughts.
Similar to growth, the retreat stage is underestimated in historical model projections (three months compared to the observed five months using CANGRD). In addition, little difference was found in GCM projections for the near and far future for all RCPs with the median value being two months for all periods. As with growth, more research is required to assess the robustness of the retreat stage analysis.
Duration comprises the sum of the growth, persistence, and retreat stages. The modelled historical median underestimates severe drought duration by nearly six months (14 versus 19.5 months) although some individual GCMs are closer to the observed (Figure 7d). The median near future projections range from 18 to 21 months, which corresponds closely to the CANGRD values and is considerably greater than the modelled historical. The far future is once again impacted by future emissions with median values of 16 months for RCP 2.6 and 25 months for RCP 8.5. Interestingly, many individual models simulate severe droughts lasting longer than 60 months (and even approaching 100 months). This is substantially longer than the longest observed drought of 32 months in 1917–1920 (Table 3). Figure 7a–d therefore indicate that severe droughts will be longer in the future and this length is primarily the result of greater persistence (i.e., >50% area in severe drought or worse) with little change in the growth and retreat stages. This longer persistence of severe drought would have significant impacts on the Prairies and many other regions.
As mentioned previously, the greatest impacts are often associated with growing season (May to August) droughts. During the historical period, nine of ten severe droughts peaked during the growing season (Table 3). GCM projections of peak severity (Table 4) show that for the historical period, the average of all 29 GCMs considerably underestimates the percentage of severe droughts peaking during the growing season (62.4%). Percentages for both the near and far future under all RCPs are similar to the modelled historical value, with the exception of the far future RCP 8.5 where there is a slight increase to 71.8%. Reasons for the differences between CANGRD and the average modelled projections are not clear and require further investigation.
Figure 7e,f shows projected changes to the severity (average SPEI value over the study area for the entire duration), and intensity (duration multiplied by the severity) of severe Prairie droughts. Median severity for the modelled historical is almost identical to observed CANGRD (−1.40 versus −1.36) although the box and whiskers for the modelled values indicate that the majority of models project greater drought severity. Both near and far future median values are slightly lower, but quite similar (ranging between −1.45 and −1.60), suggesting that the severity of future drought when averaged over the entire study period remains constant throughout the 21st century regardless of the emission scenario. Intensity on the other hand is more scenario dependent in the far future with much more intense median values for RCP 8.5 compared to RCP 2.6 and a lesser extent, RCP 4.5. This is due to the longer durations shown in Figure 7d. Near future intensities are similar for all scenarios and indicate increased intensity when compared to both the modelled and CANGRD historical values. As with most other variables, the historical ensemble underestimates drought intensity when compared to actual observed intensity and there is a large range in individual GCM projections for all models.
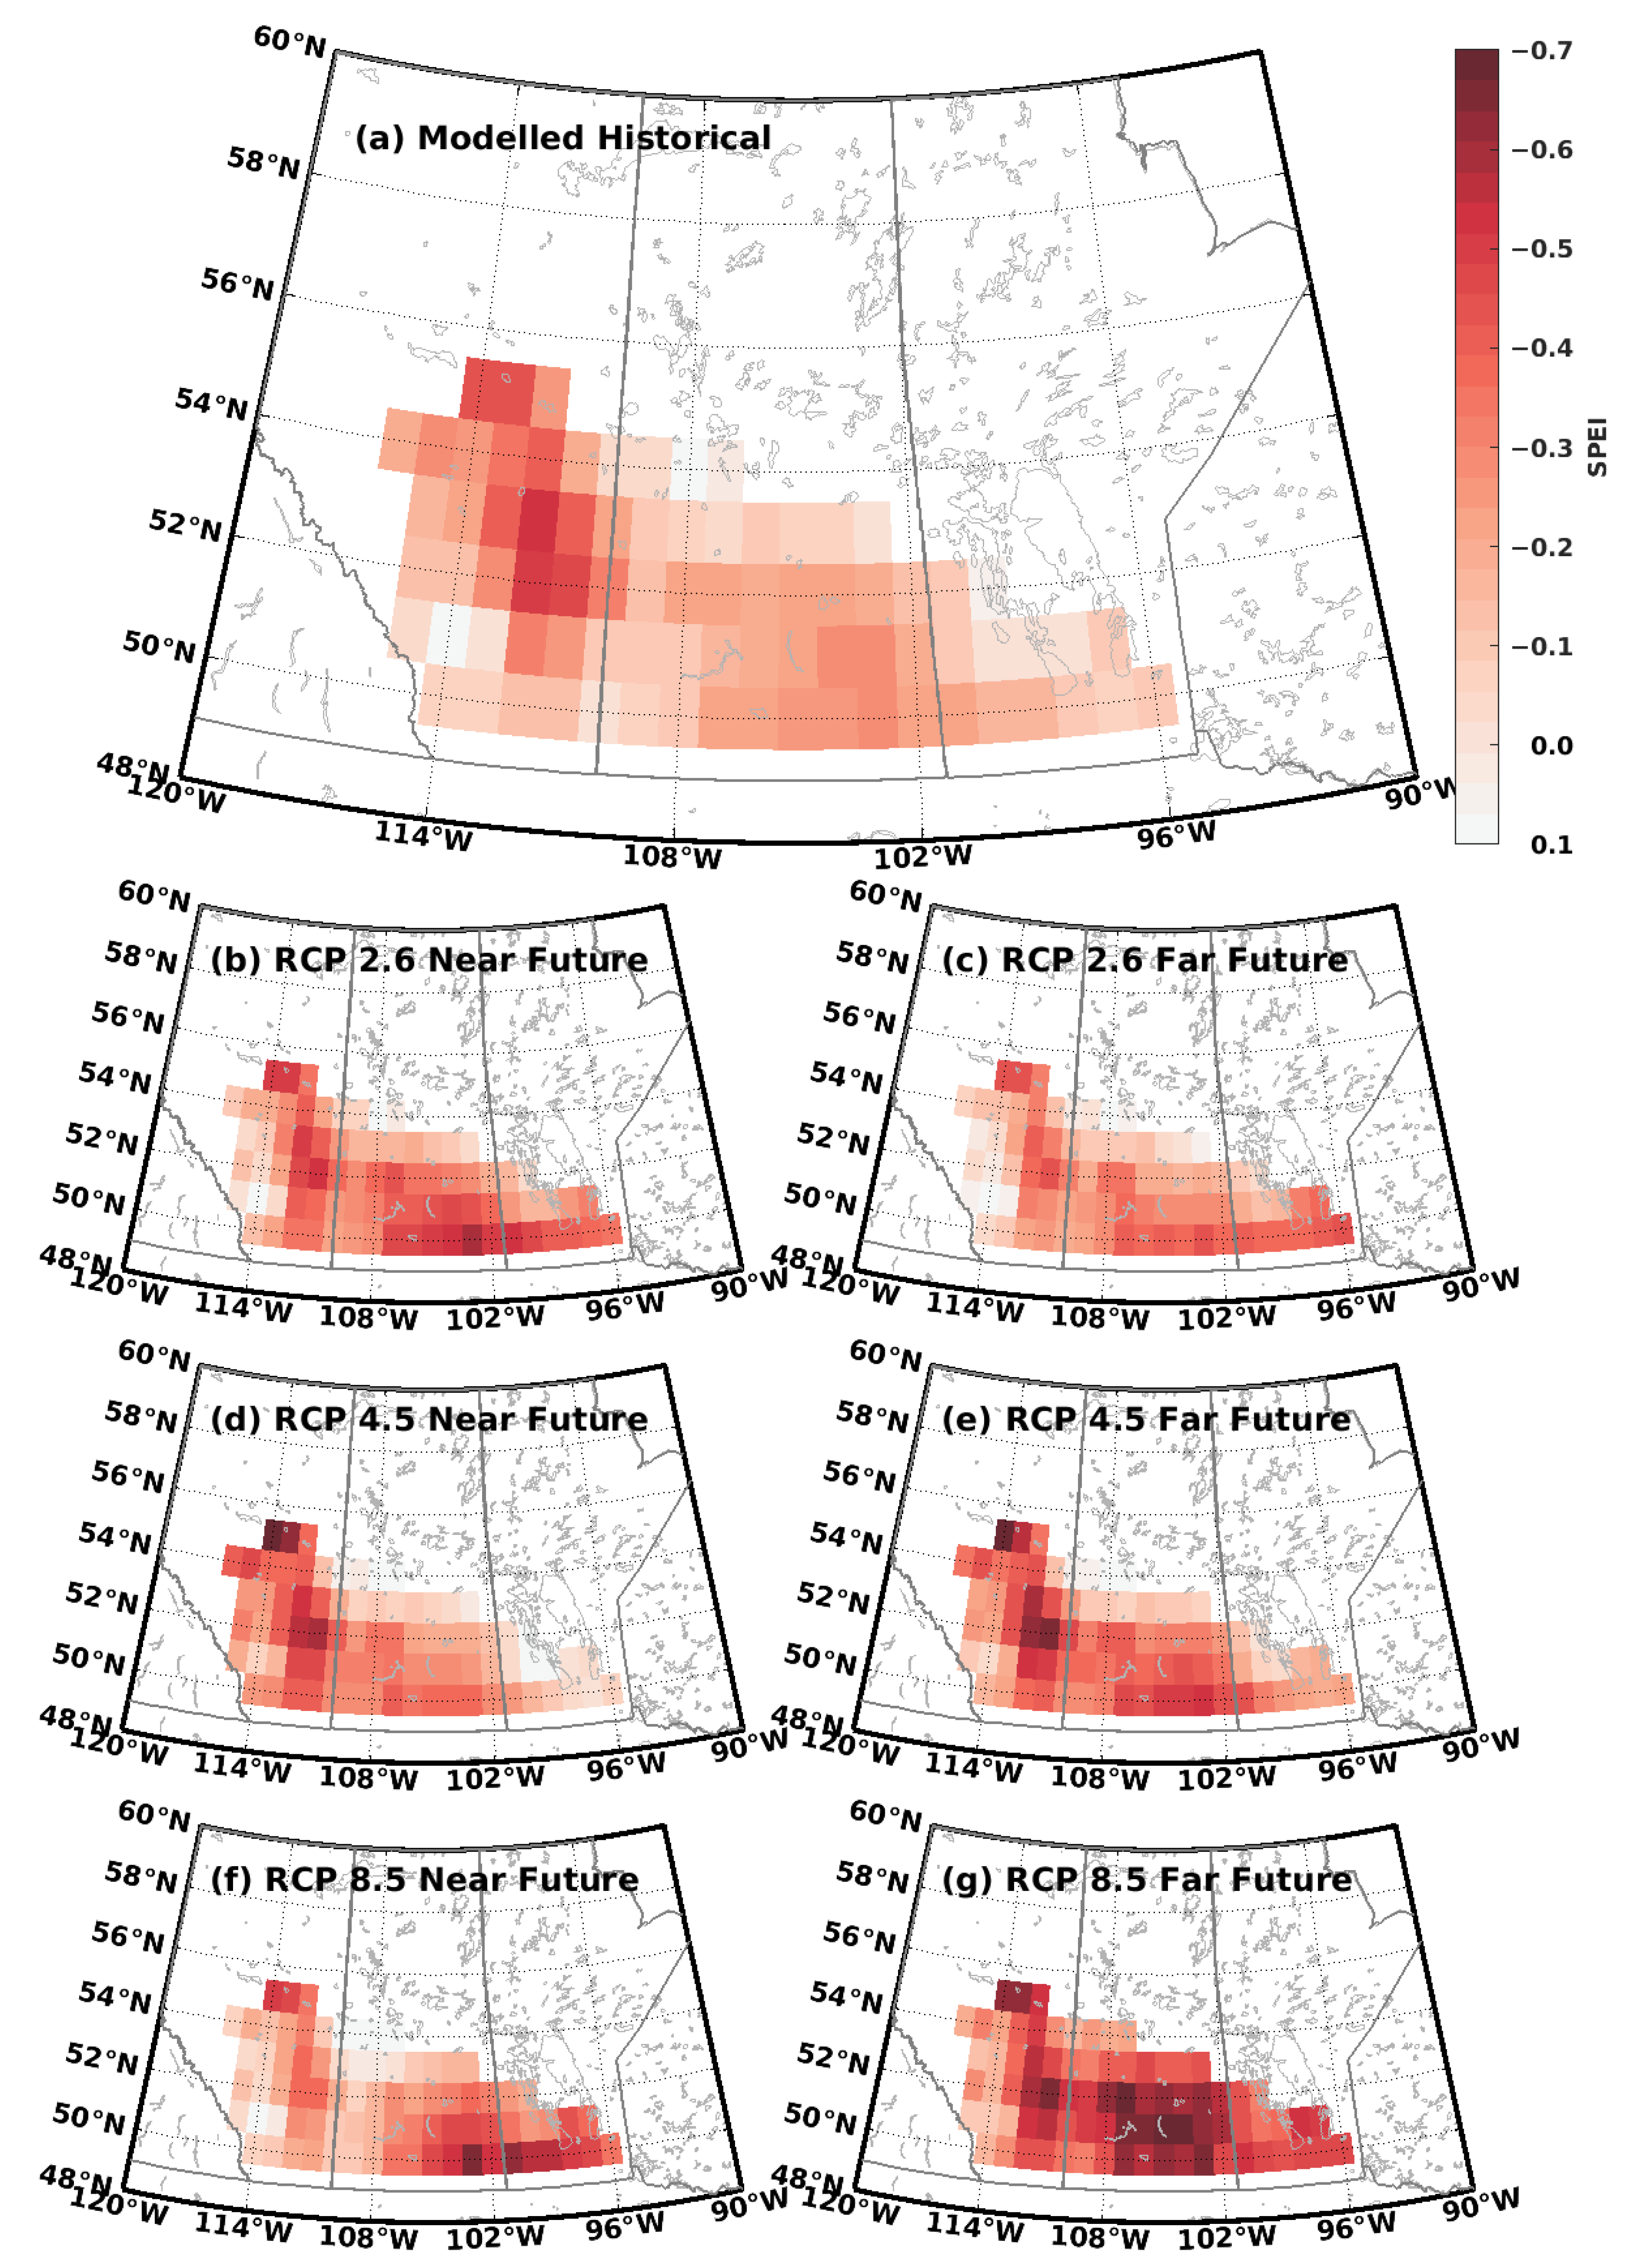
Projected changes in the spatial extents and patterns of severe droughts are provided in Figure 8, that shows average SPEI differences at each grid cell between the various GCM projected droughts and those associated with all observed CANGRD droughts (modelled minus observed). The average historical modelled projection tends to overestimate observed severity in central to northern Alberta and to a lesser extent across south-eastern Saskatchewan (Figure 8a). For the most part, all other regions are well simulated. Regarding the near future (Figure 8b–d), the aforementioned spatial pattern is also evident with increased severity projected mostly over northern to central Alberta and south-eastern Saskatchewan and south-western Manitoba. There are differences among the different RCPs with, surprisingly, RCP 2.6 showing the greatest change. Far future (Figure 8e,f) changes for the most part continue this pattern, however, as expected, the greatest changes are associated with RCP 8.5. For this scenario, almost the entire study region is projected to have increased severity with substantial differences (up to −0.7) in the centre of the study area and particularly, in central Saskatchewan. This increased severity would be associated with significant drought-related concerns, especially for sectors such as agriculture.
4. Discussion and Conclusions
This study has applied a novel drought stages technique to examine past and future occurrences and features of severe drought over the agricultural region of the Canadian Prairies. It incorporated the SPEI, which to the authors’ knowledge has not been previously used to determine past and projected changes to the different stages of drought. Using CANGRD, ten severe droughts were identified during the historical period (1900–2014). For the most part, each drought had unique temporal characteristics with median values of growth, persistence, retreat, and duration being 3.0, 10.5, 5.0, and 19.5 months, respectively. The longest drought was the 1917–1920 event that lasted 32 months. Nine of these droughts peaked during the May to August growing season and the median severity was −1.36 (Table 3, Figure 3). The most extreme SPEI values were, on average, located in central Alberta and west central Saskatchewan, and extending northward into northwest Saskatchewan (Figure 4).
Changes to Canadian Prairie severe droughts and their characteristics by 29 CMIP5 GCMs using RCP 2.6, RCP 4.5, and RCP 8.6 revealed that these droughts are projected to increase in frequency, particularly toward the end of this century, under higher emission scenarios. For example, there could be a doubling of severe drought occurrences by the end of century with RCP 8.5 (Figure 6). This is consistent with several previous climate-change related drought studies across western Canada including the Canadian Prairies, e.g., [8,12,13,14]. The increased drought in the Prairie region was associated with the reinforcing effects of both a slight reduction in summer precipitation and enhanced year-round warming [13]. Additional insight into the stages and other characteristics of these future severe droughts, however, revealed some critical aspects. Perhaps the most significant finding was that severe drought durations are projected to increase by about half a year for the near future, and almost a year for the far future using RCP 8.5 (Figure 7d). This increase is mainly due to a longer persistence stage (by about three months in the near future and up to about nine months in the far future; Figure 7b). However, growth and retreat showed little future change with most GCMs projecting shorter durations of these shoulder stages. This suggests that not only will there be more future severe droughts, they will develop more quickly, periods with extensive drought conditions will persist longer, and they will terminate more rapidly. These droughts will, therefore, be quite different from the 1917–1920 example shown in Figure 5, which had a more prolonged onset and termination. There is a small projected increase to overall future drought severity, and intensity becomes worse by up to 10 units in the near future and about 20 units in the far future mainly due to longer durations (Figure 7e,f). Fewer droughts will peak during the growing season (Table 4), while an increase in future severity is projected in northern to central Alberta and south-eastern Saskatchewan and south-western Manitoba. In the far future under RCP 8.5, almost the entire study region is projected to have increased severity, particularly in central Saskatchewan (Figure 8).
The type of large-area severe droughts assessed here are, at present, major challenges since they are associated with many economic, social, and environmental impacts, e.g., [3]. The projected changes to severe drought occurrence and characteristics will likely exacerbate these impacts especially for sectors such as agriculture and water resource management. An increased frequency, persistence, severity, and intensity of these large-area droughts will cause greater challenges for adaptation and result in increased vulnerabilities compared with smaller area droughts. The improved understanding of anticipated changes to the features of drought outlined in this study is critical for the management of future drought impacts.
It is recognized that these future drought changes are primarily based on median projections from the 29 GCMs and there is considerable variability in individual model results (Figure 6 and Figure 7). This model variability has also been identified by other future drought investigations across the Canadian Prairies, e.g., [9,10,11]. In addition, this analysis incorporated a unique drought stages concept based on specified thresholds (Table 1) and other drought stage methodologies (which to the authors’ knowledge are currently lacking) may yield different results. This study also used the 12-month agricultural growing season to identify droughts over a specified study area and it is recommended that similar analyses be carried out for other regions using a variety of drought definitions (e.g., the growing season). Furthermore, historical simulations from many of the GCMs had difficulty in reproducing the observed CANGRD findings in Table 3 and Figure 3. Of particular concern includes the models’ under-estimation of both the number of severe droughts during 1900–2005 (Figure 6) and the length of the observed growth and retreat shoulder stages (Figure 7a,c). This underestimation adds to the uncertainty in future projections and it is therefore recommended that future research examine the reasons for this under-estimation, be bias corrected for this difference, and/or perhaps focus on the individual models that are able to better simulate these characteristics.
In conclusion, this study has provided an innovative assessment on how climate change is projected to affect temporal and spatial characteristics of future Canadian Prairie severe droughts. All droughts are associated with onset, growth, persistence, retreat, and duration stages, however, the trajectory through the stages is unique to each event. This drought-stage methodology and resultant information on potential changes to the spatial and temporal characteristics of future droughts can be used to assess changes to hydro-climatic extremes in other regions of the world using various hydro-climatic variables associated with these extremes (e.g., streamflow, groundwater). The information is also critical for the user community regarding the better understanding of future drought impacts and the development of potential adaptation strategies.
Author Contributions
Conceptualization, B.B., E.W., and R.S.; methodology, B.B., Z.L., E.W., and R.S.; software, Z.L.; formal analysis, B.B., Z.L., E.W., and R.S.; data curation, Z.L.; writing—original draft preparation, B.B.; writing—review and editing, B.B., Z.L., E.W., and R.S.; funding acquisition, R.S. and B.B. All authors have read and agreed to the published version of the manuscript.
Funding
The research was supported by Global Water Futures, which is funded by the Canada First Research Excellence Fund, and by Environment and Climate Change Canada.
Acknowledgments
The authors would like to thank Alan Howard from Agriculture and Agri-Food Canada for initial guidance toward the development of this research. They also thank Benita Tam for providing the SPEI information.
Conflicts of Interest
The authors declare no conflict of interest.
References
- Wilhite, D. Drought as a Natural Hazard: Concepts and Definitions, Part I. In Drought, A Global Assessment; Routledge Press: New York, NY, USA, 2000; Volume 1, pp. 3–18. [Google Scholar]
- Maybank, J.; Bonsai, B.; Jones, K.; Lawford, R.; O’Brien, E.; Ripley, E.; Wheaton, E. Drought as a natural disaster. Atmos. Ocean 1995, 33, 195–222. [Google Scholar] [CrossRef]
- Wheaton, E.; Kulshreshtha, S.; Wittrock, V.; Koshida, G. Dry times: Hard lessons from the Canadian drought of 2001 and 2002. Can. Geogr. 2008, 52, 241–262. [Google Scholar] [CrossRef]
- Bonsal, B.R.; Wheaton, E.E.; Chipanshi, A.C.; Lin, C.; Sauchyn, D.J.; Wen, L. Drought Research in Canada: A Review. Atmos. Ocean 2011, 49, 303–319. [Google Scholar] [CrossRef]
- Bonsal, B.; Regier, M. Historical comparison of the 2001/2002 drought in the Canadian Prairies. Clim. Res. 2007, 33, 229–242. [Google Scholar] [CrossRef] [Green Version]
- Quiring, S.M.; Papakyriakou, T.N. Characterizing the spatial and temporal variability of June-July moisture conditions in the Canadian prairies. Int. J. Clim. 2005, 25, 117–138. [Google Scholar] [CrossRef]
- Chipanshi, A.C.; Findlater, K.; Hadwen, T.; O’Brien, E. Analysis of consecutive droughts on the Canadian Prairies. Clim. Res. 2006, 30, 175–187. [Google Scholar] [CrossRef]
- Bonsal, B.R.; Aider, R.; Gachon, P.; Lapp, S. An assessment of Canadian prairie drought: Past, present, and future. Clim. Dyn. 2012, 41, 501–516. [Google Scholar] [CrossRef]
- Jeong, D.I.; Sushama, L.; Khaliq, M.N. The role of temperature in drought projections over North America. Clim. Chang. 2014, 127, 289–303. [Google Scholar] [CrossRef]
- Masud, M.B.; Khaliq, M.N.; Wheater, H.S. Future changes to drought characteristics over the Canadian Prairie Provinces based on NARCCAP multi-RCM ensemble. Clim. Dyn. 2016, 48, 2685–2705. [Google Scholar] [CrossRef]
- Bonsal, B.; Cuell, C.; Wheaton, E.; Sauchyn, D.J.; Barrow, E. An assessment of historical and projected future hydro-climatic variability and extremes over southern watersheds in the Canadian Prairies. Int. J. Clim. 2017, 37, 3934–3948. [Google Scholar] [CrossRef]
- Dibike, Y.; Prowse, T.; Bonsal, B.; O’Neil, H. Implications of future climate on water availability in the western Canadian river basins. Int. J. Clim. 2017, 37, 3247–3263. [Google Scholar] [CrossRef]
- Tam, B.Y.; Szeto, K.; Bonsal, B.; Flato, G.; Cannon, A.J.; Rong, R. CMIP5 drought projections in Canada based on the Standardized Precipitation Evapotranspiration Index. Can. Water Resour. J. 2019, 44, 90–107. [Google Scholar] [CrossRef]
- Stewart, R.E.; Szeto, K.K.; Bonsal, B.R.; Hanesiak, J.M.; Kochtubajda, B.; Li, Y.; Thériault, J.M.; Debeer, C.M.; Tam, B.Y.; Li, Z.; et al. Summary and synthesis of Changing Cold Regions Network (CCRN) research in the interior of western Canada—Part 1: Projected climate and meteorology. Hydrol. Earth Syst. Sci. 2019, 23, 3437–3455. [Google Scholar] [CrossRef] [Green Version]
- Bonsal, B.R.; Wheaton, E.E.; Meinert, A.; Siemens, E. Characterizing the Surface Features of the 1999–2005 Canadian Prairie Drought in Relation to Previous Severe Twentieth Century Events. Atmos. Ocean 2011, 49, 320–338. [Google Scholar] [CrossRef]
- Vicente-Serrano, S.M.; Beguería, S.; López-Moreno, J.I. A Multiscalar Drought Index Sensitive to Global Warming: The Standardized Precipitation Evapotranspiration Index. J. Clim. 2010, 23, 1696–1718. [Google Scholar] [CrossRef] [Green Version]
- Droogers, P.; Allen, R.G. Estimating Reference Evapotranspiration Under Inaccurate Data Conditions. Irrig. Drain. Syst. 2002, 16, 33–45. [Google Scholar] [CrossRef]
- Vincent, L.A.; Zhang, X.; Brown, R.D.; Feng, Y.; Mekis, E.; Milewska, E.J.; Wan, H.; Wang, X.L. Observed Trends in Canada’s Climate and Influence of Low-Frequency Variability Modes. J. Clim. 2015, 28, 4545–4560. [Google Scholar] [CrossRef]
- Canadian Climate Data and Scenarios. Available online: http://climate-scenarios.canada.ca (accessed on 19 February 2019).
- Cannon, A.J. Multivariate Bias Correction of Climate Model Output: Matching Marginal Distributions and Intervariable Dependence Structure. J. Clim. 2016, 29, 7045–7064. [Google Scholar] [CrossRef]
- Taylor, K.E.; Stouffer, R.J.; Meehl, G.A. An Overview of CMIP5 and the Experiment Design. Bull. Am. Meteorol. Soc. 2012, 93, 485–498. [Google Scholar] [CrossRef] [Green Version]
- Statistics Canada. Available online: https://www150.statcan.gc.ca/n1/pub/92-639-x/92-639-x2011001-eng.htm (accessed on 19 February 2019).
- Bonsal, B.R.; Zhang, X.; Hogg, W. Canadian Prairie growing season precipitation variability and associated atmospheric circulation. Clim. Res. 1999, 11, 191–208. [Google Scholar] [CrossRef] [Green Version]
- Marchildon, G.; Kulshreshtha, S.; Wheaton, E.; Sauchyn, D. Drought and institutional adaptation in the Great Plains of Alberta and Saskatchewan, 1914–1939. Nat. Hazards 2007, 45, 391–411. [Google Scholar] [CrossRef]
- Ford, T.W.; Labosier, C.F. Meteorological conditions associated with the onset of flash drought in the Eastern United States. Agric. For. Meteorol. 2017, 247, 414–423. [Google Scholar] [CrossRef]
- Wang, L.; Yuan, X. Two Types of Flash Drought and Their Connections with Seasonal Drought. Adv. Atmos. Sci. 2018, 35, 1478–1490. [Google Scholar] [CrossRef]
- Stewart, I. Drought. In Encyclopedia of Saskatchewan; Canadian Plains Research Centre University of Regina: Regina, SK, Canada, 2005; p. 257. [Google Scholar]
- Szeto, K.K.; Henson, W.; Stewart, R.; Gascon, G. The Catastrophic June 2002 Prairie Rainstorm. Atmos. Ocean 2011, 49, 380–395. [Google Scholar] [CrossRef] [Green Version]
Figure 1.
The study area consisting of 80 grid cells in the agricultural region of the Canadian Prairies.
Figure 1.
The study area consisting of 80 grid cells in the agricultural region of the Canadian Prairies.

Figure 2.
Percentage of grid cells (see Figure 1) in severe drought or worse (SPEI < −1.5) during the 12-month agricultural year (September to August) for the period 1900–2014. The ten severe droughts identified as exceeding the 45% threshold (dashed line) are assessed in Table 3.

Figure 3.
Box and whisker plots summarizing individual characteristics associated with the ten observed severe historical droughts over the Canadian Prairies for the period 1900–2014. (a) Growth, persistence, retreat, and duration and (b) Severity and intensity.
Figure 3.
Box and whisker plots summarizing individual characteristics associated with the ten observed severe historical droughts over the Canadian Prairies for the period 1900–2014. (a) Growth, persistence, retreat, and duration and (b) Severity and intensity.

Figure 4.
Average severity over the agricultural growing region of the Canadian Prairies for all ten severe droughts listed in Table 2.
Figure 4.
Average severity over the agricultural growing region of the Canadian Prairies for all ten severe droughts listed in Table 2.

Figure 5.
Percentage of grid cells in severe drought or worse (SPEI < −1.5) over the agricultural growing region of the Canadian Prairies (Figure 1) associated with the drought 1917–1920. Drought stages are also shown (see text for details).
Figure 5.
Percentage of grid cells in severe drought or worse (SPEI < −1.5) over the agricultural growing region of the Canadian Prairies (Figure 1) associated with the drought 1917–1920. Drought stages are also shown (see text for details).

Figure 6.
Box and whisker plots showing the average number of severe droughts per decade during the historical (1900–2005), near future (2021–2060) and far future (2061–2100) periods for all 29 global climate models (GCMs). Future period values are provided for representative concentration pathways (RCPs) 2.6, 4.5, and 8.5. The dashed line shows the observed number of severe droughts per decade from 1900–2014 using Canadian Gridded Dataset (CANGRD).

Figure 7.
Box and whisker plots showing the modelled values (for all 29 GCMs) of (a) growth, (b) persistence, (c) retreat, (d) duration, (e) severity, and (f) intensity of severe droughts during the historical (1900–2005), near future (2021–2060) and far future (2061–2100) periods. Future period values are provided for RCPs 2.6, 4.5, and 8.5. Severe droughts identified from 1900–2014 using CANGRD are provided for comparison.

Figure 8.
Average SPEI differences at each grid cell between modelled droughts (for all 29 GCMs) and those associated with all observed CANGRD droughts as shown in Figure 4 (modelled minus observed): (a) modelled historical, (b,c) RCP 2.6 for near future (2021–2060) and far future (2061–2100), (d,e) RCP 4.5 for near future and far future, and (f,g) RCP 8.5 for near future and far future, respectively.


Table 1.
Drought stages used in this study (adapted from [15]). The stages are based upon thresholds of the percentage of grid cells within the agricultural region of the Prairies that were encompassed by severe drought or worse (Standardized Precipitation Evapotranspiration Index (SPEI) < −1.5).
Table 1.
Drought stages used in this study (adapted from [15]). The stages are based upon thresholds of the percentage of grid cells within the agricultural region of the Prairies that were encompassed by severe drought or worse (Standardized Precipitation Evapotranspiration Index (SPEI) < −1.5).
| Stage | Temporal Description | Spatial Extent: Percentage of the Study Area in Severe Drought or Worse (SPEI < −1.5) |
|---|---|---|
| Initiation or emergence (i.e., early signs of drought). Month immediately preceding the start of the growth stage. | ≥10% |
| Increase in the area of severe drought. Number of months between the onset and persistence stage. | ≥10% to ≤50% |
| Period with the most widespread severe drought conditions. Number of months between the growth and retreat stages. | >50% * |
| Maximum extension of drought. Month with the greatest area in severe drought or worse. | Peak Value ** |
| Decrease in the area of severe drought. Number of months between the persistence stage and termination. | ≤50% to ≥10% |
| End of drought with return to near-normal conditions. Month immediately following the retreat stage. | <10% |
* Allowance was made for droughts in which the monthly areal coverage dipped to values ≤50% but remained ≥10% and then returned to >50%. The months in which this occurred were still considered to be ‘persistence’. ** May occur multiple times.
Table 2.
Additional drought characteristics used in this study.
| Characteristic | Description |
|---|---|
| Duration | Number of consecutive months when the percentage of the study area in severe drought or worse (SPEI < −1.5) is ≥10%. The sum of the growth, persistence, and retreat stages (Table 1) represent the length of the entire drought. Longer droughts would have greater impacts. |
| Severity | The average SPEI value over all 80 grid cells within the study area (Figure 1) for the entire duration of the drought. Provides an indication of the severity of the entire drought with more negative values having greater impacts. |
| Intensity | The duration multiplied by the severity. It is a unitless value that combines the average SPEI value or severity with the overall length of the drought. Intensities are greatest (i.e., most negative) for the most severe and long-duration droughts. |
Table 3.
Characteristics of observed severe historical droughts over the Canadian Prairies for the period 1900–2014. The most extreme values for each variable are bolded. The median, 25th, and 75th percentile for each variable are also provided.
Table 3.
Characteristics of observed severe historical droughts over the Canadian Prairies for the period 1900–2014. The most extreme values for each variable are bolded. The median, 25th, and 75th percentile for each variable are also provided.
| Drought | Onset | Growth (Months) | Persistence (Months) | Peak | Retreat (Months) | Termination | Duration (Months) | Severity | Intensity |
|---|---|---|---|---|---|---|---|---|---|
| 1910–1911 | May 1910 | 1 | 6 | 88% July 1910 | 4 | May 1911 | 12 | −1.45 | −17.4 |
| 1914–1915 | July 1914 | 0 | 1 | 49% August 1915 | 10 | July 1915 | 12 | −0.89 | −10.7 |
| 1917–1920 | August 1917 | 7 | 18 | 81% June 1918 | 6 | April 1920 | 32 | −1.42 | −45.6 |
| 1928–1930 | November 1928 | 7 | 12 | 100% August 1929 | 3 | October 1930 | 23 | −1.39 | −31.9 |
| 1931–1932 | January 1931 | 3 | 9 | 75% June 1931 | 2 | April 1932 | 15 | −1.35 | −20.3 |
| 1936–1938 | July 1936 | 3 | 15 | 90% June 1937 | 4 | June 1938 | 23 | −1.47 | −33.8 |
| 1948–1951 | October 1948 | 5 | 6 | 70% May 1949 | 17 | March 1951 | 29 | −0.90 | −26.1 |
| 1960–1962 | October 1960 | 7 | 12 | 88% August 1961 | 1 | July 1962 | 21 | −1.37 | −28.7 |
| 1988–1989 | March 1988 | 3 | 1 | 51% July 1988 | 10 | June 1989 | 15 | −1.08 | −16.1 |
| 2001–2003 | August 2001 | 0 | 12 | 62% December 2001 | 6 | February 2003 | 18 | −1.16 | −20.9 |
| Median | 3.0 | 10.5 | 79.4% | 5.0 | 19.5 | −1.36 | −23.5 | ||
| 25th | 0.8 | 4.8 | 65.3% | 2.8 | 14.3 | −1.03 | −17.1 | ||
| 75th | 7.0 | 12.8 | 88.1% | 10.0 | 24.5 | −1.43 | −32.4 |
Table 4.
Percentage of severe droughts with their peak value during the growing season (May to August) for all 29 GCMs during the historical (1900–2005), near future (2021–2060) and far future (2061–2100) periods. Future period values are provided for RCPs 2.6, 4.5, and 8.5. Note that if a given drought peaked multiple times, it was considered as peaking during the growing season if any of these peaks occurred from May to August. The percentage for severe droughts identified from 1900–2014 using CANGRD are provided for comparison.
| CANGRD | Historical | Near Future | Far Future | ||||
|---|---|---|---|---|---|---|---|
| RCP 2.6 | RCP 4.5 | RCP 8.5 | RCP 2.6 | RCP 4.5 | RCP 8.5 | ||
| 90.0% | 62.4% | 58.5% | 64.9% | 61.9% | 63.5% | 60.4% | 71.8% |
Publisher’s Note: MDPI stays neutral with regard to jurisdictional claims in published maps and institutional affiliations. |
© 2020 by the authors. Licensee MDPI, Basel, Switzerland. This article is an open access article distributed under the terms and conditions of the Creative Commons Attribution (CC BY) license (http://creativecommons.org/licenses/by/4.0/).
Share and Cite
MDPI and ACS Style
Bonsal, B.; Liu, Z.; Wheaton, E.; Stewart, R. Historical and Projected Changes to the Stages and Other Characteristics of Severe Canadian Prairie Droughts. Water 2020, 12, 3370. https://doi.org/10.3390/w12123370
AMA Style
Bonsal B, Liu Z, Wheaton E, Stewart R. Historical and Projected Changes to the Stages and Other Characteristics of Severe Canadian Prairie Droughts. Water. 2020; 12(12):3370. https://doi.org/10.3390/w12123370
Chicago/Turabian StyleBonsal, Barrie, Zhuo Liu, Elaine Wheaton, and Ronald Stewart. 2020. "Historical and Projected Changes to the Stages and Other Characteristics of Severe Canadian Prairie Droughts" Water 12, no. 12: 3370. https://doi.org/10.3390/w12123370
Note that from the first issue of 2016, this journal uses article numbers instead of page numbers. See further details here.