Article

Event-Based Time Distribution Patterns, Return Levels, and Their Trends of Extreme Precipitation across Indus Basin

by
Muhammad Zaman
1,2,*,
Ijaz Ahmad
3,
Muhammad Usman
4,
Muhammad Saifullah
5,
Muhammad Naveed Anjum
6,
Muhammad Imran Khan
1 and
Muhammad Uzair Qamar
2,*
1
Research Center of Fluid Machinery Engineering and Technology, Jiangsu University, Zhenjiang 212013, China
2
Department of Irrigation and Drainage, University of Agriculture, Faisalabad 380000, Pakistan
3
Center of Excellence in Water Resources Engineering, University of Engineering and Technology, Lahore 54600, Pakistan
4
Department of Geoecology, Institute of Geosciences and Geography, University of Halle-Wittenberg, Von Seckendorff-Platz 4, 06120 Halle (Saale), Germany
5
Department of Agricultural Engineering, Muhammad Nawaz Shareef University of Agriculture, Multan 66000, Pakistan
6
Department of Land and Water Conservation Engineering, Faculty of Agricultural Engineering and Technology, Pir Mehr Ali Shah Arid Agriculture University, Rawalpindi 46000, Pakistan
*
Authors to whom correspondence should be addressed.
Water 2020, 12(12), 3373; https://doi.org/10.3390/w12123373
Submission received: 27 September 2020 / Revised: 19 November 2020 / Accepted: 27 November 2020 / Published: 1 December 2020

Abstract

:
This study presented the spatio-temporal characteristics of extreme precipitation events in the Northern Highlands of Pakistan (NHPK). Daily precipitation observations of 30 in situ meteorological stations from 1961 to 2014 were used to estimate the 11 extreme precipitation indices. Additionally, trends in time distribution patterns (TDPs) and return periods were also investigated for event based extreme precipitations (EEP). Results found that the precipitation events with an amount of 160–320 mm and with a concentration ratio of 0.8–1.0 and a duration of 4–7 consecutive days were dominant. The frequency of heavy, very heavy and extremely heavy precipitation days decreased, whereas the frequency of wet, very wet and extremely wet days increased. Most of the indices, generally, showed an increasing trend from the northeast to middle parts. The extreme precipitation events of the 20 and 50-year return period were more common in the western and central areas of NHPK. Moreover, the 20 and 50-year return levels depicted higher values (up to 420 mm) for an event duration with all daily precipitation extremes dispersed in the first half (TDP1) in the Chitral, Panjkora and Jhelum Rivers basins, whilst the maximum values (up to 700 mm) for an event duration with all daily precipitation extremes dispersed in the second half (TDP2) were observed in the eastern part of the NHPK for 20-year and eastern and south-west for 50-year, respectively.

1. Introduction

The Intergovernmental Panel on Climate Change (IPCC) in its fifth assessment report (AR5) has reported a warming of earth up to 0.85 °C on the basis of the global average ocean and land surface temperature data from 1880 to 2012 [1]. It is a well-known phenomenon that the moisture-holding capacity of air increases with the increase of its temperature [1,2,3,4]. Since precipitation intensity and amount are directly proportional to the moisture-holding capacity of air, an increase in the air moisture content has created a discrepancy in the amount and intensity of precipitation worldwide [1,3,4,5,6]. This situation has increased the frequency of extreme precipitation events that are influencing socio-economic development and the environment. Therefore, understanding of the extreme precipitation patterns is essential for disaster prediction, flooding avoidance and diminution strategies [7,8,9].
Extreme precipitation directs towards the severe catastrophes that may lead to huge economic and human losses as it has a tendency to elicit natural perils, e.g., landslides, debris flows and floods [10]. An escalation in the intensity and frequency of extreme precipitation events has been noted at global and regional scales in some of the studies [5]. Different indices cater to different needs as the 11 precipitation indices, established by the Expert team for Climate Change Detection Monitoring and Indices (ETCCDMI), are extensively used around the globe as the major source to detect and present these extreme precipitation patterns [11,12,13,14,15,16,17,18,19,20]. While talking about the extreme precipitation patterns around Pakistan, several previous research works exhibited that Pakistan is experiencing a noteworthy change in the precipitation patterns, explicitly in the northern parts of the country, which leads to severe environmental disasters in the country [21,22,23,24].
The analysis of preceding and succeeding precipitation (PSP) is a better way to study extreme precipitation events because the occurrence of a precipitation event is frequently categorized in three segments, i.e., the start, development and a declining phase, which in total may last for some days [25,26]. Sporadically, extreme precipitation befalls in the course of the second/development phase wherever precipitation intensity surpasses a percentile value or a given threshold [27,28]. Numerous works on extreme precipitation features (e.g., duration, amount and frequency) repeatedly distinguish extreme precipitation from PSP [29,30,31,32,33]. Actually, extreme precipitation may cause significant flooding, while PSP might intensify the situation [34]. For example, a substantial precipitation event in the Yangtze and Huai River basins in 1991 during the 8th to 16th of June carried almost 200 mm total precipitation amount composed of 40, 50 and 45 mm on the 8th, 13th and 14th of June, respectively [35]. The 50 mm precipitation amount on the 13th of June just touched the threshold of daily precipitation extreme, whereas the amounts of precipitation on other days were less than that ordinary threshold value and, therefore, both events were not considered as extreme events (precipitation occurred on the 8th and 14th of June). However, the precipitation intensities on the 8th and 14th of June were quite significant to cause flooding [36,37,38]. Apparently, the precipitation amounts on those dates took place approximately equal to the precipitation amount observed on 13th June and, consequently, the precipitation amount observed during these three particular days can generate intensely substantial flooding by cumulative flood water [39,40]. Thus, the complete effect of these three day-to-day precipitation occurrences could be undervalued if the 50 mm extreme precipitation amount is exclusively judged irrespective of the 40 mm and the 45 mm preceding and succeeding precipitation, respectively. Because of this reason, extreme precipitation events should be better studied by taking into consideration the preceding and succeeding PSP.
Many of the published research works have categorized extreme daily precipitation in accordance with frequency, intensity and amount, neglecting the concept of PSP [41,42,43]. The time distribution patterns (TDPs), could also be stated as the temporal profile of extreme precipitation, are extremely intractable and uncertain. The extreme precipitation progressions are relatively diverse and hard to describe [44], and their investigation requires high-quality field data [45,46]. Time distribution patterns of extreme precipitation have a vital role in numerical weather prediction, hydraulic structure design, reservoir operation, flooding control and hydrologic forecasting since they regulate the surface runoff and streams flow processes [34]. Previously, few watersheds have utilized the concept of TDPs worldwide, typically on small spatial scales for daily precipitations [34,44,47]. Recently, middle and large scale TDPs of extreme precipitation are getting attention [28,48,49]. In northern highlands of Pakistan (NHPK), to the best knowledge of the authors, no study has been carried out to investigate the TDPs of extreme precipitation, although the focus of earlier research studies was mostly on daily precipitation extreme (DPE) [50,51,52]. Thus, across the NHPK, long-lasting extreme precipitation in accordance with TDPs is yet unidentified and a topic to explore further.
In the recent past, only very few research works have been carried out to inspect the precipitation trends across the NHPK [22,24,53,54]. A comprehensive study of extreme precipitation trends in NHPK was necessary to enhance our understanding of extreme precipitation changes in the region and to adapt mitigation strategies. The current study was conducted with the major objectives: to explore the use of the new idea of PSP for extreme precipitation events (EEPs) and to examine the TDPs along with the study of EEP return levels across the NHPK.

2. Materials and Methods

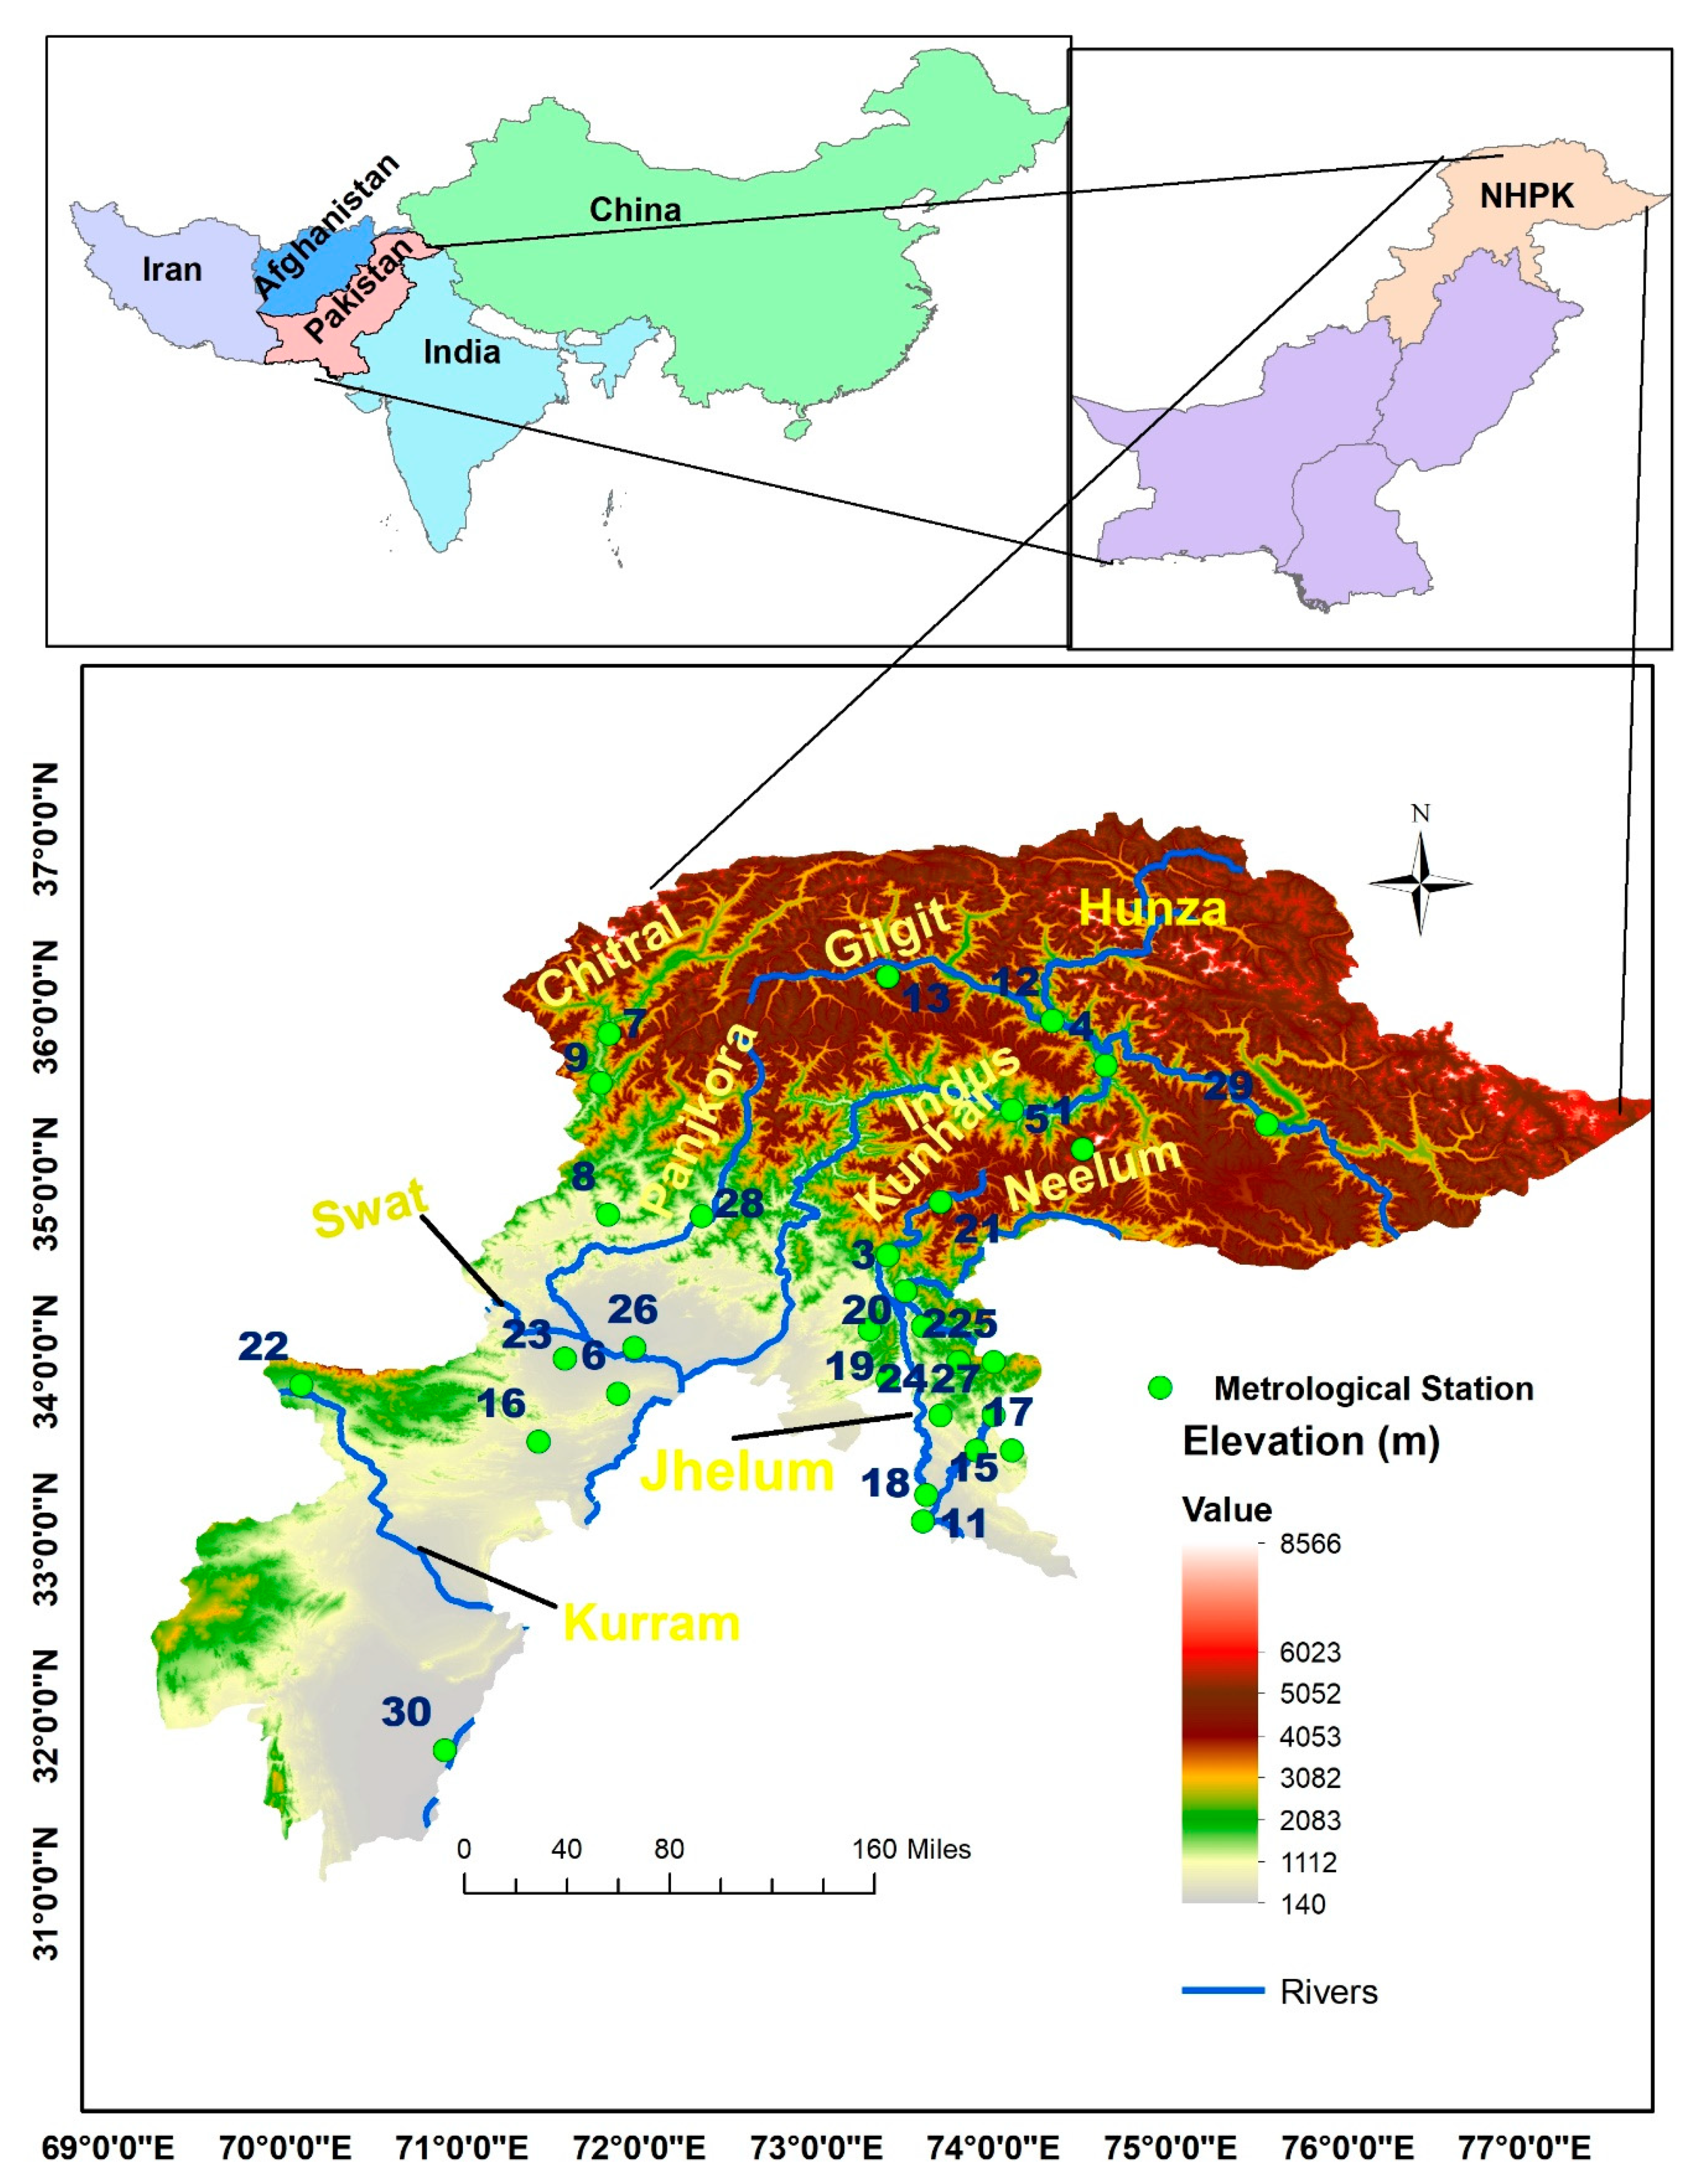
2.1. Study Area and Datasets

2.1.1. Study Area

The Indus basin, with a diverse climate and topography, is among the world’s major transboundary basins with 1.08 × 10⁶ km2 area, dispensed among Pakistan (56%), India (26%), China (11%) and Afghanistan (7%) [55], which makes it a geographically complicated terrain. The present study of PSP extreme events and TDPs along with their trends was carried out in the northern highlands of Pakistan (NHPK), which covers the most part of the Upper Indus River Basin (UIRB). The study area covers the spatial domain 69–78° E and 31–39° N, and comprises the major portions of the Karakoram, Himalaya and Hindukush peaks. The second highest peak, named Mount Godwin Austen (K2), is placed in the northern part of the NHPK, and the major rivers of Pakistan including the Indus, Swat, Kabul, Jhelum, Chitral, Gilgit, Kurram, Hunza and Panjkora originate from the NHPK. The Indus River, one of the world’s longest rivers (3180 km) traversing through the Indus basin, originates from Mount Kailash of the Tibetan Plateau north of the Himalayas at 5486 m a.m.s.l [56]. The Indus River along its major tributaries (i.e., the Chenab, the Jhelum, the Sutlej, the Ravi, the Beas, the Gilgit and the Kabul) traverses through Kashmir and Pakistan before draining to the Arabian Sea in the south.
The NHPK comprising the Upper Indus River Basin (UIRB), one of the world’s big irrigation systems, is the lifeline of millions of habitants as the stream water supplied by the UIRB is vital for the social and economic growth of the country [57]. However, glaciers and snow melting along with uneven precipitation and temperature patterns across the UIRB might have diversified effects on Pakistani river flows [58]. The water demands for agriculture are continuously increasing in the country [56], particularly in the majority part of the lower Indus basin, which is located in an arid to semi-arid zone, and mainly relies on the upstream water supply from the NHPK [59]. The complex topography, along with a conflicting hydro meteorological regime of NHPK because of high ranges and complicated interference of regional circulations, collectively make this region a climate change hotspot in South-Asia [22,23]. Extreme events (e.g., heatwaves, hot extremes and precipitation extremes) could become relatively frequent and intense in the NHPK in the near future [60], intensifying the severe threats for a state that is facing serious threats of natural hazards (droughts and floods) [21,61].
South-Asian circulations are the main elements affecting the climate of NHPK [62]. The annual average precipitation distribution fluctuates in the southeast to the northwest from 1065 mm to 70 mm in NHPK. The NHPK has experienced a very high evaporation rate, specifically a value of about 500 mm has been reported annually in the south-east of the study area [63]. Monsoon circulation is the main source of rainfall in hot summer for the eastern periphery of the NHPK, whilst western distributions influence the western periphery and are responsible for light to moderate precipitation occasions throughout the winter. Moreover, continental air masses are responsible for autumn (October to November) and spring (March to May) precipitation. The elevation, in the study area, ranges between 8616 m to 140 m from the north to south direction (Figure 1).

2.1.2. Datasets and Quality Control

The Water and Power Development Authority (WAPDA), Pakistan Meteorological Department (PMD) and an Italian-based organization named EvK2CNR are involved in meteorological data collection across the NHPK. About a hundred gauging stations are functional in the Northern highlands of Pakistan [62], but based on the completeness, the extent of the data and its homogeneity, the daily precipitation data from 30 gauging stations were prudently selected to assure the data quality. These thirty stations, installed by PMD and WAPDA, have the more precise and earliest records of precipitation and cover most of the area of the NHPK. These stations cover an east-west range of more than 200 km and north-south range of more than 100 km. For the present work, the data were collected from PMD and WAPDA, as only these organizations maintain the data up to such an extent with almost complete records and homogeneity of the data [22,23]. The PMD is a national level organization that monitors and records the climatic data. It is also a member of World Metrological Organization, which follows the world recognized standards about the installation, acquisition and publishing of the data [64]. The extent of the designated daily precipitation data series is up to 54 years, the only available data for such a long extent across the NHPK for different stations. The brief description of station names, record periods and average precipitation is given in Appendix A, and Figure 1 presents the geographical locations of the study area.
To assure reliability in determining the precipitation indices, meticulous data quality control was mandatory, and data quality control along with homogeneity checks had been carried out using numerous control approaches. Firstly, the data quality control has been performed, after acquiring the data from the WAPDA and PMD, by employing the homogeneity checks to correct the errors from the data. Afterward, the RClimDex tool has been integrated into the simple quality control and homogeneity estimation of the raw data [65]. Supplementary data homogeneousness was confirmed by means of RHtest V3 software [13,14,66] (available online from http://etccdi.pacificclimate.org/software.shtml).

2.2. Selection of Precipitation Indices

Eleven critical indices (Table 1), proposed by the Joint Commission for climatology (CCl)/Climate variability (CLIVAR)/Joint Technical Commission for Oceanography and Marine Meteorology (JCOMM) Expert Team on Climate Change Detection and Indices (ETCCDI) (http://etccdi.pacificclimate.org), were selected to observe their trends in the presented work. The designated indices show variations in extreme precipitation intensity, duration and frequency [67], and have been employed extensively to evaluate variations in extreme precipitation events around the entire globe [68,69].
The 11 precipitation indices, established by the Expert team for Climate Change Detection Monitoring and Indices (ETCCDMI), are extensively used around the globe to find out extreme precipitation patterns [11,12,13,14,15,16,17,18,19,20,66,70,71]. In this study, these indices were categorized based on (i) intensity assessment (SDII, PRCPOT, RX1 and 5day, R95p and 99p), and (ii) for the evaluation of frequency (R (10, 20 and 25) mm, CWD and CDD) [71]. Their collective uses rope the effective integrated assessment of precipitation extreme for extensive spatiotemporal scales [12], and permits the assessments of multi-decadal disparities in extreme precipitation throughout the study region.

2.3. Trend Analysis and Index Calculation

The Index calculator, RClimDex, established by the Climate Research Branch of the Meteorological Service of Canada [65], and employed around the globe to determine the precipitation extremes [18,72,73], has been integrated with this work to compute the extreme precipitation indices. These extreme precipitation indices are explained in Table 1 with more descriptions of the equations programmed in this software with the help of R, described in Supplementary Materials (S1). The linear tendency estimation technique to examine the trends of climatic variables, besides the least-squares methods, have been employed extensively for the study of extreme events [72,74,75]. The Mann Kendall (M-K) test [76,77], with the modification of pre-whitening of auto correlated data series suggested by Von Storch [78], has been applied to find out significant precipitation trends at the 0.05 significance level, and its detail is provided in the Supplementary Materials (S2–S4) section of this paper. Different interpolation techniques have been used across the globe for the interpolation of such data, but Krigging with External Drift proved the most efficient technique for such a complex and large upper Indus basin [62], and was used previously in this area [22,62]. Therefore, the Krigging with External Drift has been used in this study to prepare the spatial maps as it was found to be the most accurate technique for the study area [62].

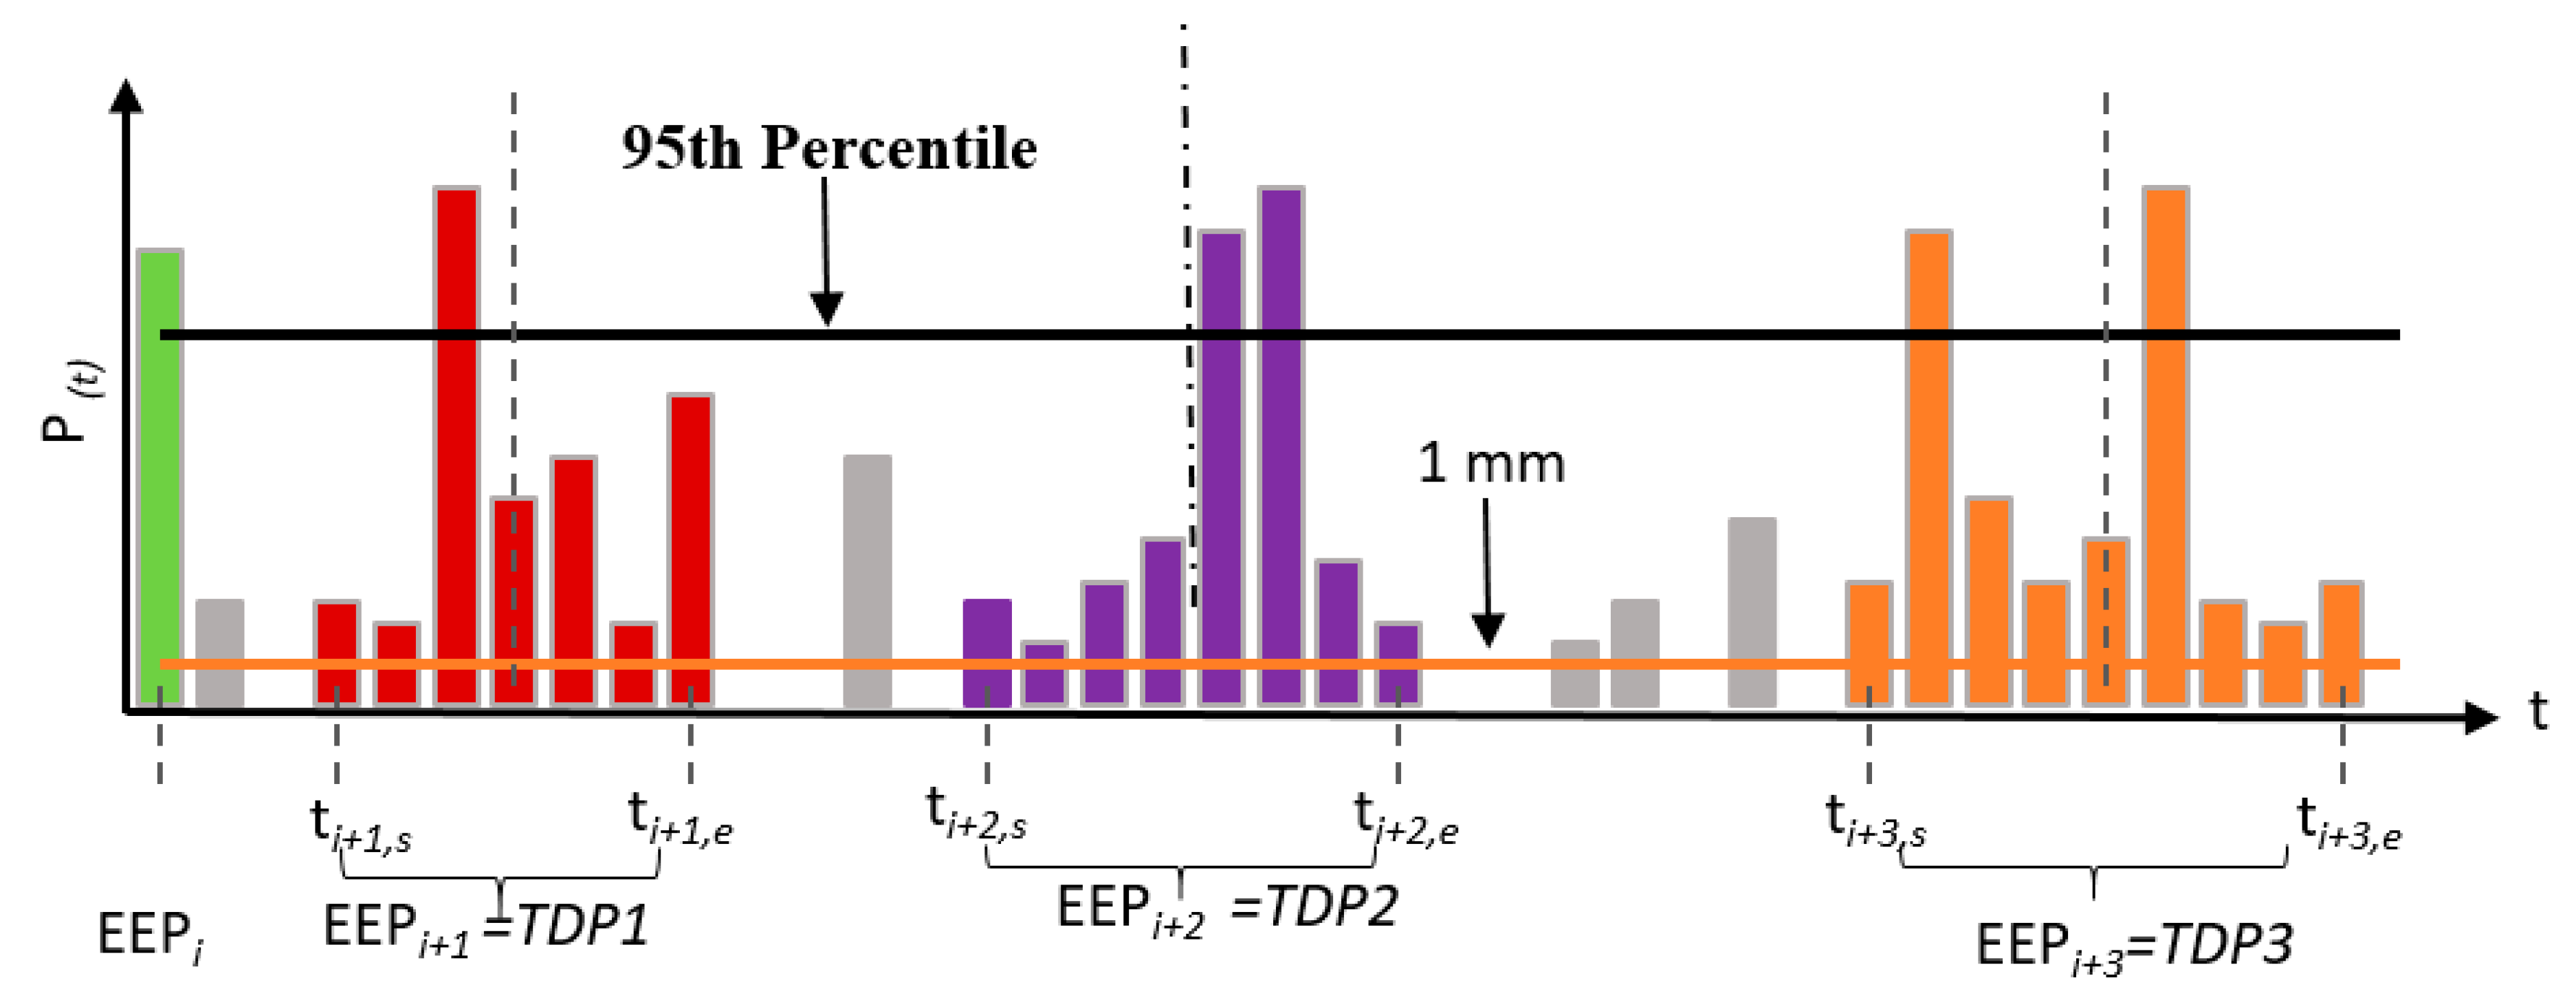
2.4. Definition of EEP

The first phase in categorizing precipitation time series in accordance with the EEPs (Event-based Extreme Precipitation) is to set a threshold value that defines a precipitation event. Typically, 1 mm is the value considered as a threshold, used to categorize dry and wet days as very light precipitation amount (e.g., below 1 mm), which perhaps would have been ignored and noted as dry days in many cases [42,79,80]. Hence, an event containing more than 1 mm daily precipitation amount during consecutive days is well-defined as a precipitation event. Wang and Zhu (2005) suggested the percentile-based technique that is extensively followed by researchers for extreme precipitation. Besides, the 99th percentile is repeatedly applied to find excessively sporadic events [40,81,82,83,84]. Intrinsically, for every gauge station, daily precipitation having a higher percentile than the 99th percentile was categorized as extreme precipitation for the 1961–2014 data series. At last, the outcome of the previous two steps is unified together and find the EEP along these lines with a minimum of one DPE throughout an event, and such precipitation event is referred to as an EEP. Certainly, EEPs are the events having at least a single day with a greater than 1 mm precipitation amount. It is noteworthy that a DPE might be equivalent to an EEP if it lasts only for one day. The EEP idea along with four EEPs, extricated during a precipitation occurrence, is demonstrated in Figure 2.
To describe an EEP, four basic indicators, which include precipitation amount, concentration ratio, frequency and duration, are used. For an EEP, the account of EEPs annually is termed as the frequency, whilst the extent of an event in days is its duration. The amount of an event is referred to as the sum of precipitation throughout an event and the total precipitation accumulation of all daily extreme precipitation over the total precipitation volume is termed as the concentration ratio. The event amount, duration and concentration ratio for an EEPi+1, shown in Figure 2, is given as:
d i + 1 = t i + 1 , e t i + 1 , s + 1
V i + 1 = t i + 1 , s t i + 1 , e p ( t ) . d t
e i + 1 = [ k = 1 n p ( t i + 1 , k ) ] / V i + 1 , n = 1 , 2 , 3
d i + 1 , e i + 1 and V i + 1 are the duration, concentration ratio and amount of the EEPi+1(TDP1), respectively; the end and start days of the events are depicted as ti+1,s and ti+1,e, correspondingly. Here, the i + 1 indicates the specific number of events within a period of time, while “s” and “e” represent the starts and end of a particular event. We can say an event is started if it has even one-day precipitation with more than 1 mm, but it does not mean that it is an extreme event until it must contain at least one-day precipitation percentile with more than 99th percentile. Moreover, in subscripts, i represents the year and 1, 2, 3 represent the EEP (1, 2 or 3), respectively, and means TDP1, TDP2 or TDP3. During the event, n is the number of DPE (for EEPi+1, n = 1), whilst ti+1,k is the occurrence time for the kth daily extreme precipitation. Similarly, P (t) represents the time series data of precipitation. Explicitly, for 1 day EEP (Figure 2), the concentration ratio and duration are constant and their values are taken equal to 1.

2.5. Time Distribution Pattern (TDP)

Extreme precipitation progressions in the real world are not only just diverse, but complex, and thus tough to deduce which TDP might be able to define temporal developments of extreme precipitation competently [85,86,87]. In the present work, TDPs associated with EEPs are explored spatially on a big scale (i.e., over the northern highlands of Pakistan) by using the daily-observed precipitation time series. A thorough classification of TDPs around the whole NHPK is not possible as this is computationally demanding and complex. For methodological easiness, the duration of every EEP with extreme precipitation for more than one day is separated equally in two portions, and the TDP of the event is categorized in accordance with the distribution of DPE. This categorization is acquired from the previous literature, which divides the duration of precipitation extremes into numerous identical slices, and has classified the TDPs in accordance with the position of peak intensities [50,52,88,89]. The concept of TDPs is demonstrated in Figure 2. Three TDPs are attained through the described method and are abbreviated and presented as follows:
  • TDP1: for an event duration, all DPEs for an EEP are dispersed in the first half.
  • TDP2: for an event duration, all DPEs for a multi-day EEP are fallen in the second half.
  • TDP3: for an event duration, few of the DPEs during an EEP are fallen in the first half, and few in the second half.
Sporadically, an event lasting for several days might have only one precipitation extreme that might be observed coincidently in the mid of the event (correspondingly, the duration of the event is not an even number). In this scenario, the DPE is associated with neither the first half nor the second half of the event duration. Consequently, this kind of EEP is observed as TDP2/TDP1 if the collected precipitation amount in the second/first half part of the event duration is greater than the first/second half part. Moreover, it is worth noting that single day precipitation (1-day EEP) does not hold any TDP, as it does not last for more than one day. More precisely, basically, there are four categories of EEPs, i.e., three TDPs (TDP1, TDP2 and TDP3) and one day EEP (1-day EEP). Figure 2 presents these four EEPs categorized as 1-day EEP (EEPi), TDP1 (EEPi+1), TDP2 (EEPi+2) and TDP3 (EEPi+3). In the first part of this study, extreme precipitation indices were examined, whereas the temporal analysis of the EEPs patterns was conducted in the second part. For each gauging station, the dominant frequency needs to be figured out, i.e., the precipitation pattern with peak frequency value, by comparing the accumulated frequencies of the three TDPs and 1-day EEP. The frequency with the highest amount of accumulated precipitation is considered as dominant one for identical frequencies, or the dominant one can be the precipitation with a higher value of averaged concentration ratio in case of indistinguishable amounts of accumulated precipitation.

2.6. Return Levels Estimation of EEP

The estimation of extreme precipitation return levels is important in hydrology to predict the severity of an event for their application in engineering design [26]. The 20, 50 and 100-year return levels are mostly analyzed [31,68] as the dams, barrages, bridges, sewer system and many other hydraulic structures are designed for more than 20, 50 or 100 years [68]. Different techniques have been found in the literature to deal with the precipitation estimations and their return levels. Amin et al. (2016) compared the Normal distribution, Log-Normal distribution, Log Pearson type III distribution and Gumbel distribution in the lower reaches of upper Indus basin for the rainfall estimation and found the Log-Pearson type III distribution to be the best among of the four said techniques [90]. In general, the generalized extreme value (GEV) theory for extreme climate events found appropriate dealing with the data, which consist of a set of maximums, among the different techniques cited in the literature as GEV theory, three-parameter Log logistic distribution, Log Pearson Type III and three parameters Lognormal because of theoretical and practical applications [91,92,93,94,95,96,97,98,99,100]. Though, only consideration of the maximum could overlook some important information [101,102]. In 1975, Pickands introduced the Generalized Pareto distribution (GPD) [103] that is based on the peaks over threshold (POT) procedure, which proved best to overcome the said issues because of more accurate parameters estimation after generating a larger extreme precipitation data sample [101,102,104,105]. This technique selects the extreme events more rationally instead of considering simply one event each year in the case of maxima method [106] as, in some years, second or higher order extremes might be larger than the annual extremes in other years [107]. The GPD became a well-known technique and has been widely used in the recent studies to deal with extreme events and their return levels [26,31,93,100,108,109,110,111]. Therefore, the precipitation extremes for the 20 and 50-year return levels are also predicted for the NHPK using GPD. Generalized Pareto distribution (GPD) is employed to estimate the return levels in the study area, as EEPs could occur more than once a year. The GPD is a well-known technique for analyzing extreme precipitation behavior with multiple precipitation extremes occurrence in a year. [31,111].
F ( x ) = { 1 ( 1 k ( x μ ) / σ ) 1 / k , k 0 1 e ( x μ ) σ , k = 0
σ, μ and k in the above equation are the scale, location and shape parameters, and the return level XT for T-year is computed as:
X T = { μ ^ + σ ^ ( 1 ( 1 / T ) k ^ ) / k , k ^ 0 μ ^ + σ ^ log ( 1 ( 1 / T ) , k ^ = 0
where σ ^ , μ ^ and k ^ represent the estimated scale, location and shape parameters, respectively. The shape, scale and location parameters are estimated by using L-moment technique as applied in recent studies and have proven to be a more accurate technique to estimate these parameters [26,109,112,113,114,115]. Moreover, the effects of sample size on the fitting are eliminated by carrying out the bootstrapping of the EEP series for each station during the estimation of return levels [116], and the Kolmogorov–Smirnov test is applied to evaluate the goodness of fit at a 0.05 significance level [117].

3. Results

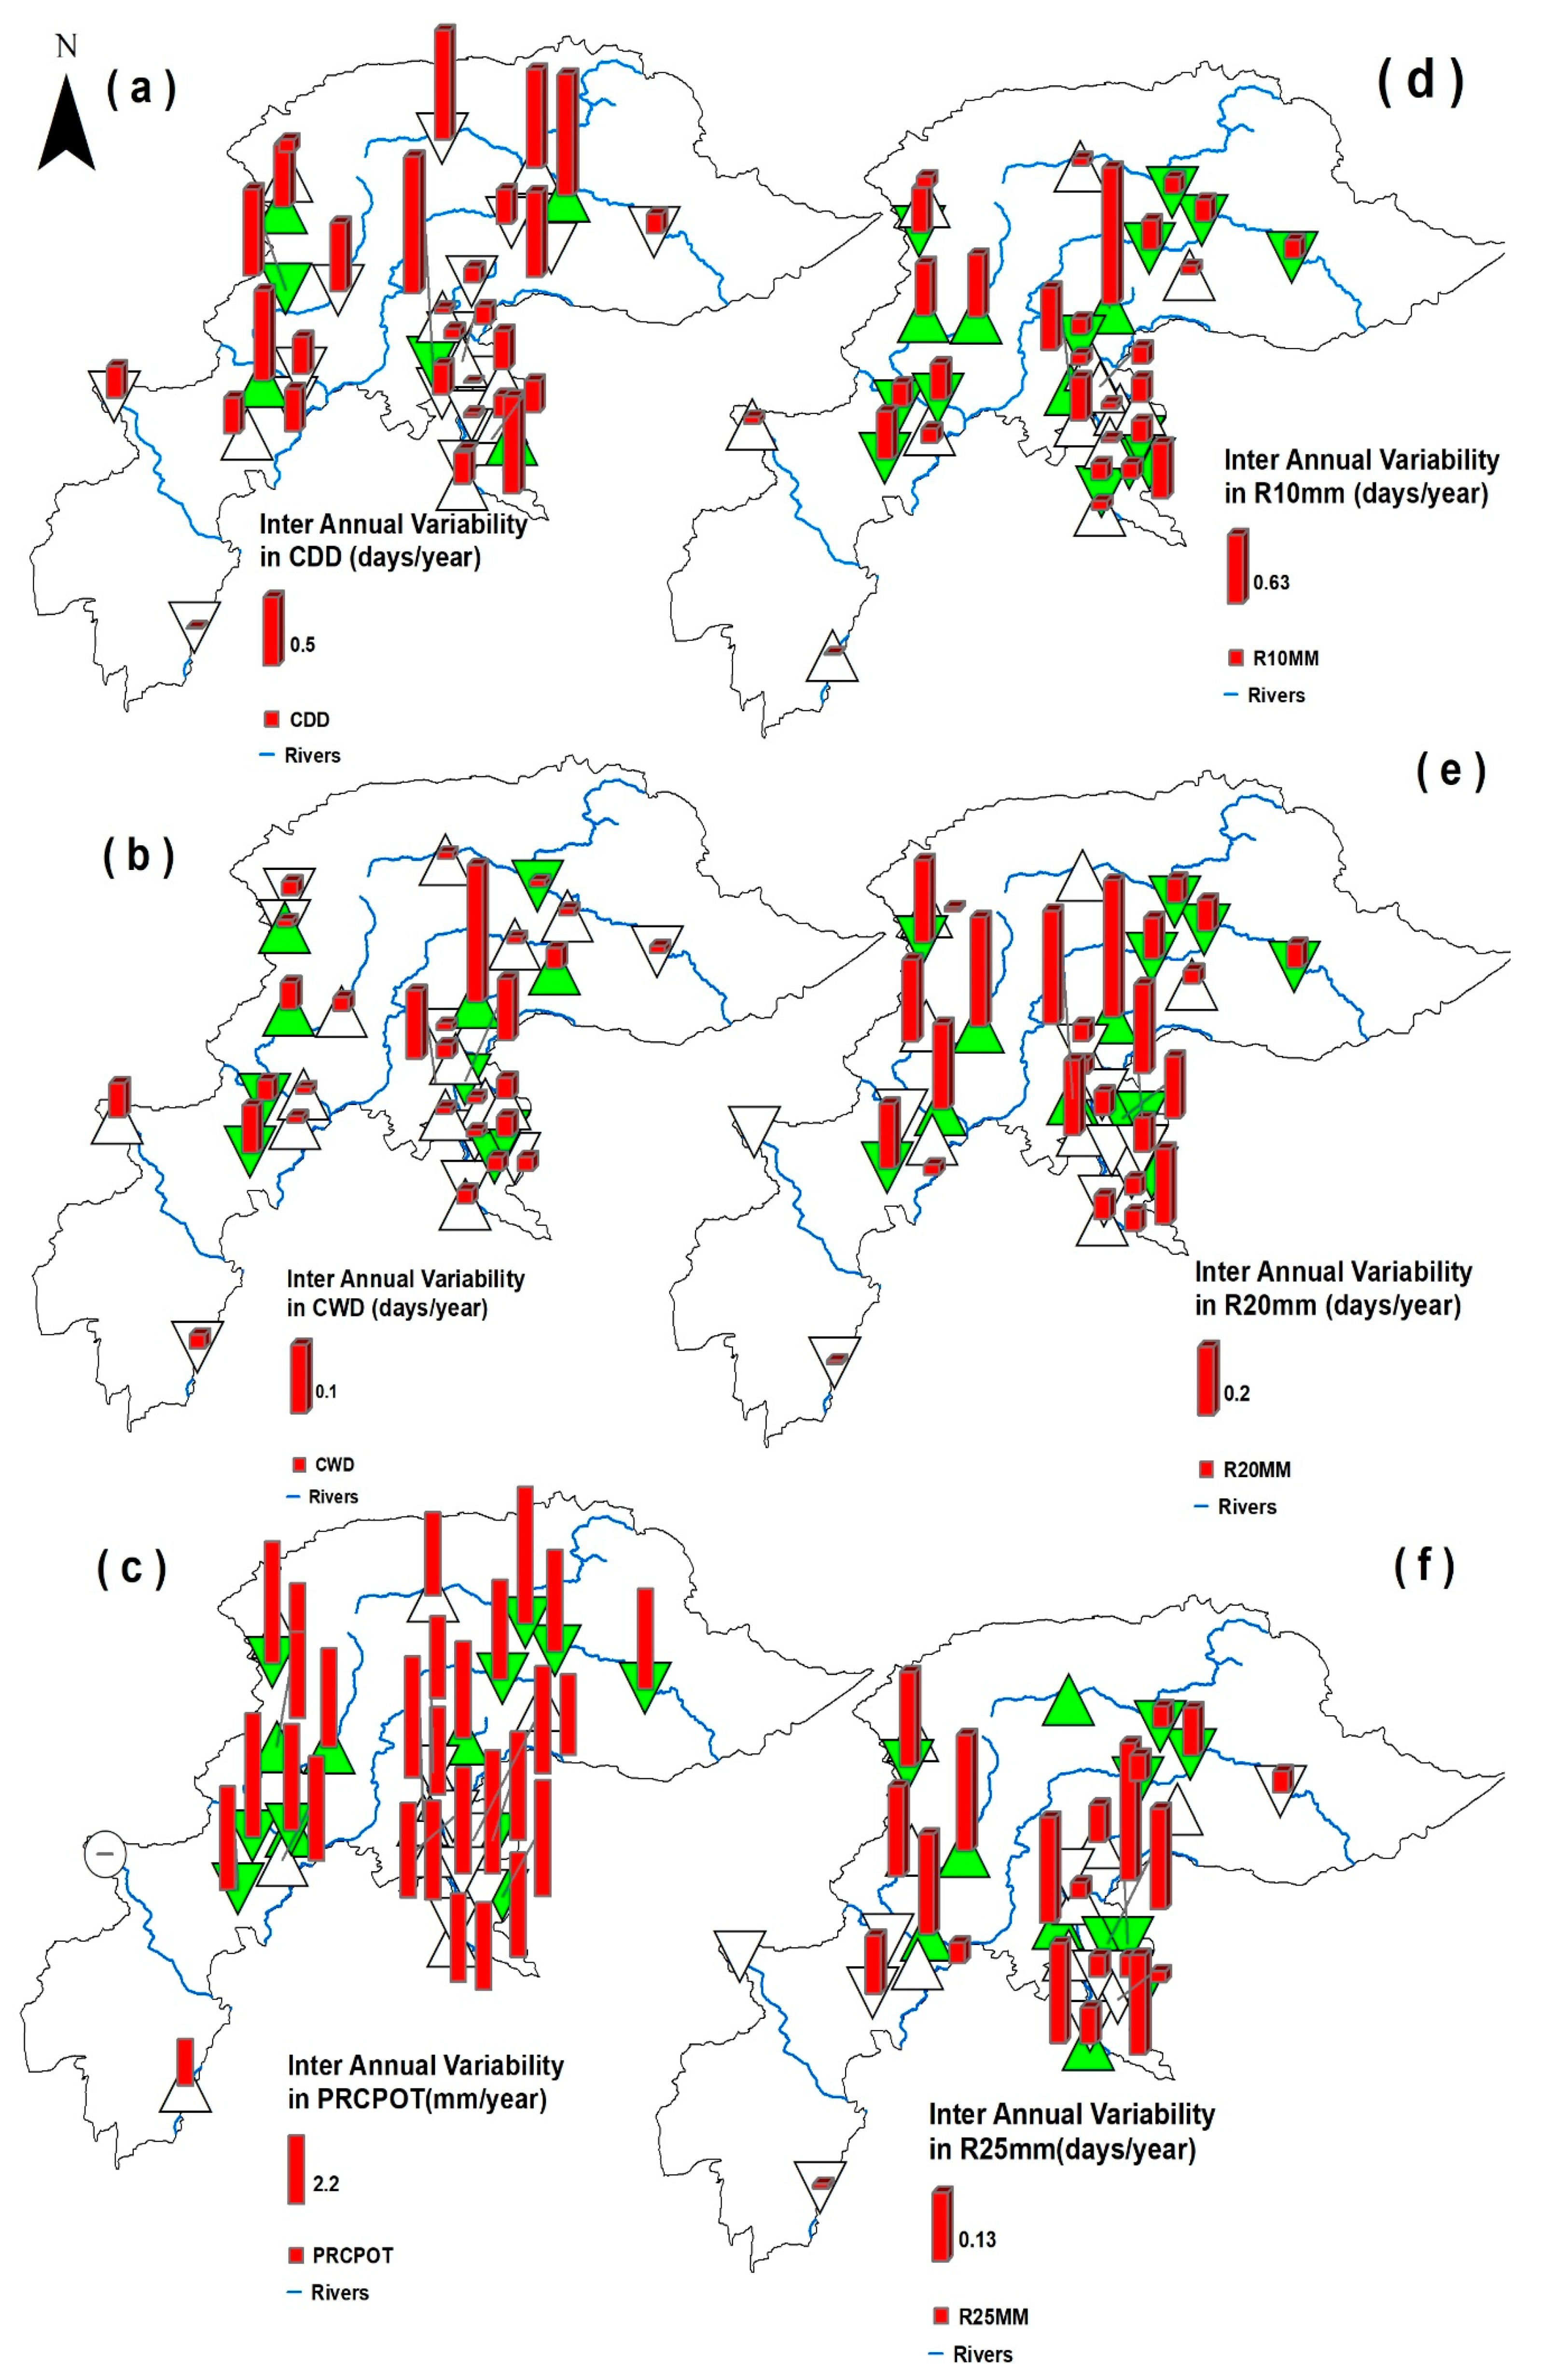
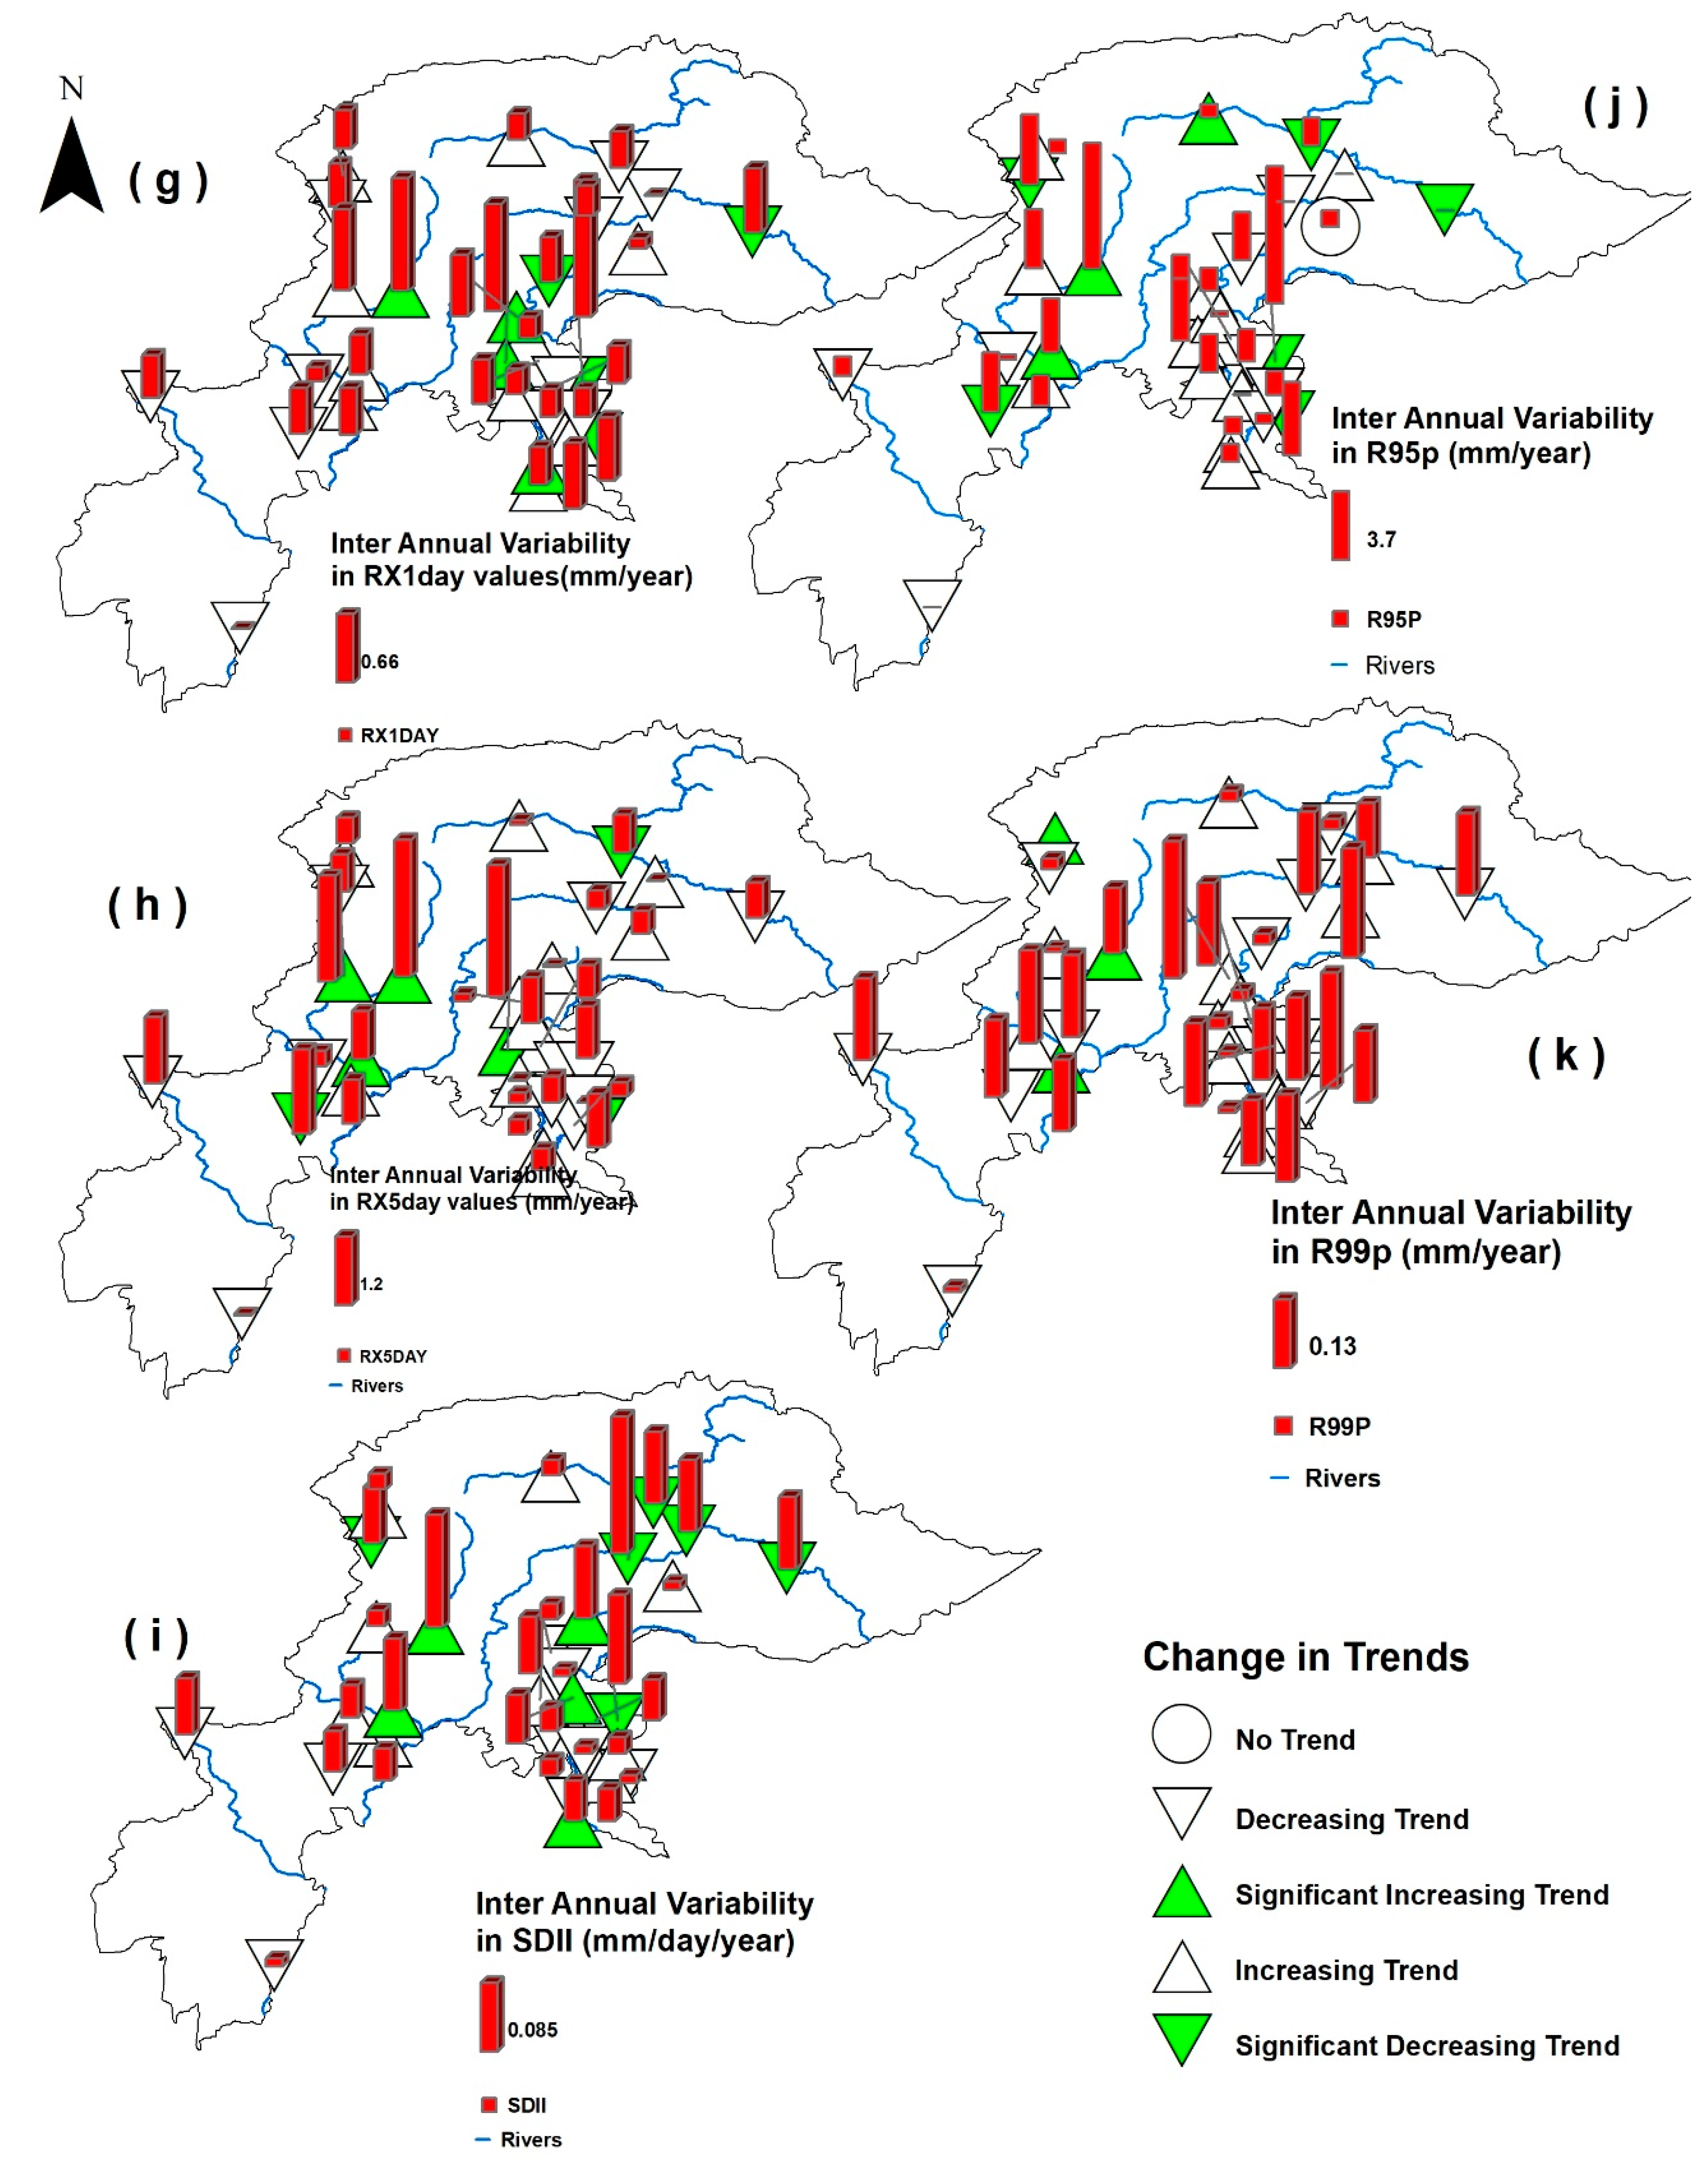
3.1. Change in Annual Precipitation Extreme Indices

The averaged trends of precipitation indices for different gauging stations in the NHPK are presented in Table 2 from 1960–2014. The number of stations depicting positive, negative and stationary trends out of the total number of data series for NHPK are also presented in Table 2, while spatial distributions of these trends along with their magnitudes are presented in Figure 3. The fixed threshold indices (R10mm, R20mm, R25mm, CDD and PRCPOT) showed a decreasing trend, while CWD showed an increasing trend in most of the gauging stations located in the NHPK (Table 2). Station related threshold and non-threshold indices presented heterogeneous trends at the majority of stations (Table 2). Figure 3 presents the precipitation indices estimated for the NHPK along with their significantly increasing and decreasing, insignificantly increasing and decreasing and stationary trends.

Spatio-Temporal Patterns of Extreme Precipitation Indices

In the NHPK, the patterns of trends of CDD were heterogeneous, and heterogeneous positive and negative trends were irregularly distributed in space with significant positive trends in the stations located up-stream of Indus and Jhelum Rivers and in the down-stream of Chitral and Swat Rivers; the magnitude of the CDD trends was between 0.37–0.89 days/year (Figure 3a). For the stations located in the other portions of the study domain, the increasing and decreasing trends in the CDD were statistically insignificant (trends ranged from −0.99–0.37 days/year). The CWD showed significant negative trends (about −0.05 days/year) at six stations out of ten depicting significant trends (Figure 3b), specifically the down-stream of the Swat River and upstream of the Jhelum River, while a significant positive trend, with 0.05 (days/year) increasing rate, was observed in the stations located in the Neelum River periphery. The majority of stations located in the NHPK showed increasing trends in CWD. Annual total wet days precipitation (PRCPOT) showed a heterogeneous positive or negative slope, with a significant decreasing rate of −4.3 to 0 mm/year in most of the stations of the NHPK, specifically in the Hunza and Swat Rivers peripheries. The stations located in the periphery of the Panjkora and Kunhar Rivers showed significantly increasing trends in PRCPOT (Figure 3c), with increasing rates up to 3.9 mm/year.
Spatial and temporal maps of the R10mm presented heterogeneous significant and insignificant negative trends, with a decreasing rate of up to 0.9 days/year, for the stations located in the entire periphery of the NHPK (Figure 3d). The stations situated in the periphery of the Panjkora River and the upper portion of the Swat River showed a significant increase in the R10mm, at the increasing rate of 0.01–1.2 days/year. The R20mm had decreased significantly in the station situated in the southeast (upstream of Indus basin), southwest (Chitral river), east (upstream of Jhelum river) and downstream of the Swat River, with an overall decreasing magnitude of −0.2–−0.1 days/year (Figure 3e), whereas the R20mm had increased significantly by 0.4 days/year in the stations located at the periphery of Kunhar and Panjkora Rivers. Generally, the number of extremely heavy precipitation days (R25mm) was decreased significantly (up to 0.06 days/year) for the stations in the southeast (upstream (u/s) of Indus) and east (u/s of Jhelum) of the NHPK (Figure 3f). A significant increasing trend (up to 0.22 days/year) was observed at some stations of the Panjkora, Swat and Jhelum Rivers periphery for R25mm, whereas the stations located at other portions of the NHPK showed insignificant heterogeneous positive and negative patterns.
The RX1day depicted heterogeneous positive and negative trends at the majority of the stations in the NHPK periphery (Figure 3g). Figure 3g depicted that the significant positive slopes were observed at the station located in the periphery of the Panjkora and Jhelum Rivers, whilst a significant decrease was observed in the east of the NHPK (u/s of Jhelum River) and at the higher periphery of the Indus river (by −0.1 mm/year). The RX5day, for the most of the stations across the NHPK was increased significantly in the western (near Panjkora River), central (downstream of Swat River) and eastern (near the junction of Neelum and Jhelum Rivers) parts of the NHPK (Figure 3h) by 0.5–1.8 mm/year. A significant negative trend in RX5day was detected at the stations located in the area between the Swat and Kurram Rivers, at the junction of Hunza and Gilgit Rivers and at the eastern periphery of the NHPK (u/s of Jhelum River), with decreasing magnitude of −1.5 to −0.8 mm/year. The rest stations of the NHPK showed heterogeneous increasing and decreasing trends.
The majority stations of the NHPK reflected a significant decline in the SDII, explicitly at the stations located at the upper periphery of the Indus and Chitral Rivers, and at the eastern parts of the NHPK (u/s of Jhelum River), by −0.01 mm/year (Figure 3i). In contrast to a significant decrease, a positive development in the slope was observed at the stations located in the middle of the Panjkora and Swat Rivers and at the upper and lower portion of the Jhelum River (with up to 0.14 mm/year increasing gradient). The remaining stations of the NHPK reflected a mix of insignificant increasing and decreasing trends.
The very wet days (R95p) at the stations of the NHPK showed heterogeneous patterns of positive and negative trends (Figure 3j) with lower and higher levels of significance. The R95p frequency index was decreased significantly and non-significantly at the majority stations of the NHPK with a maximum significant decrease of 3.4 mm/year in the upper periphery of the Indus River (Figure 3j). The maximum significant increase of 4.4 mm/year was observed at the stations located in the middle of the Panjkora River. In addition, the frequency of R95p was significantly increased at the stations located in the upper portion of Gilgit and lower part of the Swat Rivers (by 3.3 mm/year), whilst the rest stations located in the other parts of NHPK depicted insignificant heterogeneous trends. A combination of increasing and decreasing slopes was witnessed at stations located in the NHPK for the extremely wet days (R99p), as presented in the Figure 3k, with a significant positive increase (up to 0.25 mm/year) in the peripheries of the Panjkora, Swat and Chitral Rivers. The stations situated at the northeastern part of the NHPK presented maximum insignificant increasing and decreasing patterns, while the rest of the NHPK stations depicted lower values of insignificant trends.

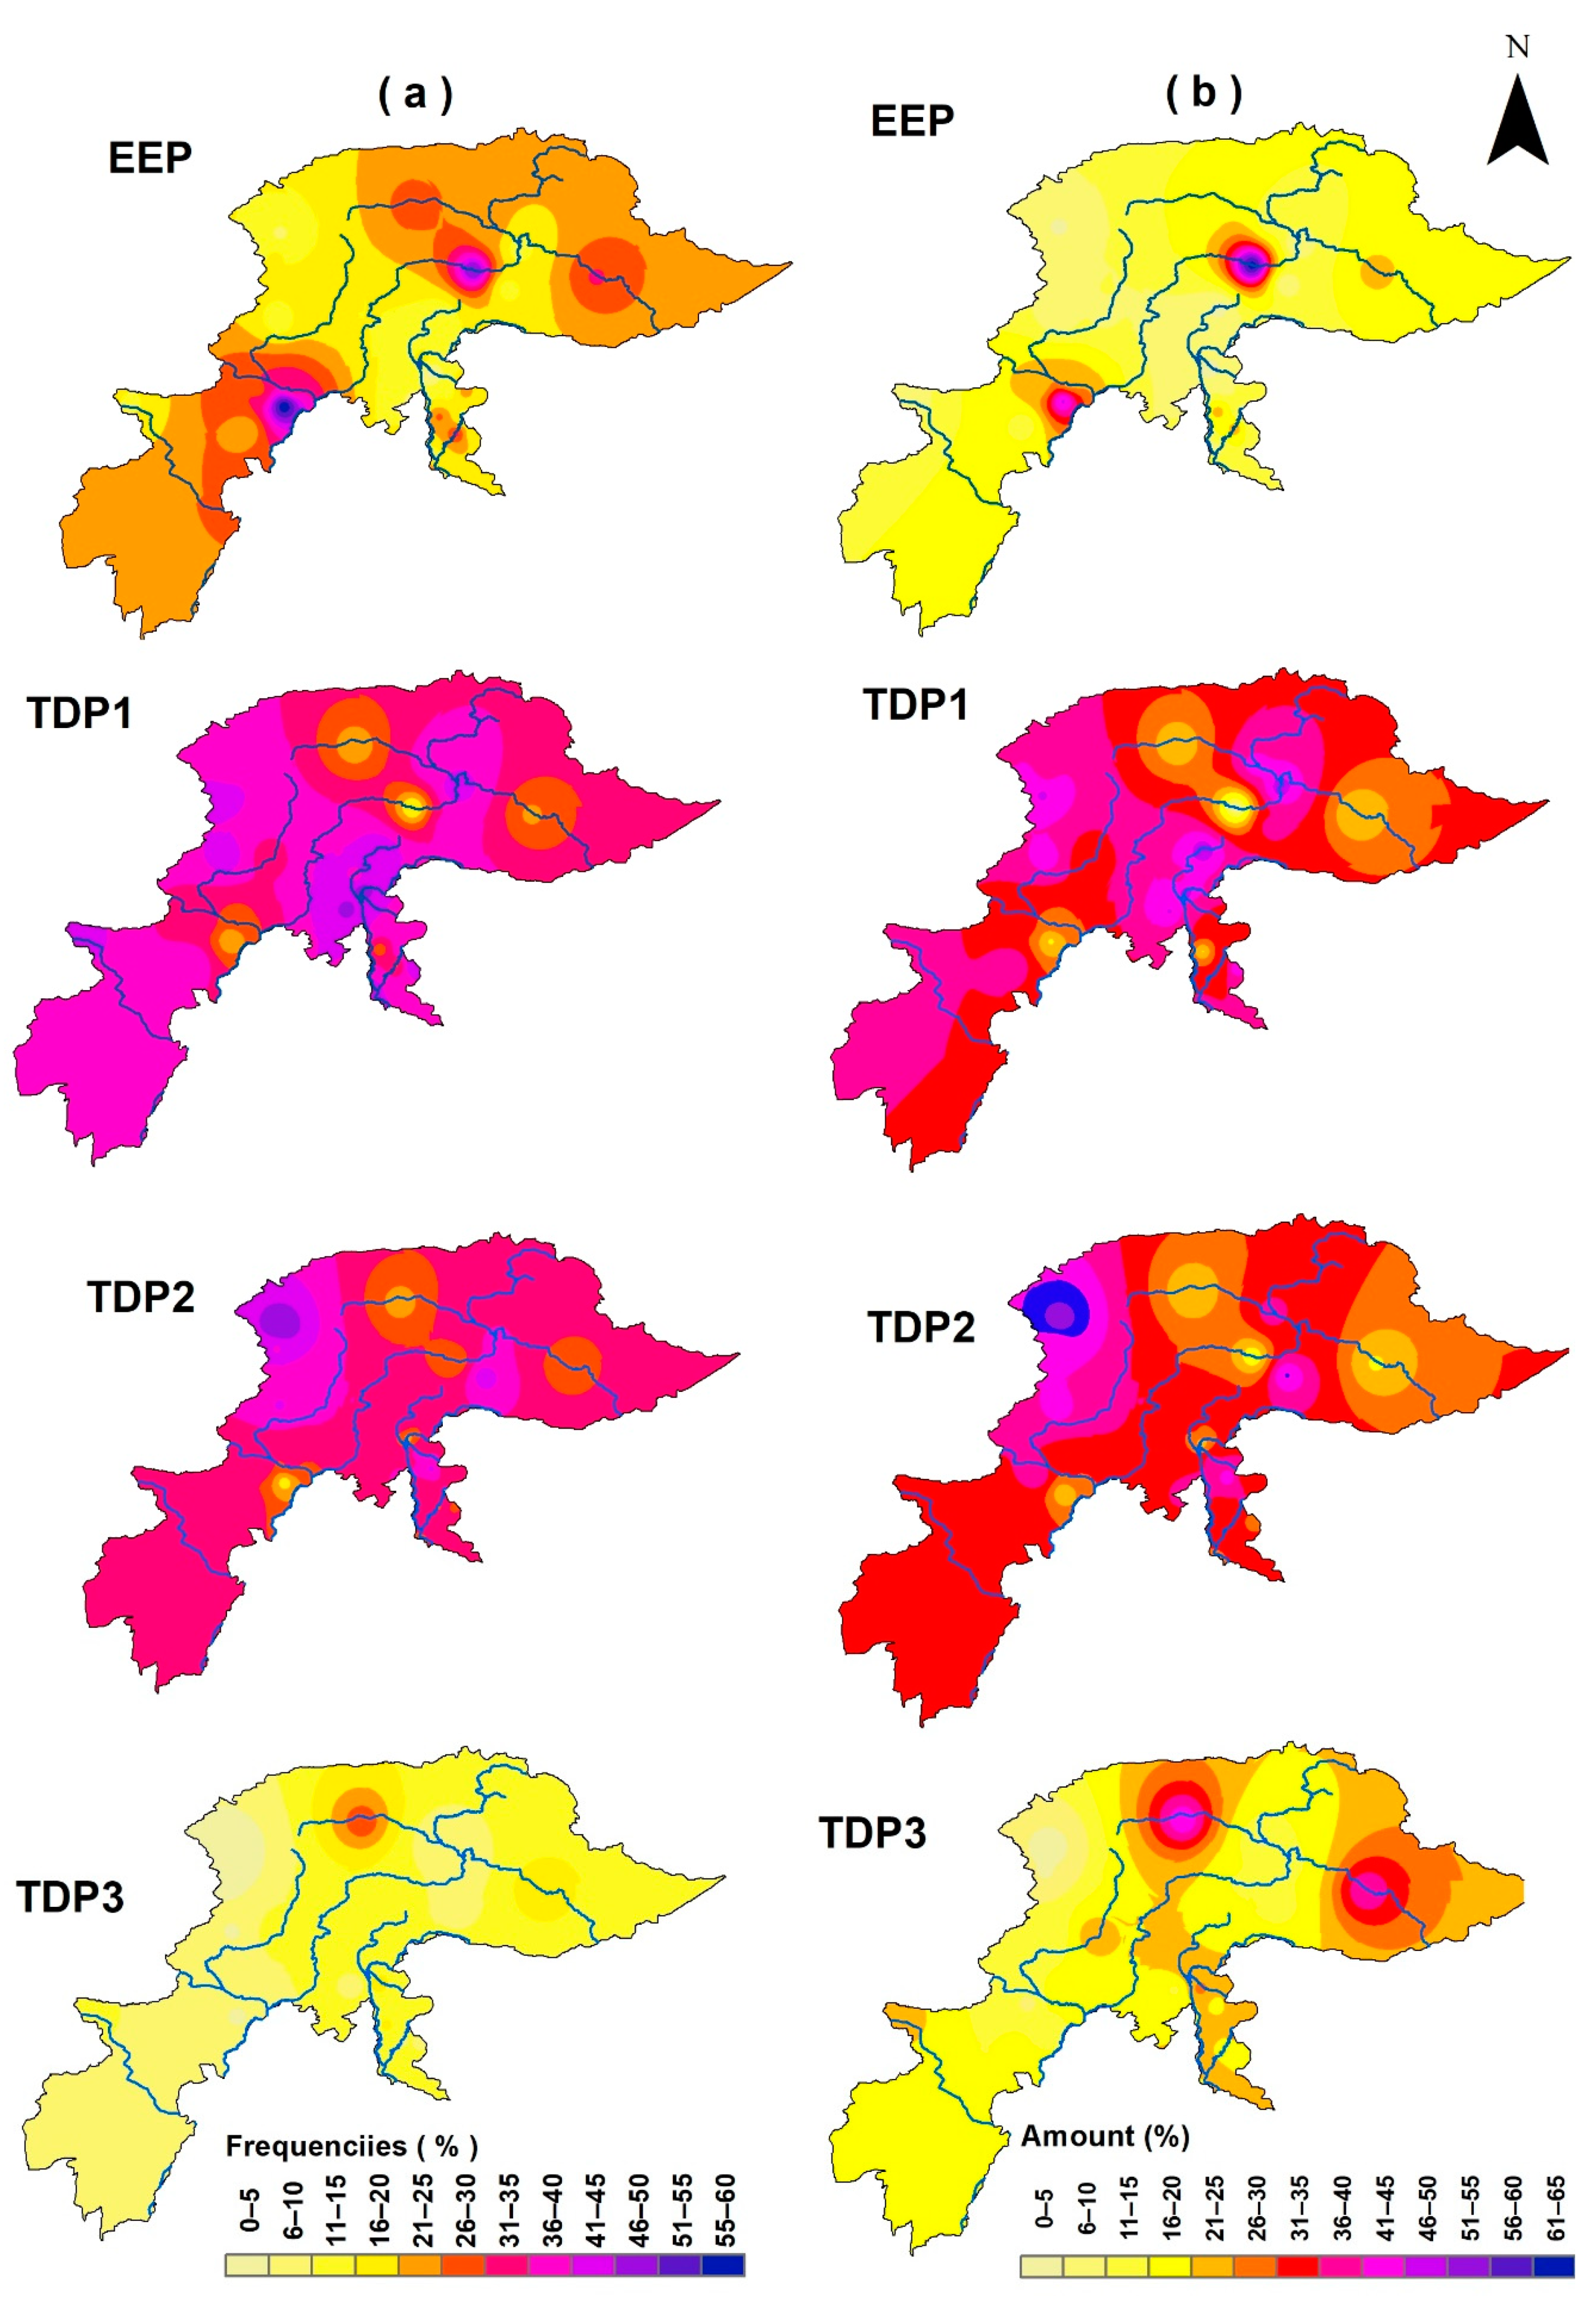
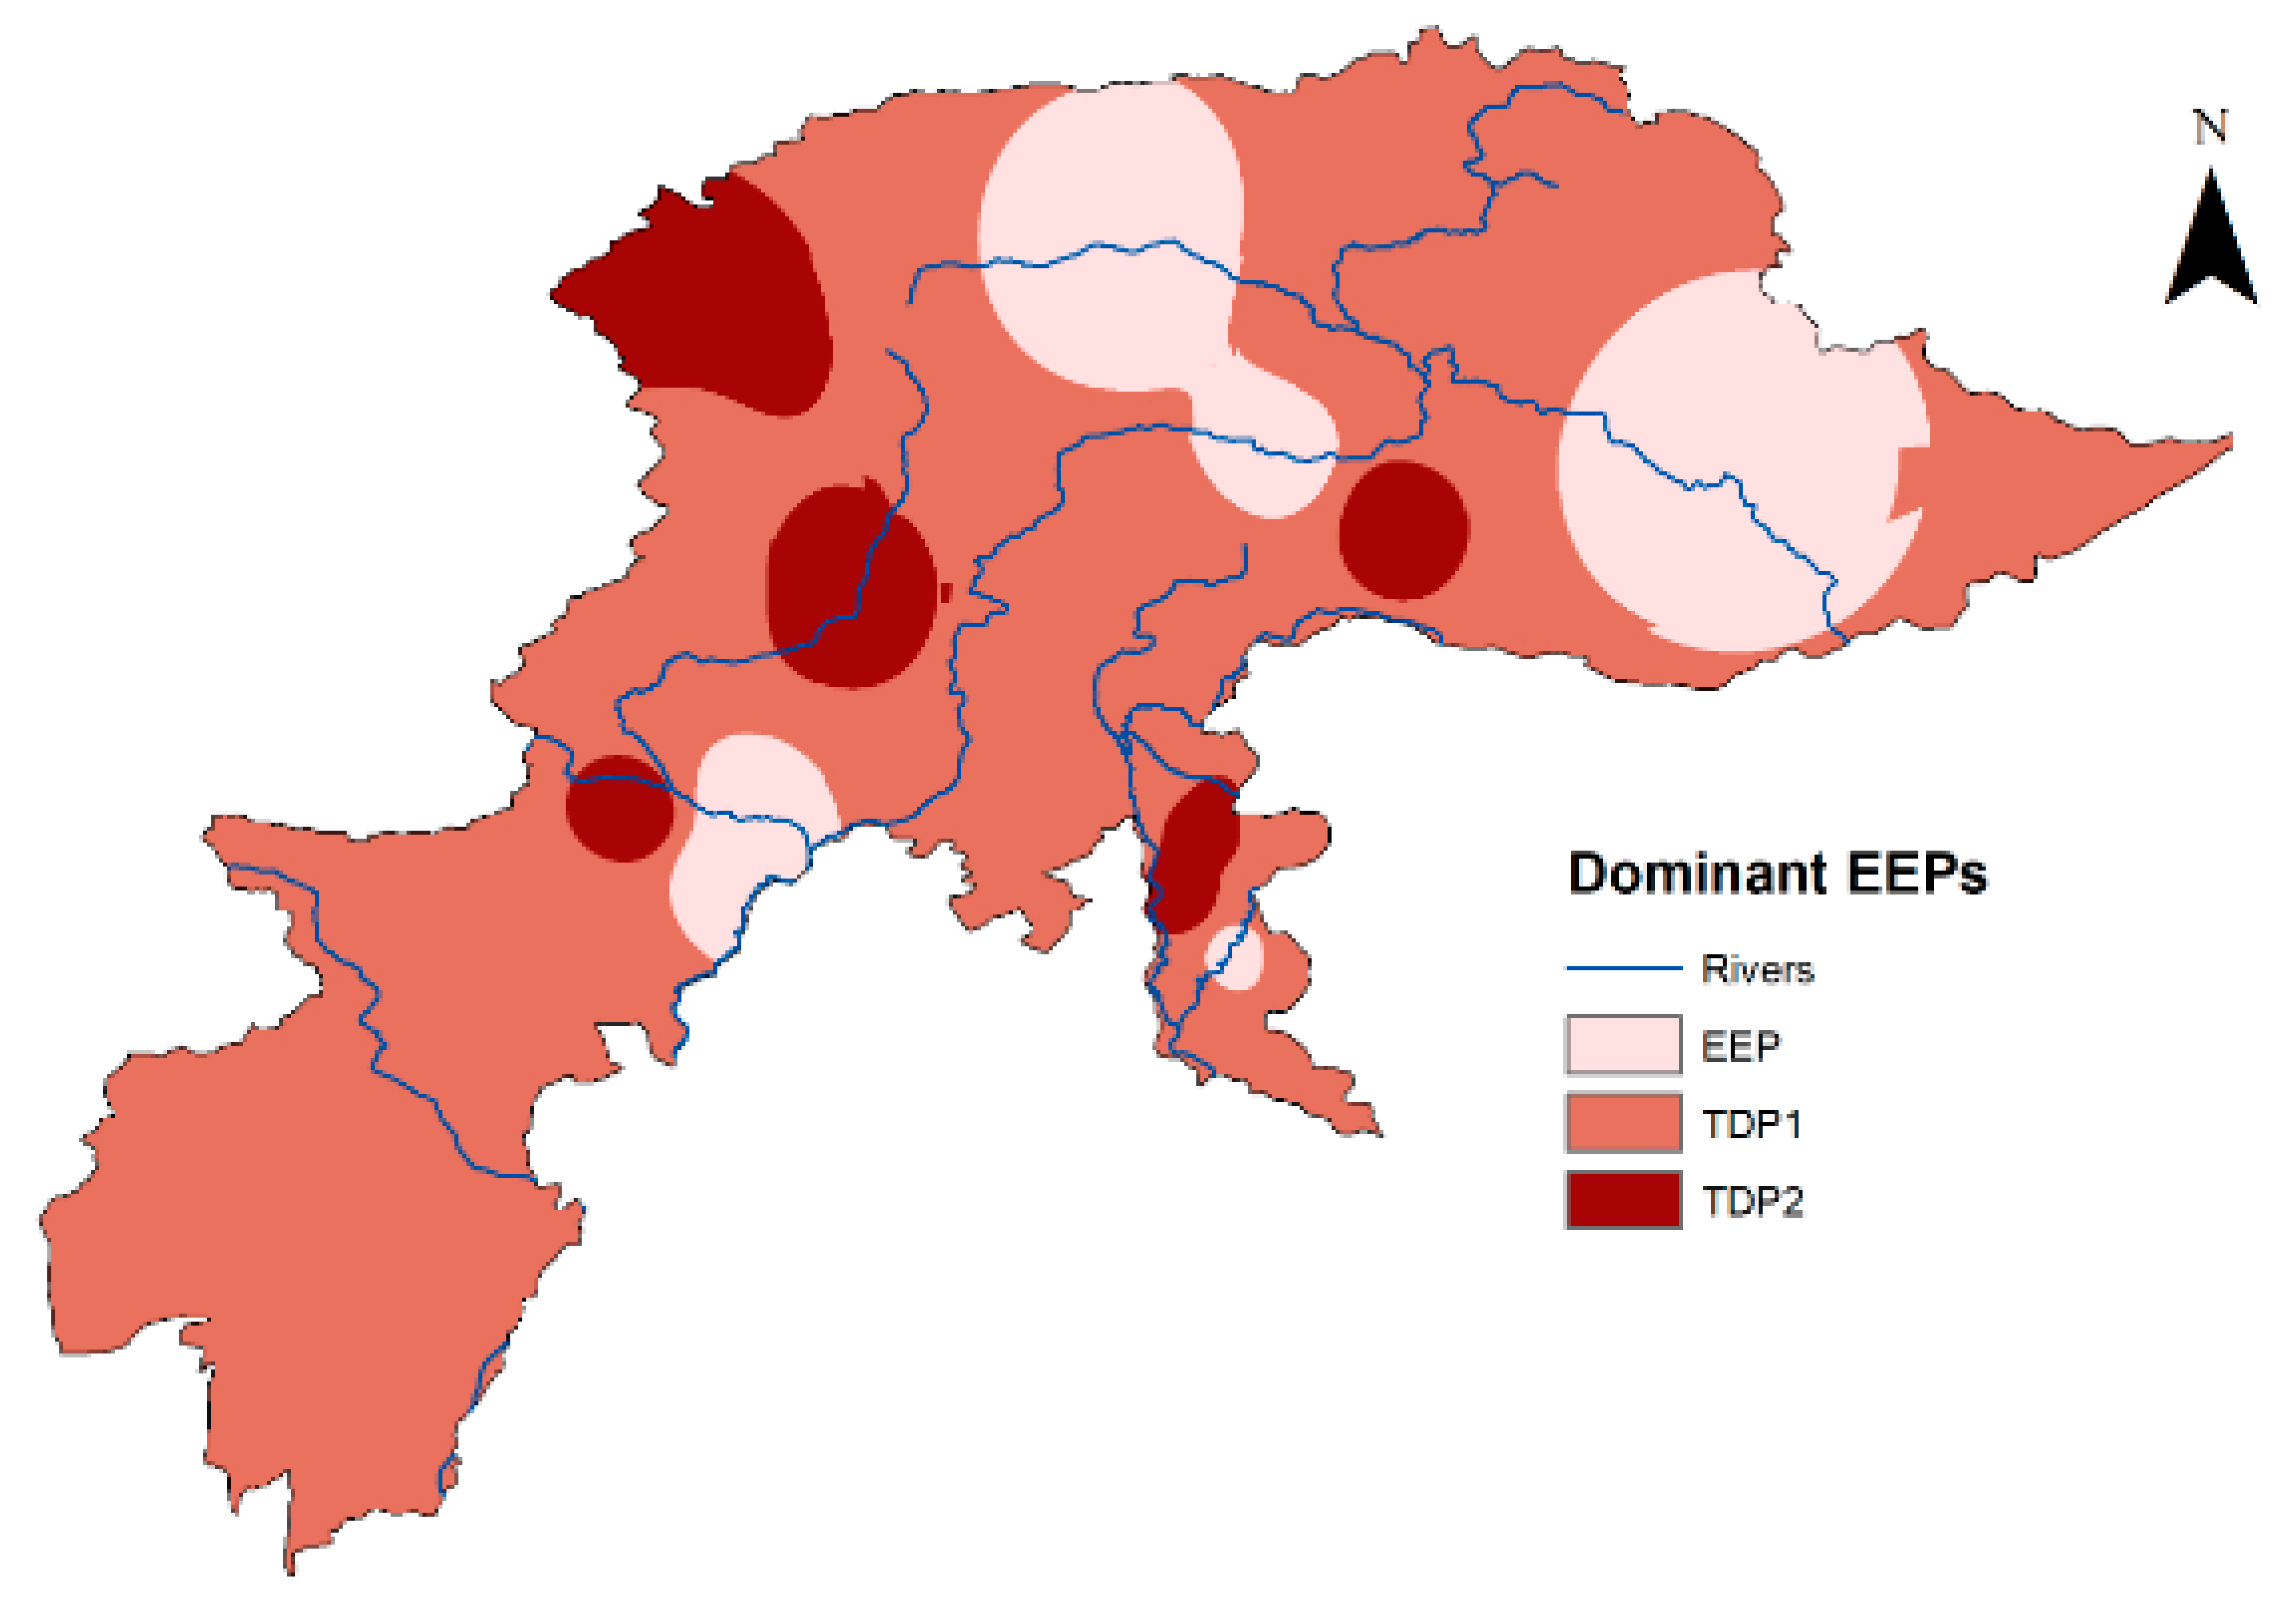
3.2. Supremacy of Different EEP Patterns

Figure 4 and Table 3 demonstrate the percentages of total frequencies and precipitation volume for EEP (1-day) and the three TDPs during the study period. As presented in Figure 4a, for total frequencies percentage, 1-day EEP happened quite persistently, accounting for 21–58% of the total events at different stations across the major portion of the southwest, northeast and northern periphery of the NHPK. Nevertheless, 1-day EEP was less persistent at the stations located in the rest of the NHPK, with lower than 20% in most cases. Regarding TDP1, the percentage varied between 30–47% at mostly stations situated in most of the parts of the study area, except for some portions in the central regions. Stations located in some regions such as in the Gilgit River (near Gupis gauging station), above the Indus River (around Chilas and Skardu) and the Swat River (around Cherat), had lower percentages ranging from 15–22% regarding TDP1. For TDP2, it dominated at a higher number of stations over the northwest (in the Chitral River and upstream of Panjkora River basin), accounting for 40–50% in general and remained between 20–40% in the rest of the region. Conversely, TDP3 seldom occurred in the NHPK with an overall percentage below 26%. Figure 4b portrays the percentages of total precipitation amounts between 1961–2014 for EEP (1-day), TDP1, TDP2 and TDP3 in the form of bar graph for different stations in the NHPK. The patterns of precipitation amounts were approximately identical to those of frequency percentages, displaying that the entire frequency patterns for NHPK were generally consistent with total precipitation amount. A comparison of Figure 4a, b depicted that 1-day EEP contributed more to frequency than precipitation amount across the NHPK, as opposed to TDP3.
The above findings demonstrated that 1-day EEP happened more often with a higher percentage in northeast, north and southwest parts of the NHPK (precisely speaking, at stations located in the upper part of Gilgit and Hunza, and the lower part of the Indus River), whilst TDP1 dominated a higher percentage at stations in the Panjkora, Chitral and Kurrum basins as well as near the conflux point of the Indus, Hunza and Gilgit Rivers. Based on the station-wise comparison as given in Table 3, the most dominant 1-day EEP occurs at the Cherat and Chilas gauging stations.
At the station scale, the patterns of some EEPs demonstrated similar frequencies, e.g., in some parts of the Chitral basin, apparently identical frequencies were witnessed for TDP2 and TDP1. Consequently, the patterns of dominant EEP across the NHPK for the last 54 years were investigated further and are presented in Figure 5. Undoubtedly, TDP1 dominated over maximum part of the NHPK, except at stations in some areas of the northeast (uppermost parts of the Indus basin), northwest (upper and lower part of the Gilgit River) and at the conflux of the SWAT and Indus Rivers, where 1-day EEP prevailed, in accordance with the outcomes presented in Figure 4. Moreover, in the upper Chitral River, the supremacy of TDP1 was less protuberant because of the dominant TDP2. TPD2 also prevailed in some central parts of the NHPK, as presented in Figure 5.

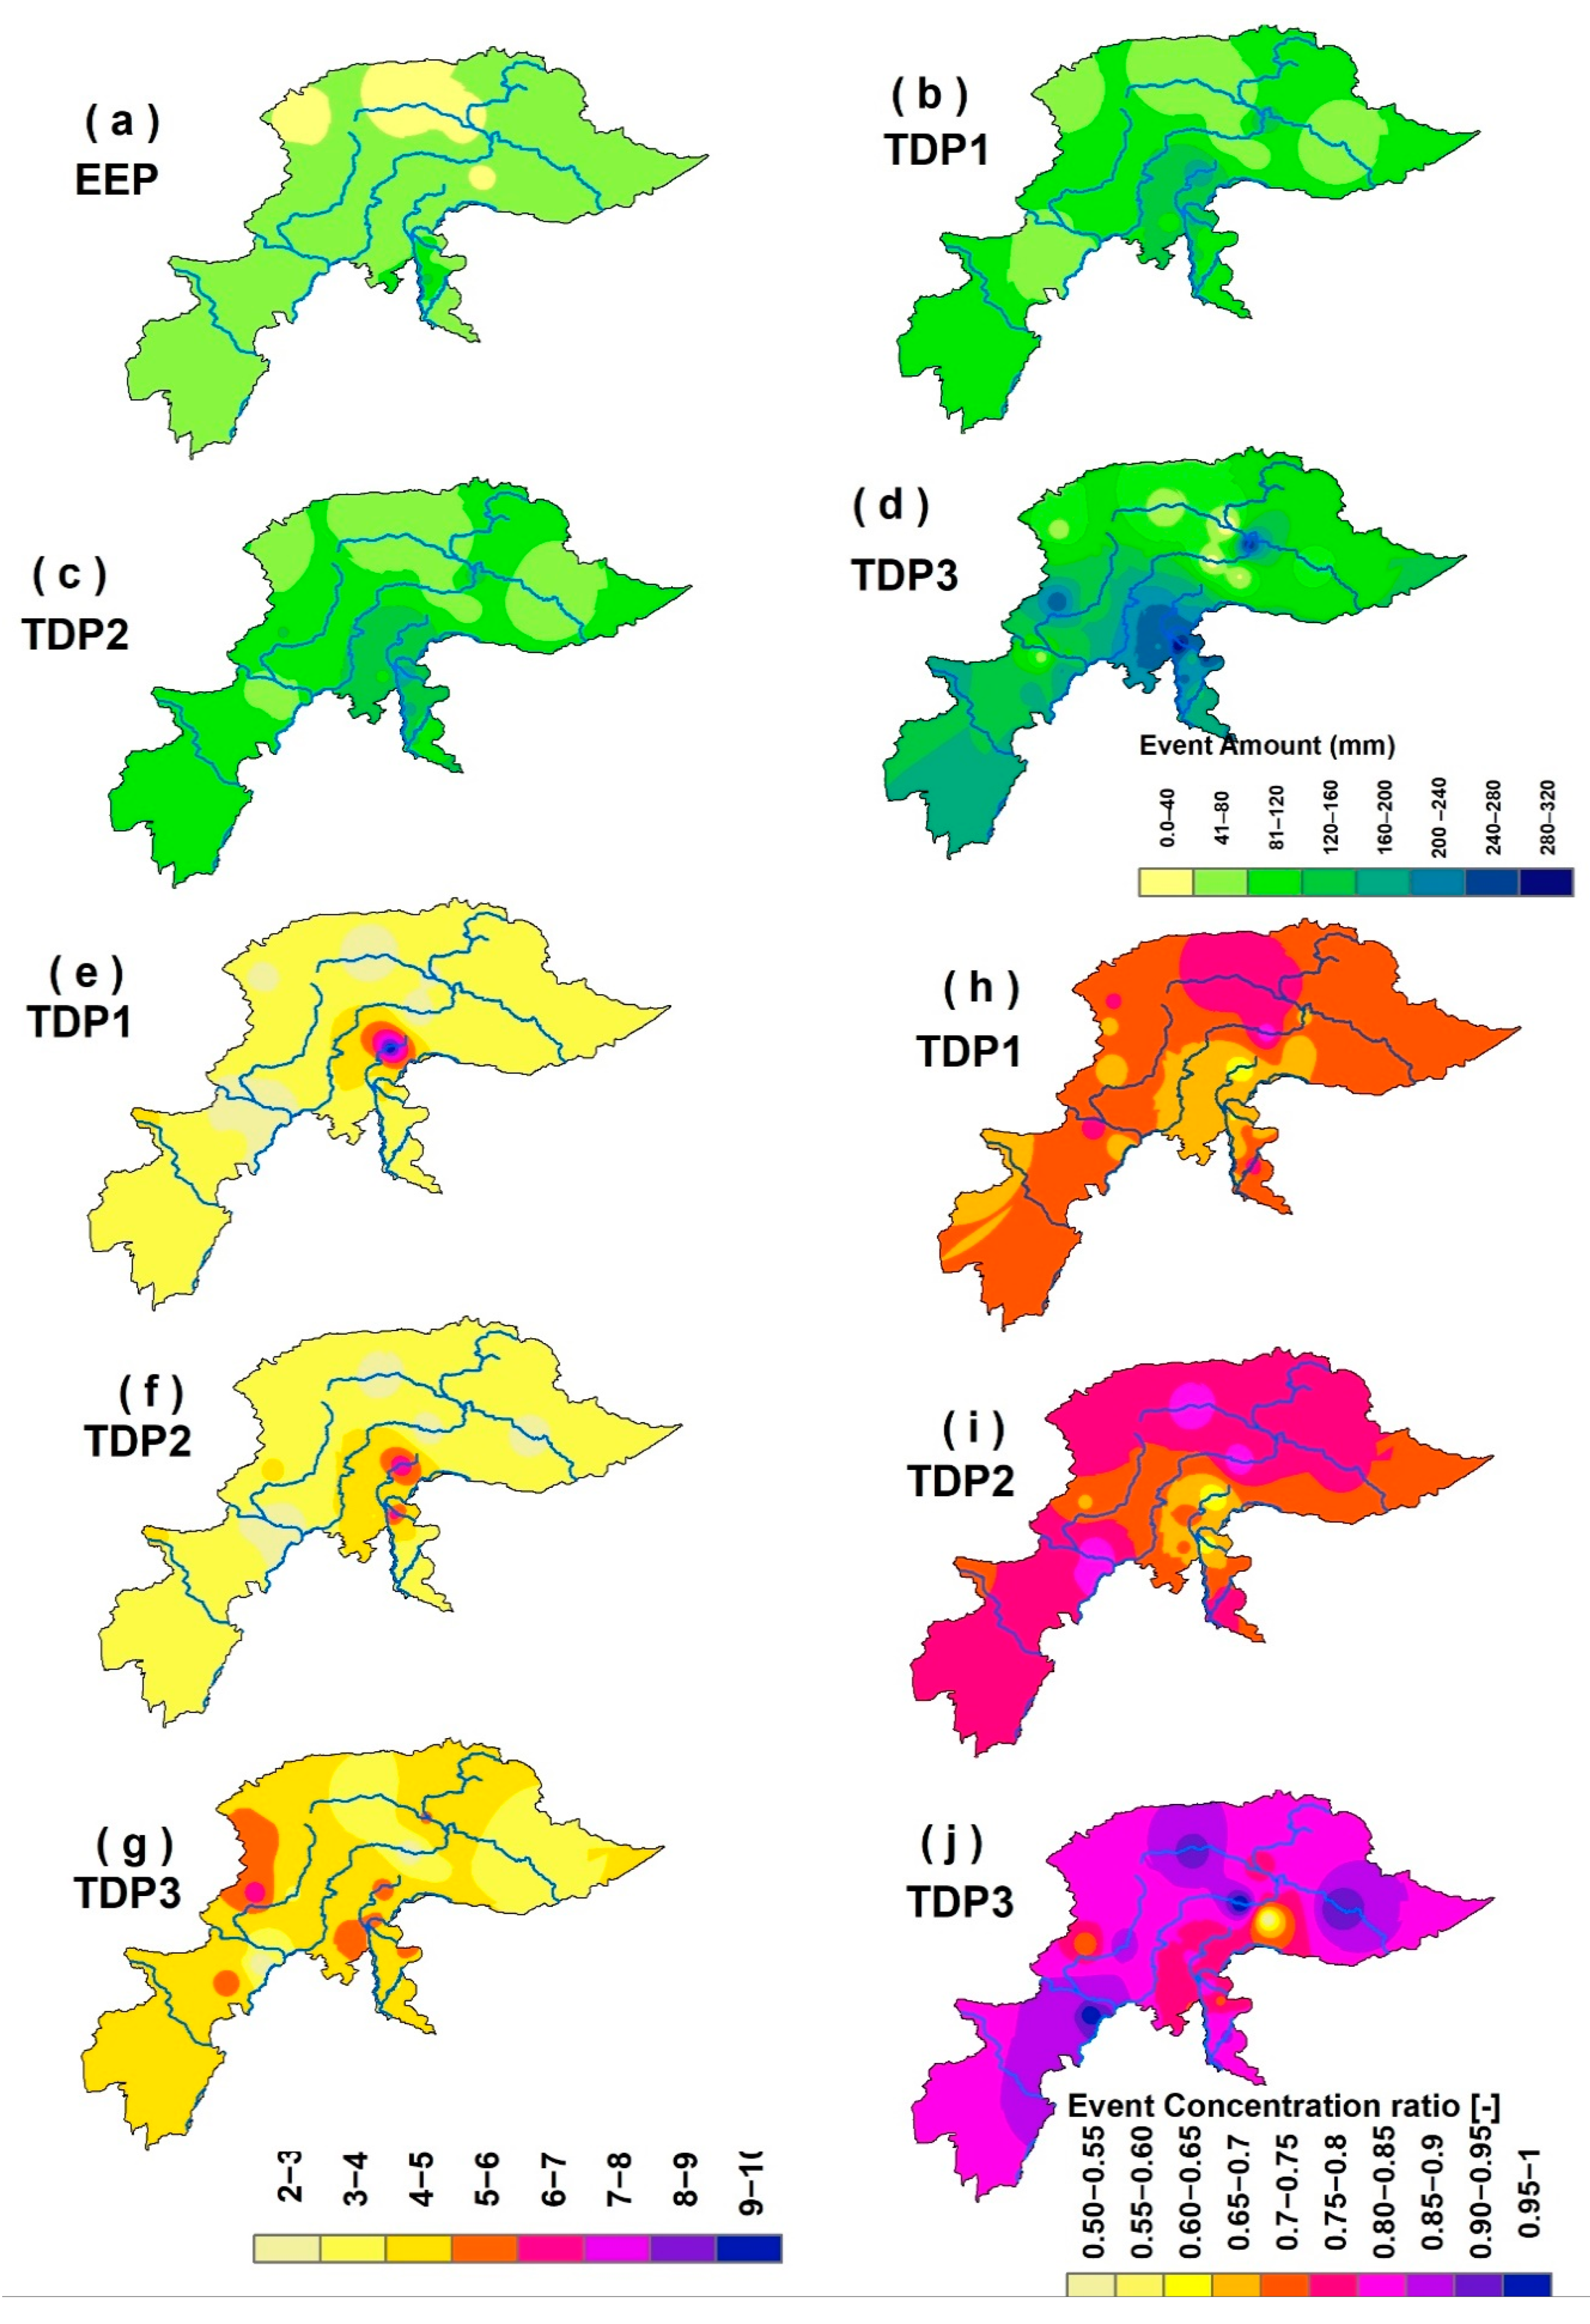
3.3. Long-Term Mean Characteristics

The long-term mean characteristics during the study period of an EEP (i.e., the amount, concentration ratio and duration) across the NHPK are presented in Figure 6 and designated as the event amount, concentration ratio and duration of an EEP, respectively. Different EEP patterns of long-term mean event amount with spatial distributions are mapped (Figure 6a–d). Figure 6a–d demonstrated similar patterns for all the EEPs with an increase in event amount towards the eastern side of the NHPK. Widespread distribution of 1-day EEP event amount lesser than 80 mm was clearly observed over most of the NHPK, but some parts exhibited higher values than 80 mm of an event amount, e.g., in the lower Jhelum River, the event amounts of 1-day EEP was between 80 to 120 mm.
Generally, the event amount for TDP1 in the NHPK was much heavier as compared to 1-day EEP with more than 80 mm event amount. In particular, in the plain between the Kunhar and Neelum Rivers, the event amount was between 140–160 mm. In general, the event amount of TDP2 was approximately consistent with that of TDP1 (Figure 6b). Comparatively, the event amount observed for TDP3 was usually more than 160 mm in NHPK, except at the conflux of the Hunza, Gilgit and Indus Rivers and explicitly, the event amount in the southwest and east was larger than the 200 mm.
Analysis of the event duration (Figure 6e–g) of three TDPs showed that, generally, TDP1 and TDP2 could last shorter than TDP3. Overall, the event duration of TDP1 and TDP2 could not last more than 4 days throughout the periphery of the NHPK. In contrast, TDP3 might last up to 5 days in the NHPK territory. In general, extreme long event duration was mainly observed in the eastern portion of the NHPK at the conflux of the Neelum and Kunhar Rivers for all TDPs. The extreme precipitation event durations of all three TDPs were more than 5 days and TDP1 could last up to 10 days, particularly at the upper reaches of the Kunhar River. Moreover, in the Chitral River periphery, TDP3 also could last longer than 5 days.
Figure 6h–j maps the geographical distribution of the long-term mean event concentration ratio patterns of different EEPs (TDP1, TDP2, TDP3) and their magnitudes. In general, the three TDPs depicted more than a 0.7 value of concentration ratio, and TDP3 had a concentration ratio value more than TDP1 and TDP2. Moreover, TDP2 depicted higher concentration values than TDP1. Specifically, values of event concentration ratios for TDP1 were higher than 0.7 throughout the territory of the NHPK with a little lower value near the conflux of the Kunhar and Neelum Rivers in the east. In contrast, TDP2 was featured with higher concentration ratios over the NHPK, with magnitudes more than 0.75, except for the central parts with a concentration ratio value lower than 0.75. A conspicuous outcome is that the TDP3 in the upper Indus and lower part of the Gilgit and Swat Rivers confirms an event concentration value of more than 0.9. Except for that, the remaining part of the NHPK showed the event concentration ratio value of more than 0.8, in general.

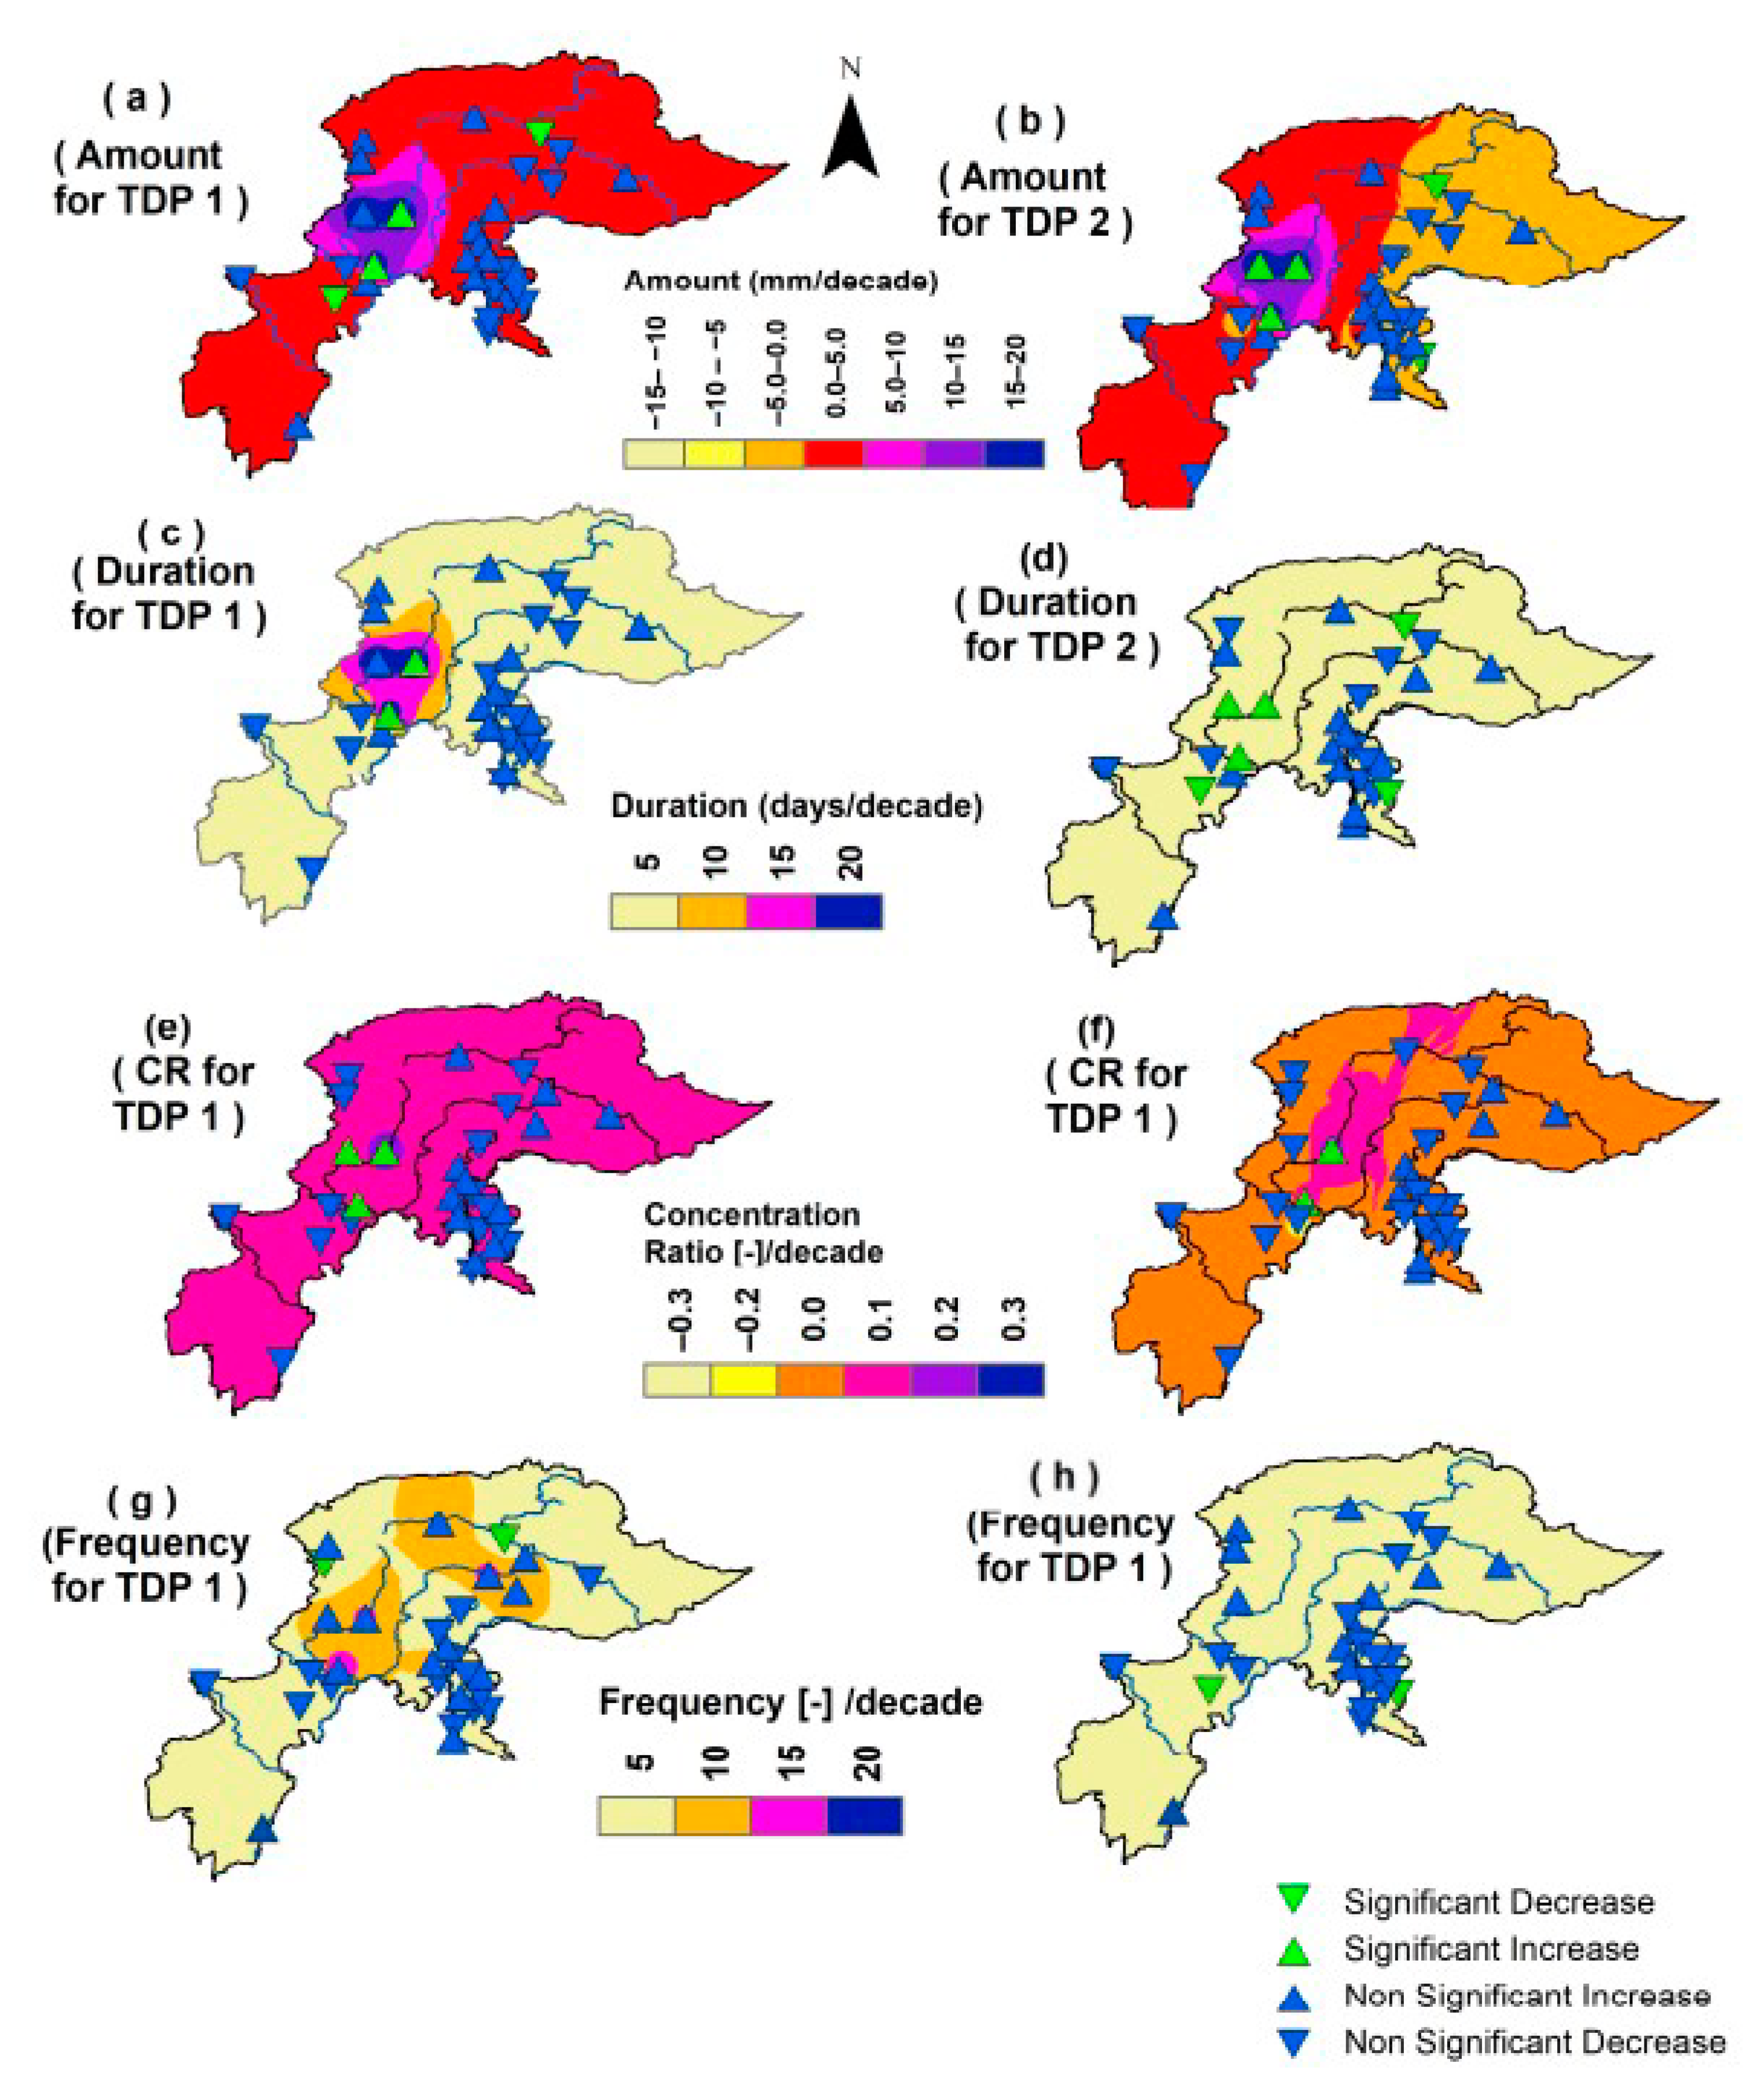
3.4. Spatio-Temporal Configurations of EEPs Trends

The spatial patterns of trends in event-based extreme precipitation indicators of TDP2 and TDP1 over NHPK are inspected as well. The trends patterns of TDP3 and 1-day EEP are not deliberated as they are rarely observed over the NHPK. Results showed a combination of negative and positive trends at different stations in four indicators (duration, amount, frequency and concentration ratio) for TDP2 and TDP1 (Figure 7). In general, a higher magnitude of TDP1 over the NHPK than those of TDP2, concurrent with significant trends of TDP1, were detected compared to TDP2.
Overall growth rates of the four indicators termed as the event amount (Figure 7a,b), duration (Figure 7c,d), concentration ratio (Figure 7e,f) and frequency (Figure 7g,h) of both EEPs were generally within the range of −15 to 20 mm/decade, 0–20 days/decade, −0.3 to 0.3/decade and 0–20/decade, respectively. The significant trends of the event amount were detected for TDP1 and TDP2 in the west of the NHPK (Figure 7a,b) and upstream of the Swat River with its maximum value between 10 to 20 mm/decade, whereas non-significant trends patterns were sporadically distributed heterogeneously. Generally, the NHPK presented non-significant decreasing trends of duration for TDP1 and TDP2 with trends magnitude between 5–10 days/decade in the majority of the parts of the study area (Figure 7c,d). In the western part of the study domain, upstream of the Swat River, the growth rates of the duration of TDP1 and TDP2 were significantly increased at the rate of 15–20 and 5 days/decade, respectively. In the NHPK, the trends patterns of the concentration ratio were heterogeneous, and a combination of negative and positive signals was sporadically distributed in space with significant positive trends of TDP1 and TDP2 in the upstream of the Swat River with a 0.1/decade increase rate (Figure 7e,f). Most of the NHPK presented an insignificant increase in the frequency with its maximum value of 10 and 5/decade for TDP1 and TDP2, respectively (Figure 7g,h). In the upstream part of the Chitral and Hunza River basins, the significant decrease was observed in the frequency for TDP1, whereas TDP2 reflected the significant decrease in frequency downstream of the Swat and upstream of the Jhelum Rivers.

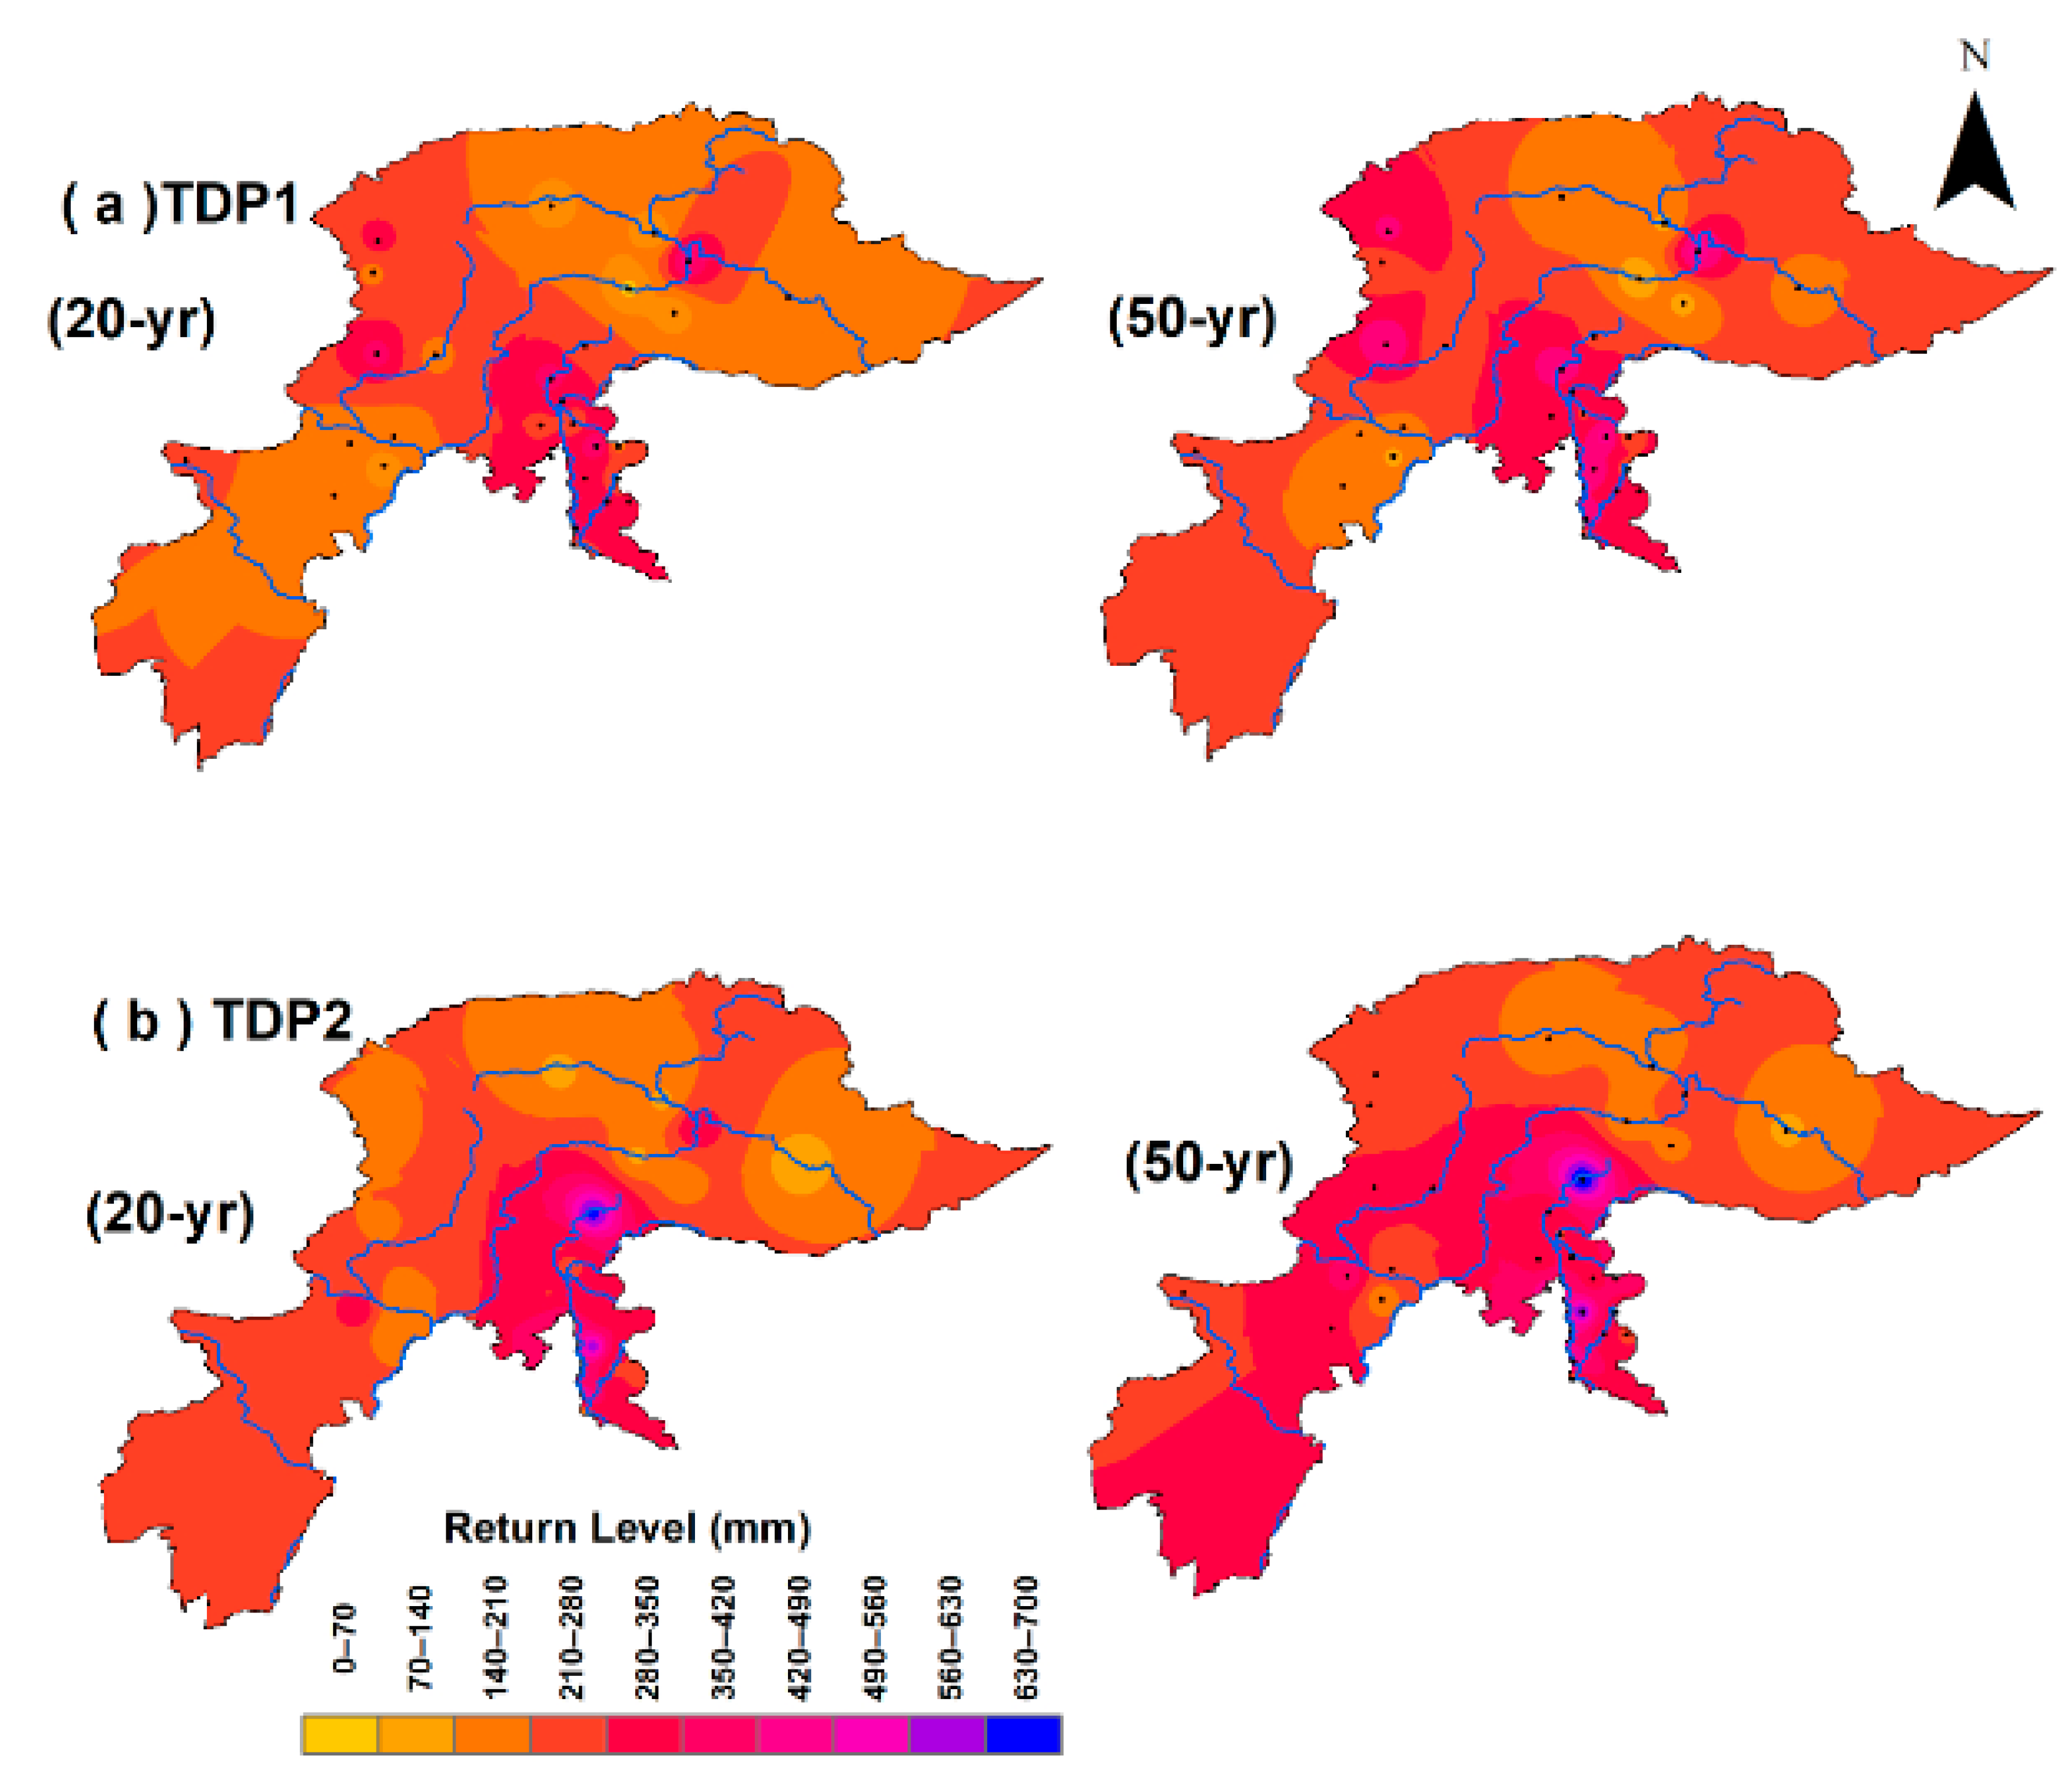
3.5. Return Levels of EEP

The following section contains the 50 and 20-year return levels of TDP1 and TDP2. Notably, TDP3 and 1-day EEP were not taken into consideration in this study because of their rare occurrence. The return levels were examined within 54 years at 20 years and 50 years return levels. Thus, the values that are presented here for 20 and 50 years return levels are the maximum amount of precipitation return levels that can occur within the 20 and 50 years during a precipitation event. As presented in Figure 8a, the return levels for the 20 and 50-year series of TDP1 showed maximum values of precipitation return levels in the Chitral, Panjkora and Jhelum Rivers basins, whilst TDP2 (Figure 8b) presented maximum values of return level in the eastern part of the NHPK for 20-year, and eastern and southwest for 50-year, respectively.
The geographic distribution of return levels (20 and 50-year) of TDP1 and TDP2 showed a low resemblance across the NHPK. Generally, the 20-year return level patterns of TDP2 presented higher values as compared to TDP1, with magnitudes of return levels generally greater than 200 mm and exceeding 400 mm in the most east periphery of the NHPK, downstream of the Kunhar, Neelum and Jhelum Rivers. In comparison to the return level of TDP2, that of TDP1 with higher than 280 mm values, is less extensively dispersed in NHPK. A significant difference was detected among the 20 and 50-year return levels of both of the TDPs across the NHPK. The 50-year return level above 280 mm was extensively detected compared to the 20-year return level above 280 mm. Regionally, the lower part of the Kunhar, Neelum and Jhelum Rivers and some parts of the southwest regions of the NHPK presented 50-year and 20-year return levels more than 400 mm and 280 mm, respectively. Results depicted that in the northern portion of the NHPK, in the upstream of the Hunza River basin, the 50-year return levels were higher for either TDPs than 20-year return levels, with magnitudes higher than 280 mm in general.

4. Discussion

4.1. Significance of Extreme Precipitation Indices

Based on the daily-observed precipitation data of NHPK during 1961–2014, 11 extreme precipitation indices were selected to study the spatio-temporal distribution of precipitation extremes in the area. The majority of the trends are heterogeneous and inconsistent, which present a combination of negative and positive trends. Generally speaking, the majority parts of the NHPK indicate a decrease in the CDD, PRCPOT, R10m, R20m, R25m, R95p and R99p at the rate of −0.99 to 0 (days/year), −4.3 to 0 (mm/year), −0.5 to 0 (days/year), −0.2 to 0 (days/year), −0.25 to 0 (days/year), −4.4 to 0 (mm/year) and −0.2 to 0 (mm/year), respectively, and an increase in CWD, RX1day, RX5day and SDII at the rate of 0 to 0.2 (days/year), 0 to 1.1 (mm/year), 0 to 2.5 (mm/year) and 0 to 0.14 (mm/year), respectively. The positive and negative slopes of these indices spread sporadically in the NHPK and are in close agreement with the previous findings [12,42,43,118,119].

4.2. Rationality of the EEP Concept

The presented results of this study depict that the TDP1 or TDP2 emerges more frequently than the 1-day EEP in the major portion of NHPK, demonstrating that daily extreme precipitation is usually entrenched in long-lasting EEPs. In general, the concentration ratios of TDP2 and TDP1 across NHPK lies between 0.65–0.85, inferring that PSP of 1-day extreme precipitation throughout an event contributes to 15–35% of events total precipitation, emphasizing the statement that PSP of 1-day precipitation extremes across NHPK is frequently significant and must not be overlooked. The presented concept of EEP is almost similar to the extreme precipitation of the real-world and can be helpful to analyze PSP started by 1-day extreme precipitation. The idea is mainly obligatory for the areas categorized by longer-lasting precipitation extremes having a low concentration ratio, i.e., the eastern region of NHPK, at the conflux of the Neelum and Jhelum Rivers [22]. Furthermore, the proposed idea facilitates a novel approach of return level estimation of daily extreme precipitation. To compare the return levels, four stations were selected randomly located in northwest (Skardu), northeast (Chitral), southwest (Kohat) and southeast (P-Chinar), and 20-year return levels of daily precipitation greater than the 99th percentile (daily extreme precipitations) has been estimated. A comparison of the return levels and 99th percentile is presented in the Table 4 and it can be seen that the daily precipitation extreme values are lesser than the TDP2 and TDP1 return levels values for all four stations.
Therefore, this concept of return level estimation of EEP may provide a gateway to extreme precipitation projection as an event-based phenomenon.

4.3. Review of EEP Characteristics and Variations

In most of the parts of NHPK, TDP1 is dominant at a majority of stations throughout 1961–2014, whilst 1-day EEP triumphs from the northwest and north towards east (upstream of the Houzia and Gilgit Rivers) periphery of the NHPK and the downstream periphery of Swat River. The supremacy of 1-day EEP at the stations located in these regions is probably recognized because of the regional local arid climate under which long-lasting EEPs are occasional [22,53]. In general, the event amount for EEPs escalate towards the southeast from the north-west, and concentration ratio/duration of the event is higher/shorter at the stations situated in the northern periphery of NHPK. Specifically, the EEPs ascribed the higher concentration ratio values in the upper periphery of the Indus River (i.e., north) whilst longer duration has been observed near the conflux of the Jhelum and Neelum Rivers. This might be partly because the local geography affects the precipitation amount and duration [59,120,121], and because of westerly disturbances and monsoons that force precipitation to hover in the highlands of the NHPK [22,61,122,123,124].
The results of this study indicate higher values of 20 and 50-year return levels in the center and eastern periphery of the NHPK. Previously, no study had examined the return levels of event-based precipitation in the NHPK; thus, the comparison of the present study results is not possible for precipitation return levels with previous studies.

4.4. Significances for Water Resources and Hydrology

Based on the taxonomy ideologies of TDPs defined in the methodology portion, TDP1/TDP2 divulges EEP with extreme precipitation happening during the early/late stage of an event. Dunkerley (2012) stressed that precipitation extremes having early peaks can cause lesser surface ponding and comparatively smaller peak flows than late peaks [125]. The presented work verified that the TDP1 is predominant at the stations located across the NHPK, enhancing severe flood risks at the early stage of an extreme precipitation event. The stations located at higher altitude in Chitral exhibit dominant TDP2 instead of TDP1. In regards of total streamflow generation, previous research works have postulated that, though precipitation extremes with late peaks are more severe than those with early peaks, early peaks are abrupt and might yield stress on emergency flood management authorities [26,126]. Therefore, to float the idea regarding flash flooding at the start of an event is quite important during an extreme precipitation event across the NHPK.
Natural disasters, floods and droughts pose serious threats to Pakistan, as the country is experiencing a threat of major flooding events within every three years [127] and drought every six-year [128]. Pakistan has experienced the most devastating flood event in the past because of the large precipitation changes in the NHPK. The long-term characteristics of EEP give an idea about the precipitation amount that an EEP brings, how it concentrates regarding time on average and how long it may last. Such a survey was ignored in previous research works, though it is quite significant to understand the hydro-climatic regimes of the region [26]. Notably, the results of this study suggest caution against EEPs of daily precipitation extremes across the eastern part of NHPK where temporally concentrated, longer-lasting EEPs are dominant. Besides, the EEPs may provide valuable information about precipitation forecasting. Though numerical forecasting of precipitation is accessible nowadays, it may contain large biases at the local scale and is unable to use directly [129]. Notably, the increase in the concentration ratio of EEPs over the northern (u/s of Indus River) and southwest (below the Swat River) periphery of the NHPK infers that intense snowfall or heavy showers might develop more regularly over time. Responsiveness is thus obligatory to manage snow disaster or flash flooding in this part of the NHPK. Besides, return level estimation of EEP indicates the alarming conditions regarding floods in the Jhelum River periphery, the eastern side of the NHPK. Thus, it is required to take into consideration these flood prompt areas while preparing flood adaptations and mitigation strategies in Pakistan. Nevertheless, the employed techniques in the study are robust and straightforward, and a more accurate estimation of these indices and TDPs could be expected after the availability of more accurate precipitation data with better spatiotemporal extent at higher elevations.

5. Conclusions

In this study, extreme precipitation indices have been studied over the northern highlands of Pakistan and the concept of EEP is projected to deliberate PSP of daily precipitation extreme event. In addition, trends, time distribution patterns and return levels of EEPs across the NHPK are investigated from 1961–2014. The main findings are presented below:
  • In general, NHPK portrayed heterogeneous trends of precipitation indices with significant trends (positive values between (1.2–0) and negative (−4.4–0)) along the Swat, Panjkora and Jhelum Rivers periphery.
  • The precipitation data establish the EEP concept that the patterns of precipitation amounts (EEP 1.8–61.7%, TDP1 7.4–48%, TDP2 16.7–54%, TDP3 2.4–43.4%) are approximately similar to those of frequency percentages (EEP 3.5–59%, TDP1 15–48%, TDP2 18–50.4%, TDP3 1.6–28.2%) in general, displaying that total frequency overall consistent with total precipitation amount.
  • Certainly, TDP1 is dominant over a maximum area of NHPK except in some parts of the northeast (uppermost parts of Indus basin), northwest (upper and lower part of Gilgit River) and at the conflux of SWAT and Indus Rivers, where 1-day EEP prevails.
  • Comparatively, the event amount (160–320 mm), concentration ratio (0.8–1) and event duration (4–7 days) of TDP3 are generally dominant than the other three EEPs across the NHPK.
  • Moreover, heterogeneous trends in four indicators (amount, duration, concentration ratio and frequency) of TDP1 and TDP2 have been detected, with overall dominant TDP1 trends over the NHPK than those of TDP2. Furthermore, concurrently significant trends of TDP1 are broadly observed than those of TDP2.
  • For return level, the 20 and 50-year return levels of TDP1 show maximum values (210–350 mm) in the Chitral, Panjkora and Jhelum River basins whilst TDP2 presents maximum values (up to 700 mm) of return level in the eastern part of the NHPK for 20-year, and eastern and southwest for 50-year, respectively.
The EEP concept could be helpful to manage event base extreme precipitation, which is peculiarly beneficial for the areas characterized by long-lasting extreme precipitation. Moreover, the exploration of predominant EEP patterns offers an idea of hydro-climatological conditions in the NHPK, which can be helpful for the decision-makers to manage extremes precipitation, e.g., the dominant TDP1 recommends the obligation to secure during floods at the EEP initiation stage where, generally, high intensity arises. Moreover, the study of trends in EEP and its response may be helpful, along with the understanding of their decadal variability, to enhance the understanding of how extreme precipitation can change in the future, which could help the water resource planner to plan and manage water resources under a warming climate.

Supplementary Materials

The following are available online at https://www.mdpi.com/2073-4441/12/12/3373/s1, S1: Equation used in the RclimDex, S2: Autocorrelation test, S3: Mann-Kendall Trend Test, S4: Theil-Sen approach (TSA).

Author Contributions

Conceptualization, M.Z. and I.A.; methodology, M.Z., M.U.Q., and M.S.; software, M.Z.; validation, M.U.Q., M.S. and M.N.A.; formal analysis, M.I.K.; investigation, M.U.; resources, M.Z.; data curation, M.U.Q.; writing—original draft preparation, M.Z. and M.N.A., writing—review and editing, M.Z.; M.U.Q. and I.A.; supervision, M.Z. and M.U.Q., project administration, M.Z.; funding acquisition, M.U.Q. All authors have read and agreed to the published version of the manuscript.

Funding

This research was funded by the priority academic program development of Jiangsu Higher Education Institutions (No. papd-2018-87) and Jiangsu university post doctorate funding number 536300342. grant number. Moreover, The APC was funded by the priority academic program development of Jiangsu Higher Education Institutions (No. papd-2018-87) and Jiangsu university post doctorate funding number 536300342.

Conflicts of Interest

The authors declare no conflict of interest.

Appendix A

Table A1. Geographical location of gauging stations.
Station No.NameLongitudeLatitude
1ASTORE74.5035.20
2Bagh73.8034.00
3B-KOT73.4034.60
4BUNJI74.6335.67
5CHILAS74.1035.42
6CHERAT71.8833.82
7CHITAL71.8335.85
8DIR71.8234.83
9DROSH71.7835.57
10G-DOPATA73.6034.20
11G-KHAN73.6233.25
12GILGIT74.3335.92
13GUPIS73.4036.17
14KAKUL73.3034.18
15KHANDAR74.1033.50
16KOHAT71.4333.55
17KOTLI73.9033.50
18MANGLA73.6033.10
19MURREE73.4033.90
20M-ABAD73.5034.40
21NARAN73.7034.90
22P-CHINAR70.0933.87
23PESHWAR71.5834.02
24PLANDRI73.7033.70
25R-KOT74.0034.00
26R-PUR71.9734.08
27S-KOKATA74.0033.70
28S-SHARIF72.3534.82
29SKARDU75.5435.34
30D.I.Khan70.9031.81

References

  1. IPCC. Climate Change 2014: Synthesis Report; IPCC: Geneva, Switzerland, 2014; p. 151. [Google Scholar]
  2. Donat, M.G.; Lowry, A.L.; Alexander, L.V.; O’Gorman, P.A.; Maher, N. Addendum: More extreme precipitation in the world’s dry and wet regions. Nat. Clim. Chang. 2017, 7, 154–158. [Google Scholar] [CrossRef] [Green Version]
  3. Fischer, E.M.; Knutti, R. Observed heavy precipitation increase confirms theory and early models. Nat. Clim. Chang. 2016, 6, 986–991. [Google Scholar] [CrossRef]
  4. Prein, A.F.; Rasmussen, R.M.; Ikeda, K.; Liu, C.; Clark, M.P.; Holland, G.J. The future intensification of hourly precipitation extremes. Nat. Clim. Chang. 2017, 7, 48–52. [Google Scholar] [CrossRef]
  5. Donat, M.G.; Lowry, A.L.; Alexander, L.V. More extreme precipitation in the world’s dry and wet regions. Nat. Clim. Chang. 2016, 6, 508–513. [Google Scholar] [CrossRef]
  6. Wang, G.; Wang, D.; Trenberth, K.; Erfanian, A.; Yu, M.; Bosilovich, M.G.; Parr, D.T. The peak structure and future changes of the relationships between extreme precipitation and temperature. Nat. Clim. Chang. 2017, 7, 268–274. [Google Scholar] [CrossRef]
  7. Kendon, E.J.; Roberts, N.M.; Fowler, H.J.; Roberts, M.J.; Chan, S.C.; Senior, C.A. Heavier summer downpours with climate change revealed by weather forecast resolution model. Nat. Clim. Chang. 2014, 4, 570–576. [Google Scholar] [CrossRef] [Green Version]
  8. Capello, M.; Cutroneo, L.; Ferretti, G.; Gallino, S.; Canepa, G. Changes in the physical characteristics of the water column at the mouth of a torrent during an extreme rainfall event. J. Hydrol. 2016, 541, 146–157. [Google Scholar] [CrossRef]
  9. Zhang, X.; Zwiers, F.; Li, G.; Wan, H.; Cannon, A.J. Complexity in estimating past and future extreme short-duration rainfall. Nat. Geosci. 2017, 10, 255–259. [Google Scholar] [CrossRef]
  10. Easterling, D.R.; Evans, J.L.; Groisman, P.Y.; Karl, T.R.; Kunkel, K.E.; Ambenje, P. Observed Variability and Trends in Extreme Climate Events: A Brief Review*. Bull. Am. Meteorol. Soc. 2000, 81, 417–425. [Google Scholar] [CrossRef] [Green Version]
  11. Hundecha, Y.; Bárdossy, A. Trends in daily precipitation and temperature extremes across western Germany in the second half of the 20th century. Int. J. Clim. 2005, 25, 1189–1202. [Google Scholar] [CrossRef]
  12. Alexander, L.V.; Zhang, X.; Peterson, T.C.; Caesar, J.; Gleason, B.; Tank, A.M.G.K.; Haylock, M.; Collins, D.; Trewin, B.; Rahimzadeh, F.; et al. Global observed changes in daily climate extremes of temperature and precipitation. J. Geophys. Res. Space Phys. 2006, 111, 05109. [Google Scholar] [CrossRef] [Green Version]
  13. Moberg, A.; Jones, P.D.; Lister, D.; Walther, A.; Brunet, M.; Jacobeit, J.; Alexander, L.V.; Della-Marta, P.M.; Luterbacher, J.; Yiou, P.; et al. Indices for daily temperature and precipitation extremes in Europe analyzed for the period 1901–2000. J. Geophys. Res. Space Phys. 2006, 111, D22. [Google Scholar] [CrossRef] [Green Version]
  14. Ramos, M.C.; Martínez-Casasnovas, J.A. Trends in Precipitation Concentration and Extremes in the Mediterranean Penedès-Anoia Region, Ne Spain. Clim. Chang. 2006, 74, 457–474. [Google Scholar] [CrossRef]
  15. Bartholy, J.; Pongracz, R. Regional analysis of extreme temperature and precipitation indices for the Carpathian Basin from 1946 to 2001. Glob. Planet. Chang. 2007, 57, 83–95. [Google Scholar] [CrossRef]
  16. Choi, G.; Collins, D.; Ren, G.; Trewin, B.; Baldi, M.; Fukuda, Y.; Afzaal, M.; Pianmana, T.; Gomboluudev, P.; Huong, P.T.T.; et al. Changes in means and extreme events of temperature and precipitation in the Asia-Pacific Network region, 1955–2007. Int. J. Clim. 2009, 29, 1906–1925. [Google Scholar] [CrossRef]
  17. Costa, A.C.; Soares, A. Trends in extreme precipitation indices derived from a daily rainfall database for the South of Portugal. Int. J. Climatol. 2009, 29, 1956–1975. [Google Scholar] [CrossRef]
  18. Kioutsioukis, I.; Melas, D.; Zerefos, C. Statistical assessment of changes in climate extremes over Greece (1955–2002). Int. J. Climatol. 2010, 30, 1723–1737. [Google Scholar] [CrossRef]
  19. López-Moreno, J.I.; Serrano, S.M.V.; Angulo-Martínez, M.; Beguería, S.; El Kenawy, A.M. Trends in daily precipitation on the northeastern Iberian Peninsula, 1955–2006. Int. J. Climatol. 2010, 30, 1026–1041. [Google Scholar] [CrossRef] [Green Version]
  20. Fan, X.; Wang, Q.; Wang, M. Changes in temperature and precipitation extremes during 1959–2008 in Shanxi, China. Theor. Appl. Climatol. 2012, 109, 283–303. [Google Scholar] [CrossRef]
  21. WAPDA. Lower Indus Report, Physical Resources-Groundwater; WAPDA: Lahore, Pakistan, 1965. [Google Scholar]
  22. Ahmad, I.; Zhang, F.; Tayyab, M.; Anjum, M.N.; Zaman, M.; Liu, J.; Farid, H.U.; Saddique, Q. Spatiotemporal analysis of precipitation variability in annual, seasonal and extreme values over upper Indus River basin. Atmos. Res. 2018, 213, 346–360. [Google Scholar] [CrossRef]
  23. Hasson, S.U.; Böhner, J.; Lucarini, V. Prevailing climatic trends and runoff response from Hindukush–Karakoram–Himalaya, upper Indus Basin. Earth Syst. Dyn. 2017, 8, 337–355. [Google Scholar] [CrossRef] [Green Version]
  24. Tank, A.M.G.K.; Peterson, T.C.; Quadir, D.A.; Dorji, S.; Zou, X.; Tang, H.; Santhosh, K.; Joshi, U.R.; Jaswal, A.K.; Kolli, R.K.; et al. Changes in daily temperature and precipitation extremes in central and south Asia. J. Geophys. Res. Space Phys. 2006, 111, 16105. [Google Scholar] [CrossRef]
  25. White, R.H.; Battisti, D.S.; Skok, G. Tracking precipitation events in time and space in gridded observational data. Geophys. Res. Lett. 2017, 44, 8637–8646. [Google Scholar] [CrossRef]
  26. Wu, X.; Guo, S.; Yin, J.; Yang, G.; Zhong, Y.; Liu, D. On the event-based extreme precipitation across China: Time distribution patterns, trends, and return levels. J. Hydrol. 2018, 562, 305–317. [Google Scholar] [CrossRef]
  27. Xu, W.; Zipser, E.J.; Chen, Y.-L.; Liu, C.; Liou, Y.-C.; Lee, W.-C.; Jou, B.J.-D. An Orography-Associated Extreme Rainfall Event during TiMREX: Initiation, Storm Evolution, and Maintenance. Mon. Weather. Rev. 2012, 140, 2555–2574. [Google Scholar] [CrossRef] [Green Version]
  28. Hitchens, N.M.; Brooks, H.E.; Schumacher, R.S. Spatial and Temporal Characteristics of Heavy Hourly Rainfall in the United States. Mon. Weather. Rev. 2013, 141, 4564–4575. [Google Scholar] [CrossRef]
  29. Wentz, F.; Ricciardulli, L.; Hilburn, K. Science CM-, 2007 U. How much more rain will global warming bring? Science (80-) 2007, 317, 233–235. [Google Scholar] [CrossRef]
  30. Min, S.-K.; Zhang, X.; Zwiers, F.W.; Hegerl, G.C. Human contribution to more-intense precipitation extremes. Nature 2011, 470, 378–381. [Google Scholar] [CrossRef]
  31. Vittal, H.; Karmakar, S.; Ghosh, S. Diametric changes in trends and patterns of extreme rainfall over India from pre-1950 to post-1950. Geophys. Res. Lett. 2013, 40, 3253–3258. [Google Scholar] [CrossRef]
  32. Ma, S.; Zhou, T.; Dai, A.; Han, Z. Observed Changes in the Distributions of Daily Precipitation Frequency and Amount over China from 1960 to 2013. J. Clim. 2015, 28, 6960–6978. [Google Scholar] [CrossRef]
  33. Xiao, C.; Wu, P.; Zhang, L.; Song, L. Robust increase in extreme summer rainfall intensity during the past four decades observed in China. Sci. Rep. 2016, 6, 38506. [Google Scholar] [CrossRef] [PubMed] [Green Version]
  34. Hamidreza, M.; Hasan, A.; Mohammad, J.; Mohammadreza, B.; Salajegheh, A. Study of the Temporal Distribution Pattern of Rainfall Effect on Runoff and Sediment Generation Using Rain Simulator (Case Study: Alvand Basin). 2010. Available online: https://www.researchgate.net/publication/267713351 (accessed on 7 August 2018).
  35. Lu, E.; Zhao, W.; Zou, X.; Ye, D.; Zhao, C.; Zhang, Q. Temporal–Spatial Monitoring of an Extreme Precipitation Event: Determining Simultaneously the Time Period It Lasts and the Geographic Region It Affects. J. Clim. 2017, 30, 6123–6132. [Google Scholar] [CrossRef]
  36. Wang, W.-C.; Gong, W.; Wei, H.; Wang, W.-C.; Gong, W.; Wei, H. A Regional Model Simulation of the 1991 Severe Precipitation Event over the Yangtze–Huai River Valley. Part I: Precipitation and Circulation Statistics. J. Clim. 2000, 13, 74–92. [Google Scholar] [CrossRef]
  37. Tao, S. Severe Floods in the Yangtze and Huaihe River Basins in the Mei-yu Period, 1991; World Scientific Publishing Co.: Singapore, 1993; p. 46. [Google Scholar]
  38. Lu, E.; Ding, Y. Analysis of summer monsoon activity during the 1991 excessively torrential rain over the Changjiang-Huaihe River valley. J. Appl. Meteor. 1997, 8, 316–324. [Google Scholar]
  39. Lu, E.; Zhao, W.; Gong, L.; Chen, H.; Wang, H.; Li, X.; Song, J.; Tu, J.; Higgins, R.W.; Halpert, M.S. Determining starting time and duration of extreme precipitation events based on intensity. Clim. Res. 2015, 63, 31–41. [Google Scholar] [CrossRef]
  40. She, D.; Shao, Q.; Xia, J.; Taylor, J.A.; Zhang, Y.; Zhang, L.; Zhang, X.; Zou, L. Investigating the variation and non-stationarity in precipitation extremes based on the concept of event-based extreme precipitation. J. Hydrol. 2015, 530, 785–798. [Google Scholar] [CrossRef]
  41. Goswami, B.N.; Venugopal, V.; Sengupta, D.; Madhusoodanan, M.S.; Xavier, P.K. Increasing Trend of Extreme Rain Events Over India in a Warming Environment. Science 2006, 314, 1442–1445. [Google Scholar] [CrossRef] [Green Version]
  42. You, Q.; Kang, S.; Aguilar, E.; Pepin, N.; Flügel, W.-A.; Yan, Y.; Xu, Y.; Zhang, Y.; Huang, J. Changes in daily climate extremes in China and their connection to the large scale atmospheric circulation during 1961–2003. Clim. Dyn. 2011, 36, 2399–2417. [Google Scholar] [CrossRef]
  43. Madsen, H.; Lawrence, D.; Lang, M.; Martinkova, M.; Kjeldsen, T.R. Review of trend analysis and climate change projections of extreme precipitation and floods in Europe. J. Hydrol. 2014, 519, 3634–3650. [Google Scholar] [CrossRef] [Green Version]
  44. Ghassabi, Z.; Kamali, G.A.; Meshkatee, A.H.; Hajam, S.; Javaheri, N.; Meshkati, A. Time distribution of heavy rainfall events in south west of Iran. J. Atmos. Solar-Terr. Phys. 2016, 145, 53–60. [Google Scholar] [CrossRef]
  45. Zhao, Z.; Leung, L.; Qian, Y. Characteristics of Diurnal Variations of Rainfall in China for the Recent Years. 2005. Available online: https://www.osti.gov/biblio/876958 (accessed on 7 August 2018).
  46. Huffman, G.J.; Bolvin, D.T.; Nelkin, E.J.; Wolff, D.B.; Adler, R.F.; Gu, G.; Hong, Y.; Bowman, K.P.; Stocker, E.F. The TRMM Multisatellite Precipitation Analysis (TMPA): Quasi-Global, Multiyear, Combined-Sensor Precipitation Estimates at Fine Scales. J. Hydrometeorol. 2007, 8, 38–55. [Google Scholar] [CrossRef]
  47. Bonta, J.V. Development and Utility of Huff Curves for Disaggregating Precipitation Amounts. Appl. Eng. Agric. 2004, 20, 641–653. [Google Scholar] [CrossRef]
  48. Trier, S.B.; Davis, C.A.; Carbone, R.E. Mechanisms Governing the Persistence and Diurnal Cycle of a Heavy Rainfall Corridor. J. Atmos. Sci. 2014, 71, 4102–4126. [Google Scholar] [CrossRef]
  49. Zuluaga, M.D.; Houze, R.A. Extreme Convection of the Near-Equatorial Americas, Africa, and Adjoining Oceans as seen by TRMM. Mon. Weather. Rev. 2015, 143, 298–316. [Google Scholar] [CrossRef] [Green Version]
  50. Wu, X.; Guo, S.; Liu, D.; Hong, X.; Liu, Z.; Liu, P.; Chen, H. Characterization of rainstorm modes along the upper mainstream of Yangtze River during 2003–2016. Int. J. Clim. 2018, 38, 1976–1988. [Google Scholar] [CrossRef]
  51. Hu, H.; Duan, Y.; Wang, Y.; Zhang, X. Diurnal Cycle of Rainfall Associated with Landfalling Tropical Cyclones in China from Rain Gauge Observations. J. Appl. Meteorol. Climatol. 2017, 56, 2595–2605. [Google Scholar] [CrossRef]
  52. Chen, Z.; Yin, L.; Chen, X.; Wei, S.; Zhu, Z. Research on the characteristics of urban rainstorm pattern in the humid area of Southern China: A case study of Guangzhou City. Int. J. Climatol. 2015, 35, 4370–4386. [Google Scholar] [CrossRef]
  53. Yao, C.; Yang, S.; Qian, W.; Lin, Z.; Wen, M. Regional summer precipitation events in Asia and their changes in the past decades. J. Geophys. Res. Space Phys. 2008, 113, 17107. [Google Scholar] [CrossRef] [Green Version]
  54. Hartmann, H.; Buchanan, H. Trends in Extreme Precipitation Events in the Indus River Basin and Flooding in Pakistan. Atmos.-Ocean 2013, 52, 77–91. [Google Scholar] [CrossRef]
  55. Wolf, A.T.; Natharius, J.A.; Danielson, J.J.; Ward, B.S.; Pender, J.K. International River Basins of the World. Int. J. Water Resour. Dev. 1999, 15, 387–427. [Google Scholar] [CrossRef]
  56. Jain, K.S.; Agarwal, P.K.; Singh, V.P. Hydrology and Water Resources of India; Springer Science & Business Media: Dordrecht, The Netherlands, 2007; Volume 57. [Google Scholar]
  57. Immerzeel, W.; Bierkens, M. Asia’s water balance. Nat. Geosci. 2012, 5, 841–842. Available online: https://scholar.google.co.uk/scholar?hl=en&as_sdt=0%2C5&q=Immerzeel%2C+W.W.%2C+Bierkens%2C+M.F.P.%2C+2012.+Asia%27s+water+balance.+Nat.+Geosci.+5%2C+841–842&btnG= (accessed on 7 August 2018). [CrossRef]
  58. Khalid, S.; Qasim, M.; Farhan, D. Hydro-meteorological characteristics of Indus River Basin at extreme north of Pakistan. J. Earth Sci. Clim. Chang. 2013, 5, 170. [Google Scholar] [CrossRef]
  59. Hasson, S.U.; Lucarini, V.; Khan, M.R.; Petitta, M.; Bolch, T.; Gioli, G. Early 21st century snow cover state over the western river basins of the Indus River system. Hydrol. Earth Syst. Sci. 2014, 18, 4077–4100. [Google Scholar] [CrossRef] [Green Version]
  60. Lutz, A.; Immerzeel, W.W.; Kraaijenbrink, P.D.A.; Shrestha, A.B.; Bierkens, M.F.P. Climate Change Impacts on the Upper Indus Hydrology: Sources, Shifts and Extremes. PLoS ONE 2016, 11, e0165630. [Google Scholar] [CrossRef] [PubMed] [Green Version]
  61. Houze, R.A.; Rasmussen, K.L.; Medina, S.; Brodzik, S.R.; Romatschke, U. Anomalous Atmospheric Events Leading to the Summer 2010 Floods in Pakistan. Bull. Am. Meteorol. Soc. 2011, 92, 291–298. [Google Scholar] [CrossRef]
  62. Dahri, Z.H.; Ludwig, F.; Moors, E.; Ahmad, B.; Khan, A.; Kabat, P. An appraisal of precipitation distribution in the high-altitude catchments of the Indus basin. Sci. Total Environ. 2016, 548–549, 289–306. [Google Scholar] [CrossRef] [PubMed] [Green Version]
  63. FAO. Food and Agriculture Organization of the United Nations. In FAO Statistical Yearbook (2012); FAO: Rome, Italy, 2012. [Google Scholar]
  64. Latif, Y.; YaoMing, M.; Yaseen, M. Spatial analysis of precipitation time series over the Upper Indus Basin. Theor. Appl. Clim. 2018, 131, 761–775. [Google Scholar] [CrossRef] [Green Version]
  65. Zhang, X.; Yang, F. RClimDex (1.0) User Manual; Climate Research Branch Environment: Downsview, ON, Canada, 2004; Available online: http://about-c3s-dr.eu/pages/workshop_tools/RClimDexUserManual.pdf (accessed on 7 August 2018).
  66. Mei, C.; Liu, J.; Chen, M.-T.; Wang, H.; Li, M.; Yu, Y. Multi-decadal spatial and temporal changes of extreme precipitation patterns in northern China (Jing-Jin-Ji district, 1960–2013). Quat. Int. 2018, 476, 1–13. [Google Scholar] [CrossRef]
  67. Zhang, X.; Alexander, L.V.; Hegerl, G.C.; Jones, P.; Tank, A.K.; Peterson, T.C.; Trewin, B.; Zwiers, F.W. Indices for monitoring changes in extremes based on daily temperature and precipitation data. Wiley Interdiscip. Rev. Clim. Chang. 2011, 2, 851–870. [Google Scholar] [CrossRef]
  68. Gao, T.; Xie, L. Spatiotemporal changes in precipitation extremes over Yangtze River basin, China, considering the rainfall shift in the late 1970s. Glob. Planet. Chang. 2016, 147, 106–124. [Google Scholar] [CrossRef]
  69. Limsakul, A.; Singhruck, P. Long-term trends and variability of total and extreme precipitation in Thailand. Atmos. Res. 2016, 169, 301–317. [Google Scholar] [CrossRef]
  70. Croitoru, A.-E.; Piticar, A.; Burada, D.C. Changes in precipitation extremes in Romania. Quat. Int. 2016, 415, 325–335. [Google Scholar] [CrossRef]
  71. Sun, W.; Mu, X.; Song, X.; Wu, D.; Cheng, A.; Qiu, B. Changes in extreme temperature and precipitation events in the Loess Plateau (China) during 1960–2013 under global warming. Atmos. Res. 2016, 168, 33–48. [Google Scholar] [CrossRef]
  72. Tian, J.; Liu, J.; Wang, J.; Li, C.; Nie, H.; Yu, F. Trend analysis of temperature and precipitation extremes in major grain producing area of China. Int. J. Clim. 2017, 37, 672–687. [Google Scholar] [CrossRef]
  73. AlSarmi, S.H.; Washington, R. Changes in climate extremes in the Arabian Peninsula: Analysis of daily data. Int. J. Clim. 2013, 34, 1329–1345. [Google Scholar] [CrossRef]
  74. Croitoru, A.-E.; Chiotoroiu, B.-C.; Todorova, V.I.; Torică, V. Changes in precipitation extremes on the Black Sea Western Coast. Glob. Planet. Chang. 2013, 102, 10–19. [Google Scholar] [CrossRef]
  75. Shi, H.; Li, T.; Wei, J.; Fu, W.; Wang, G. Spatial and temporal characteristics of precipitation over the Three-River Headwaters region during 1961–2014. J. Hydrol. Reg. Stud. 2016, 6, 52–65. [Google Scholar] [CrossRef] [Green Version]
  76. Mann, H.B. Nonparametric Tests Against Trend. Econometrica 1945, 13, 245. [Google Scholar] [CrossRef]
  77. Kendall, M. Rank Correlation Measures. Charles Griffin. 1975. Available online: https://scholar.google.co.jp/scholar?q=Kendall%2C+M.+G.+1975.+Rank+Correlation+Measures.+Charles+Griffin%2C+London.&btnG=&hl=en&as_sdt=0%2C5 (accessed on 24 June 2017).
  78. Von Storch, H. Spatial patterns: EOFs and CCA. In Analysis of Climate Variability; Springer: Berlin/Heidelberg, Germany, 1995. [Google Scholar]
  79. Oueslati, B.; Camberlin, P.; Zoungrana, J.; Roucou, P.; Diallo, S. Variability and trends of wet season temperature in the Sudano-Sahelian zone and relationships with precipitation. Clim. Dyn. 2017, 50, 1067–1090. [Google Scholar] [CrossRef]
  80. Guo, X.; Wu, Z.; He, H.; Du, H.; Wang, L.; Yang, Y.; Zhao, W. Variations in the start, end, and length of extreme precipitation period across China. Int. J. Clim. 2018, 38, 2423–2434. [Google Scholar] [CrossRef]
  81. Gemmer, M.; Fischer, T.; Jiang, T.; Su, B.; Liu, L.L.; Gemmer, M. Trends in Precipitation Extremes in the Zhujiang River Basin, South China. J. Clim. 2011, 24, 750–761. [Google Scholar] [CrossRef]
  82. Lenderink, G.; Van Meijgaard, E. Increase in hourly precipitation extremes beyond expectations from temperature changes. Nat. Geosci. 2008, 1, 511–514. [Google Scholar] [CrossRef]
  83. Lieting, C.; Renguang, W. Interannual and decadal variations of snow cover over Qinghai-Xizang Plateau and their relationships to summer monsoon rainfall in China. Adv. Atmos. Sci. 2000, 17, 18–30. [Google Scholar] [CrossRef]
  84. Wu, X.; Wang, Z.; Zhou, X.; Lai, C.; Lin, W.; Chen, X. Observed changes in precipitation extremes across 11 basins in China during 1961–2013. Int. J. Clim. 2015, 36, 2866–2885. [Google Scholar] [CrossRef]
  85. Keifer, C.D.; Chu, H. Synthetic Storm Pattern for Drainage Design. 1957. Available online: http://cedb.asce.org/CEDBsearch/record.jsp?dockey=0010917 (accessed on 13 August 2018).
  86. Yen, B.; Chow, V. Design hyetographs for small drainage structures. J. Hydraul. Div. 1980. Available online: https://trid.trb.org/view/154722 (accessed on 13 August 2018).
  87. Huff, F. Time distributions of heavy rainstorms in Illinois. Circular. 1990. Available online: https://www.ideals.illinois.edu/bitstream/handle/2142/94492/ISWSC-173.pdf?sequence=1 (accessed on 13 August 2018).
  88. Zhang, X.C.; Norton, L.D.; Hickman, M. Rain Pattern and Soil Moisture Content Effects on Atrazine and Metolachlor Losses in Runoff. J. Environ. Qual. 1997, 26, 1539–1547. [Google Scholar] [CrossRef]
  89. Azli, M.; Rao, A.R. Development of Huff curves for Peninsular Malaysia. J. Hydrol. 2010, 388, 77–84. [Google Scholar] [CrossRef]
  90. Amin, M.T.; Rizwan, M.; Alazba, A.A. A best-fit probability distribution for the estimation of rainfall in northern regions of Pakistan. Open Life Sci. 2016, 11, 432–440. [Google Scholar] [CrossRef]
  91. Cunnane, C. A particular comparison of annual maxima and partial duration series methods of flood frequency prediction. J. Hydrol. 1973, 18, 257–271. [Google Scholar] [CrossRef]
  92. Stedinger, J.R.; Lu, L.-H. Appraisal of regional and index flood quantile estimators. Stoch. Environ. Res. Risk Assess. 1995, 9, 49–75. [Google Scholar] [CrossRef]
  93. Coles, S. An Introduction to Statistical Modeling of Extreme Values; Springer: Berlin/Heidelberg, Germany, 2001. [Google Scholar]
  94. Katz, R.; Parlange, M. Resources PN-A in water, 2002 undefined. Statistics of extremes in hydrology. Adv. Water Resour. 2002, 25, 1287–1304. [Google Scholar] [CrossRef] [Green Version]
  95. Abida, H.; Ellouze, M. Hydrology and Earth System Sciences Discussions. Eur. Geosci. Union. 2007. Available online: https://hal.archives-ouvertes.fr/hal-00298830 (accessed on 7 August 2018).
  96. Feng, S.; Nadarajah, S.; Hu, Q. Modeling Annual Extreme Precipitation in China Using the Generalized Extreme Value Distribution. J. Meteorol. Soc. Jpn. 2007, 85, 599–613. [Google Scholar] [CrossRef] [Green Version]
  97. Yang, T.; Shao, Q.; Hao, Z.; Chen, X.; Zhang, Z.; Xu, C.-Y.; Sun, L. Regional frequency analysis and spatio-temporal pattern characterization of rainfall extremes in the Pearl River Basin, China. J. Hydrol. 2010, 380, 386–405. [Google Scholar] [CrossRef]
  98. Villarini, G.; Smith, J.A.; Baeck, M.L.; Vitolo, R.; Stephenson, D.B.; Krajewski, W.F. On the frequency of heavy rainfall for the Midwest of the United States. J. Hydrol. 2011, 400, 103–120. [Google Scholar] [CrossRef]
  99. Zakaria, Z.A.; Shabri, A.; Ahmad, U.N. Regional Frequency Analysis of Extreme Rainfalls in the West Coast of Peninsular Malaysia using Partial L-Moments. Water Resour. Manag. 2012, 26, 4417–4433. [Google Scholar] [CrossRef]
  100. She, D.; Xia, J.; Song, J.; Du, H.; Chen, J.; Wan, L. Spatio-temporal variation and statistical characteristic of extreme dry spell in Yellow River Basin, China. Theor. Appl. Clim. 2013, 112, 201–213. [Google Scholar] [CrossRef]
  101. Madsen, H.; Pearson, C.P.; Rosbjerg, D. Comparison of annual maximum series and partial duration series methods for modeling extreme hydrologic events: 2. Regional modeling. Water Resour. Res. 1997, 33, 759–769. [Google Scholar] [CrossRef]
  102. Madsen, H.; Rasmussen, P.F.; Rosbjerg, D. Comparison of annual maximum series and partial duration series methods for modeling extreme hydrologic events: 1. At-site modeling. Water Resour. Res. 1997, 33, 747–757. [Google Scholar] [CrossRef]
  103. Pickands, J. Statistical Inference Using Extreme Order Statistics on JSTOR. Ann. Stat. 1975, 3, 119–131. [Google Scholar]
  104. Yilmaz, A.G.; Imteaz, M.A.; Perera, B.J.C. Investigation of non-stationarity of extreme rainfalls and spatial variability of rainfall intensity-frequency-duration relationships: A case study of Victoria, Australia. Int. J. Clim. 2017, 37, 430–442. [Google Scholar] [CrossRef]
  105. Marra, F.; Morin, E.; Peleg, N.; Mei, Y.; Anagnostou, E.N. Intensity–duration–frequency curves from remote sensing rainfall estimates: Comparing satellite and weather radar over the eastern Mediterranean. Hydrol. Earth Syst. Sci. 2017, 21, 2389–2404. [Google Scholar] [CrossRef] [Green Version]
  106. Lang, M.; Ouarda, T.; Bobée, B. Towards operational guidelines for over-threshold modeling. J. Hydrol. 1999, 225, 103–117. [Google Scholar] [CrossRef]
  107. Pasarić, Z.; Cindrić, K. Generalised Pareto distribution: Impact of rounding on parameter estimation. Theor. Appl. Clim. 2019, 136, 417–427. [Google Scholar] [CrossRef]
  108. Xia, J.; Du, H.; Zeng, S.; She, D.; Zhang, Y.; Yan, Z.; Ye, Y. Temporal and spatial variations and statistical models of extreme runoff in Huaihe River Basin during 1956–2010. J. Geogr. Sci. 2012, 22, 1045–1060. [Google Scholar] [CrossRef]
  109. Li, Z.; Li, C.; Xu, Z.; Zhou, X. Frequency analysis of precipitation extremes in Heihe River basin based on generalized Pareto distribution. Stoch. Environ. Res. Risk Assess. 2014, 28, 1709–1721. [Google Scholar] [CrossRef]
  110. Hosseinzadehtalaei, P.; Tabari, H.; Willems, P. Climate change impact on short-duration extreme precipitation and intensity–duration–frequency curves over Europe. J. Hydrol. 2020, 590, 125249. [Google Scholar] [CrossRef]
  111. Langousis, A.; Mamalakis, A.; Puliga, M.; Deidda, R. Threshold detection for the generalized Pareto distribution: Review of representative methods and application to the NOAA NCDC daily rainfall database. Water Resour. Res. 2016, 52, 2659–2681. [Google Scholar] [CrossRef] [Green Version]
  112. Hosking, J. L-Moments: Analysis and Estimation of Distributions Using Linear Combinations of Order Statistics on JSTOR. J. R. Stat. Soc. Ser. B. 1990, 52, 105–124. [Google Scholar] [CrossRef]
  113. Hosking, J.; Wallis, J. Regional Frequency Analysis: An Approach Based on L-Moments. UK. 1997. Available online: https://books.google.com/books?hl=en&lr=&id=gurAnfB4nvUC&oi=fnd&pg=PP1&ots=7Tb-5zt9I-&sig=yhUtpDvIF5MViWg8_ugP_MAJ0lI (accessed on 7 August 2018).
  114. Martins, E.S.; Stedinger, J.R. Generalized Maximum Likelihood Pareto-Poisson estimators for partial duration series. Water Resour. Res. 2001, 37, 2551–2557. [Google Scholar] [CrossRef] [Green Version]
  115. Hosking, J.R.; Wallis, J.R. Parameter and Quantile Estimation for the Generalized Pareto Distribution. Technometrics 1987, 29, 339–349. [Google Scholar] [CrossRef]
  116. Efron, B. Bootstrap Methods: Another Look at the Jackknife. Ann. Stat. 1979, 7, 1–26. [Google Scholar] [CrossRef]
  117. Kim, T.-J.; Schnitzlein, W.M.; McAloose, D.; Pessier, A.P.; Tripathy, D.N. Characterization of an avianpox virus isolated from an Andean condor (Vultur gryphus). Vet. Microbiol. 2003, 96, 237–246. [Google Scholar] [CrossRef] [PubMed]
  118. Griffiths, M.L.; Bradley, R.S. Variations of Twentieth-Century Temperature and Precipitation Extreme Indicators in the Northeast United States. J. Clim. 2007, 20, 5401–5417. [Google Scholar] [CrossRef]
  119. Naidu, C.; Raju, A.D.; Satyanarayana, G.; Kumar, P.V.; Chiranjeevi, G.; Suchitra, P. An observational evidence of decrease in Indian summer monsoon rainfall in the recent three decades of global warming era. Glob. Planet. Chang. 2015, 127, 91–102. [Google Scholar] [CrossRef]
  120. Hasson, S.U.; Pascale, S.; Lucarini, V.; Böhner, J. Seasonal cycle of precipitation over major river basins in South and Southeast Asia: A review of the CMIP5 climate models data for present climate and future climate projections. Atmos. Res. 2016, 180, 42–63. [Google Scholar] [CrossRef] [Green Version]
  121. Hasson, S.U.; Lucarini, V.; Pascale, S.; Böhner, J. Seasonality of the hydrological cycle in major South and Southeast Asian river basins as simulated by PCMDI/CMIP3 experiments. Earth Syst. Dyn. 2014, 5, 67–87. [Google Scholar] [CrossRef] [Green Version]
  122. Soncini, A.; Bocchiola, D.; Confortola, G.; Bianchi, A.; Rosso, R.; Mayer, C.; Lambrecht, A.; Palazzi, E.; Smiraglia, C.; Diolaiuti, G. Future Hydrological Regimes in the Upper Indus Basin: A Case Study from a High-Altitude Glacierized Catchment. J. Hydrometeorol. 2015, 16, 306–326. [Google Scholar] [CrossRef] [Green Version]
  123. Rajbhandari, R.; Shrestha, A.B.; Kulkarni, A.; Patwardhan, S.K.; Bajracharya, S.R. Projected changes in climate over the Indus river basin using a high resolution regional climate model (PRECIS). Clim. Dyn. 2014, 44, 339–357. [Google Scholar] [CrossRef] [Green Version]
  124. Garee, K.; Chen, X.; Bao, A.; Wang, Y.; Meng, F. Hydrological Modeling of the Upper Indus Basin: A Case Study from a High-Altitude Glacierized Catchment Hunza. Water 2017, 9, 17. [Google Scholar] [CrossRef]
  125. Dunkerley, D. Effects of rainfall intensity fluctuations on infiltration and runoff: Rainfall simulation on dryland soils, Fowlers Gap, Australia. Hydrol. Process. 2012, 26, 2211–2224. [Google Scholar] [CrossRef]
  126. Wilkinson, G.E. Rainfall Characteristics and Soil Erosion in the Rainforest Area of Western Nigeria. Exp. Agric. 1975, 11, 247–255. [Google Scholar] [CrossRef]
  127. De Groeve, T.; Kugler, Z.; Brakenridge, G. Near real time flood alerting for the global disaster alert and coordination system. Proc. ISCRAM 2007, 2007, 33–39. [Google Scholar]
  128. Jabeen, S.; Ashfaq, M.; Baig, A. Linear program modeling for determining the value of irrigation water. J. Agric. Soc. 2006, 2, 101–105. [Google Scholar]
  129. Ben Daoud, A.; Sauquet, E.; Bontron, G.; Obled, C.; Lang, M. Daily quantitative precipitation forecasts based on the analogue method: Improvements and application to a French large river basin. Atmos. Res. 2016, 169, 147–159. [Google Scholar] [CrossRef] [Green Version]
Figure 1. The study area (NHPK) along with the topography, rivers flowing within the area and location of the gauging stations.
Water 12 03373 g001
Figure 2. Description of the Event based Extreme Precipitation EEP and Time Distribution Patterns TDPs concept. A daily precipitation event having more than 1 mm for consecutive days through which a minimum of a single daily precipitation extreme (DPE) with an amount greater than the 99th percentile happens is recognized as an EEP. The parallel brown and black streaks point out the 1 mm threshold value of precipitation and the 99th percentiles, correspondingly. The vertical dotted streaks are regarded as the EEPs central times, separating the duration of the event into two identical quantities. For event duration, EEPi+2 and EEPi+1 represent EEP with all DPE dispersed in the second and first half parts of the event, whereas TDP3 (EEPi+3) represents EEP with DPE spread at both the first and second half parts of an event. Different colors of bars are just for discrimination of different TDPs, (e.g., green bars represent the EEPi having only 1 daily precipitation extreme (DPE) with precipitation percentile more than 99th percentile, red bars represent the EEPi+1(TDP1), magenta colored bars represent EEPi+2(TDP2) and yellow bars are a representation of EEPi+3(TDP3). The gray colored bars do not represent any extreme precipitation event; it is just a precipitation with more than 1 mm precipitation amount.
Water 12 03373 g002
Figure 3. Spatial patterns of extreme precipitation indices (CDD (a), CWD (b), PRCPOT (c), R10mm (d), R20mm (e), R25mm (f), RX1day (g), RX5day (h), SDII (i), R95p (j) and R99p (k)) in the NHPK. An upward arrow indicates an increasing trend whilst the downward arrow represents the decreasing trend. Moreover, green colored arrows present significant trends whereas colorless arrows indicate insignificant trends. No trend exhibits with a circle. The bar charts represent the comparisons among the stations regarding different indices. The chart symbol is scaled to equal half the size of the largest value for the attribute that relates to the longest bar.
Water 12 03373 g003aWater 12 03373 g003b
Figure 4. Presentation of the three TDPs and 1-day EEP based on percentages of total frequencies (a) and amounts (b) during the study period.
Water 12 03373 g004
Figure 5. Dominant EEPs distribution across NHPK during the study period.
Water 12 03373 g005
Figure 6. Spatially distributed average event (ad) amount, (eg) duration and (hj) concentration ratio for EEP1, TDP1, TDP2 and TDP3. Spatial patterns for event concentration ratio and duration are not presented for 1-day EEP here as they are equal to 1.
Water 12 03373 g006
Figure 7. Spatial trends patterns in annual (a,b) amount, (c,d) duration, (e,f) concentration ratios and (g,h) frequencies of TDP2 and TDP1.
Water 12 03373 g007
Figure 8. Estimations of 20-year and 50-year return levels for TDP1 (a) and TDP2 (b).
Water 12 03373 g008
Table 1. Precipitation indices used in this study.
IndexNameDefinitionUnit
CDDConsecutive dry daysMaximum number of consecutive days with RR * < 1 mmdays
CWDConsecutive wet daysMaximum number of consecutive days with RR ≥ 1 mmdays
PRCPOTAnnual total wet-day precipitationAnnual total precipitation in wet days, RR ≥ 1 mmmm
R10mmNumber of heavy precipitation daysAnnual count of days with RR ≥ 10 mmdays
R20mmNumber of very heavy precipitation daysAnnual count of days with RR ≥ 20 mmdays
R25mmNumber of extremely heavy precipitation daysAnnual count of days with RR ≥ 25 mmdays
R95pVery wet daysAnnual total precipitation when RR > 95th percentilemm
R99pExtremely wet daysAnnual total precipitation when RR > 99th percentilemm
RX1dayMax 1-day precipitation amountMonthly maximum 1-day precipitationmm
RX5dayMax 5-day precipitation amountMonthly maximum consecutive 5-day precipitationmm
SDIISimple daily intensity indexAnnual total precipitation divided by the number of wet days (RR ≥ 1 mm) in a yearmm/day
* RR stands for daily precipitation [66,70].
Table 2. Increasing (positive) and decreasing (negative) trends for precipitation extremes per decade.
IndexRegional TrendsPositive TrendNegative TrendStationary Trend
TotalSSNSTotalSSNSTotal
Fixed Thresholds Indices
R10m0.021046201370
R20m0.01124818990
R25m01257177101
CDD−0.011349172150
CWD0.011641214680
PRCPOT−0.671349161060
Station related threshold indices
R95p0.021531214681
R99p−0.0116313140140
Non-Threshold Indices
RX1day0.0416412143110
RX5day0.1215411143111
SDII−0.011459166100
NS = non-Significant, SS = Significant.
Table 3. The %age of EEPs for different frequencies and volumes.
Station No.Station% Frequencies% Volume
EEPTDP1TDP2TDP3EEPTDP1TDP2TDP3
1ASTORE12.536.7437.86.73645.212
2BAGH1235.54111.47.530.743.618.2
3B-KOT11.93934.614.56.239.330.424.1
4BUNJI1244.436.17.55.947.333.313.6
5CHILAS5015251061.77.416.714.1
6CHERAT582018445.519.621.113.8
7CHITAL9.438.650.41.64.339.254.12.4
8DIR11.643.440.34.75.842.341.910.1
9DROSH15.242.839.92.29.245.440.84.7
10G-DOPATA3.642.935.717.91.635.336.326.8
11G-KHAN11.54133.314.26.433.235.125.3
12GILGIT2138.734.55.911.441.837.29.6
13GUPIS27.321.822.728.215.520.920.143.5
14KAKUL1546.432.16.41045.331.213.4
15KHANDAR16.744.829.39.210.443.327.718.5
16KOHAT21.339.731.97.11238.533.915.7
17KOTLI30.929.829.89.623303016.9
18MANGLA20.641.827.310.316.438.825.619.1
19MURREE7.545.136.810.5440.139.816.1
20M-ABAD16.847.923.4127.44723.122.6
21NARAN10.744.330.514.53.54832.216.3
22P-CHINAR14.641.632.111.78.53930.522
23PESHWAR29.131.833.85.321.631.4388.9
24PLANDRI25.926.931.515.722.319.934.623.2
25R-KOT21.935.132.510.512.431.133.522.9
26R-PUR3128.2319.920.829.330.319.7
27S-KOKATA11.839.636.112.47.834.235.922.2
28S-SHARIF1832.336.113.59.33037.123.5
29SKARDU30.524.227.31821.220.319.539
30DI Khan2135321221323116
Table 4. Comparison between the daily extreme precipitation and 20-year return levels of EEP at four stations.
StationsCHITALKOHATP-CHINARSKARDU
TDP1 RL (mm)320162221155
TDP2 RL (mm)205260230101
Daily Extreme Precipitation (mm) 16014019588.3
Publisher’s Note: MDPI stays neutral with regard to jurisdictional claims in published maps and institutional affiliations.

