Hydrochemical Evolution of Groundwater in Dehui, China
by
Hongyang Wei
1,2,3, 
Xiujuan Liang
1,2,3,
Shuhui Liu
1,2,3,
Mingjun Liu
1,2,3 and
Changlai Xiao
1,2,3,* 1
Key Laboratory of Groundwater Resources and Environment, Jilin University, Ministry of Education, Changchun 130021, China
2
National-Local Joint Engineering Laboratory of In-Situ Conversion, Drilling and Exploitation Technology for Oil Shale, Changchun 130021, China
3
College of New Energy and Environment, Jilin University, Changchun 130021, China
*
Author to whom correspondence should be addressed.
Water 2020, 12(12), 3378; https://doi.org/10.3390/w12123378
Submission received: 22 October 2020
/
Revised: 25 November 2020
/
Accepted: 30 November 2020
/
Published: 1 December 2020
(This article belongs to the Section Hydrology)
Abstract
:Although Dehui City has excellent agricultural conditions, long-term large-scale over-cultivation and human activities in recent years have caused significant changes in the local groundwater chemical characteristics. This study analyzes the causes, evolution, and prediction of groundwater chemistry via multi-disciplinary theoretical cross-cutting methods, such as groundwater ion composition-ratio analysis and groundwater influencing factor analysis, and artificial neural networks. The lithological characteristics of the groundwater aquifer were combined with ion composition-ratio mapping to explore the cause of groundwater chemistry composition in the study area. Piper three-line diagrams and Gibbs diagrams were used to analyze the evolution characteristics and influencing factors of groundwater chemistry in the study area. Based on these data, time series predictions were made for hydrochemical data. The results demonstrate that the chemical origins of groundwater in the study area are mainly background stratum and cation exchange, influenced by human activities. The main factors of groundwater chemical characteristics have changed from rock weathering to evaporation/precipitation in the past two decades. The hydrochemical characteristics changed from secondary alkalinity to secondary salinity. The predicted data from long short-term memory neural networks indicated that groundwater would continue salinization without the changes in the conditions, leading to land degradation in the study area.
1. Introduction
Groundwater is the main source of water for human consumption and industrial and agricultural activities in addition to surface water [1]. The evolution of groundwater quality has always been a matter of concern and has been studied by many methods in the past decade. Helena et al. used principal component analysis to reveal that some ions in groundwater were related to different external conditions [2]. Adams et al. further verified this view using isotope tracking analysis [3]; isotopic analysis also found that water–rock interaction is a time-dependent process. Under the interaction, the main groundwater ion is also specifically characterized by a regular increase [4]. Kuo et al. used multiple artificial neural network models to simulate water quality in the same area. The results show that groundwater quality has good time dependence [5]. Ahmed analyzed the change in groundwater quality using a standard ion map [6] and precipitation as expressions [7]. Rattray explained most changes in aquifer chemistry through geochemical sources and processes of groundwater quality using a geochemical model [8]; Kohlhepp et al. studied the ability of geological structures to control groundwater quality and constructed a spatial groundwater quality evolution model [9]. After systematically analyzing the evolution of groundwater quality in the region, according to the “Drinking Water Quality Guidelines” formulated by the World Health Organization, it provides guidance for the sustainable development of local groundwater pollution and groundwater resources [10,11].
Dehui City has fertile land and good geographical/climatic conditions. As an important commercial grain production county in the country, it maintains a large area of crop cultivation; however, the impact of human activities on groundwater has gradually increased in recent years due to large areas of irrational farming. As a result, the quality of groundwater in the study area has deteriorated drastically [12].
To understand the reasons for the chemical characteristics of phreatic water in the study area, the ion source was analyzed via the hydrochemical ion ratio method and the groundwater environment analysis. The evolution of chemical characteristics of phreatic water in the study area was analyzed using the Piper three-line diagrams and Gibbs diagrams. We constructed long-term and short-term memory (LSTM) neural networks based on the data analysis to predict the chemical characteristics of groundwater in future study areas, and proposed corresponding governance recommendations based on this.
2. Overview of the Study Area
2.1. Study Area
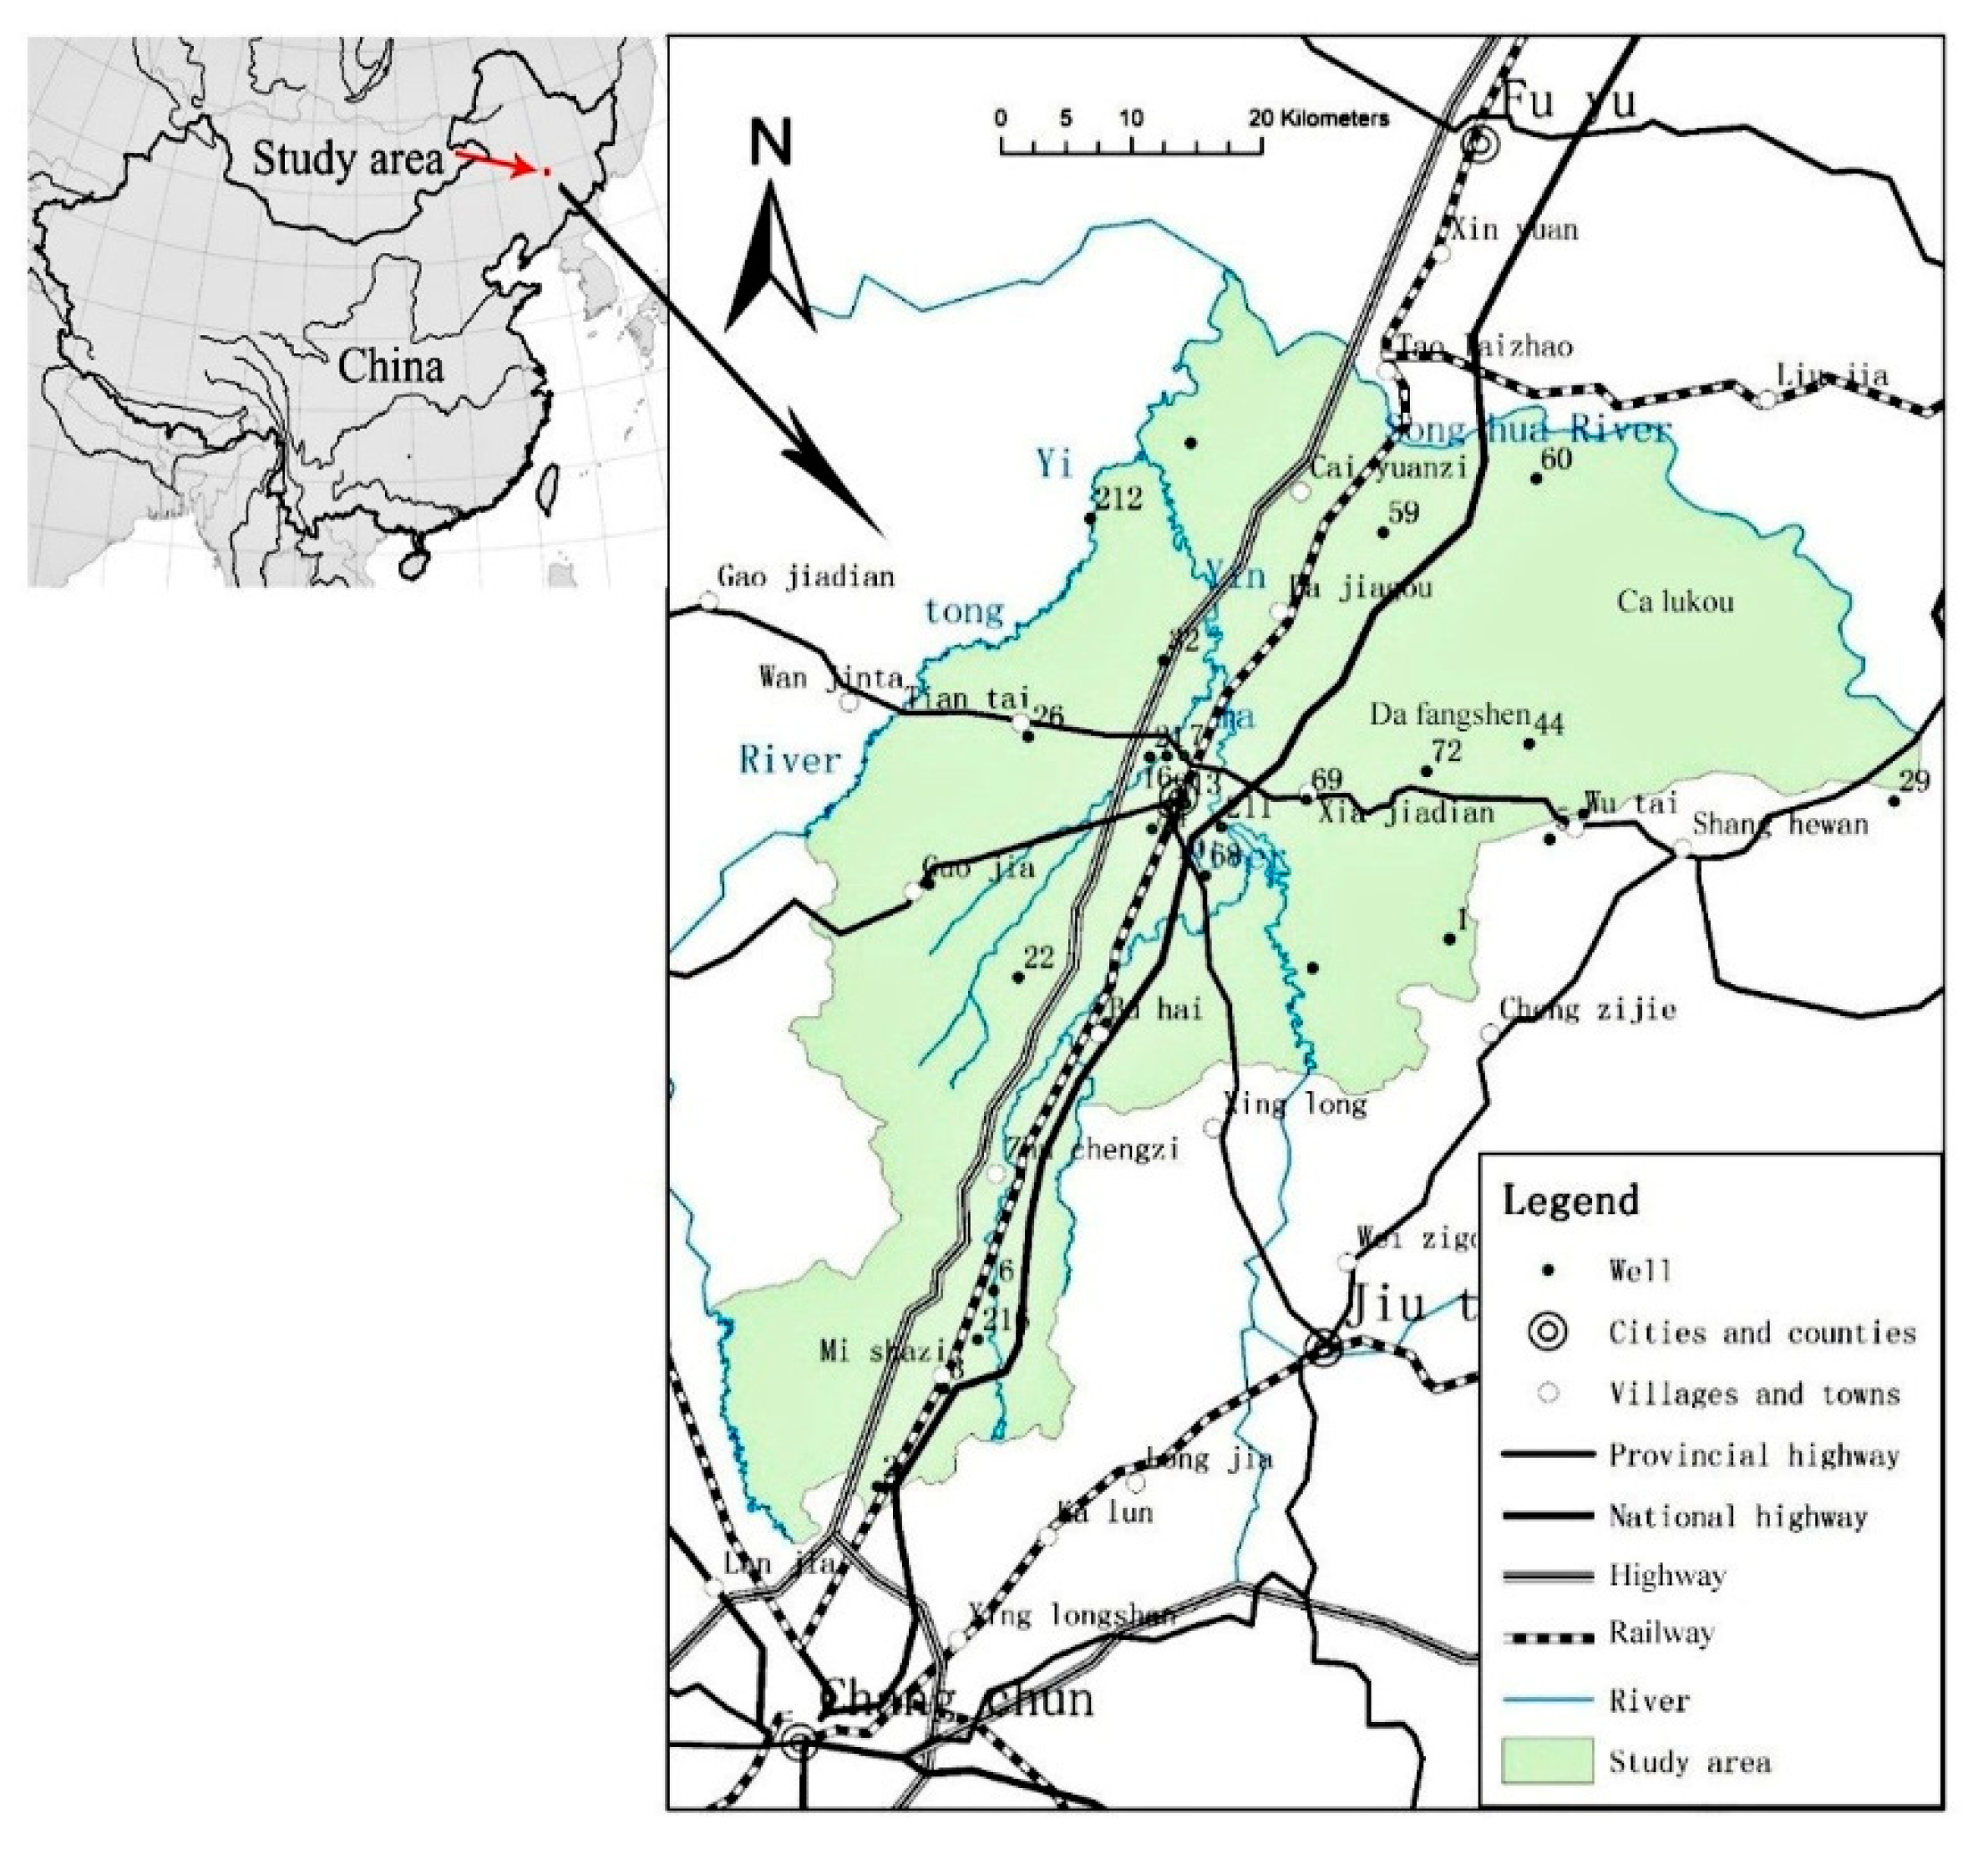
As shown in Figure 1, Dehui City is located in the north-central part of Jilin Province and the central part of the Song Liao Plains, geographically within latitudes 44°02′–44°53′ N and longitudes 125°14′–126°24′ E. It is separated from Yu Shu City and Shu Lan County by the Songhua River; it is adjacent to Changchun City in the south and is connected with Fu Yu County in the north. Axially, the east-west width is 93.7 km, and the north-south length is 94.5 km. The study area is within a temperate continental monsoon climate zone with an average annual temperature of 4.8 °C. The average annual precipitation is 546.8 mm, and the average annual runoff depth is 55.2 mm. The yearly water-surface evaporation is 860.7 mm.
2.2. Geology and Hydrogeology
2.2.1. Geology
The specific stratigraphic structure and distribution characteristics of the study area are shown in Table 1 [13].
In the late Cretaceous, the crust was affected by uplift in the east and outcropped at the surface. In the Quaternary period, folds and fault zones were formed in the study area due to tectonic movement, predominantly oriented to the northeast, although some are northwest, and some have a nearly north-south direction.
(1) Fold structure
The Dehui syncline is composed of three secondary structures: the Dehui syncline, Dafangshen anticline, and Sanqingzui syncline. The core of the Dehui syncline is composed of three members of the Nenjiang Formation, with an axis oriented 30° northeast. The east wing contains the Nenjiang, Yaojia, Qingshankou, and Quantou formations; the west wing only contains the Yaojia Formation, forming an asymmetric wide and gentle oblique angle. The core of the Dafangshen anticline is composed of the Qingshankou Formation with an axis 54° northeast, with the Yaojia Formation in the east, and Yaojia and Nenjiang formations in the west. The core of the Sanqingzui syncline is the Nenjiang Formation, with an axis 50° northeast; the east wing is the Qingshankou Formation and the Quantou Formation, and the west wing is the Yaojia Formation.
The Xiaohelong anticline is formed by the Yaojia Formation at its core, with an axis 30° northeast. The west wing is composed of the Nenjiang Formation, distributed in the Qinjiagou area of Wanbao Town in the south.
(2) Fault structure
The Yitong River Fault runs 40° northeast and is roughly parallel to the Yitong River valley. The fracture zone is approximately 2 m thick, and the faults are distributed from the northwest of Weitang Village, Tongtai Township to Yushuchengzi, Songjia Village, Guojia Town.
The Dafangshen fracture heads northeast, distributed in the area of Xiaonantun in Yangcaogou, Yangshu Town and the hilltop of Jicun in the northeast. The fault is 20 km long and 250–500 m wide. Passing through the core of the Dafangshen anticline, the fractured zone is 40–65 m deep where the rock body is broken, with obvious slickensides oriented at 50–70° and fault marks.
The poplar break runs northwest and is distributed from Yangshu Town to Gaochengzi Reservoir in Songhuajiang Town. Interpreted from satellite images, the fault passes through Gaochengzi Reservoir to Xiaodongtuozi (Xiaolituozi) Village, Dapaoxiu Village, and Caiyuanzi Town, with a total length of 33 km.
The Gaojiamiaozi Fault runs west northwest and is distributed in the Wulacaogou area of Xingsheng Village and Daqingzui Town; the fracture zone is 50–66 m wide.
2.2.2. Hydrogeology
The aquifer in this study is the phreatic aquifer situated above the first impervious layers in the section. Depending on the type of aquifer media in the study area, aquifers can be characterized into the loose rock pore water aquifer and the Cretaceous clastic rock pore fissure water aquifer. Cretaceous clastic rock pore fissure water confines water and is not included in the scope of this study; therefore, the corresponding distribution location is not introduced.
The loose rock pore water in Dehui City is mainly distributed in areas where loose rock deposits and groundwater recharge sources are abundant, such as tidal platforms and river valley plains. These include multiple aquifers from the Lower Pleistocene to Holocene of the Fourth System [14]. According to the geological age and genetic type of the aquifer, it can be further divided into the following groundwater types:
- (1)
- Holocene modern river valley sand and gravel pore water are mainly distributed in the Second Songhua River and its tributary valleys; the aquifer medium is mainly sand and gravel alluvial layers with thickness ranging from 5 to 20 m. The groundwater level is relatively shallow and the water volume is abundant. The water inflow of a single well ranges from 500 to 3000 m3/day.
- (2)
- Pleistocene alluvial-diluvial pore water is mainly distributed in Wanbao Town, Buhai Town, and other areas. The aquifer is mainly a layer of medium and fine sand formed by alluvial and diluvial deposits, with a thickness of 2 to 4 m. The buried depth of the groundwater level is 2–5 m, and the water inflow of a single well is 100–500 m3/day.
- (3)
- Alluvial-proluvial pore water of the Middle Pleistocene is mainly distributed in tidal platforms; this aquifer is mainly composed of the alluvial-diluvial sand and gravel layer of the Middle Pleistocene, with a thickness of 10–30 m. The porosity and water yield are high (500–1000 m3/day).
- (4)
- Lower Pleistocene glacial water sand gravel pore aquifers are mainly scattered above the ancient denudation surface of the Cretaceous strata in the lower part of the tidal platforms. The thickness of the aquifer is small, only 1–3 m. The burial depth of the water level is generally greater than 5 m, and the water inflow of a single well varies from 100 to 1000 m3/day.
3. Materials and Methods
3.1. Materials
To study the evolution of groundwater quality in the Dehui area, the water quality monitoring data of phreatic water in Dehui City from 1998 to 2018 were collected. Table 2 summarizes the results of statistical analysis of the collected data.
The geological and hydrogeological data of the study area are derived from the “Dehui City Water Supply Hydrogeological Survey Report” [15], and the groundwater chemistry data used are derived from the “Jilin Province Groundwater Dynamic Data (1998–2018)” [16]. The data of agricultural fertilizer application amount are collected from the “China Statistical Yearbook (1998–2018) [17].”
3.2. Methods
In the case analysis of water chemistry characteristics, the method of drawing the ratio chart of specific cations and anions in the water chemistry data is used to analyze the source of the main ions in groundwater, and the ion source is further judged according to the occurrence environment of groundwater.
Correlation analysis was performed on the hydrochemical data using Formula (1), and the correlation matrix was obtained as shown in Table 3.
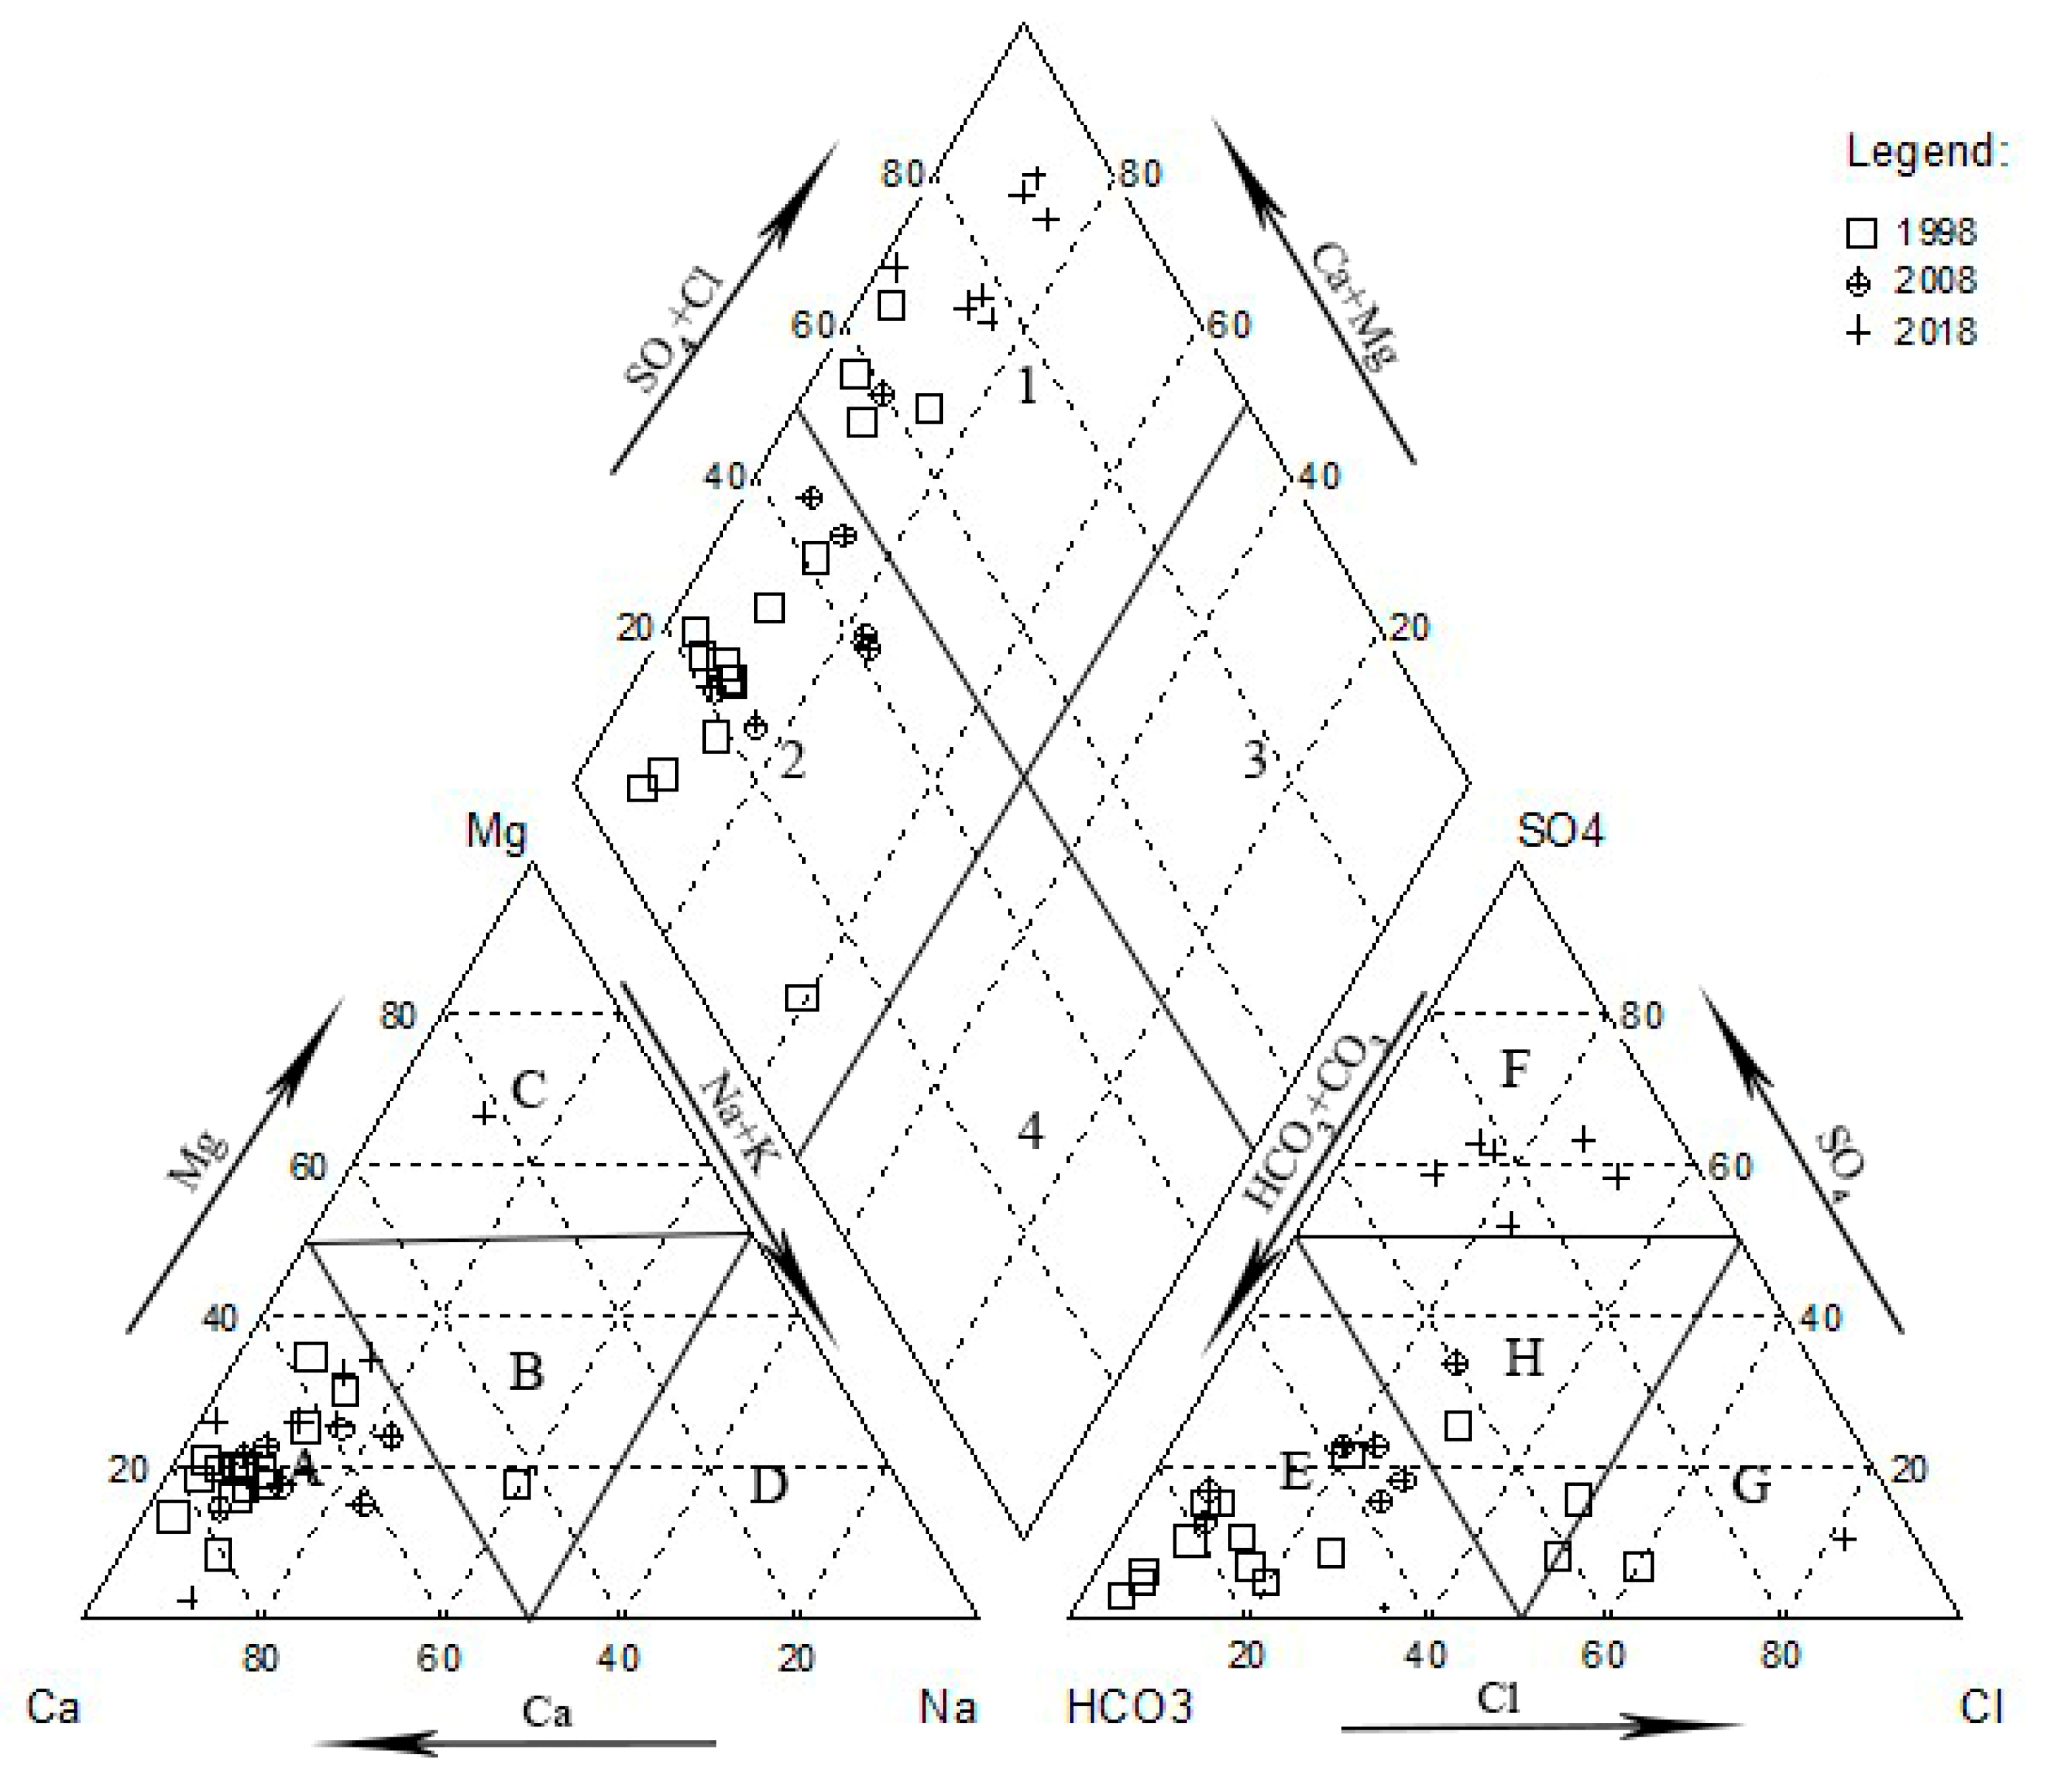
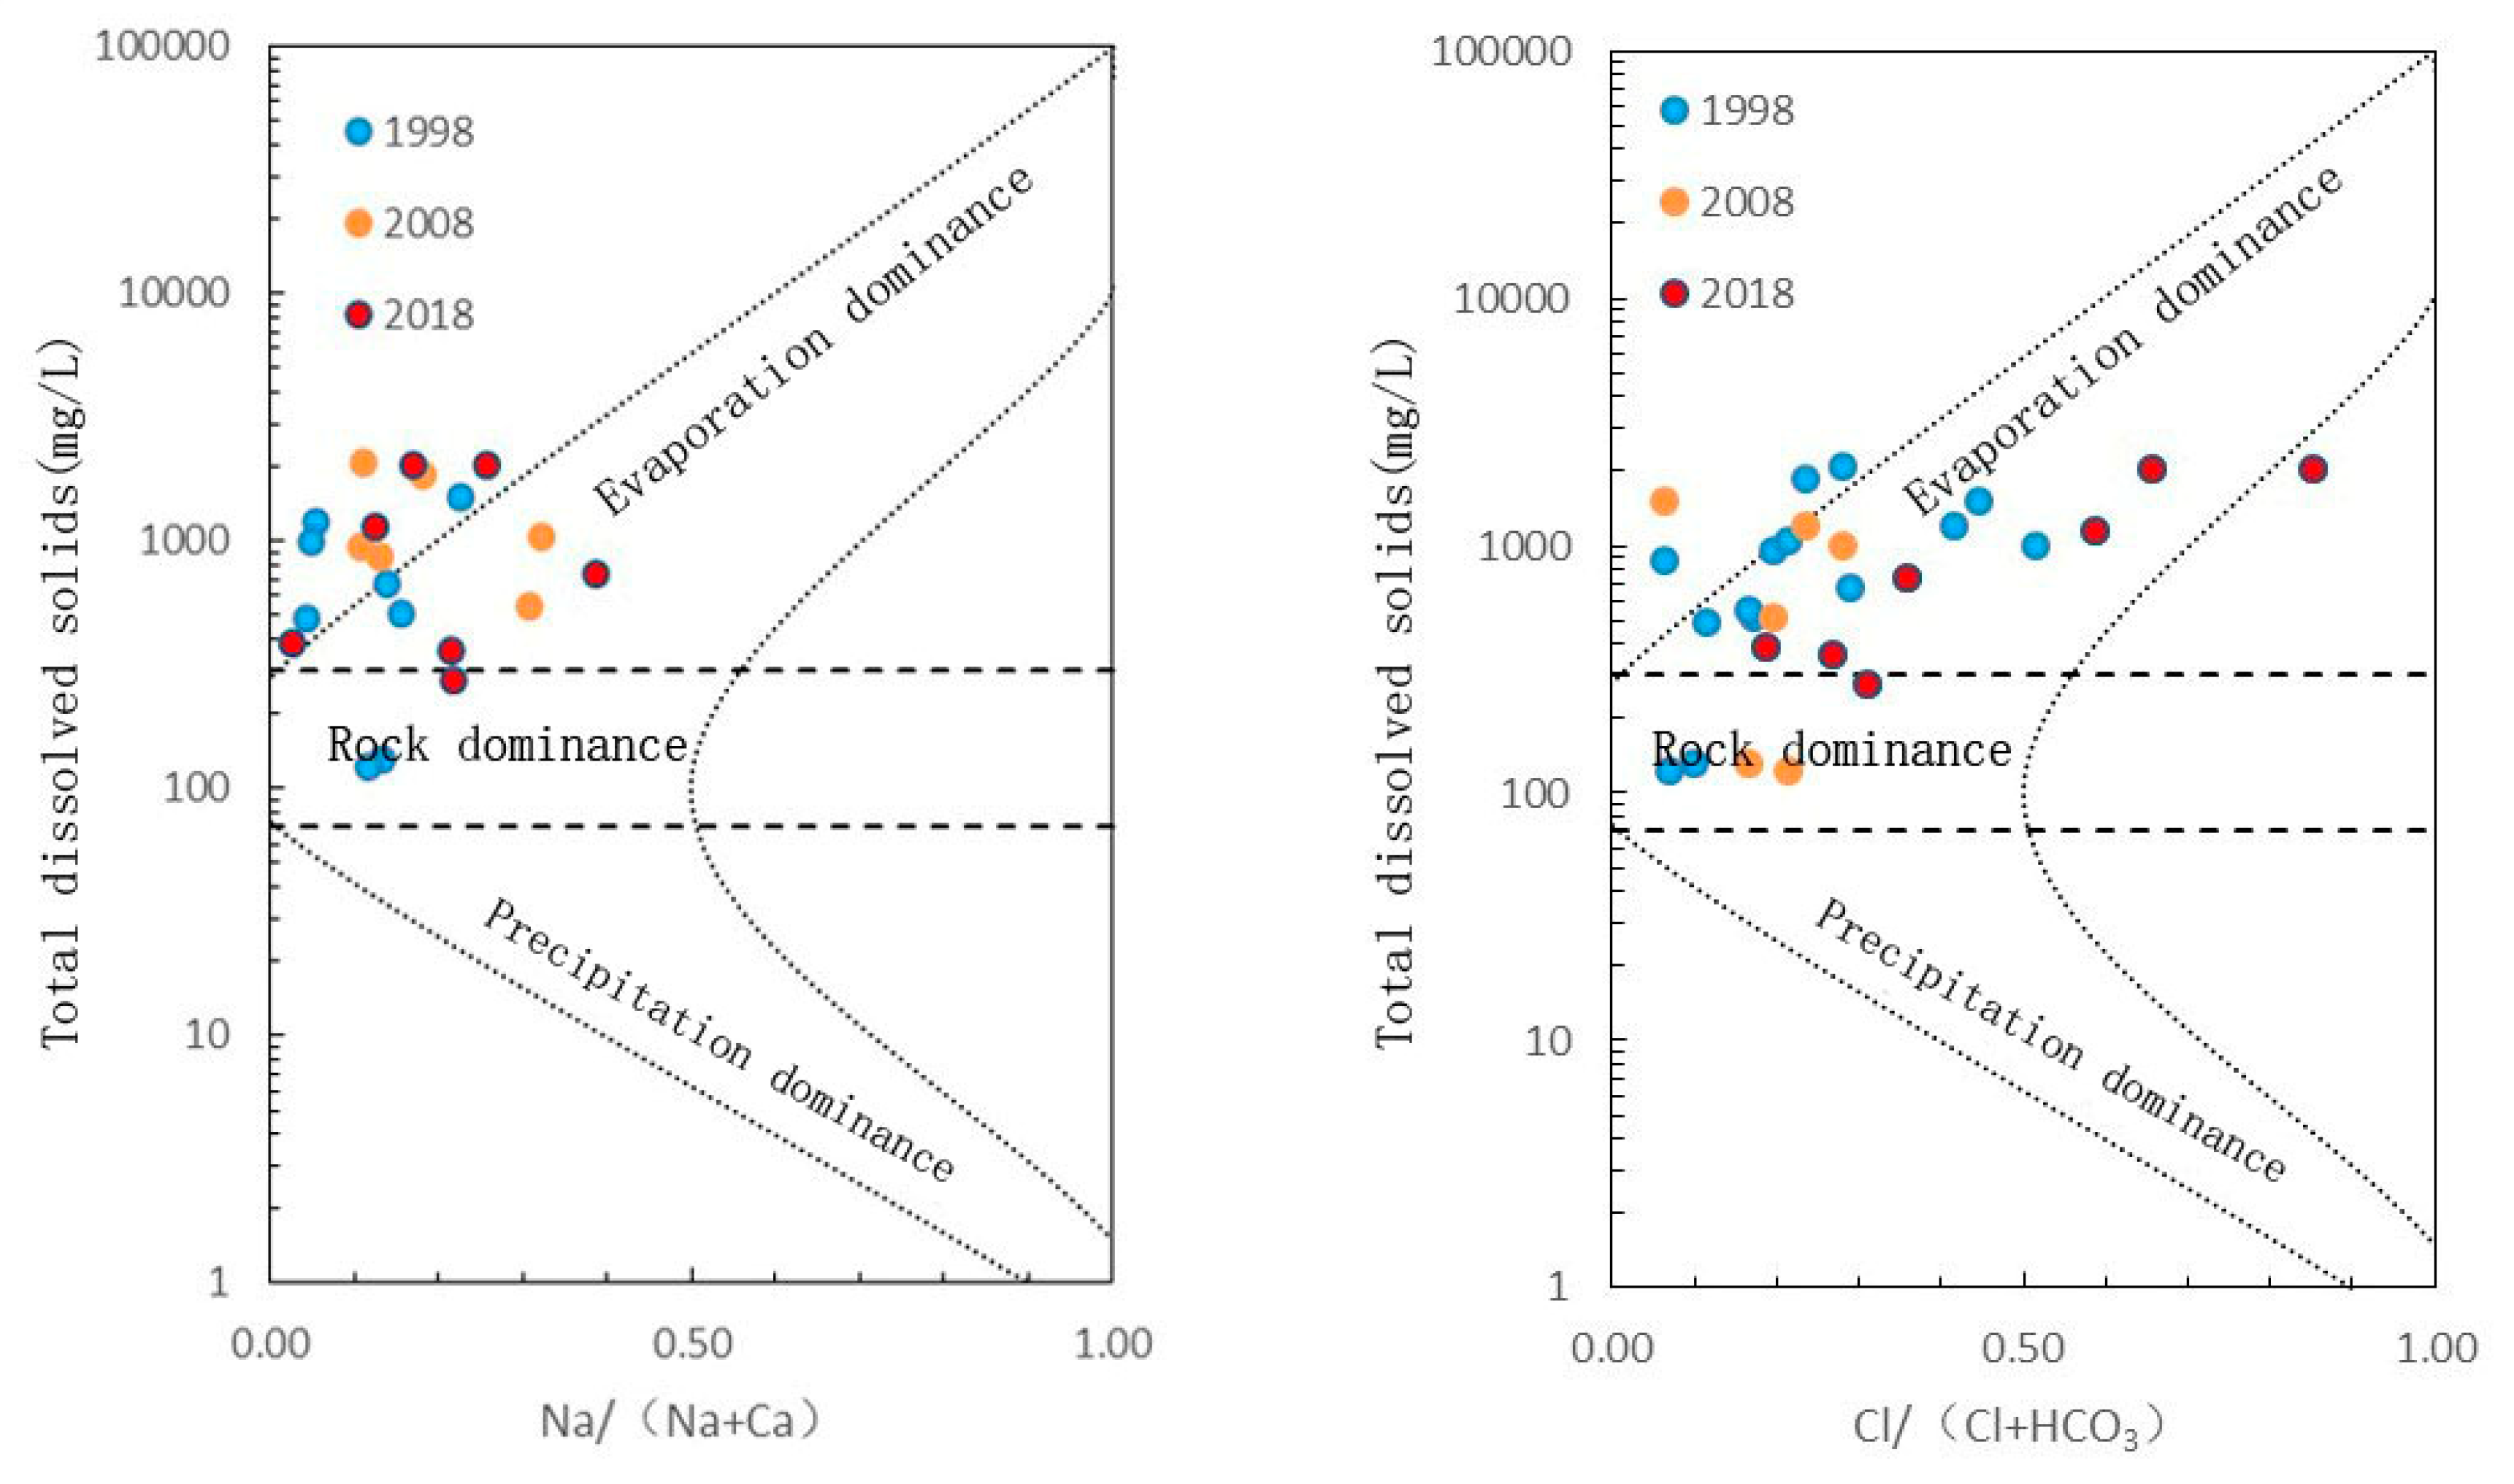
The chemical evolution of groundwater in the study area is analyzed by the location of data points in a Piper trilinear plot (Figure 2) [18]. A Gibbs diagram is used to show the change in the influencing factors of chemical formation in groundwater (Figure 3) [19].
In the prediction of the future groundwater chemical characteristics of the study area, the neural network method is used for fitting.
To eliminate the influence of dimension and order of magnitude, improve the prediction accuracy of the model, and accelerate the speed of model training convergence, the original variable time-series set must be standardized. The formula to do so is expressed as follows:
In the formula, X* represents the value after normalization, x represents the value before normalization, xmax represents the maximum value in the original data set, and xmin represents the minimum value in the original data set.
According to the LSTM model structure, the network training steps are as follows:
In the input layer, the original variable data set is defined as follows:
In the formula, xt = (at, bt, ct, dt, et), at, bt, ct, dt, and et, the groundwater chemical data of the five long-term observation wells corresponding to the t-year, are shown.
The training set and test set are divided, and the original variable data set is normalized according to Formula (7), which is expressed as follows:
In the formula, F′train and F′test represent the normalized training set and test set, respectively, and the constraint conditions are m < n, m, and n ∈ N.
The F′train data are segmented, and the length of the time series determined by the time step and the step value set to L. Hence, the data set of the input hidden layer after segmentation is as follows:
The hidden layer theoretical output is as follows:
The above-trained model is used for data prediction; the LSTM neural network is trained using the 1998–2015 data. Step-by-step learning is performed with a 5-year time step, with a total of 14 sets of data. The LSTM network has 175 input nodes, 5 output nodes, and 25 hidden nodes. The number of training iterations is set to 1000, the training accuracy is taken as 0.001, the operation iteration is stopped, the final output error is 0.00085, and the network converges.
4. Results
4.1. Hydrology-Chemical Analysis Results
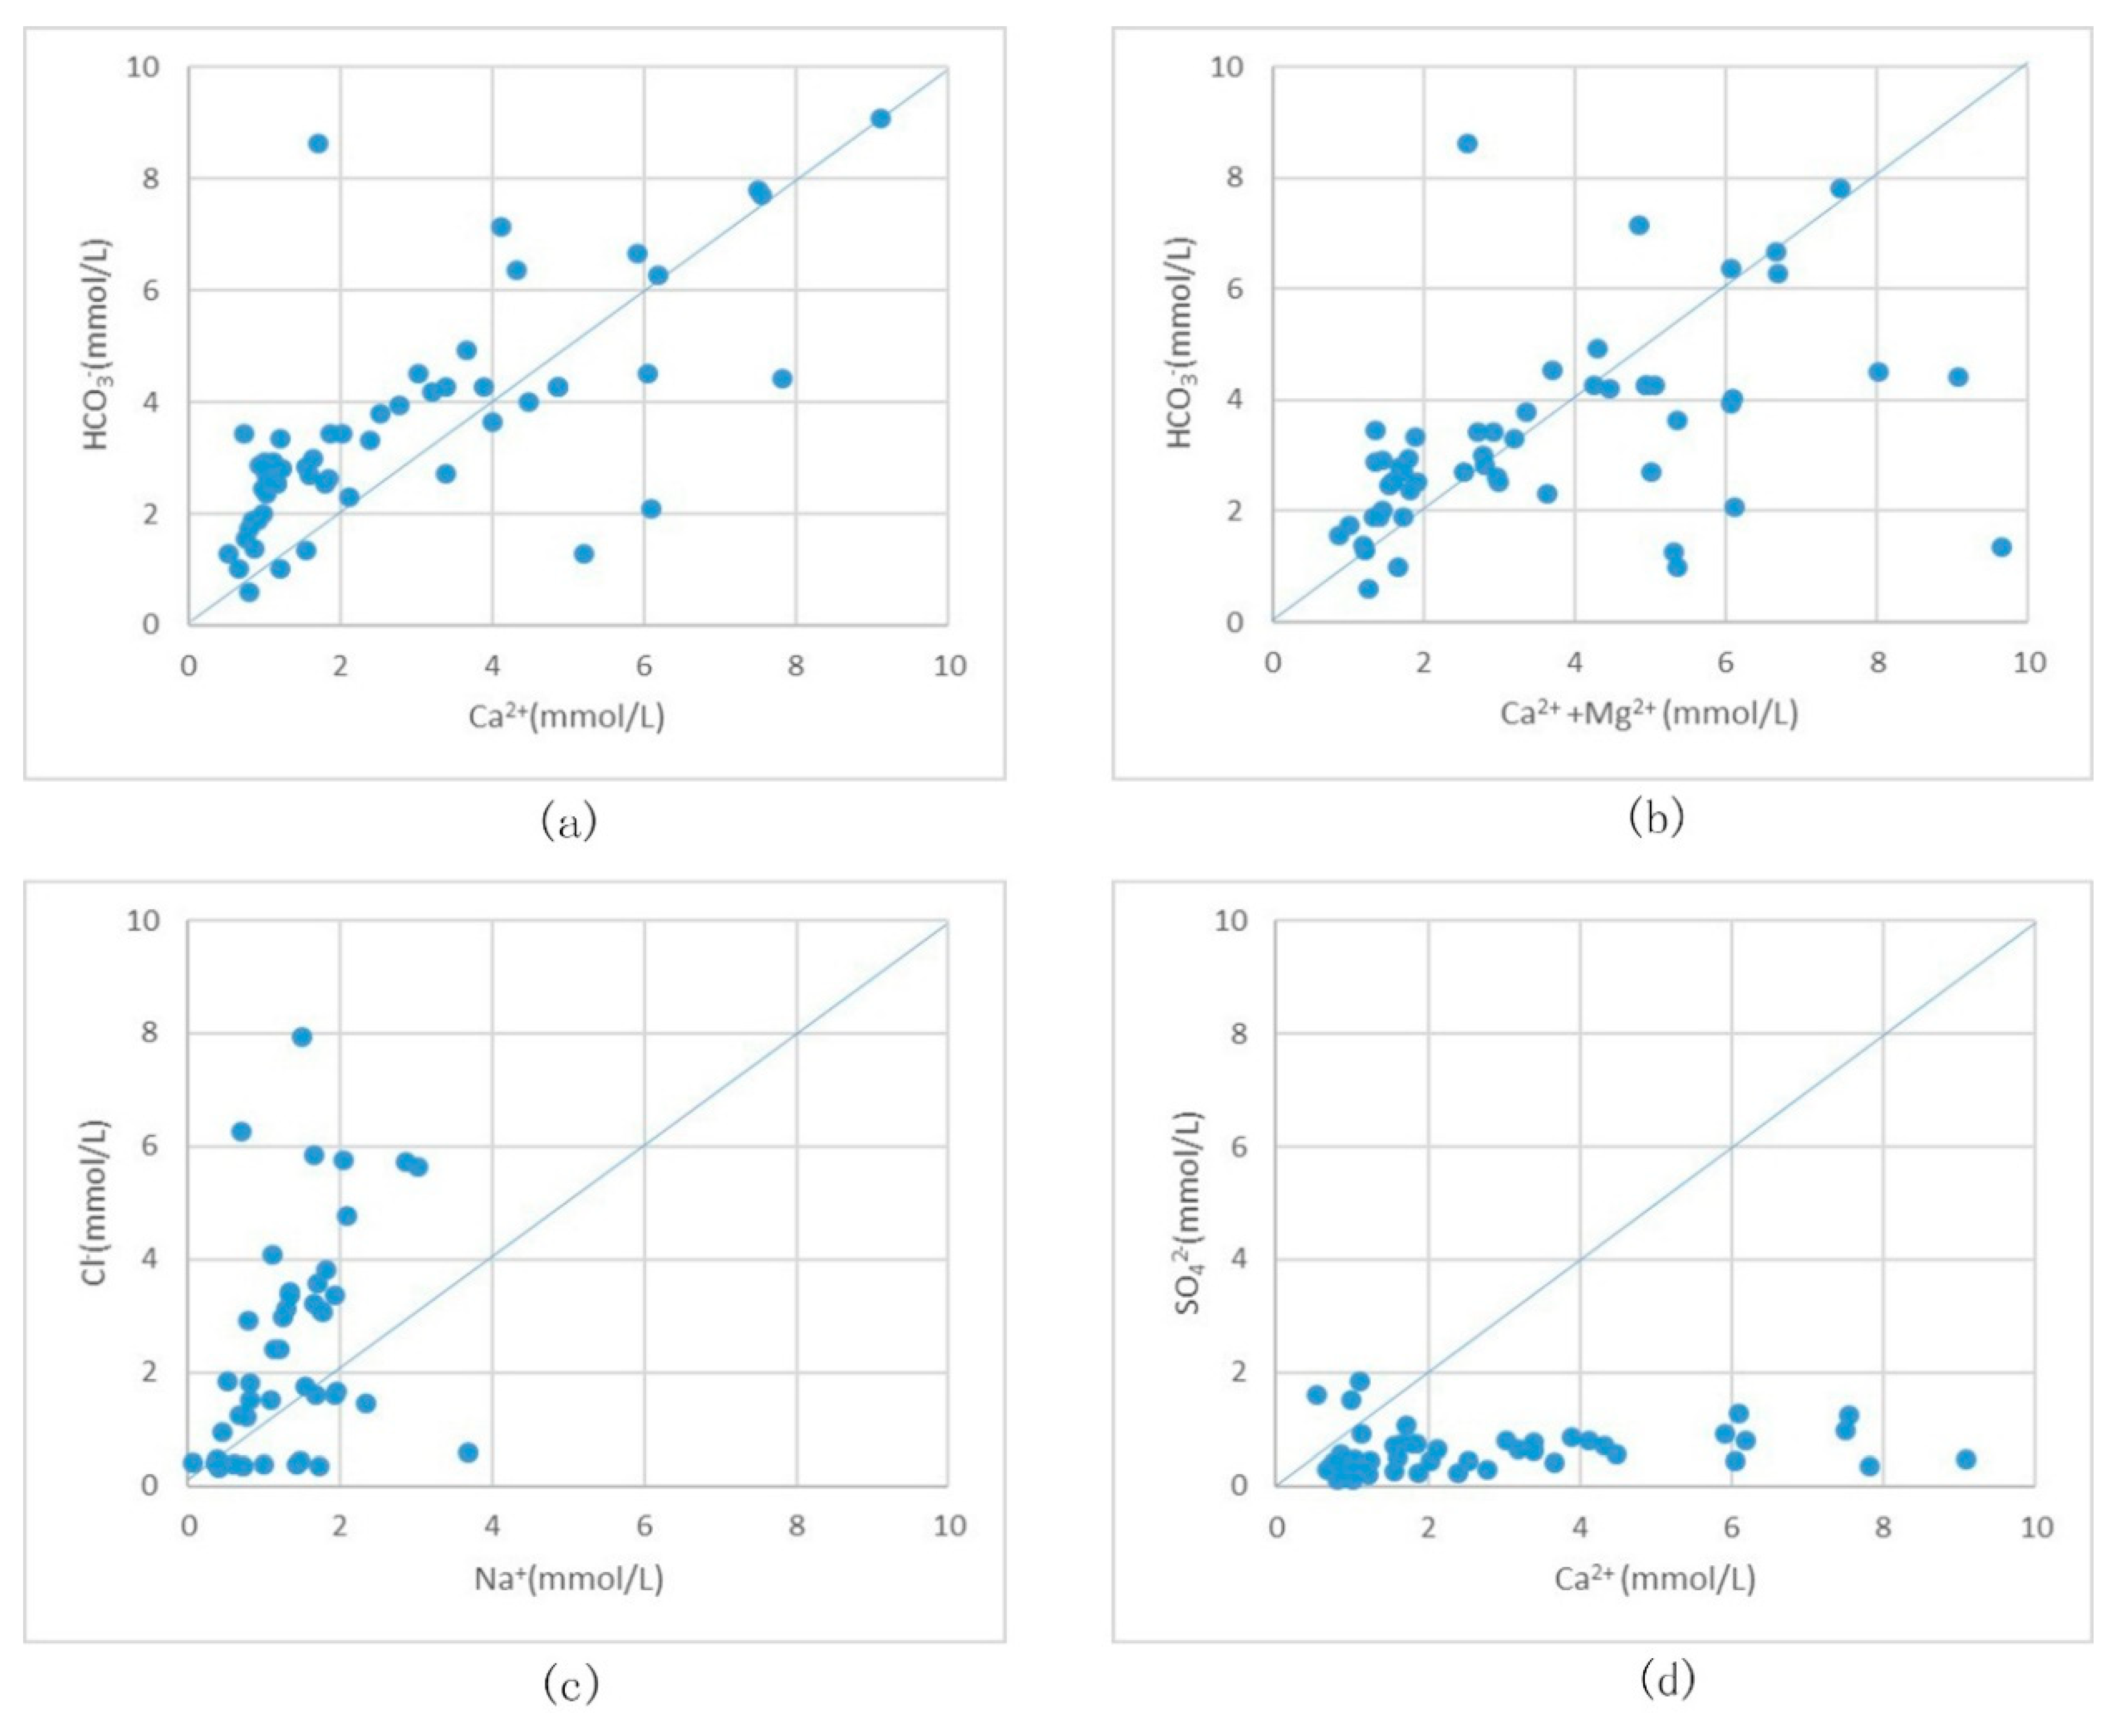
Source analysis of major ions in groundwater was conducted using ion-ratio maps (Figure 4).
4.2. LSTM Prediction Results
The above network was used to predict the water chemistry data from 2016 to 2018, and the prediction results were compared with the measured data as summarized in Table 4.
5. Discussion
5.1. Causes of Major Ion Chemistry
According to the data in Table 1 and Table 2, the main cation of the dividing area in the study area is Ca2+, the main anion is HCO3−, and the correlation between Ca2+ and HCO3− is high. The highest concentration cation is Ca2+, and the concentrations of Na+ and K+ ions are relatively low. There is also a negative correlation between Ca2+ and K+, and it is speculated that an ion exchange process may exist. The content of HCO3− of anions is the highest, followed by Cl− and SO42−.
5.1.1. Analysis of Ion Source by Ion-Ratio Method
The scatter plot of Ca2+ and HCO3− in Figure 4a shows a significant positive correlation, and the ratio is approximately 1.0, although it falls mostly above the 1:1 line. This indicates that there are other sources of HCO3− in the groundwater, although the deviation is mainly produced by the dissolution of carbonate minerals.
The ratio of (Ca2+ + Mg2+) to HCO3− reflects the dissolution of carbonate in groundwater. The data points in Figure 4b are mostly distributed on both sides of the 1:1 line, and there are more data points above the line. This indicates that the sources of Ca2+ and Mg2+ in the groundwater at different locations in the study area are different.
The ratio of Cl− to Na+ is proportional to 1 and can be used to estimate the source of Na+ in groundwater. When the ratio is greater than 1.0, it shows that the Na+ source in groundwater is due to the alternating adsorption of cations; when the ratio is less than 1, it indicates that the Na+ source in groundwater is from weathered silicate minerals. When the ratio is equal to 1, it indicates that the source of Na+ in groundwater is halo stone dissolution or seawater intrusion. The data points in Figure 4c are mostly above the 1:1 line, and a small portion are below the line. There are no data points on the 1:1 line, which indicates that the Na+ in the groundwater system of the study area is mainly caused by the alternating adsorption of cations. The weathering of silicate minerals also increases the Na+ in the groundwater system [20].
The conventional source of SO42− in groundwater is gypsum dissolution, which causes SO42− and Ca2+ in groundwater to increase in the same molar proportion. When the dissolution of other minerals leads to an increase in the Ca2+ content in the groundwater, the dissolution-sediment balance will reduce the SO42− content in the groundwater. If the Ca2+ generated by the dissolution of other minerals in the groundwater is insufficient to change the dissolution equilibrium, the alternating adsorption of cations will dominate the process, causing the Ca2+ content to decrease, and the dissolution equilibrium to increase the SO42− content in groundwater. The data points in Figure 4d conform to the above rules.
The carbonate mineral and gypsum dissolution reaction equations are as follows:
CaCO3 + CO2 + H2O ↔ Ca2+ + 2HCO3−
CaMg(CO3)2 + 2CO2 + 2H2O ↔ Ca2+ + Mg2+ + 4HCO3−
CaMg(CO3)2 + CaCO3 + 3CO2 + 3H2O ↔ 2Ca2+ + Mg2+ + 6HCO3−
CaSO4 ↔ Ca2+ + SO42−
5.1.2. Groundwater Environment Analysis Ion Origin
Ca2+ ions are the most abundant cations in groundwater, and their main sources can be divided into two types. The first source is through leaching. The Cretaceous Yaojia Formation in the study area strata is exposed in most areas, which leads to water-rock interaction of calcareous siltstone in the formation with phreatic water resulting in dissolution of calcium ions in the formation into the groundwater. Calcium ions are also contributed by the weathering of calcium feldspar, dolomite, and calcite in the soil that contains phreatic water. The study area is located within the influence of the Changbai Mountain volcano, and igneous rock component content in the soil is high. Speculatively, Ca2+ in the soil is mainly caused by anorthite weathering [21] according to the following chemical reaction:
CaAl2Si2O8 + 2CO2 + 3H20 ↔ Al2Si2O5(OH)4 + Ca2+ + 2HCO3−
Magnesium ions, are the main cations and have the weakest ionic reactivity with phreatic water, and there are no abnormalities in the study area. In the phreatic water, Mg2+ is generally produced by dolomite weathering and dissolution; however, the correlation between Mg2+ and Ca2+ is low (P = 0.27). This also demonstrates that Ca2+ in the water is not only produced by the weathering of dolomite but also exists from other sources
The main sources of sodium ions in groundwater are divided into three types: seawater intrusion, alternating cation adsorption, and albite weathering. The study area is an inland city, far from the sea, and therefore, Na+ is not related to seawater intrusion in this case; Na+ is mainly due to the alternating adsorption of cations and the dissolution of albite into groundwater [22].
Furthermore, as the study area is located at the confluence of the Yinma, Songhua, and Yitong rivers, groundwater runoff is active and the intensity of the alternation is significant. The Na+ in the rock layer is first transferred into the water and depleted as the most soluble cation. For long-term filtration, the cations that remain in the rock layer are all nearly insoluble Ca2+, and the cations in the groundwater are mainly Ca2+ [23]. This is also consistent with the observation that Ca2+ and total dissolved solids (TDS) have a high correlation (P = 0.75) as shown in Table 3.
The potassium ions have the lowest content among the main cations. Potassium feldspar (KAlSi3O8) is a source material in the soil and has a relatively high resistance to weathering. Therefore, K+ content in groundwater is generally low. The Gu Shanyu Formation and the Bai Tushan Formation in the study area contain silty sub-clay interlayers, which adsorb mobile K+ from groundwater and further reduce its content [24]. The correlation between K+ and Ca2+ (P = −0.13) also indicates to some extent that there is alternating adsorption between the two.
Bicarbonate ions are the most abundant anions in groundwater. In the natural state, the sources are usually from the following four sources:
- (1)
- Weathering and dissolution of silicate minerals in soil rocks including albite and anorthite. HCO3− is produced during the weathering process.
- (2)
- Generally, the CO2 partial pressure in soil voids is much higher than the Earth’s atmosphere, in the range of 102–104 Pa, which causes the CO2 and H2O in the soil to form H2CO3, which is unstable and is easily decomposed into HCO3−.
- (3)
- Organic matter is decomposed and oxidized; root plant respiration is another source of HCO3− in soil (O2 + CH2O = HCO3− + H+).
- (4)
- The CO2 in the atmosphere forms carbonic acid in the soil and then decomposes into HCO3− through rainwater dissolution.
The geochemical behavior of chloride ions is the simplest compared to other major ions in natural water. Chloride ions do not participate in any redox reactions, do not form complexes with other cations, and are not adsorbed by the mineral surface; their source is atmospheric precipitation and brine. According to the correlation between Na+ and Cl− (P = 0.42), a brine source is indicated for Cl−. However, brine dissolution is not the only source of Cl−, and precipitation also carries Cl− into groundwater [25].
In some parts of the study area, igneous rocks are exposed, where reduced metal sulfides are widely present. When sulfides come in contact with oxygenated water, they are oxidized to form SO42−, which increases the SO42− content in the groundwater.
In freshwater groundwater, the order of anion concentration is generally [HCO3−] > [SO42−] > [Cl−]; however, the groundwater sample data in the study area are described by [Cl−] > [ SO42−]. This indicates that there are strong evaporation and concentration phenomena in the groundwater of the study area, which lead to Cl− enrichment with depth of the phreatic water; thus, the ion concentration sequence is different from the conventional one.
5.2. Hydrochemical Evolution and Influencing Factors
From the Piper diagram, it is evident that Ca2+ is always the dominant cation in groundwater, accounting for approximately 80% of the whole. The dominant anion is gradually converted from HCO3− (1998, 70%) to Cl− (2018, 46%) and HCO3− (2018, 50%) jointly. It is evident from the data-point distribution of the diamond field in the figure, that the overall groundwater chemical characteristics of the study area are converted from >50% secondary alkalinity to >50% secondary salinity.
From the Gibbs diagram representing the year, it is evident that the main factors affecting the chemical groundwater action are gradually transformed from rock weathering to evaporation/precipitation [26]. This demonstrates that drought and desertification have gradually occurred in the study area, and the causes of drought and desertification are mainly the reduction of atmospheric precipitation and excessive exploitation and utilization of land by people. The study area is located at the lower reaches of the San he River, where the atmospheric precipitation has not changed significantly over the years. Therefore, the long-term excessive development and utilization of the land is the main reason for the change.
The research area has a long history of agriculture because of its fertile, easily cultivable land. The gross area of the research area is 322,600 ha, of which the cultivated area is 225,000 ha, accounting for 69.7% of the total. Under the influence of traditional irrigation, farming methods, and population pressure from 1998 to 2018, the amount of agricultural fertilizer used in the study area was approximately 160,000 tons historically, with an average of 0.72 tons/ha, far exceeding the national average of 0.43 tons/ha. Large areas of land reclamation and excessive application of chemical fertilizers have caused the lands in the study area gradually to degenerate and lose fertility, which further leads to land desertification. Land desertification leads to increased groundwater evaporation and ion concentration, including HCO3− as it is unstable in groundwater and easily decomposes into H2O and CO2 when the ion concentration increases. Therefore, Cl− will be enriched, resulting in an increase in TDS and the change of hydrochemical characteristics [27].
5.3. Groundwater Evolution Prediction
Traditional neural networks do not consider the timing for time-series data prediction. From the input-, hidden-, to the output layer, the layer-to-layer link is realized; however, the nodes of each layer are independent of each other. Due to the recursive relationship of the time series between data points, there is often a bias in predicting time-series data. To solve this problem, the nodes in the hidden layer of the recurrent neural networks (RNN) are connected, and the input of the hidden layers include the output of the input layer and the output of the hidden layer of the previous step. However, during the optimization process, it is possible that the existence of “gradient disappearance” or “gradient explosion” can cause errors in the prediction effect.
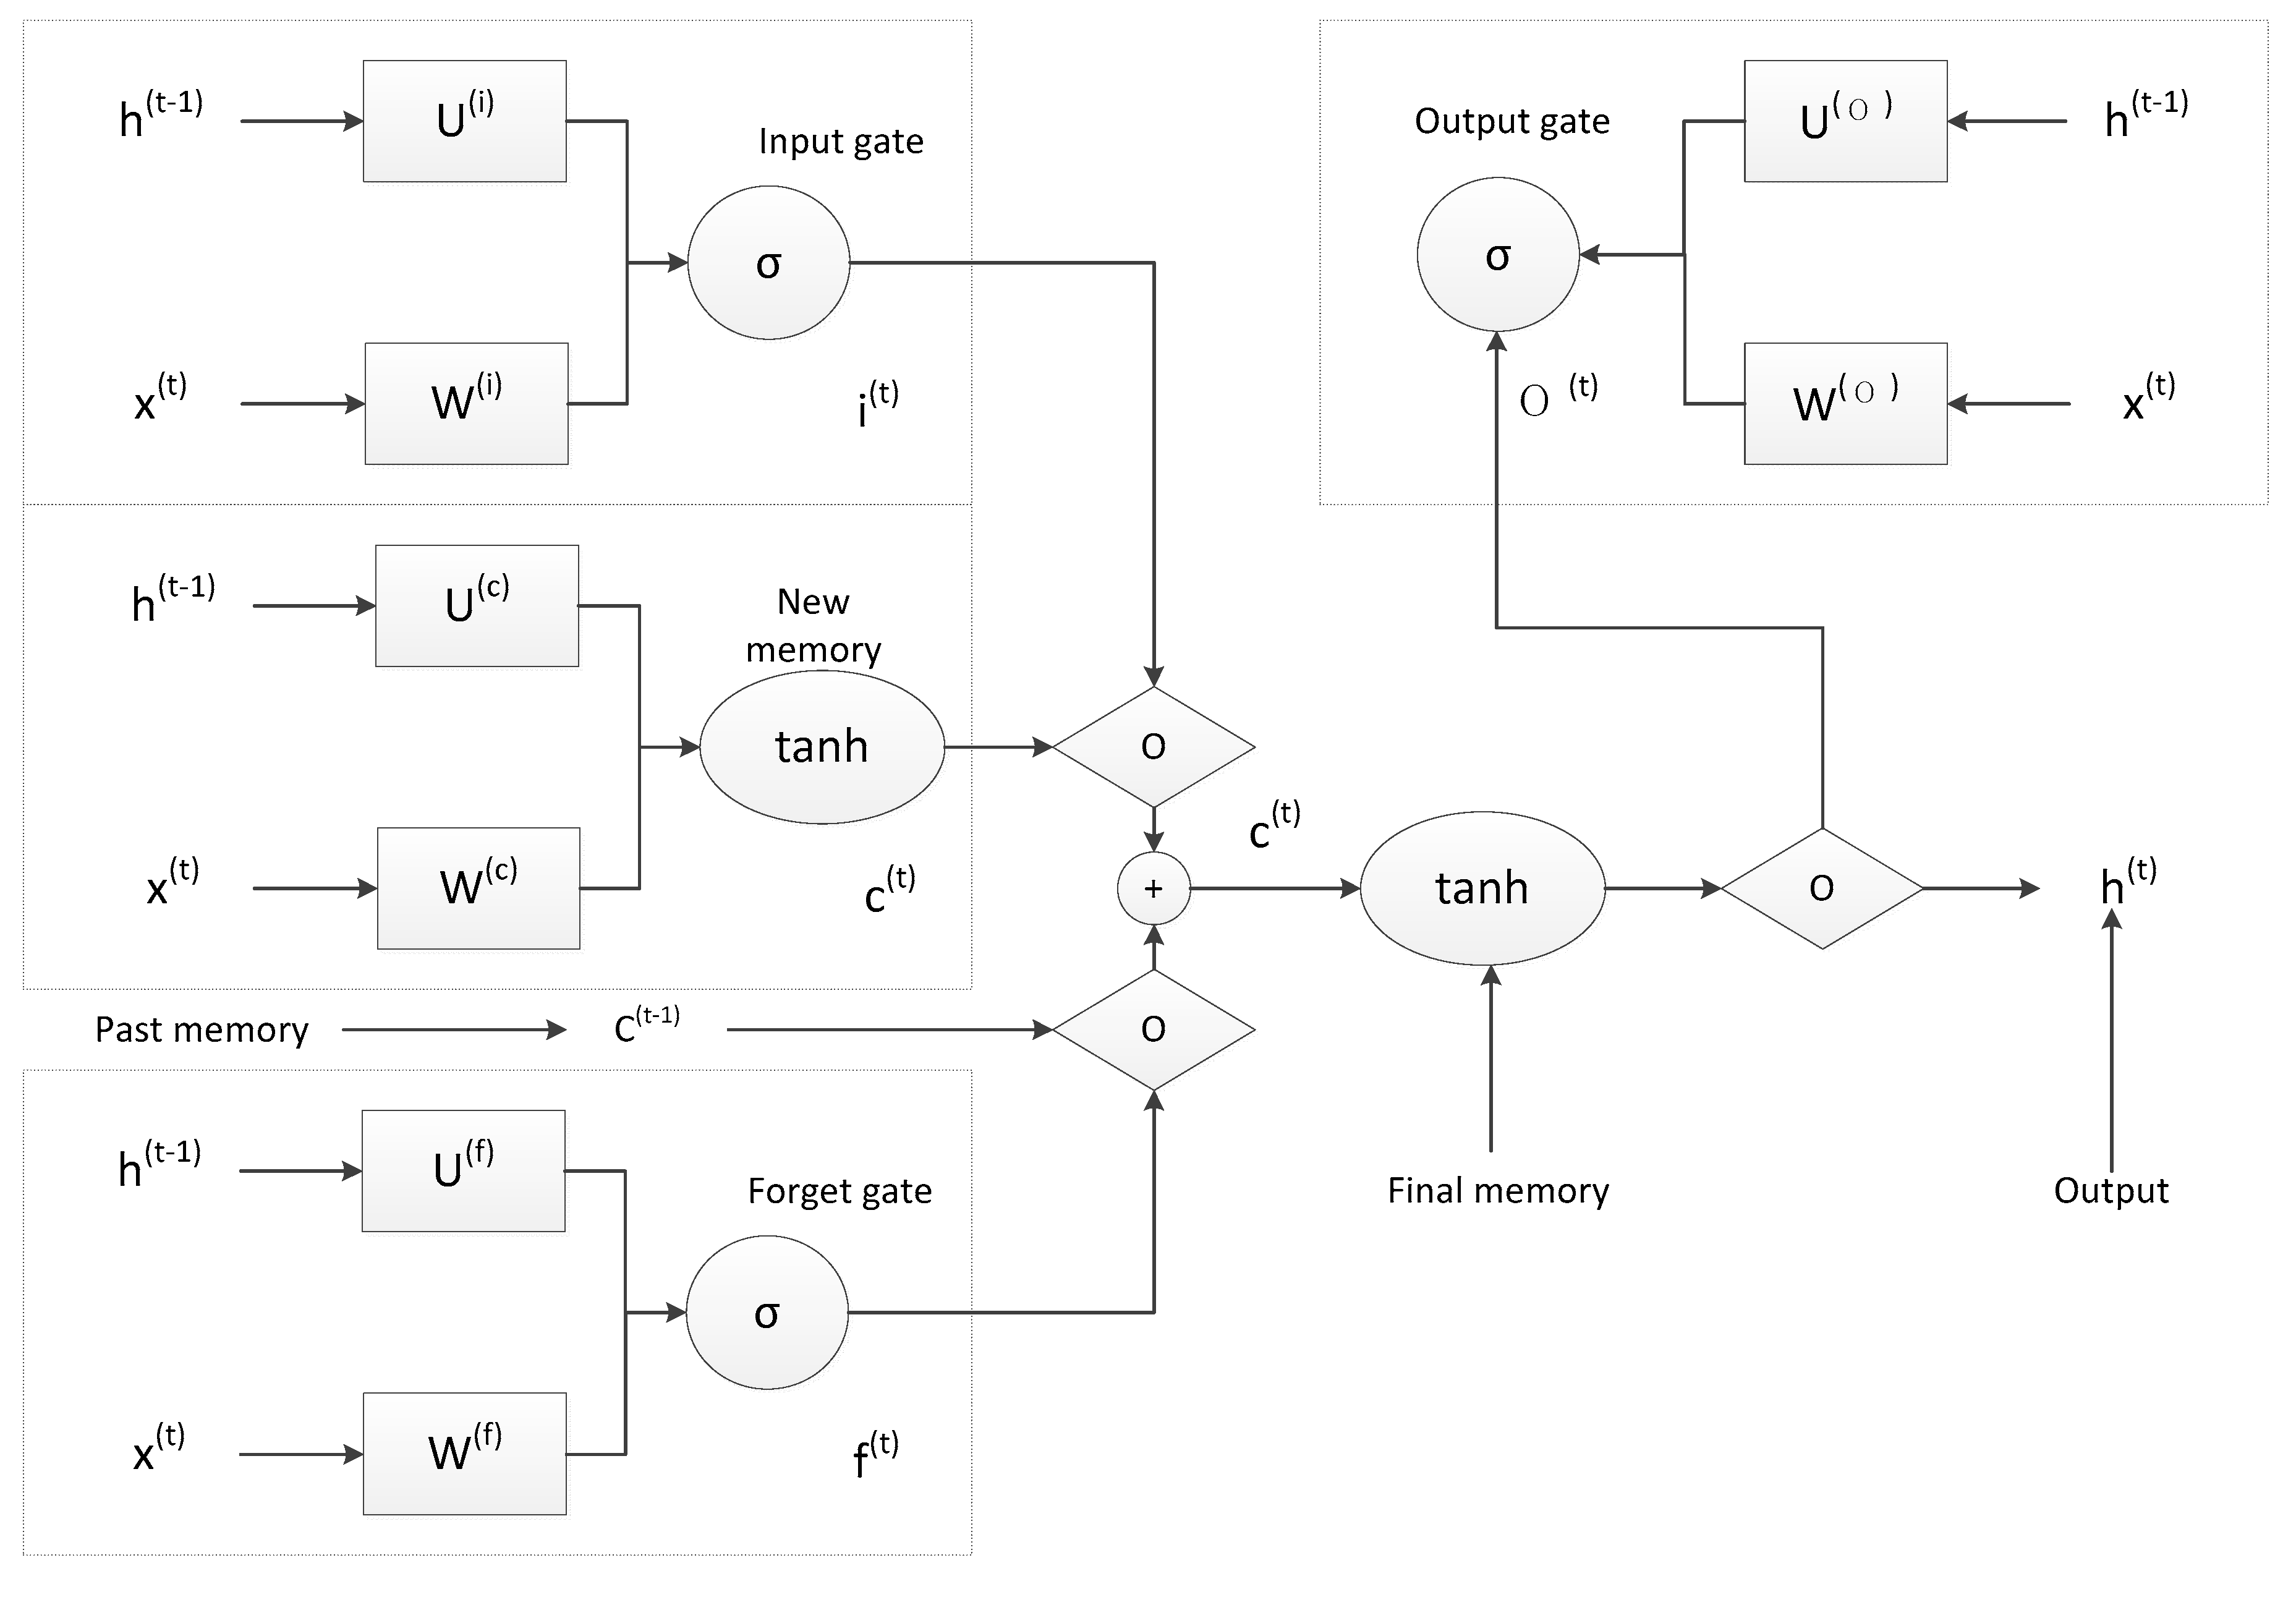
To solve such problems in RNN, Fletcher et al. proposed a method of minimizing the mean square error of noisy training data to optimize the number of dependent nodes in the artificial neural network, thereby making the fitted data more reliable [28]. Hochreiter and Schmidhuber proposed LSTM [29], which combined short-term and long-term memories using gate control, thereby solving the problem of gradient disappearance to a certain extent. The difference between LSTM and RNN is that it adds a “processor” to the algorithm to determine the usefulness of the information. The structure of this processor is called a cell. Three gates, namely input, forget, and output gates are placed in a cell. A piece of information enters the LSTM network, and it is judged for usefulness according to the rules. Only the information that meets the algorithm certification remain, and the non-conforming information is forgotten through the forget gate. The LSTM structure is shown in Figure 5.
Neural networks are generally used to predict unknown dependent variables through multiple independent variables, such as the use of data for atmospheric precipitation, evaporation, soil permeability coefficients, temperature, and the duration of sunlight to predict groundwater levels in the same year. Groundwater hydrochemistry is a gradual evolution process, and its data has clear continuity and specificity. This study intends to use groundwater chemical data of a known long-term series in the study area and utilize the time-series data processing ability of LSTM neural networks and the performance of analyzing the delay, to predict groundwater chemistry changes in the years following the known time series.
From Table 3, the neural network can fit the time-series changes of groundwater chemistry better, when the influencing factors of the study area have not changed significantly. Tested LSTM neural networks are used to predict groundwater chemical data for unknown periods, such as 2019–2021; the forecast data are summarized in Table 5.
Table 5 shows that the predicted values of Cl− and SO42− in 2019–2021 are both increasing, which indicates that without improvement measures in the study area, the secondary salinity of groundwater in the study area will continue to increase, which will cause the soil salinity to continue to increase. Therefore, the groundwater environmental protection measures in the study area should be established as soon as possible.
6. Conclusions
In this study, the causes, evolution trends, and prediction analysis of groundwater hydrochemical data sequences from 1998 to 2018 in Dehui City, Jilin Province, are analyzed, with the following conclusions:
The mineral characteristics and cation exchange of the study area together lead to the chemical groundwater characteristics with Ca2+ as the main cation and HCO3− as the main anion.
The main factors affecting the groundwater chemical characteristics of the study area gradually changed from rock weathering to evaporation/sedimentation over 20 years. The overall groundwater hydrochemical characteristics of the study area changed from >50% secondary alkalinity to >50% secondary salinity. The reason for this change is the long-term excessive use of chemical fertilizers in agricultural production that has degraded the land.
The multi-variable LSTM neural network model can be used as an effective tool for predicting the dynamic changes of groundwater water chemistry, and the fitting effect of historical data re-simulation is ideal. The time series prediction of groundwater chemical data using the LSTM neural network showed that without changing external conditions, the groundwater chemical characteristics of the study area will continue to change to secondary salinity within the next three years, resulting in increased soil salinity.
When using LSTM to make predictions in this study, the fitted results are only of the reference value because the data column is not long enough. When predicting the far future, the predicted data have clear errors with the extension of time. In the current study, data errors are not obvious when predicting the data for the next three years. However, the LSTM neural network, as a method that can predict non-variable data based on existing independent variable data, will have high potential in the prediction of groundwater environmental chemistry.
In future research, we can consider further optimizing the neural network model, and use data with higher accuracy and longer sequence to make predictions, so that the prediction results have higher stability and credibility.
Author Contributions
H.W. Compilation and revision for the study. X.L. provided guidance and research direction for the study. S.L. instructed the programming aspect of the study. M.L. provided help with the drawings. C.X. provided data required for the study. All authors have read and agreed to the published version of the manuscript.
Funding
Funding for this study was provided by the National Natural Science Foundation of China (Project Number: 41572216); the topic of “Songnen Plain Hydrogeological Survey”, Shenyang Geological Survey Center, China Geological Survey ([2019]DD20190340-W09); the special project of the provincial school joint construction plan-cutting-edge technology guidance (SXGJQY2017-6); the geothermal survey in the central and western regions of Jilin Province (Jilin Province Geological Exploration Fund (2018) Geological Prospecting 36-13); and Key research and development program of Shaanxi Province, Construction of Big Data Platform for Geotechnical Engineering (2017ZDCXL-SF-03-01-01).
Acknowledgments
This study was supported by the National Natural Science Foundation of China (NO: 41572216) and the Key Laboratory of Groundwater Resources and Environment.
Conflicts of Interest
The authors declare no conflict of interest. The funders had no role in the design of the study; in the collection, analyses, or interpretation of data; in the writing of the manuscript, or in the decision to publish the results.
References
- Delgado, C.; Pacheco, J.; Cabrera, A.; Batllori, E.; Orellana, R.; Bautista, F. Quality of groundwater for irrigation in tropical karst environment: The case of Yucatán, Mexico. Agric. Water Manag. 2010, 97, 1423–1433. [Google Scholar] [CrossRef]
- Helena, B.; Pardo, R.; Vega, M.; Barrado, E.; Fernández, J.M.; Luis Fernández, L. Temporal evolution of groundwater composition in an alluvial aquifer (Pisuerga River, Spain) by principal component analysis. Water Res. 2000, 34, 807–816. [Google Scholar] [CrossRef]
- Adams, S.; Titus, R.; Pietersen, K.; Tredoux, G.; Harris, C. Hydrochemical characteristics of aquifers near Sutherland in the Western Karoo, South Africa. J. Hydrol. 2001, 241, 91–103. [Google Scholar] [CrossRef] [Green Version]
- Celle-Jeanton, H.; Huneau, F.; Travi, Y.; Edmunds, W.M. Twenty years of groundwater evolution in the Triassic sandstone aquifer of Lorraine: Impacts on baseline water quality. Appl. Geochem. 2009, 24, 1198–1213. [Google Scholar] [CrossRef] [Green Version]
- Kuo, Y.M.; Liu, C.W.; Lin, K.H. Evaluation of the ability of an artificial neural network model to assess the variation of groundwater quality in an area of blackfoot disease in Taiwan. Water Res. 2004, 38, 148–158. [Google Scholar] [CrossRef] [PubMed]
- Ahmed, A.A.; Ali, M.H. Hydrochemical evolution and variation of groundwater and its environmental impact at Sohag, Egypt. Arab. J. Geosci. 2011, 4, 339–352. [Google Scholar] [CrossRef]
- Şen, Z. Standard ion index for groundwater quality evolution. Water Qual. Expo. Health 2011, 3, 193–202. [Google Scholar] [CrossRef]
- Rattray, G. Geochemical evolution of groundwater in the Mud Lake area, Eastern Idaho, USA. Environ. Earth Sci. 2015, 73, 8251–8269. [Google Scholar] [CrossRef] [Green Version]
- Kohlhepp, B.; Lehmann, R.; Seeber, P.; Küsel, K.; Trumbore, S.E.; Totsche, K.U. Aquifer configuration and geostructural links control the groundwater quality in thin-bedded carbonate–siliciclastic alternations of the Hainich CZE, central Germany. Hydrol. Earth Syst. Sci. 2017, 21, 6091–6116. [Google Scholar] [CrossRef] [Green Version]
- Ma, R.; Shi, J.; Liu, J.; Gui, C. Combined use of multivariate statistical analysis and hydrochemical analysis 417 for groundwater quality evolution: A case study in north chain plain. J. Earth Sci. 2014, 25, 587–597. [Google Scholar] [CrossRef]
- Edet, A. Seasonal and spatio-temporal patterns, evolution and quality of groundwater in Cross River State, Nigeria: Implications for groundwater management. Sustain. Water Resour. Manag. 2019, 5, 667–687. [Google Scholar] [CrossRef]
- Qian, F.; Changlai, X.; Da, L.; Liang, X.; Li, H.; Tian, H. Identification and spatial distribution of shallow groundwater pollution sources in Dehui City. Water Res. Hydropower Technol. 2018, 49, 111–117. [Google Scholar]
- Jingwei, L. Research on Groundwater Basic Environment in Dehui Area of Jilin Province. Master’s Thesis, Jilin University, Jilin, China, 2016. [Google Scholar]
- Xiuqiu, M. Development and utilization of groundwater and ecological environment protection. Urban Geogr. 2015, 22, 221. [Google Scholar]
- Zhonghua, L. (Ed.) Dehui City Water Supply Hydrogeological Survey Report; Dehui Statistics Bureau: Dehui, China, 2018. [Google Scholar]
- Zhongcheng, W. (Ed.) Jilin Province Groundwater Dynamic Data (1998–2018); Bureau of Hydrology and Water Resources of Jilin Province: Changchun, China, 2018. [Google Scholar]
- National Bureu Statistics of China. China Statistical Yearbook (1998–2018); China Statistics Press: Beijing, China, 2018. [Google Scholar]
- Piper, A.M. A graphic procedure in the geochemical interpretation of water-analyses. Am. Geophy. Union Trans. 1944, 25, 914–923. [Google Scholar] [CrossRef]
- Gibbs, J.R. Mechanisms controlling world water chemistry. Science 1970, 170, 1088–1090. [Google Scholar] [CrossRef]
- Subramani, T.; Rajmohan, N.; Elango, L. Groundwater geochemistry and identification of hydrogeochemical processes in a hard rock region, Southern India. Environ. Monit. Assess. 2010, 162, 123–137. [Google Scholar] [CrossRef]
- Zhang, F.; Zhangdong, J.; Jimin, Y.; Zhou, Y.; Zhoua, L. Hydrogeochemical processes between surface and groundwaters on the northeastern Chinese Loess Plateau: Implications for water chemistry and environmental evolutions in semi-arid regions. J. Geochem. Explor. 2015, 159, 115–128. [Google Scholar] [CrossRef]
- Nageswara Rao, P.V.; Appa Rao, S.; Subba Rao, N. Geochemical evolution of groundwater in the Western Delta region of River Godavari, Andhra Pradesh, India. Appl. Water Sci. 2017, 7, 1–10. [Google Scholar] [CrossRef] [Green Version]
- Elango, L.; Kannan, R.; Senthil, K.M. Major ion chemistry and identification of hydrogeochemical processes of ground water in a part of Kancheepuram district, Tamil Nadu, India. Environ. Geosci. 2009, 1, 157–166. [Google Scholar]
- Wu, J.; Sun, Z. Evaluation of shallow groundwater contamination and associated human health risk in an alluvial plain impacted by agricultural and industrial activities, mid-west China. Expo. Health 2016, 8, 311–329. [Google Scholar] [CrossRef]
- Wu, J.; Li, P.; Qian, H.; Duan, Z.; Zhang, X. Using correlation and multivariate statistical analysis to identify hydrogeochemical processes affecting the major ion chemistry of waters: A case study in Laoheba phosphorite mine in Sichuan, China. Arab. J. Geosci. 2014, 7, 3973–3982. [Google Scholar] [CrossRef]
- Stiff, H.A., Jr. The interpretation of chemical water analysis by means of patterns. J. Petrol. Technol. 1951, 3, 15–17. [Google Scholar] [CrossRef]
- Hui, Q.; Peiyue, L. Hydrochemical characteristics of groundwater in yinchuan plain and their control factors. Asian J. Chem. 2011, 23, 2927–2938. [Google Scholar]
- Fletcher, L.; Katkovnik, V.; Steffens, F.E.; Engelbrecht, A.P. Optimizing the number of hidden nodes of a feed forward artificial neural network. In Proceedings of the International Joint Conference on Neural Networks, Anchorage, AK, USA, 4–9 May 1998; pp. 1608–1612. [Google Scholar]
- Hochreiter, S.; Schmidhuber, J.A. Long short-term memory. Neural Comput. 1997, 9, 1735–1780. [Google Scholar] [CrossRef] [PubMed]
Figure 1.
Location map of study area.

Figure 2.
Representative Piper plot for annual groundwater quality.

Figure 3.
Representative Gibbs diagram for annual groundwater quality.

Figure 4.
Ion ratio plots. (a) The scatter plot of Ca2+ and HCO3− can be used to analyze the dissolution of carbonate minerals; (b) The ratio of (Ca2+ + Mg2+) to HCO3− reflects the dissolution of carbonate in groundwater; (c) The ratio of Cl− to Ca2+ can be used to estimate the source of Na+ in groundwater. (d) The ratio of SO42− to Ca2+ can be used to analyze the dissolution of gypsum in groundwater.

Figure 5.
Long-term and short-term memory output structure diagram.


Table 1.
Stratigraphic structure characteristics of Dehui City.
| Era Them | System | Series | Formation | Structure and Distribution Characteristics | Thickness (m) |
|---|---|---|---|---|---|
| Cenozoic | Q4 | Holocene | The upper part is gray-brown loam and silt interlayer, and the lower part is yellow sand and gravel. Widely distributed on floodplain sand. | 3~30 | |
| Upper Pleistocene | Gu Xiangtun | The upper part is earthy yellow loess, which is silty light loess. The lower part is the lacustrine muddy loam, loam and sand gravel layer. Mainly distributed in the edge of the high plains and valleys. | 20~40 | ||
| Lower Pleistocene | Bai Tushan | The lithology is gray-white gravel mixed with gray-green silty clay lens, with coarse top and fine bottom. The cross-bedding is developed in the upper sand layer, and the bottom is dominated by pebbles, and it is in angular unconformity contact with the lower bedrock, which is only exposed on the Dongqidaoquanzi ridge of Bian Gang Township. | 2~5 | ||
| Mesozoic | Cretaceous | Middle-lower series | Nen Jiang | The upper part is gray-black, gray-green and brown-red mudstone and sandstone interbedded layers. The lower part is black mudstone and oil shale, which are distributed in most parts of the western part of Dehui city and Dajiagou and Songhuajiang towns. | 200~600 |
| Yao Jia | It is exposed on the east steep ridge of Yaojia Station, with complete sections. There are exposed steep slopes and gullies in poplar, Dafangshen, Xiajiadian, Daqingzui and other villages. The lithology is mainly brown-red, dark purple silty mudstone and mudstone, with gray to grayish green mudstone, grayish white. Siltstone Calcareous siltstone. | 100 | |||
| Qing Shangkou | It is distributed in Yangshu Town, Dafangshen Town, and the southern part of Daqingzui Town, with some steep ridges directly exposed on the ground. The lithology is gray-white, dark blue, thin layered mudstone. | 40~65 | |||
| Quan Tou | Distributed in the Wutai Township area, exposed in the gullies, the lithology is mainly pig liver-colored, brown-red thick mudstone, the bottom of this layer is a gravelly coarse sand layer, and the sandstone is all argillaceous cement. | 300 | |||
| Deng Louku | The lithology is mainly sandstone, dark gray sandstone, mudstone, and purple sandstone. Visible in the deep part of the borehole on the bank of the Songhua River. | >1000 | |||
| Jurassic | Upper-middle series | Distributed in Banla Mountain, Chaoyang Township in the east. The exposed area is small and is the product of volcanic eruption. The lithology is Zhongxing Andesite, brown-red, with hard lithology and well-developed cracks |
Table 2.
Statistical analysis results of water quality data.
| Unit | MAX | MIN | MEAN | |
|---|---|---|---|---|
| Ca2+ | mg/L | 364 | 21.64 | 108.36 |
| Mg2+ | mg/L | 219 | 0.2 | 38.97 |
| K+ | mg/L | 2.4 | 0.2 | 1.63 |
| Na+ | mg/L | 84.9 | 1.38 | 28.26 |
| Cl− | mg/L | 482 | 13.4 | 73.72 |
| SO42− | mg/L | 177 | 6.8 | 54.03 |
| HCO3− | mg/L | 554 | 36.6 | 210.03 |
| TDS (Total dissolved solids) | mg/L | 2254 | 206.2 | 703.23 |
Table 3.
Correlation Matrix.
| Ca2+ | Mg2+ | K+ | Na+ | Cl− | SO42− | HCO3− | TDS | |
|---|---|---|---|---|---|---|---|---|
| Ca2+ | 1 | |||||||
| Mg2+ | 0.2711 | 1 | ||||||
| K+ | −0.1325 | −0.0538 | 1 | |||||
| Na+ | 0.2867 | 0.1008 | 0.1388 | 1 | ||||
| Cl− | 0.5258 | 0.1853 | 0.0001 | 0.4198 | 1 | |||
| SO42− | 0.1681 | 0.2748 | 0.1306 | 0.1222 | 0.2007 | 1 | ||
| HCO3− | 0.7123 | −0.0320 | 0.0054 | 0.3680 | 0.4461 | 0.2907 | 1 | |
| TDS | 0.7536 | −0.1568 | 0.0222 | 0.2569 | 0.4395 | 0.1189 | 0.6505 | 1 |
Table 4.
List of predicted and actual errors.
| Ion | Years | Actual Measurement Data | Forecast Data | Absolute Error | Relative Error |
|---|---|---|---|---|---|
| Ca2+ | 2016 | 44.090 | 44.085 | −0.005 | −0.0113% |
| 32.870 | 32.876 | 0.006 | 0.0183% | ||
| 160.320 | 160.313 | −0.007 | −0.0044% | ||
| 189.180 | 189.179 | −0.001 | −0.0005% | ||
| 21.640 | 21.645 | 0.005 | 0.0231% | ||
| 2017 | 100.800 | 100.792 | −0.008 | −0.0075% | |
| 117.700 | 117.655 | −0.045 | −0.0380% | ||
| 135.900 | 135.896 | −0.004 | −0.0027% | ||
| 136.200 | 136.169 | −0.031 | −0.0230% | ||
| 130.300 | 130.297 | −0.003 | −0.0027% | ||
| 2018 | 48.500 | 48.493 | −0.007 | −0.0144% | |
| 45.500 | 45.503 | 0.003 | 0.0066% | ||
| 208.000 | 208.135 | 0.135 | 0.0649% | ||
| 204.000 | 204.096 | 0.096 | 0.0471% | ||
| 32.100 | 32.103 | 0.003 | 0.0093% | ||
| Mg2+ | 2016 | 19.44 | 19.443 | 0.003 | 0.0154% |
| 9.23 | 9.229 | −0.001 | −0.0108% | ||
| 32.08 | 32.083 | 0.003 | 0.0094% | ||
| 83.59 | 83.586 | −0.004 | −0.0048% | ||
| 16.52 | 16.527 | 0.007 | 0.0424% | ||
| 2017 | 20.60 | 20.592 | −0.008 | −0.0391% | |
| 22.00 | 22.017 | 0.017 | 0.0773% | ||
| 14.90 | 14.909 | 0.009 | 0.0600% | ||
| 10.70 | 10.695 | −0.005 | −0.0425% | ||
| 7.00 | 6.993 | −0.007 | −0.0994% | ||
| 2018 | 10.40 | 10.403 | 0.003 | 0.0288% | |
| 8.10 | 8.100 | 0.000 | 0.0000% | ||
| 2.81 | 2.810 | 0.000 | 0.0000% | ||
| 50.40 | 50.396 | −0.004 | −0.0079% | ||
| 11.40 | 11.403 | 0.003 | 0.0263% | ||
| K+ | 2016 | 0.37 | 0.369 | −0.001 | −0.2703% |
| 0.44 | 0.442 | 0.002 | 0.4545% | ||
| 0.59 | 0.587 | −0.003 | −0.5085% | ||
| 0.82 | 0.822 | 0.002 | 0.2439% | ||
| 1.39 | 1.393 | 0.003 | 0.2158% | ||
| 2017 | 0.50 | 0.498 | −0.002 | −0.3136% | |
| 0.40 | 0.402 | 0.002 | 0.4758% | ||
| 0.30 | 0.301 | 0.001 | 0.4386% | ||
| 0.30 | 0.299 | −0.001 | −0.3813% | ||
| 1.20 | 1.205 | 0.005 | 0.4011% | ||
| 2018 | 0.38 | 0.380 | 0.000 | 0.0000% | |
| 0.55 | 0.550 | 0.000 | 0.0000% | ||
| 0.85 | 0.850 | 0.000 | 0.0000% | ||
| 1.00 | 1.001 | 0.001 | 0.1000% | ||
| 1.14 | 1.140 | 0.000 | 0.0000% | ||
| Na+ | 2016 | 8.22 | 8.225 | 0.005 | 0.0608% |
| 11.65 | 11.658 | 0.008 | 0.0687% | ||
| 37.82 | 37.816 | −0.004 | −0.0106% | ||
| 38.09 | 38.088 | −0.002 | −0.0053% | ||
| 9.23 | 9.226 | −0.004 | −0.0433% | ||
| 2017 | 32.20 | 32.155 | −0.045 | −0.1411% | |
| 33.00 | 33.046 | 0.046 | 0.1387% | ||
| 31.60 | 31.636 | 0.036 | 0.1145% | ||
| 31.80 | 31.838 | 0.038 | 0.1185% | ||
| 32.00 | 31.988 | −0.012 | −0.0363% | ||
| 2018 | 1.38 | 1.381 | 0.001 | 0.0725% | |
| 12.40 | 12.403 | 0.003 | 0.0242% | ||
| 29.70 | 29.704 | 0.004 | 0.0135% | ||
| 42.20 | 42.198 | −0.002 | −0.0047% | ||
| 8.88 | 8.873 | −0.007 | −0.0788% | ||
| Cl− | 2016 | 14.90 | 14.902 | 0.002 | 0.0134% |
| 20.80 | 20.798 | −0.002 | −0.0096% | ||
| 114.00 | 114.002 | 0.002 | 0.0018% | ||
| 416.00 | 416.015 | 0.015 | 0.0036% | ||
| 10.90 | 10.903 | 0.003 | 0.0275% | ||
| 2017 | 34.90 | 34.896 | −0.004 | −0.0120% | |
| 55.50 | 55.474 | −0.026 | −0.0466% | ||
| 146.40 | 146.442 | 0.042 | 0.0289% | ||
| 209.60 | 209.552 | −0.048 | −0.0228% | ||
| 190.70 | 190.653 | −0.047 | −0.0248% | ||
| 2018 | 14.00 | 14.001 | 0.001 | 0.0071% | |
| 17.80 | 17.800 | 0.000 | 0.0000% | ||
| 111.00 | 111.013 | 0.013 | 0.0117% | ||
| 470.00 | 470.196 | 0.196 | 0.0417% | ||
| 16.40 | 16.400 | 0.000 | 0.0000% | ||
| SO42− | 2016 | 177.00 | 176.993 | −0.007 | −0.0040% |
| 13.20 | 13.225 | 0.025 | 0.1894% | ||
| 126.00 | 125.869 | −0.131 | −0.1040% | ||
| 26.30 | 26.287 | −0.013 | −0.0494% | ||
| 154.00 | 154.022 | 0.022 | 0.0143% | ||
| 2017 | 68.40 | 68.379 | −0.021 | −0.0302% | |
| 67.90 | 67.874 | −0.026 | −0.0378% | ||
| 79.00 | 78.992 | −0.008 | −0.0097% | ||
| 70.60 | 70.607 | 0.007 | 0.0093% | ||
| 76.70 | 76.746 | 0.046 | 0.0606% | ||
| 2018 | 94.30 | 94.308 | 0.008 | 0.0085% | |
| 94.30 | 94.308 | 0.008 | 0.0085% | ||
| 135.00 | 135.056 | 0.056 | 0.0415% | ||
| 28.40 | 28.402 | 0.002 | 0.0070% | ||
| 134.00 | 134.072 | 0.072 | 0.0537% | ||
| HCO3− | 2016 | 153.00 | 152.983 | −0.017 | −0.0111% |
| 77.90 | 77.900 | 0.000 | 0.0000% | ||
| 222.00 | 222.016 | 0.016 | 0.0072% | ||
| 299.00 | 298.893 | −0.107 | −0.0358% | ||
| 77.90 | 77.904 | 0.004 | 0.0051% | ||
| 2017 | 165.60 | 165.583 | −0.017 | −0.0102% | |
| 134.40 | 134.362 | −0.038 | −0.0286% | ||
| 168.00 | 167.990 | −0.010 | −0.0058% | ||
| 212.60 | 212.627 | 0.027 | 0.0127% | ||
| 224.30 | 224.262 | −0.038 | −0.0168% | ||
| 2018 | 61.00 | 61.025 | 0.025 | 0.0410% | |
| 48.80 | 48.806 | 0.006 | 0.0123% | ||
| 77.80 | 77.809 | 0.009 | 0.0116% | ||
| 80.80 | 80.810 | 0.010 | 0.0124% | ||
| 36.60 | 36.579 | −0.021 | −0.0574% |
Table 5.
Forecast of groundwater hydro-chemical data during 2019–2021.
| Ca2+ | Mg2+ | K+ | Na+ | Cl− | SO42− | HCO3− | |
|---|---|---|---|---|---|---|---|
| 62.31 | 19.08 | 0.42 | 10.13 | 43.07 | 103.74 | 112.55 | |
| 34.08 | 16.72 | 0.43 | 12.74 | 53.07 | 53.22 | 71.12 | |
| 2019 | 204.03 | 21.06 | 0.41 | 41.65 | 335.54 | 124.01 | 77.05 |
| 244.05 | 45.05 | 0.81 | 38.82 | 467.91 | 37.24 | 199.03 | |
| 27.14 | 11.09 | 1.23 | 10.13 | 43.55 | 26.63 | 61.17 | |
| 65.71 | 15.24 | 0.44 | 17.45 | 52.44 | 103.47 | 92.62 | |
| 48.12 | 47.13 | 0.46 | 13.92 | 143.01 | 74.11 | 97.13 | |
| 2020 | 237.77 | 24.12 | 0.35 | 45.33 | 419.04 | 113.04 | 90.53 |
| 224.93 | 38.45 | 0.76 | 60.32 | 515.08 | 33.16 | 140.61 | |
| 32.51 | 13.04 | 1.93 | 10.65 | 45.48 | 33.09 | 64.71 | |
| 55.65 | 18.85 | 0.43 | 17.22 | 59.01 | 99.34 | 86.12 | |
| 46.92 | 32.33 | 0.34 | 22.08 | 117.11 | 110 | 165.08 | |
| 2021 | 221.98 | 33.61 | 0.44 | 48.55 | 434.09 | 115.47 | 94.26 |
| 225.42 | 50.99 | 0.52 | 51.67 | 437.21 | 45 | 128.32 | |
| 47.72 | 12.73 | 1.53 | 15.96 | 75.5 | 38.58 | 77.23 |
Publisher’s Note: MDPI stays neutral with regard to jurisdictional claims in published maps and institutional affiliations. |
© 2020 by the authors. Licensee MDPI, Basel, Switzerland. This article is an open access article distributed under the terms and conditions of the Creative Commons Attribution (CC BY) license (http://creativecommons.org/licenses/by/4.0/).
Share and Cite
MDPI and ACS Style
Wei, H.; Liang, X.; Liu, S.; Liu, M.; Xiao, C. Hydrochemical Evolution of Groundwater in Dehui, China. Water 2020, 12, 3378. https://doi.org/10.3390/w12123378
AMA Style
Wei H, Liang X, Liu S, Liu M, Xiao C. Hydrochemical Evolution of Groundwater in Dehui, China. Water. 2020; 12(12):3378. https://doi.org/10.3390/w12123378
Chicago/Turabian StyleWei, Hongyang, Xiujuan Liang, Shuhui Liu, Mingjun Liu, and Changlai Xiao. 2020. "Hydrochemical Evolution of Groundwater in Dehui, China" Water 12, no. 12: 3378. https://doi.org/10.3390/w12123378
Note that from the first issue of 2016, this journal uses article numbers instead of page numbers. See further details here.