Measurement and Modelling of Moisture Distribution and Water Binding Energy of Dredged Sludge


1
College of Civil Engineering and Architecture, Zhejiang University, Hangzhou 310058, China
2
Zhejiang Design Institute of Water Conservancy and Hydro-Electric Power, Hangzhou 310002, China
3
Zhejiang Tongji Vocational College of Science and Technology, Hangzhou 311231, China
*
Author to whom correspondence should be addressed.
Water 2020, 12(12), 3395; https://doi.org/10.3390/w12123395
Submission received: 11 October 2020
/
Revised: 27 November 2020
/
Accepted: 1 December 2020
/
Published: 2 December 2020
(This article belongs to the Special Issue Circle Sustainability of Wastewater and Sludge Treatment)
Abstract
:The dewatering of dredged sludge is a critical step in the minimization and reutilization of this solid waste. However, there is a lack of available literature on the fundamental drying characteristics of dredged sludge. In this work, two kinds of typical sludge dredged from an urban watercourse were tested by low-field NMR to investigate the water distribution in sludge and it was found that water contained in sludge can be classified into three categories: free water, capillary water and bound water. In addition, a novel model was proposed based on the Lennard-Jones equation and Kelvin law to quantitatively evaluate the binding energy during drying. Further, the model results were experimentally verified by thermogravimetry differential thermal analysis (TG-DTA). Results show that the trends of the model are consistent with the experimental values and the gradient of energy consumption during dehydration can be divided into three main stages. In stage 1, the total energy required for dewatering equals the latent heat of free water. In stage 2, binding energy reaches dozens to hundreds of kJ/kg accounting for capillary action. In stage 3, binding energy increases steeply reaching almost thousands of kJ/kg due to intermolecular interactions. All the discovered aspects could improve the management and disposal of dredged sludge from an energy cost perspective.
1. Introduction
Dredged sludge is the soil with high moisture content coming from the dredging marine operation in continental watercourses, and is formed by particles introduced into the ecosystem, and precipitates formed by biochemical processes in aquatic environments [1]. Considerable volumes of sediments are dredged annually all over the world. Annually, over 100 million tons of sludge are dredged in China [2], against about 230 million tons in the USA [3], and 200 million tons in Western Europe [1]. Treating these huge amounts of sediments is a major challenge, and in the past, dredged sludge was dumped directly at sea in many coastal countries, which potentially deteriorated the benthic environment of the dumping sites, and consequently affected the ecosystems [4,5]. Rather than treating it as a waste, nowadays, the sludge is also known as alternative source for raw material [2,6], beach nourishment [7], soil matrix [3] etc. Unfortunately, dredged sludge commonly contains a high water content, which significantly reduces its utility value. Hence, it is essential to maximize the removal of water for reduction, recycling, and reuse of this material. In recent years, several trials have been carried out on the dewatering process of dredged sludge [8,9,10]. However, there is extremely limited knowledge about the characteristics of moisture distribution in dredged sludge, and the dehydration energy costs of different categories of water.
It is difficult to directly measure the water distribution in opaque mixtures based on classical optical techniques. Recently, low-field 1H nuclear magnetic resonance spectroscopy (LF-NMR) has been widely used to measure water distribution in solid–liquid mixtures, including food [11], sewage sludge [12,13], and petroleum sludge [14,15]. Compared with other water measurement methods, LF-NMR is nondestructive, rapid, and accurate. The bound level of water is the key factor influencing the relaxation time of hydrogen protons. LF-NMR retrieves the state of water through detecting the variations of 1H relaxation time. According to the Carr–Purcell–Meiboom–Gill sequences, the spin–spin relaxation time (T2) is largely determined by the specific surface area of the tested sample [16,17]. A smaller pore structure results in a larger specific surface area and stronger restraints of water mobility, which would subsequently shorten T2 measured by LF-NMR. Thereby, LF-NMR can be applied to characterize the degree to which water is bound within a solid and the moisture distribution in mixtures. The application of LF-NMR has rarely been reported for the measurements of water content and moisture distribution in dredged sludge.
Dredged sludge contains a plurality of particles and multi-scale micropores, and these components and structures interact with contained water in many ways. The literature [18,19] presents different classifications of water trapped in solids according to distinct criteria or measurement methods. Considering water–solid bond strength, water in solid–liquid mixtures can be divided into three categories, namely bound water, interstitial water, and free water. When the sludge is heated during thermal drying, the energy required for water evaporation is greater than the latent energy of pure water. Hence, dewatering consumes extra energy to overcome the binding energy between distinct forms of moisture and sludge. Currently, the large-scale applied dewatering technologies include mechanical, thermal and chemical drying [1,10,20,21], and energy cost is one of the most important factors in the selection of these processing techniques. Although many technologies have been commercially used for sludge drying, there still lacks a fundamental model to quantitatively describe the binding energy needed to be overcome during drying.
In this work, two kinds of typical sludge dredged from an urban watercourse were tested by LF-NMR to investigate the water distribution in sludge, and further explore the dewatering energy cost of different kinds of water. In addition, a calculated model was proposed based on the Lennard-Jones equation and Kelvin law to predict the energy requirements of the drying process. To validate the model, thermogravimetry differential thermal analysis (TG-DTA) was used to determine the detailed energy consumption during the drying process.
2. Water Binding Energy Calculation Model
According to the interaction between water and dredged sludge in the model, energy consumption during thermal drying is classified into the following parts: (1) the energy required for water molecules to overcome the chemical bonding Q1; (2) the energy required for water molecules to overcome the intermolecular physical interactions Q2; (3) the energy required for droplets to overcome the capillary force Q3; (4) latent heat of water phase change Q4. The sediments of an urban watercourse are rich with microorganisms and inorganic salts [22]. Q1 comes from the powerful chemical bounds mainly found in intracellular bound water and crystal water of inorganic salts. These bounds are difficult to break during low-temperature thermal drying [23]. Therefore, to simplify the model, Q1 is excluded from the calculation. Q2 is generated from intermolecular interactions, including Keesom force, Debye force, London dispersion force and repulsive force, and it is one or two orders of magnitude smaller than chemical bonding energy, reaching thousands of kJ/mol [24,25]. According to quantum-mechanical theories, molecular attraction is inversely proportional to the sixth power of the intermolecular distance, while molecular repulsive force is inversely proportional to the 12th power of the distance between molecules [26]. Then, the energy for overcoming these forces between separate molecules can be described by Lennard-Jones’ (L-J) potential energy function, which is an approximate approach commonly used in thermodynamics and dynamics simulation to compute the potential energy of intermolecular interactions [27,28,29]. For the present study, the Lennard-Jones 10-4-3 function [30], as represented in Equation (1), is implemented to calculate Q2, which simultaneously considers molecular attraction and repulsive force:
Here, Q2 represents the energy required by water molecules to overcome the physical binding force from particle surface; ρs represents the solid number density (the number of the solid particles per unit of volume); ∇ is the distance between the lattice planes, and z is the vertical distance between the interacting molecules. The model assumes that water molecules are attached on the surface of particles layer-by-layer. For each additional layer, the increment of z-value equals the radius of the water molecule. ε represents the minimum potential energy, and σ is the distance when the potential energy equals zero.
In addition to several layers of water constrained by the solid particles, there still exists numbers of droplets that are filled in the capillary channel and distributed in dredged sludge. Droplets would form curved surface in these micropores due to the action of capillary force. According to the law of thermodynamics, Q3 is a function of relative saturated vapor pressure, as given by Equation (3):
where R and T are gas constant and thermodynamic temperature; Ps is the vapor pressure of free water at T temperature; P is the equilibrium vapor pressure of contained water. The Kelvin law quantitatively describes the relationship between equilibrium vapor pressure of the curved surface and liquid properties. Thus, P can be determined by the following Kelvin formula:
where κ, δ, υ1 are the surface tension of liquid, curvature radius of the capillary, and specific volume of liquid, respectively.
The final expression of Q3 is obtained as below:
In summary, the total water binding energy discussed in this study is a sum of Q2 and Q3, while the total energy consumption of water evaporation during thermal drying can be obtained by summing all mentioned energy:
Q = Q2 + Q3 + Q4
Based on the derived model, the water binding energy will be investigated by means of experiment and calculation in the following paper.
3. Materials and Methods
3.1. Sample Preparation and Characterization
Two kinds of typical sludge dredged from an urban watercourse were selected in this study. Hangzhou sludge (sample HZ) was collected from a dredging project in Kangqiao District, Hangzhou, China. The HZ sludge was conditioned by polyacrylamide (PAM) and had been dewatered partially by gravitational settling in the sludge storage yard. Lishui sludge (sample LS) was raw sludge directly collected from the dredging site located in Nanming Lake, Lishui, China.
Collected samples were gently homogenized, and completely dried through vacuum freeze drying. Actual densities of the two samples were determined by Archimedes’ principle. Specific surface areas of the freeze-dried sludge were measured by an automatic surface area analyzer (TriStar II 3020, Micromeritics) and particle size distributions of the samples were measured via a laser particle size analyzer (LS 13320, Beckman Coulter). The characteristics of the sludge samples are shown in Table 1.
3.2. LF-NMR Analysis
A low-field NMR (MicroMR20-025 V, Niumag, China) with a frequency field of 22.68 MHz was employed to retrieve the water content and distribution in dredged sludge. The magnetic field strength of the NMR analyzer was 0.5 ± 0.08 T. The instrument was equipped with a radio frequency coil of 20 mm, and the operation temperature of the probe was held at 32 ± 0.01 °C. The spectroscopy pulse length was 17.5 μs for the 90° pulse and 35 µs for the 180° pulse. The preparation of samples and the detailed quantitative analysis method are present in our previous work [31].
In this study, there are two ways to express the water content, among which the water content of sludge is calculated by Equation (7):
While the water content of dried base is calculated by Equation (8):
where is the mass of the sludge sample; is the mass of the dried sludge.
3.3. TG-DTA Analysis
A simultaneous thermogravimetric analyzer (SDT-Q600, TA Instruments) was applied to detect the moisture binding energy during the thermal drying process of samples. A hermetically sealed, medium-sized aluminum crucible was used as sample container and a sealed empty crucible was held in the reference cell. Samples weighed about 10 mg. Temperature was heated from room temperature to 80 °C at a rate of 10 °C per min and subsequently maintained at a constant temperature of 80 °C until the sample achieved constant weight. The experimental atmosphere was nitrogen with a flow rate of 120 mL/min. During the process, a computer was connected to the thermogravimetric analyzer to record the quality loss of the tested sample and the differences of input energy between sample and reference. The moisture binding energy can be calculated using the following formula:
where is the total energy consumption of water evaporation in the sludge, is the latent heat of pure water at 80 °C.
4. Results and Discussion
4.1. Water Distribution in Dredged Sludge Detected by LF-NMR
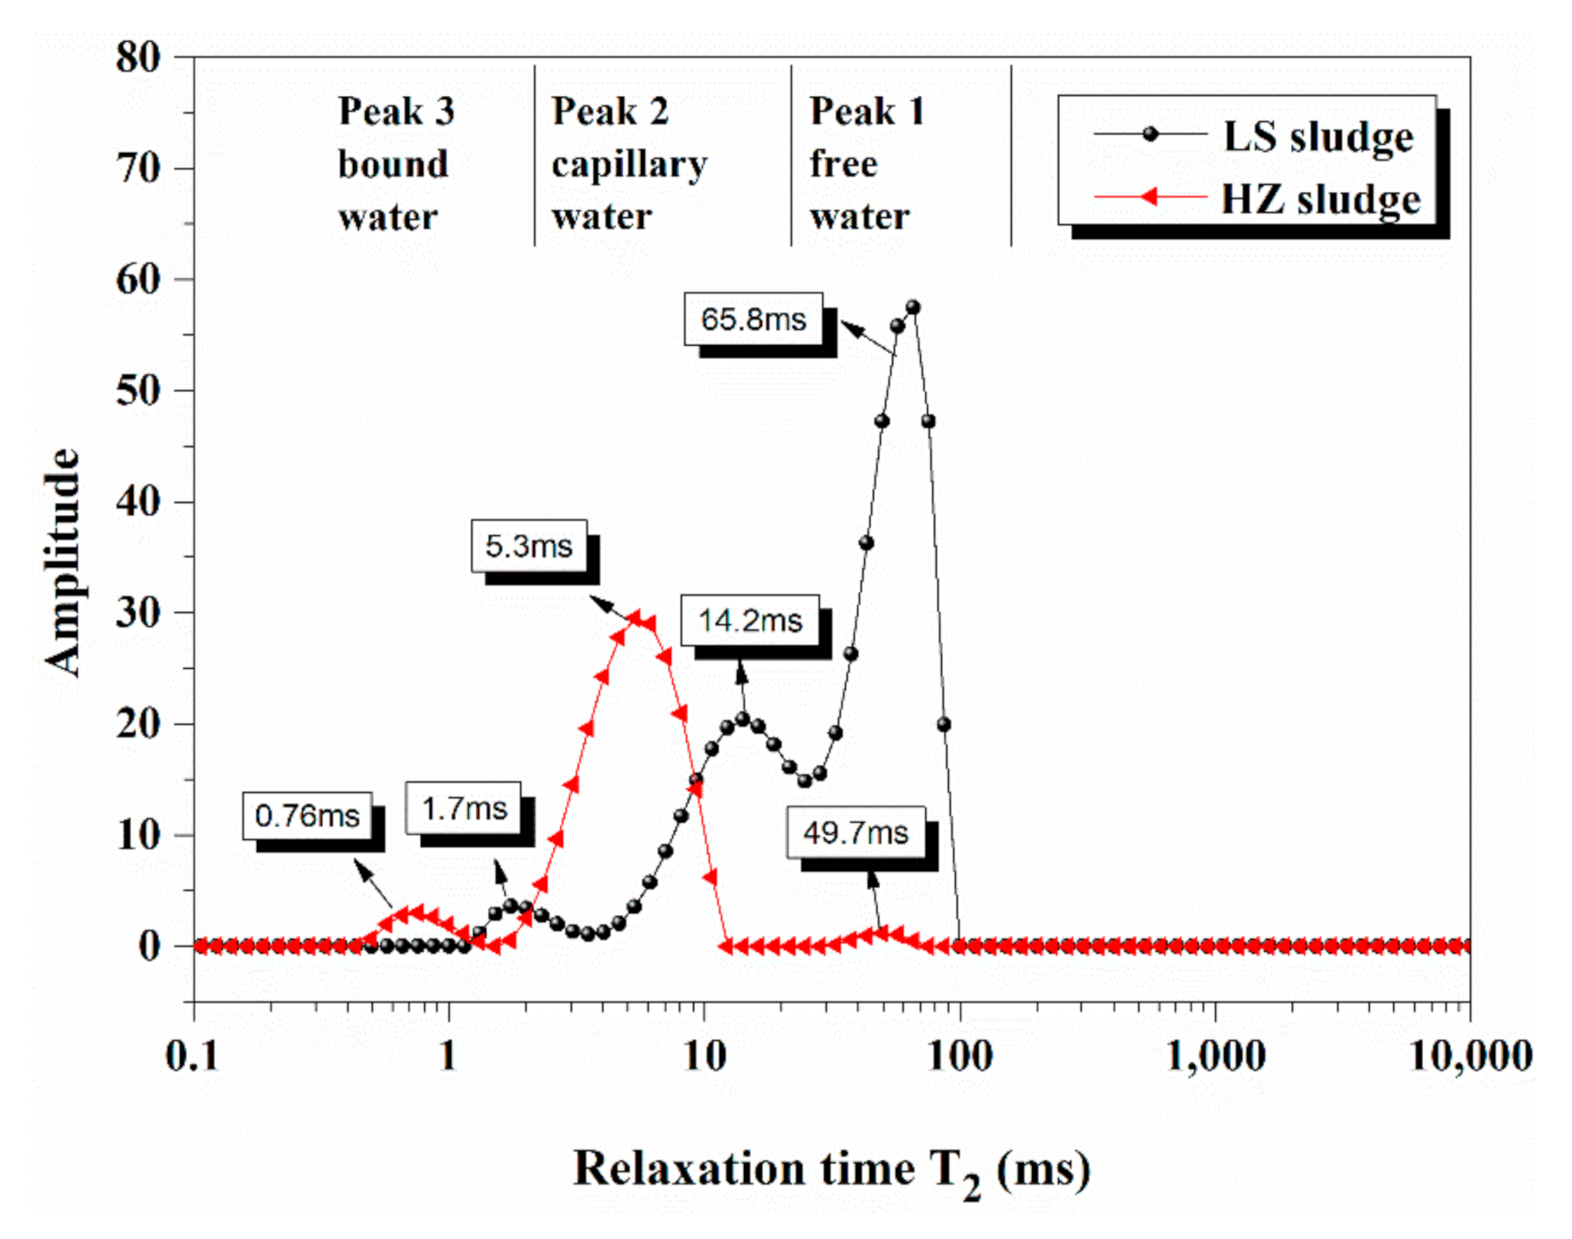
Sediments of an urban watercourse, as the final receptor of the urban environment, consist of organic matters, inorganic minerals, and microbial community [5,22], which influences the sludge morphology and further water distribution in it. Two original samples were analyzed by LF-NMR to analyze the moisture characteristics. Figure 1 shows the relaxation time (T2) distribution curves of the samples, with T2 marked in the corresponding peaks. There are three relatively independent peaks for each sample. We defined three kinds of water according to these detected peaks: free water, capillary water, and bound water. Based on our previous work [31], there is a linear relationship between water content and the peak area of T2 curve, and thus each peak could be transferred into the mass of water.
The total water content of the LS sludge is 93.5%. Each hydrogen proton in free water interacts similarly with the surrounding nuclei, and the T2 of free water is probably distributed between 40 ms and 81 ms [31]. As shown in Figure 1, the content of free water in the LS sludge is relatively high, and this part of the water can be easily removed by traditional mechanical dehydration. With the T2 shortening, the mobility of water gradually decreases. The second peak presents a relatively wide distribution of T2, which demonstrates the existence of multi-scale micropores in the LS sludge. The amplitude of the third peak is small, illustrating the low mass content of bound water in the sample. Though the content of bound water is low, rare drying technologies can exceed the threshold energy of dewatering.
The moisture content of the HZ sludge is 82.4%. Unlike the LS sample, the area of the first peak in HZ is very small. This is because the HZ sludge was conditioned by PAM and the free water had been mostly removed. The second peak of the HZ sample is larger than the LS sample, along with a shorter T2 at peak value than LS. This can be explained by chemically conditioning, as the sludge particles flocculated and formed a smaller size capillary-channel, and consequently enhanced the constraints of the droplets. The third peak is about as large as that of the LS sample; however, it presents a stronger interaction between the bound water and the sludge.
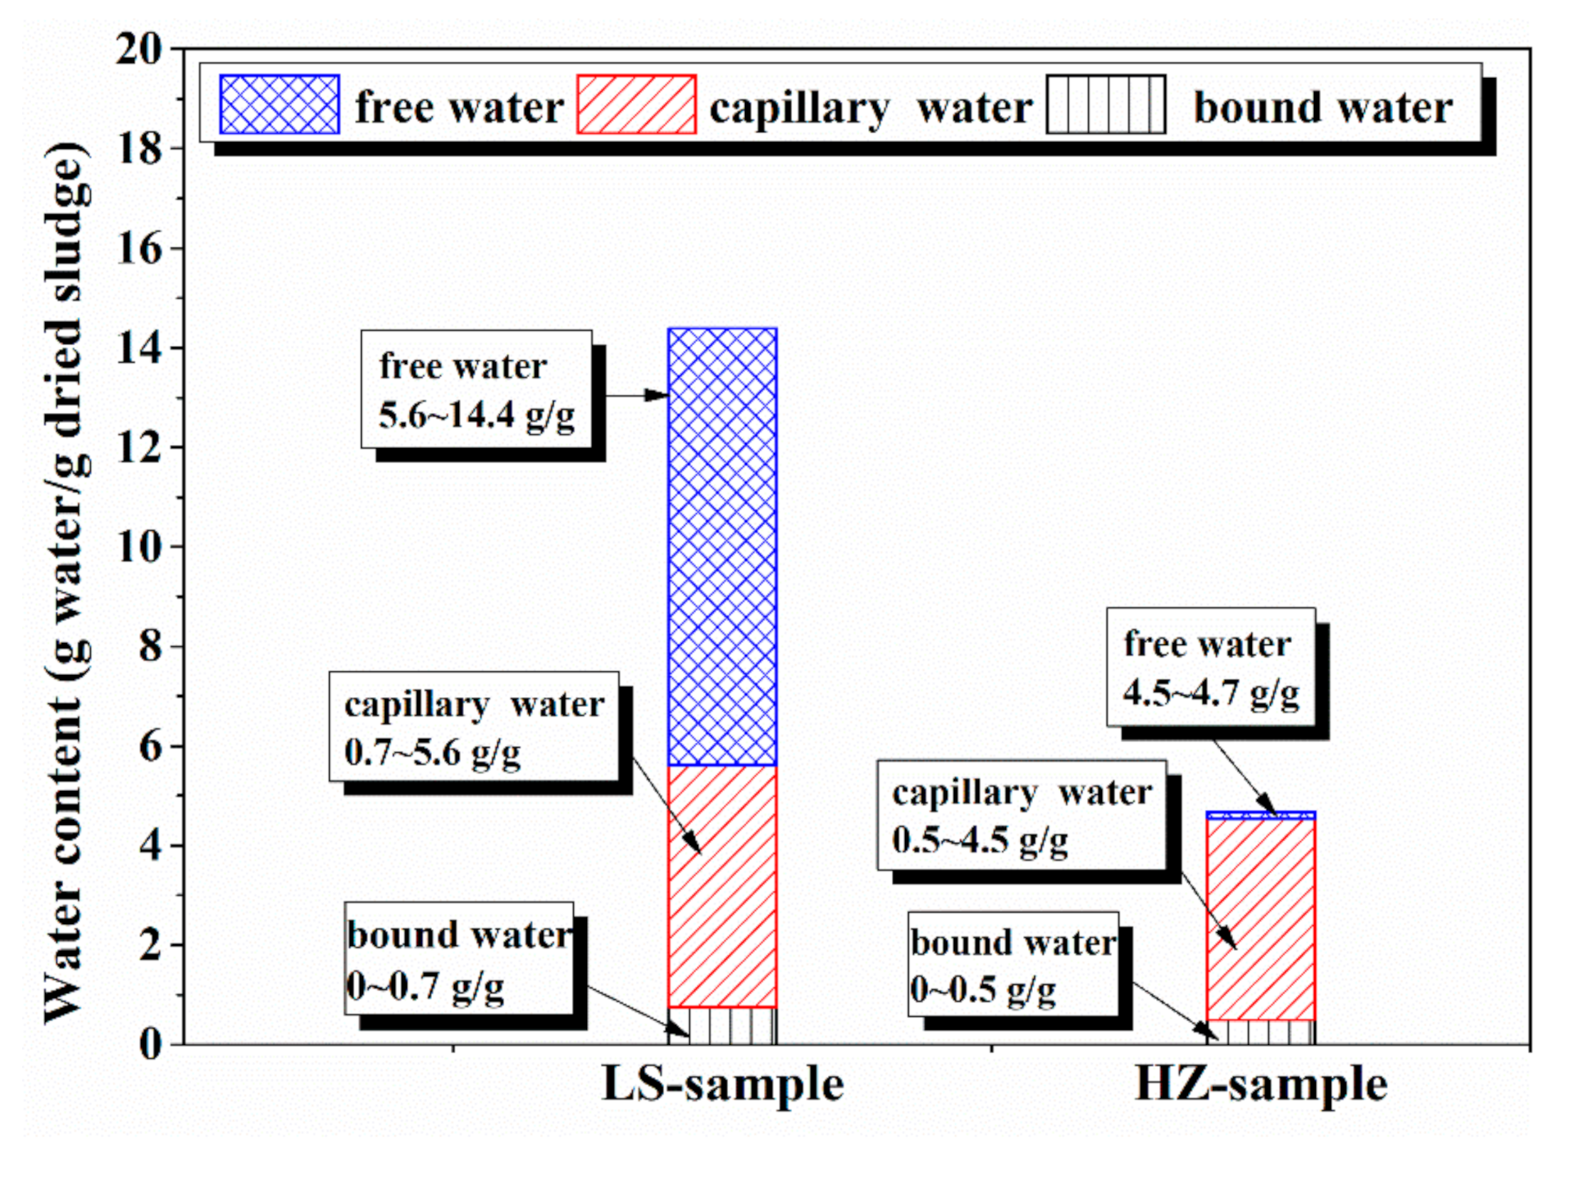
Figure 2 illustrates the water distribution of dried base in samples based on LF-NMR analysis, and similarly the water distribution of sludge is presented in Table 2. For the LS sludge, the free water has a great share in moisture distribution. When the water content decreases from 93.5% (14.4 g/g) to 84.9% (5.6 g/g), free water would be firstly removed from the sludge. When the moisture content ranges from 84.9% to 43.3%, the variations in sludge mass are mainly caused by the loss of capillary water and when the dehydration target is set below 43.3% (0.7 g/g), the dewatering process would involve the removal of bound water.
For the HZ sludge, free water has been initially removed during the gravity settlement, and thereby it takes a small mass proportion in the sample. The results show that moisture exists mainly in the form of capillary water for the HZ sludge. Although the content of free water shows an obvious distinction in the two samples, the relative quality of the capillary water and bound water is approximate in the two tested samples.
4.2. Model Analysis
Dried sludge contains a variety of silicate clay minerals, and previous studies [32,33] have shown that silicate, as a skeleton, can hold one or several layers of water molecules, forming a binding water film. The physical binding energy between water molecules and these skeleton particles can be calculated according to Equations (1) and (2). In the calculation, the skeleton particles are assumed to be silicate tetrahedron, and the distance between the lattice planes is ∇ = 0.547 nm. The critical distance when the potential energy equals zero adopts σ = 0.340 nm [34]. The minimum potential energy can be determined by the formula proposed by Linda S. Smith [35]:
where k is the Boltzmann constant; T is the thermodynamic temperature. The solid number density is selected by referring to a typical value of water–solid mixture as = 70 nm−3 [36]. The model assumes that water molecules are attached on the skeleton particles layer-by-layer, and the film thickness of each layer equals the radius of the water molecule. Thus, Q2 under different water content can be accumulated on the basis of the number of attached water layers.
ε = kT
Along with the volume shrinkage of sludge during dewatering, the dimensions of capillary channel would decrease accordingly. Bushuev et al. [37] have found that micro-porous channels prevent water molecules from gathering to form free water, and the pore size is a dominant factor affecting water binding energy. Equation (5), as mentioned above, is applied to calculate the energy required by droplets to overcome the capillary force, for water, where κ = 7.56 × 10⁻² N/m; υ1 = 10−3 m3/kg. With this model, it is assumed that a dried particle and a particle with water are both cube structures. Selecting a certain diameter from the range of size distribution of the sample as, di the average center distance between two particles is obtained by introducing Equation (11). Assuming that the water surface in capillary is hemispherical and the curvature radius of the capillary δ is equal to the radius of capillary. The clear distance of capillary radius is correspondingly achieved by deducting , as shown in Equation (12),
where, V is the total volume of sludge; Vi is the volume of a single dried particle; m and ρ represent the mass and true density of dried sludge, respectively. Therefore, Q3 with different water content can be obtained from Equation (5).
4.3. Comparison of Model Calculation and Experimental Result
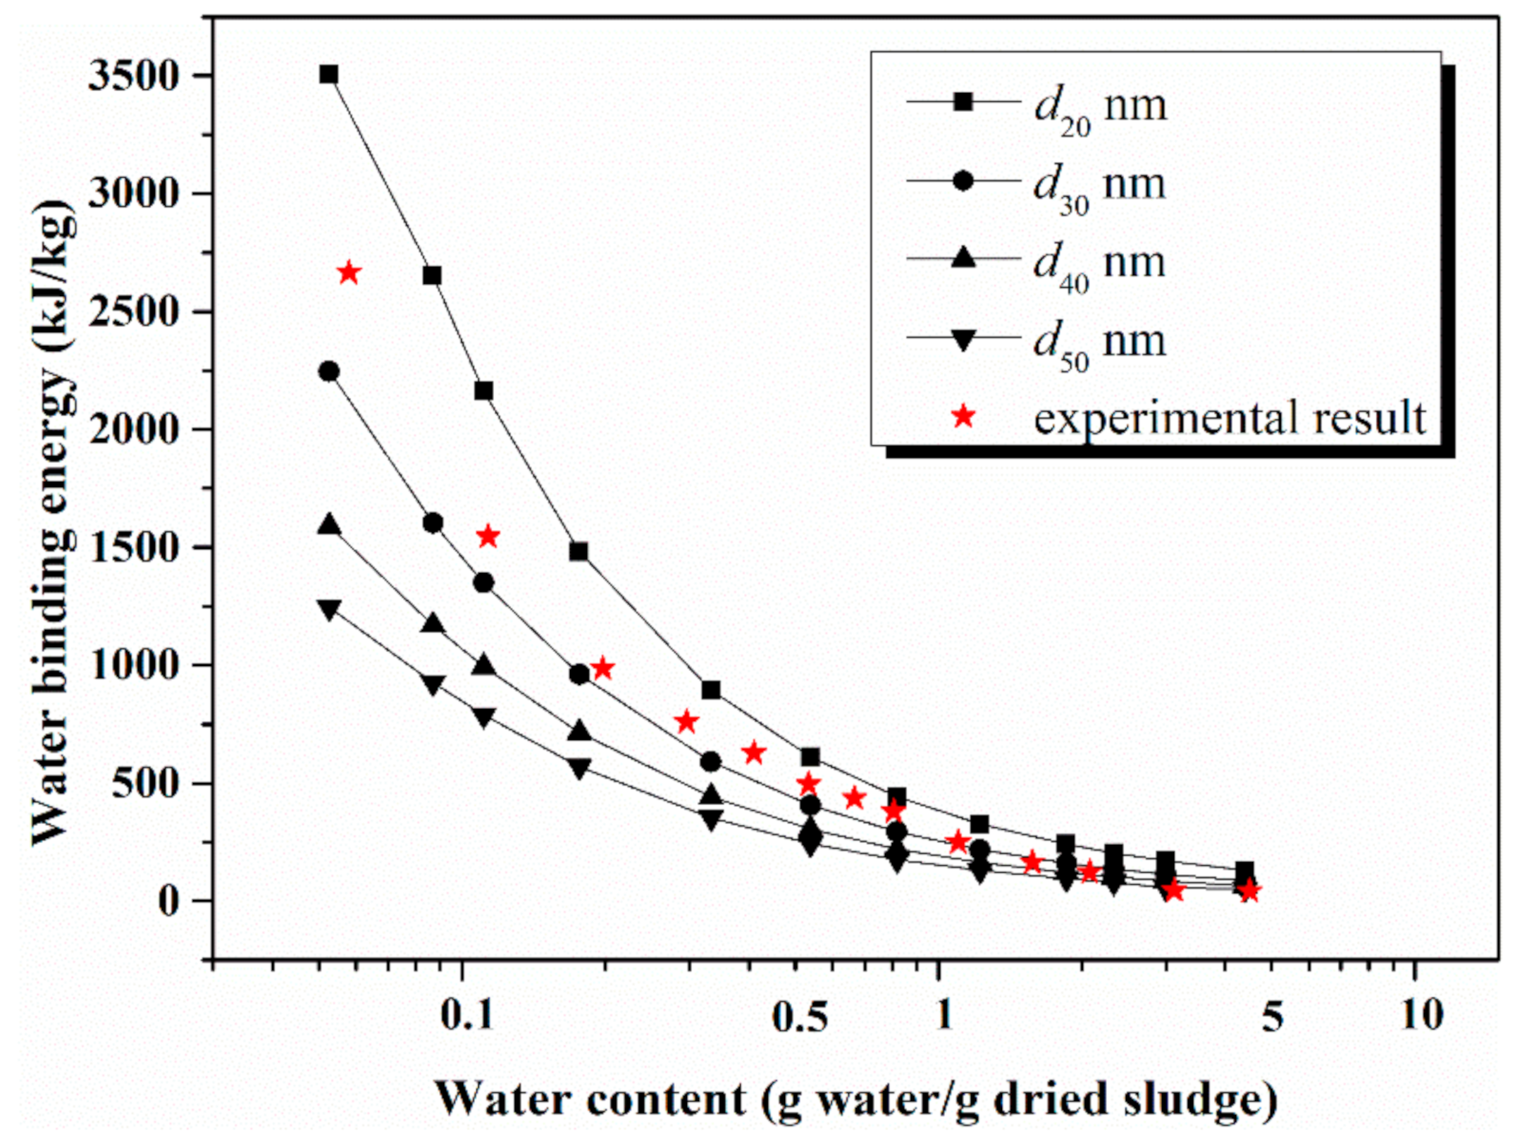
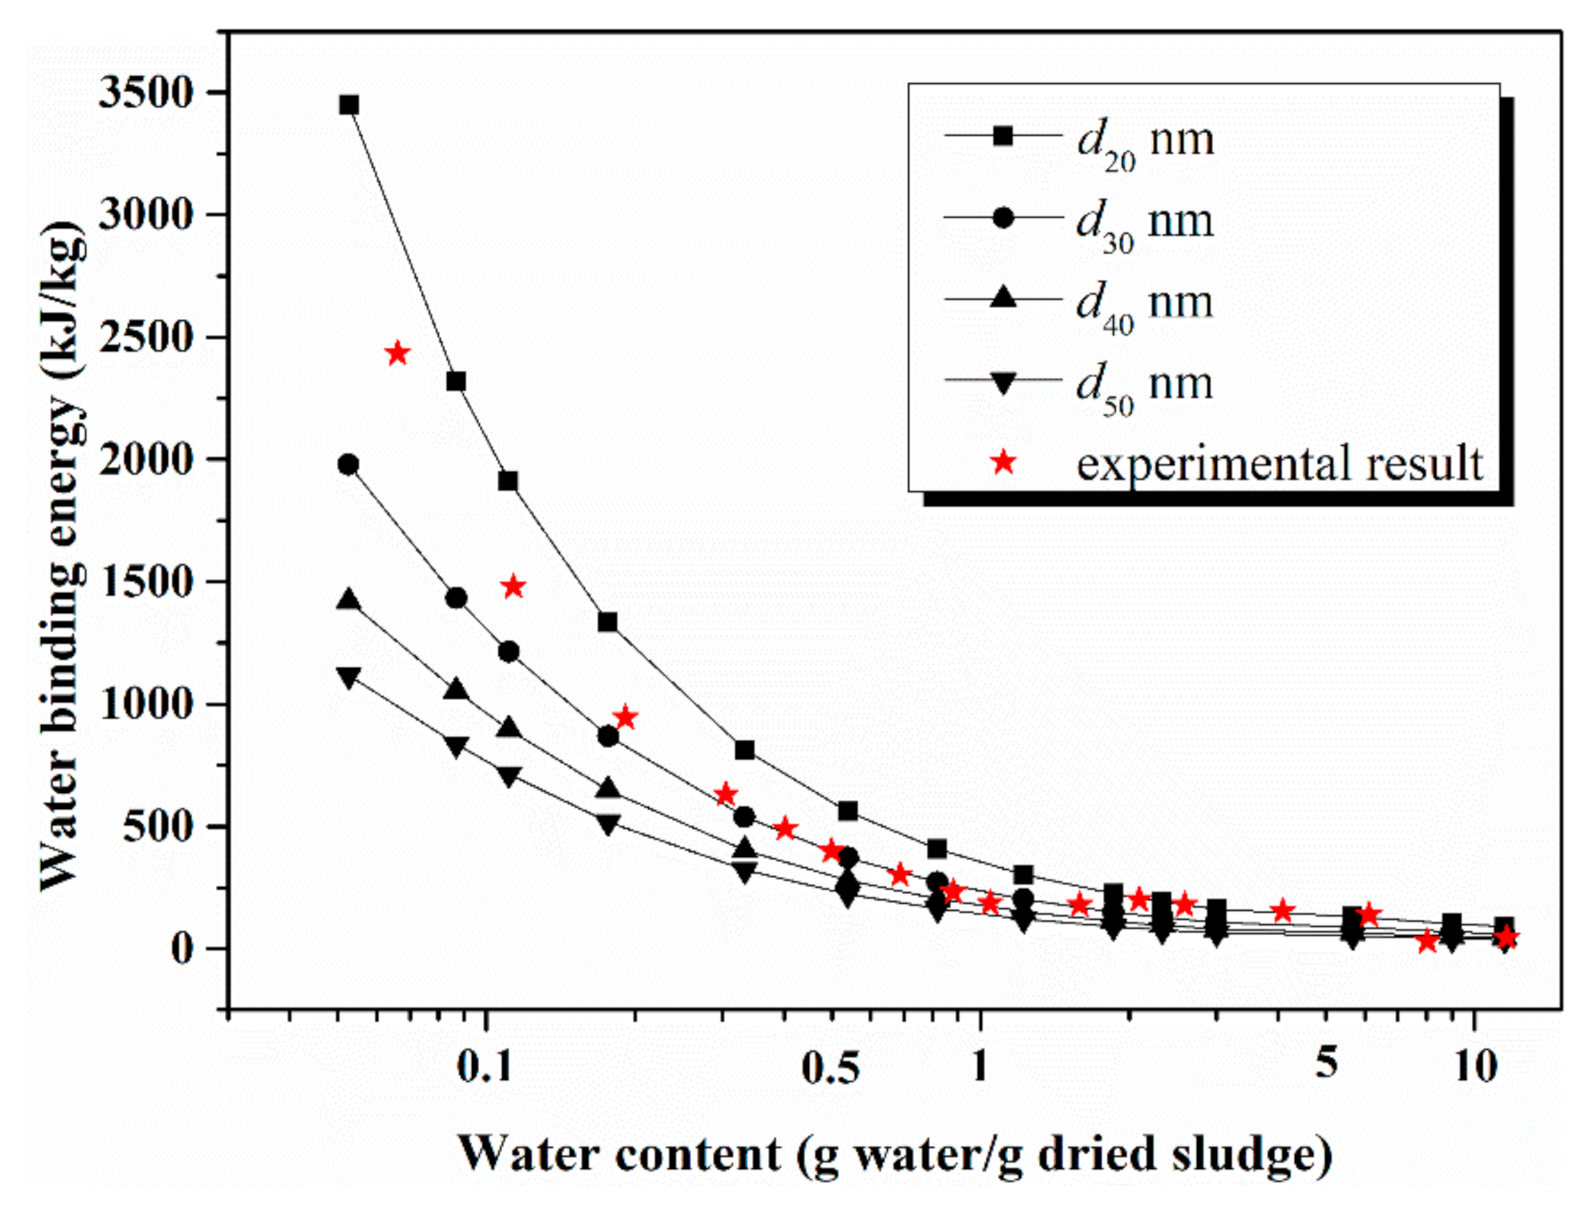
In order to measure the actual energy cost during the sludge thermal drying process, TG-DTA was performed on the chosen samples, and the data are plotted in Figure 3 and Figure 4 as red scattering points. Several diameters, values from 20 nm, 30 nm, 40 nm and 50 nm, are selected to calculate the binding energy, respectively, and the results of model calculation for the two sludge samples are also given in Figure 3 and Figure 4.
The overall trend of the predicted binding energy for the two samples is similar and consistent with the experimental results. For the HZ sludge, the experimental results are more consistent with the predicted values at diameter 30 nm, and it is suggested that under a certain water content, an increasing amount of energy is required as the particle size decreases. When water content of the HZ sample is greater than 4 g/g, the water binding energy is almost zero, which means the bulk water could be easily removed. With water content dropping from 4 g/g to 0.5 g/g, the energy consumption of dehydration increases mildly, ranging from dozens to hundreds kJ/kg. Based on LF-NMR tests, water content in this range is mainly in the form of capillary water. The literature [38] has suggested that when the spacing between montmorillonite layers was 1.55 nm and 1.85 nm, the bound water content was 0.25 g/g, and 0.33 g/g, respectively. Similarly, we find that when water content further reduces to less than 0.3 g/g, the binding energy increases significantly to near one thousand kJ/kg, which indicates that this process needs to overcome intermolecular physical interactions. When the water content is lower than 0.1 g/g, both model and experimental results reveal that the binding energy increases dramatically to several thousands of kJ/kg. Allardice et al. [39] also observed that as the water content went below 0.15 g/g in coal, desorption heat increased steeply and this phenomenon can be attributed to the change from multilayer water evaporation to monolayer water loss. However, the intermolecular forces become weaker while the distance between particles is greater than ten times of critical distance σ. A previous study [33] has shown that when the residual water content of silicon dioxide was higher than 0.5 g/g, the mobility of water increased sharply, and the binding energy decreased, which is in agreement with the trend of the current model. Therefore, with the water content decreasing, the energy consumption increases.
For the LS sludge, within the high water content interval, the experimental result agrees more with the model at d = 20 nm, while in the low water content interval, the trend is more consistent with the model at d = 30 nm. These deviations can be explained by the fact that drying is a complex, multi-equilibrium process, which includes molecular diffusion, capillary flow, surface diffusion etc., and the model just considers the main process associated with energy cost. For TG-DTA data, as water ranges from 6 g/g to 1 g/g, the energy consumption fluctuates at a small scale. However, as water content becomes lower than 1 g/g, the binding energy increases rapidly.
4.4. Gradient of Energy Consumption Analysis
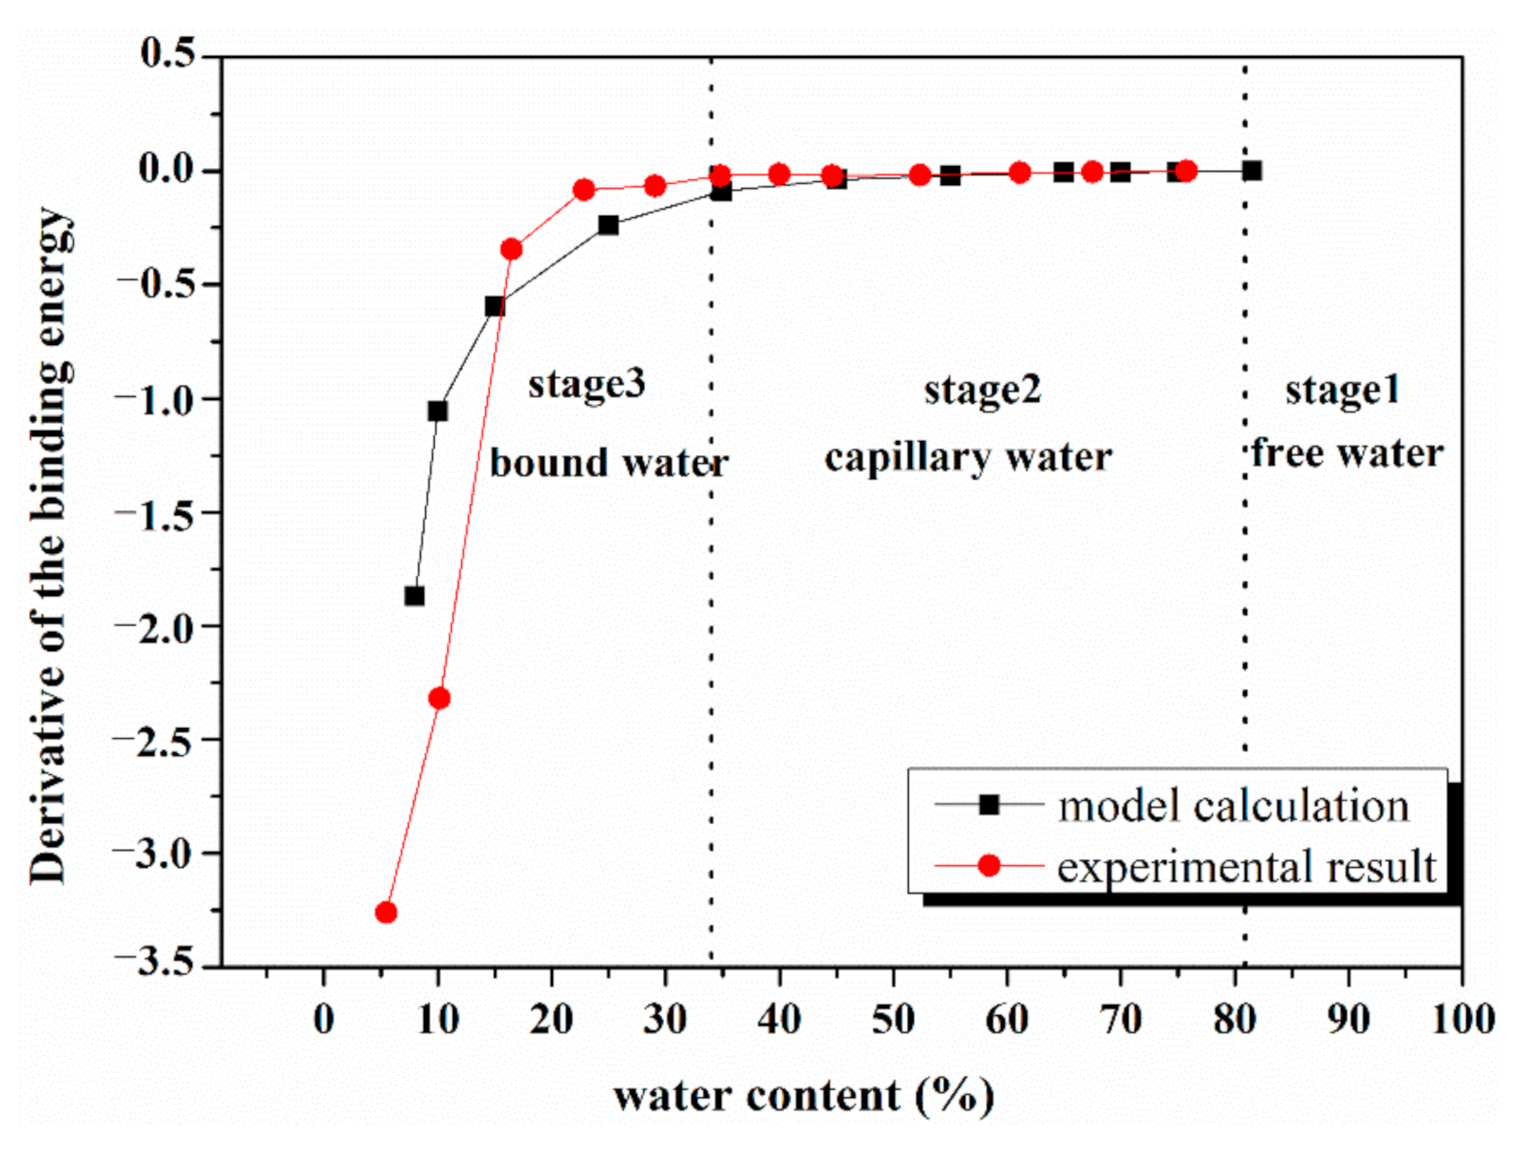
Both the calculation and experimental results of the HZ sludge are chosen to evaluate the gradient of energy consumption during dewatering. Figure 5 illustrates the derivative of the binding energy of the HZ sludge along with the change in moisture. It reveals that the change rate of binding energy rises gradually when water content decreases. Associated with the LF-NMR results, the dehydration process is classified into three stages. In the first stage, as water content is higher than 82.0%, the dewatering process does not need to overcome binding energy, and the total energy consumption of the thermal drying is equal to the latent heat of evaporation. In the second stage, with the water content ranging from 33.6% to 82.0%, the capillary water is mainly hampered by microstructures in the sludge and the binding energy changes slightly, from dozens to hundreds of kJ/kg. Presently, many commercially used dehydration technologies mainly target this stage. In the third stage, water molecules strongly interact with the sludge surface, and the binding energy increases at a relatively high rate. Especially for water content below 15%, the derivative of binding energy increases sharply, and is attributed to a stronger interaction between the solid surface and the adjacent water films. When the sludge dewatering process enters the third stage, the dewatering process is no longer energy-efficient. According to many engineer projects, the target water content of mechanical dehydration is generally higher than 40%.
5. Conclusions
In this study, LF-NMR was applied to measure moisture distribution in dredged sludge, which indicated that the water contained in sludge can be roughly classified into three categories: free water, capillary water, and bound water. A feasible calculation model for predicting the water binding energy in dredged sludge was proposed and several grain diameters, values from 20 nm, 30 nm, 40 nm, and 50 nm, were selected to calculate the binding energy, respectively. In addition, the calculation results were verified by TG-DTA experiments with two kinds of samples. The trend of the model’s results was consistent with the experimental values at d = 30 nm for the HZ sludge. For the LS sludge, within the high water content interval, the experimental result is in more agreement with the model at d = 20 nm, while in the low water content interval, the trend is more consistent with the model at d = 30 nm. It was suggested that the water binding energy in sludge is related to multiple factors, including water–solid bonding form, particle size distribution, and specific surface area.
Accordingly, the gradient of energy consumption during dehydration is divided into three main stages. In stage 1, the water content of samples is greater than 82.0% (4.5 g/g) and the total energy required for dewatering equals the latent heat of free water. In stage 2, with the water content dropping to about 33.6% (0.5 g/g), the binding energy reaches about 500 kJ/kg, accounting for capillary action. In stage 3, when the water content further reduces to less than 13% (0.15 g/g), the binding energy would increase steeply reaching almost thousands of kJ/kg due to intermolecular physical interactions.
This work will provide better insight into the behavior of dredged sludge dehydration. The findings will provide a practical reference for designing and optimizing the dehydration process in dredged sludge management.
Author Contributions
The individual contributions to this manuscript are listed below: conceptualization, F.M. and Y.Z. (Yiping Zhang); data curation, F.M.; formal analysis, F.M.; funding acquisition, F.M.; investigation, Y.Z. (Yingjie Zhao) and L.Y.; methodology, F.M.; project administration, Z.C.; supervision, Y.Z. (Yiping Zhang) and Z.C.; validation, F.M.; writing—original draft, F.M.; writing—review and editing, F.M. and Y.Z. (Yingjie Zhao). All authors have read and agreed to the published version of the manuscript.
Funding
Funding for this study was provided by the Science and Technology Program from the Department of Water Resources of Zhejiang Province (grant no. RA1605) and the Science and Technology Program from the Department of Water Resources of Zhejiang Province (grant no. RC1726).
Acknowledgments
We would like to thank the technical team of the College of Civil Engineering and Architecture, Zhejiang University for their support throughout this study.
Conflicts of Interest
The authors declare no conflict of interest.
References
- Amar, M.; Benzerzour, M.; Kleib, J.; Abriak, N.-E. From dredged sediment to supplementary cementitious material: Characterization, treatment, and reuse. Int. J. Sediment Res. 2021, 36, 92–109. [Google Scholar] [CrossRef]
- Oh, H.; Lee, J.; Banthia, N.; Talukdar, S. An Experimental Study of the Physicochemical Properties of a Cement Matrix Containing Dredged Materials. Mater. Sci. Appl. 2011, 2, 847–857. [Google Scholar] [CrossRef] [Green Version]
- Bhairappanavar, S.; Liu, R.; Coffman, R. Beneficial Uses of Dredged Material in Green Infrastructure and Living Architecture to Improve Resilience of Lake Erie. Infrastructures 2018, 3, 42. [Google Scholar] [CrossRef] [Green Version]
- Tri, D.Q.; Kandasamy, J.; Don, N.C. Quantitative Assessment of the Environmental Impacts of Dredging and Dumping Activities at Sea. Appl. Sci. 2019, 9, 1703. [Google Scholar] [CrossRef] [Green Version]
- Zonta, R.; Cassin, D.; Pini, R.; Dominik, J. Substantial Decrease in Contaminant Concentrations in the Sediments of the Venice (Italy) Canal Network in the Last Two Decades—Implications for Sediment Management. Water 2020, 12, 1965. [Google Scholar] [CrossRef]
- Cappuyns, V.; Deweirt, V.; Rousseau, S. Dredged sediments as a resource for brick production: Possibilities and barriers from a consumers’ perspective. Waste Manag. 2015, 38, 372–380. [Google Scholar] [CrossRef]
- Bagarani, M.; De Vincenzo, A.; Ievoli, C.; Molino, B. The Reuse of Sediments Dredged from Artificial Reservoirs for Beach Nourishment: Technical and Economic Feasibility. Sustainability 2020, 12, 6820. [Google Scholar] [CrossRef]
- Molino, B.; Bufalo, G.; De Vincenzo, A.; Ambrosone, L. Semiempirical Model for Assessing Dewatering Process by Flocculation of Dredged Sludge in an Artificial Reservoir. Appl. Sci. 2020, 10, 3051. [Google Scholar] [CrossRef]
- Song, Z.; Zhang, W.; Gao, H.; Wang, D. Comprehensive assessment of flocculation conditioning of dredged sediment using organic polymers: Dredged sediment dewaterability and release of pollutants. Sci. Total Environ. 2020, 739, 139884. [Google Scholar] [CrossRef]
- Wang, J.; Huang, G.; Fu, H.; Cai, Y.; Hu, X.; Lou, X.; Jin, Y.; Hai, J.; Ni, J.; Zou, J. Vacuum preloading combined with multiple-flocculant treatment for dredged fill improvement. Eng. Geol. 2019, 259, 105194. [Google Scholar] [CrossRef]
- Pan, L.; Xing, J.; Luo, X.; Li, Y.; Sun, D.; Zhai, Y.; Yang, K.; Chen, Z. Influence of Electron Beam Irradiation on the Moisture and Properties of Freshly Harvested and Sun-Dried Rice. Foods 2020, 9, 1139. [Google Scholar] [CrossRef]
- Zhao, C.; Zheng, H.; Feng, L.; Wang, Y.; Liu, Y.; Liu, B.; Djibrine, B.Z. Improvement of Sludge Dewaterability by Ultrasound-Initiated Cationic Polyacrylamide with Microblock Structure: The Role of Surface-Active Monomers. Materials 2017, 10, 282. [Google Scholar] [CrossRef]
- Mao, H.; Chi, Y.; Wang, F.; Mao, F.; Liang, F.; Lu, S.; Cen, K. Effect of Ultrasonic Pre-treatment on Dewaterability and Moisture Distribution in Sewage Sludge. Waste Biomass Valoriz. 2018, 9, 247–253. [Google Scholar] [CrossRef]
- Jin, Y.; Zheng, X.; Chi, Y.; Ni, M. Rapid, Accurate Measurement of the Oil and Water Contents of Oil Sludge Using Low-Field NMR. Ind. Eng. Chem. Res. 2013, 52, 2228–2233. [Google Scholar] [CrossRef]
- Zheng, X.; Jin, Y.; Chi, Y.; Ni, M. Simultaneous Determination of Water and Oil in Oil Sludge by Low-Field 1H NMR Relaxometry and Chemometrics. Energy Fuels 2013, 27, 5787–5792. [Google Scholar] [CrossRef]
- Meiboom, S.; Gill, D.R. Modified Spin-Echo Method for Measuring Nuclear Relaxation Times. Rev. Sci. Instrum. 1958, 29, 688–691. [Google Scholar] [CrossRef] [Green Version]
- Yao, W.; She, A.; Yang, P. 1H-NMR relaxation and state evolvement of evaporable water in cement pastes. J. Chin. Ceram. Soc. 2009, 37, 1. [Google Scholar]
- Karr, C. Analytical Methods for Coal and Coal Products: Volume II; Academic press: Cambridge, MA, USA, 2013; Volume 2. [Google Scholar]
- Chen, G.W.; Hung, W.T.; Chang, I.L.; Lee, S.F.; Lee, D.J. Continuous Classification of Moisture Content in Waste Activated Sludges. J. Environ. Eng. 1997, 123, 253–258. [Google Scholar] [CrossRef]
- Slimanou, H.; Bouguermouh, K.; Bouzidi, N. Synthesis of geopolymers based on dredged sediment in calcined and uncalcined states. Mater. Lett. 2019, 251, 188–191. [Google Scholar] [CrossRef]
- Li, Y.; Yang, F.; Miao, S.; Wang, D.; Li, Z.; Yuan, X.; Yuan, L.; Liu, Q. Achieved deep-dewatering of dredged sediments by Fe(II) activating persulfate pretreatment: Filtrating performance and mechanistic insights. Chem. Eng. J. 2021, 405, 126847. [Google Scholar] [CrossRef]
- Zhang, X.; Gu, Q.; Long, X.-E.; Li, Z.-L.; Liu, D.-X.; Ye, D.-H.; He, C.-Q.; Liu, X.-Y.; Väänänen, K.; Chen, X. Anthropogenic activities drive the microbial community and its function in urban river sediment. J. Soils Sediments 2015, 16, 716–725. [Google Scholar] [CrossRef]
- Huang, P.L. A Review of: “Modern Drying Technology, Second Enhanced Edition Editors: Yongkang Pan, Xizhong Wang and Xiangdong Liu”. Dry. Technol. 2007, 25, 2057–2058. [Google Scholar] [CrossRef]
- Yariv, S.; Cross, H. Physical Chemistry of Surfaces. Geochem. Colloid Syst. 1979, 150, 93–155. [Google Scholar] [CrossRef]
- Prausnitz, J.M.; Lichtenthaler, R.N.; De Azevedo, E.G. Molecular Thermodynamics of Fluid-Phase Equilibria; Pearson Education: Hoboken, NJ, USA, 1998. [Google Scholar]
- Hirschfelder, J.O.; Curtiss, C.F.; Bird, R.B.; Mayer, M.G. Molecular Theory of Gases and Liquids; Wiley: New York, NY, USA, 1964; Volume 165. [Google Scholar]
- Ansari, R.; Kazemi, E. Detailed investigation on single water molecule entering carbon nanotubes. Appl. Math. Mech. 2012, 33, 1287–1300. [Google Scholar] [CrossRef]
- Lin, D.T.W.; Chen, C.-K. A molecular dynamics simulation of TIP4P and Lennard-Jones water in nanochannel. Acta Mech. 2004, 173, 181–194. [Google Scholar] [CrossRef]
- Da Silva, L.B. Structural and dynamical properties of water confined in carbon nanotubes. J. Nanostruct. Chem. 2014, 4, 1–5. [Google Scholar] [CrossRef] [Green Version]
- Fort, T.; Putnam, F. The interaction of gases with solid surfaces. J. Colloid Interface Sci. 1976, 57, 190–191. [Google Scholar] [CrossRef]
- Mao, H.; Wang, F.; Mao, F.; Chi, Y.; Lu, S.; Cen, K. Measurement of water content and moisture distribution in sludge by1H nuclear magnetic resonance spectroscopy. Dry. Technol. 2016, 34, 267–274. [Google Scholar] [CrossRef]
- Ahunbay, M.G. Monte Carlo simulation of water adsorption in hydrophobic MFI zeolites with hydrophilic sites. Langmuir 2011, 27, 4986–4993. [Google Scholar] [CrossRef]
- Prost, R.; Koutit, T.; Benchara, A.; Huard, E. State and location of water adsorbed on clay minerals: Consequences of the hydration and swelling-shrinkage phenomena. Clays Clay Min. 1998, 46, 117–131. [Google Scholar] [CrossRef]
- Steele, W.A. The physical interaction of gases with crystalline solids: I. Gas-solid energies and properties of isolated adsorbed atoms. Surf. Sci. 1973, 36, 317–352. [Google Scholar] [CrossRef]
- Smith, L.S.; Lee, L.L. The Lennard-Jones 9:3 adsorptive system I: The Percus–Yevick and hypernetted chain theories and their modifications. J. Chem. Phys. 1979, 71, 4085. [Google Scholar] [CrossRef]
- Huang, Q.; Zhou, G.; Yu, B.; Wang, S.; Chi, Y.; Yan, J. Quantitative model for predicting the desorption energy of water contained in lignite. Fuel 2015, 157, 202–207. [Google Scholar] [CrossRef]
- Bushuev, Y.G.; Sastre, G. Atomistic Simulation of Water Intrusion—Extrusion in ITQ-4 (IFR) and ZSM-22 (TON): The Role of Silanol Defects. J. Phys. Chem. C 2011, 115, 21942–21953. [Google Scholar] [CrossRef]
- Fitts, T.G.; Brown, K. Stress-induced smectite dehydration: Ramifications for patterns of freshening and fluid expulsion in the N. Barbados accretionary wedge. Earth Planet. Sci. Lett. 1999, 172, 179–197. [Google Scholar] [CrossRef]
- Allardice, D.; Evans, D. The-brown coal/water system: Part 2. Water sorption isotherms on bed-moist Yallourn brown coal. Fuel 1971, 50, 236–253. [Google Scholar] [CrossRef]
Figure 1.
Relaxation time (T2) distribution curves of Lishui sludge (LS) and Hangzhou sludge (HZ) samples.
Figure 1.
Relaxation time (T2) distribution curves of Lishui sludge (LS) and Hangzhou sludge (HZ) samples.

Figure 2.
Water distribution of dried base in samples.

Figure 3.
Experimental and model results for the HZ sludge.

Figure 4.
Experimental and model results for the LS sludge.

Figure 5.
The derivative of the binding energy of the HZ sludge.


Table 1.
Main properties of the sludge samples studied.
| Density g/cm3 | Specific Surface Area m2/g | Particle Size Distribution nm | |
|---|---|---|---|
| HZ sample | 1.42 | 32.5 | 25~130 |
| LS sample | 1.58 | 25.4 | 18~85 |
Table 2.
Water distribution of sludge in samples.
| Free Water % | Capillary Water % | Bound Water % | |
|---|---|---|---|
| HZ sample | 82.0~82.4% | 33.6~82.0 | 0~33.6% |
| LS sample | 84.9~93.5% | 43.3~84.9 | 0~43.3% |
Publisher’s Note: MDPI stays neutral with regard to jurisdictional claims in published maps and institutional affiliations. |
© 2020 by the authors. Licensee MDPI, Basel, Switzerland. This article is an open access article distributed under the terms and conditions of the Creative Commons Attribution (CC BY) license (http://creativecommons.org/licenses/by/4.0/).
Share and Cite
MDPI and ACS Style
Mao, F.; Zhao, Y.; Zhang, Y.; Chen, Z.; Yin, L. Measurement and Modelling of Moisture Distribution and Water Binding Energy of Dredged Sludge. Water 2020, 12, 3395. https://doi.org/10.3390/w12123395
AMA Style
Mao F, Zhao Y, Zhang Y, Chen Z, Yin L. Measurement and Modelling of Moisture Distribution and Water Binding Energy of Dredged Sludge. Water. 2020; 12(12):3395. https://doi.org/10.3390/w12123395
Chicago/Turabian StyleMao, Feiyan, Yingjie Zhao, Yiping Zhang, Zhou Chen, and Lu Yin. 2020. "Measurement and Modelling of Moisture Distribution and Water Binding Energy of Dredged Sludge" Water 12, no. 12: 3395. https://doi.org/10.3390/w12123395
Note that from the first issue of 2016, this journal uses article numbers instead of page numbers. See further details here.