Isotopic Evolution in Snowpacks from a Typical Temperate Glacier in the South-Asia Monsoon Region


1
State Key Laboratory of Cryospheric Sciences, Northwest Institute of Eco-Environment and Resources, Chinese Academy of Sciences, Lanzhou 730000, China
2
College of Geography and Environment Sciences, Zhejiang Normal University, Jinhua 321004, China
*
Author to whom correspondence should be addressed.
Water 2020, 12(12), 3402; https://doi.org/10.3390/w12123402
Submission received: 3 September 2020
/
Revised: 1 December 2020
/
Accepted: 1 December 2020
/
Published: 3 December 2020
(This article belongs to the Section Hydrology)
Abstract
:In this study, snow samples collected from nine snowpacks from Mt. Yulong are measured to examine the monthly and annual isotopic variation. The results indicate that the late autumn and winter snow sampled in 2008/2009 show a similar high–low–high δ18O variation. In spring, the high–low–high curve still exists in the lower layers (<1.5 m), while relatively high values are witnessed in the upper layers (>1.5 m). Isotopic homogenization, smoothing the vertical variation of δ18O in snow, is observed in June and July when snow melting occurs. Samples collected in April of 2009, 2012 and 2017 show significant differences, suggesting annual changes of isotope contents in snow. This study suggests that the isotope contents in the snow profile can reflect meteorological information. At the monthly scale, we can distinguish the information on snow accumulation and melting by determining the monthly variation of vertical isotope contents in snow. At the annual scale, we can analyze the annual difference of corresponding meteorological factors. Collectively, observing the stable isotopes in snow could provide evidence for climate change, particularly when climatic data are lacking or are challenging to obtain in cold glacierized regions.
1. Introduction
The Tibetan Plateau (TP) is one of the most vulnerable regions in the world [1,2]. It is reported that climate warming has been dramatic in the TP in the past several decades [3], which has definitely resulted in significant glacier retreat, snow reduction and environmental change [4,5]. Several prediction studies indicate that the climate warming in the TP will continue over the next decades [6,7], which threatens the cryosphere, water resources and the environment [8,9,10]. Yulong Snow Mountain (Mt. Yulong), located in the southeast TP, is characterized by a frail and changeable environment. Moreover, Mt. Yulong is a typical region in which monsoonal temperate glaciers exist. These glaciers are highly sensitive to climate and environment changes [11,12,13].
Environmentally stable isotopes have been used extensively as indicators of climatic and environmental changes in meteorological, hydrological, glaciological and environmental fields in the past decade [14,15,16,17,18,19,20,21,22,23]. It has been reported in cold regions that stable isotopes in precipitation, snow and ice cores are closely related to meteorological factors and climate change [24,25,26,27,28]. Specifically, stable isotopes in snowpack records reflect the condition of atmospheric deposition and post-depositional processes and provide important information for ice core dating using isotopes [29,30,31,32]. Therefore, it is necessary to study the characteristics of the stable isotope content in snow as well as its evolution in snowpacks on glaciers.
The stable isotopes in snow in the Tibetan Plateau have been widely investigated in the past [29,31,32,33]. However, the monthly and annual isotopic variations as well as controlling factors for snow are still inadequate. In the context of climate change, studying the vertical isotopic curves in snow layers in different years would be of great significance.
In this work, snow samples collected from nine snowpacks from Mt. Yulong are measured to examine the isotopic variation and corresponding climatic signals. The objectives of this study are to (1) illustrate the monthly and annual isotopic variation in snowpacks, and (2) distinguish the relationship between isotopes in snow and meteorological factors. The results are expected to improve our understanding of the relationship between isotopic records in snow and climate change.
2. Materials and Methods
2.1. Study Area
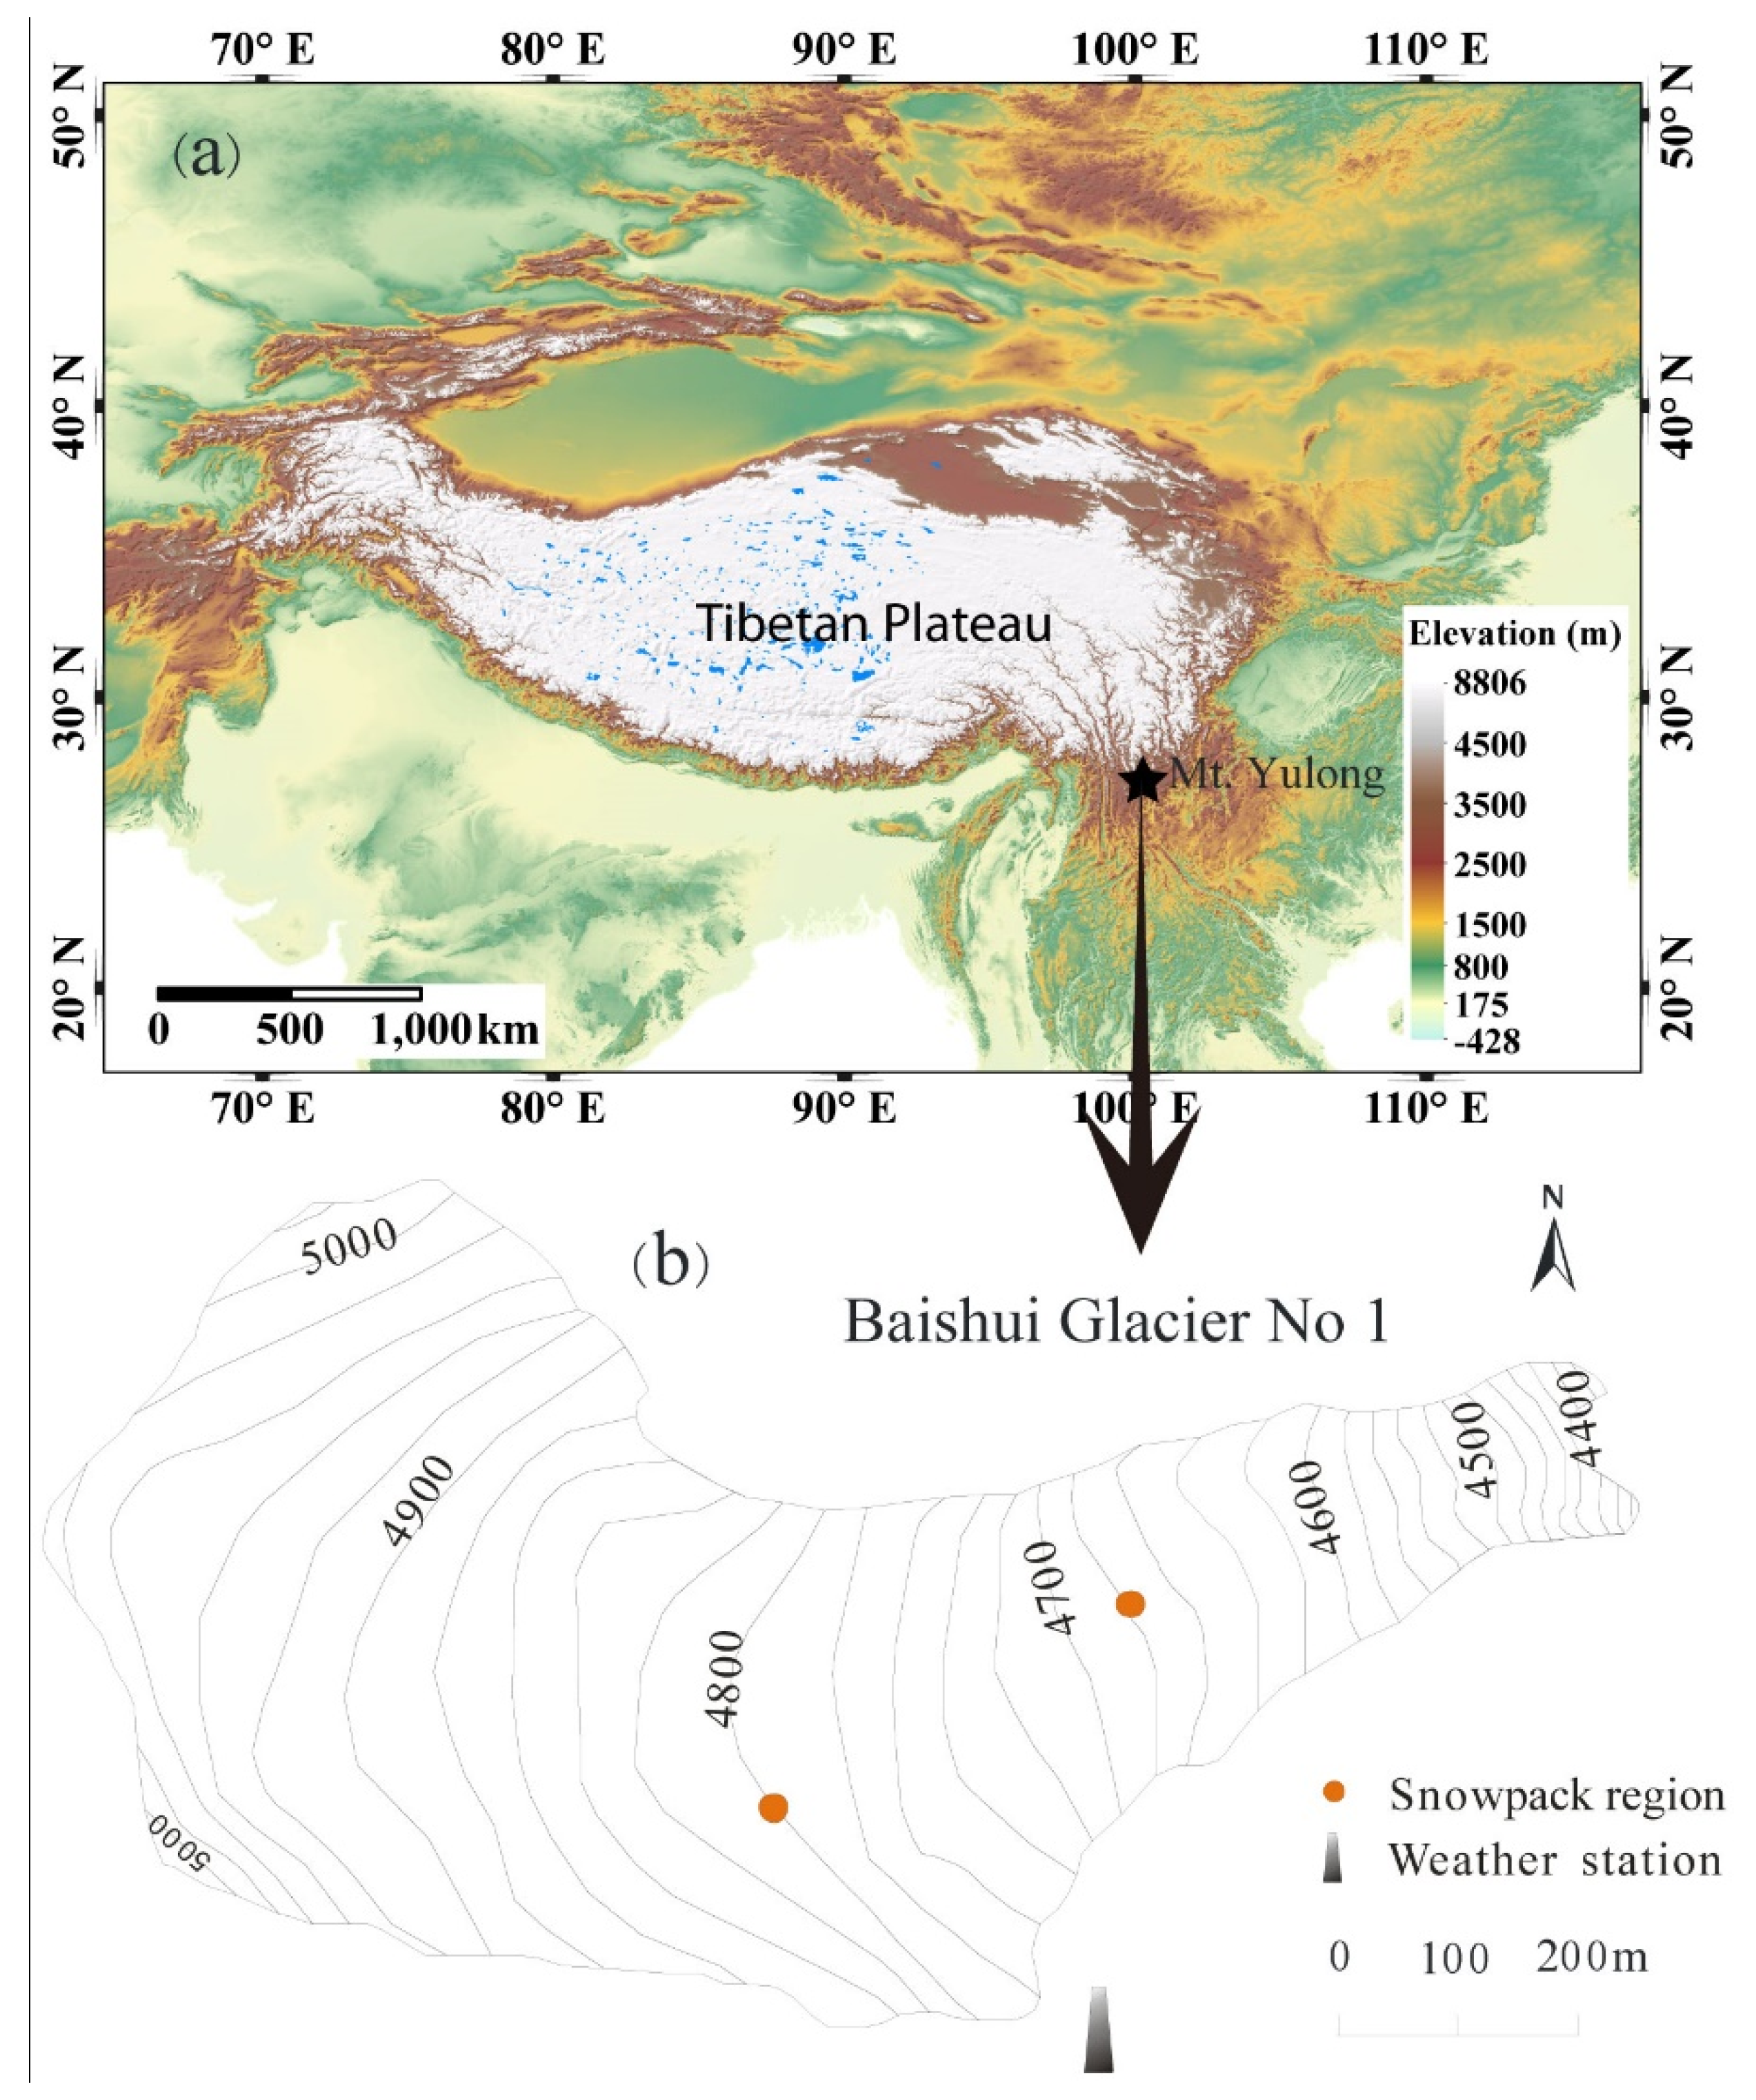
Yulong Snow Mountain (27°10′–27°40′ N and 100°09′–100°20′ E, 5596 m a.s.l.), the southernmost glacial region in China, is located in the southern part of the Hengduan Mountains, China (Figure 1a). There are 13 glaciers on the mountain, covering an area of 4.48 km2 [13]. The climate in this region is dominated by monsoon and non-monsoon seasons. During the monsoon, moisture from the Indian Ocean is transported northward due to southwestern circulation and the southeastern monsoon from the Pacific Ocean. During the non-monsoon season, the westerly system plays an essential role [34,35].
Baishui Glacier No. 1 is the largest glacier on the eastern slope of the Yulong Snow Mountain, with an area of 1.17 km2, extending from east to west (Figure 1b). Its accumulation period is from the end of October to April and its ablation period is from May to October [36]. The glacier front is approximately at 4380 m, while the equilibrium line (ELA) is approximately at 4800 m a.s.l. It receives a total average annual precipitation of about 2000–3000 mm and has an average annual temperature of −3.7 °C. Most precipitation (three-quarters of the total) is deposited in the form of snow on the glacier during the accumulation period, whereas other precipitation falls as rain during the ablation period [35]. Baishui Glacier No. 1 is a temperate glacier with very high energy fluxes compared with continental glaciers. An automatic weather station was installed at 4800 m a.s.l. near Baishui Glacier No. 1 (Figure 1b) by the Yulong Snow Mountain Glacier Environmental Observation and Research Station, Chinese Academy of Sciences, recording different meteorological data such as air temperature, atmospheric pressure, wind speed, and relative humidity [31]. Meteorological data at 2400 m a.s.l. are taken from Lijiang Weather Station, located in Lijiang city, which is located 25 km south of Mt. Yulong.
2.2. Sampling and Analysis
From 2008 to 2017, snow samples from nine snowpacks were collected from Baishui Glacier No. 1, Mt. Yulong (Figure 1 and Table 1). To examine the monthly variation of isotopic profiles, samples from seven snowpacks were collected at the ELA of Baishui Glacier No. 1 from November 2008 to July 2009 (identified as S1 to S7). In addition, we collected snow samples from one snowpack drilled in April 2012 (identified as S8) and one in April 2017 (identified as S9) to observe the annual variation. Non-particulating suits, polyethylene gloves and masks were worn to ensure that samples were not contaminated during collection and handling. All the samples were collected at 10 cm increments with cleaned stainless-steel utensils and placed in Whirl-Pak® bags (B01323WA, Nasco Sampling, LLC, Madison, USA). These samples were melted at room temperature, transferred to 60 mL high-density polyethylene (HDPE) bottles and then stored at 5 °C before analysis. Snow samples were measured in the Key Laboratory of Western China’s Environmental Systems (Ministry of Education), Lanzhou University, using a laser absorption water isotope spectrometer analyzer (DLT-100, Los Gatos Research). The 18O/16O ratios were expressed in δ notation as differences in parts per thousand relative to the Vienna Standard Mean Ocean Water (VSMOW). The measuring precision was 0.2‰ [37]. All the data are shown in Table S1 in the Supplementary Materials.
3. Results
3.1. Monthly Isotopic Evolution
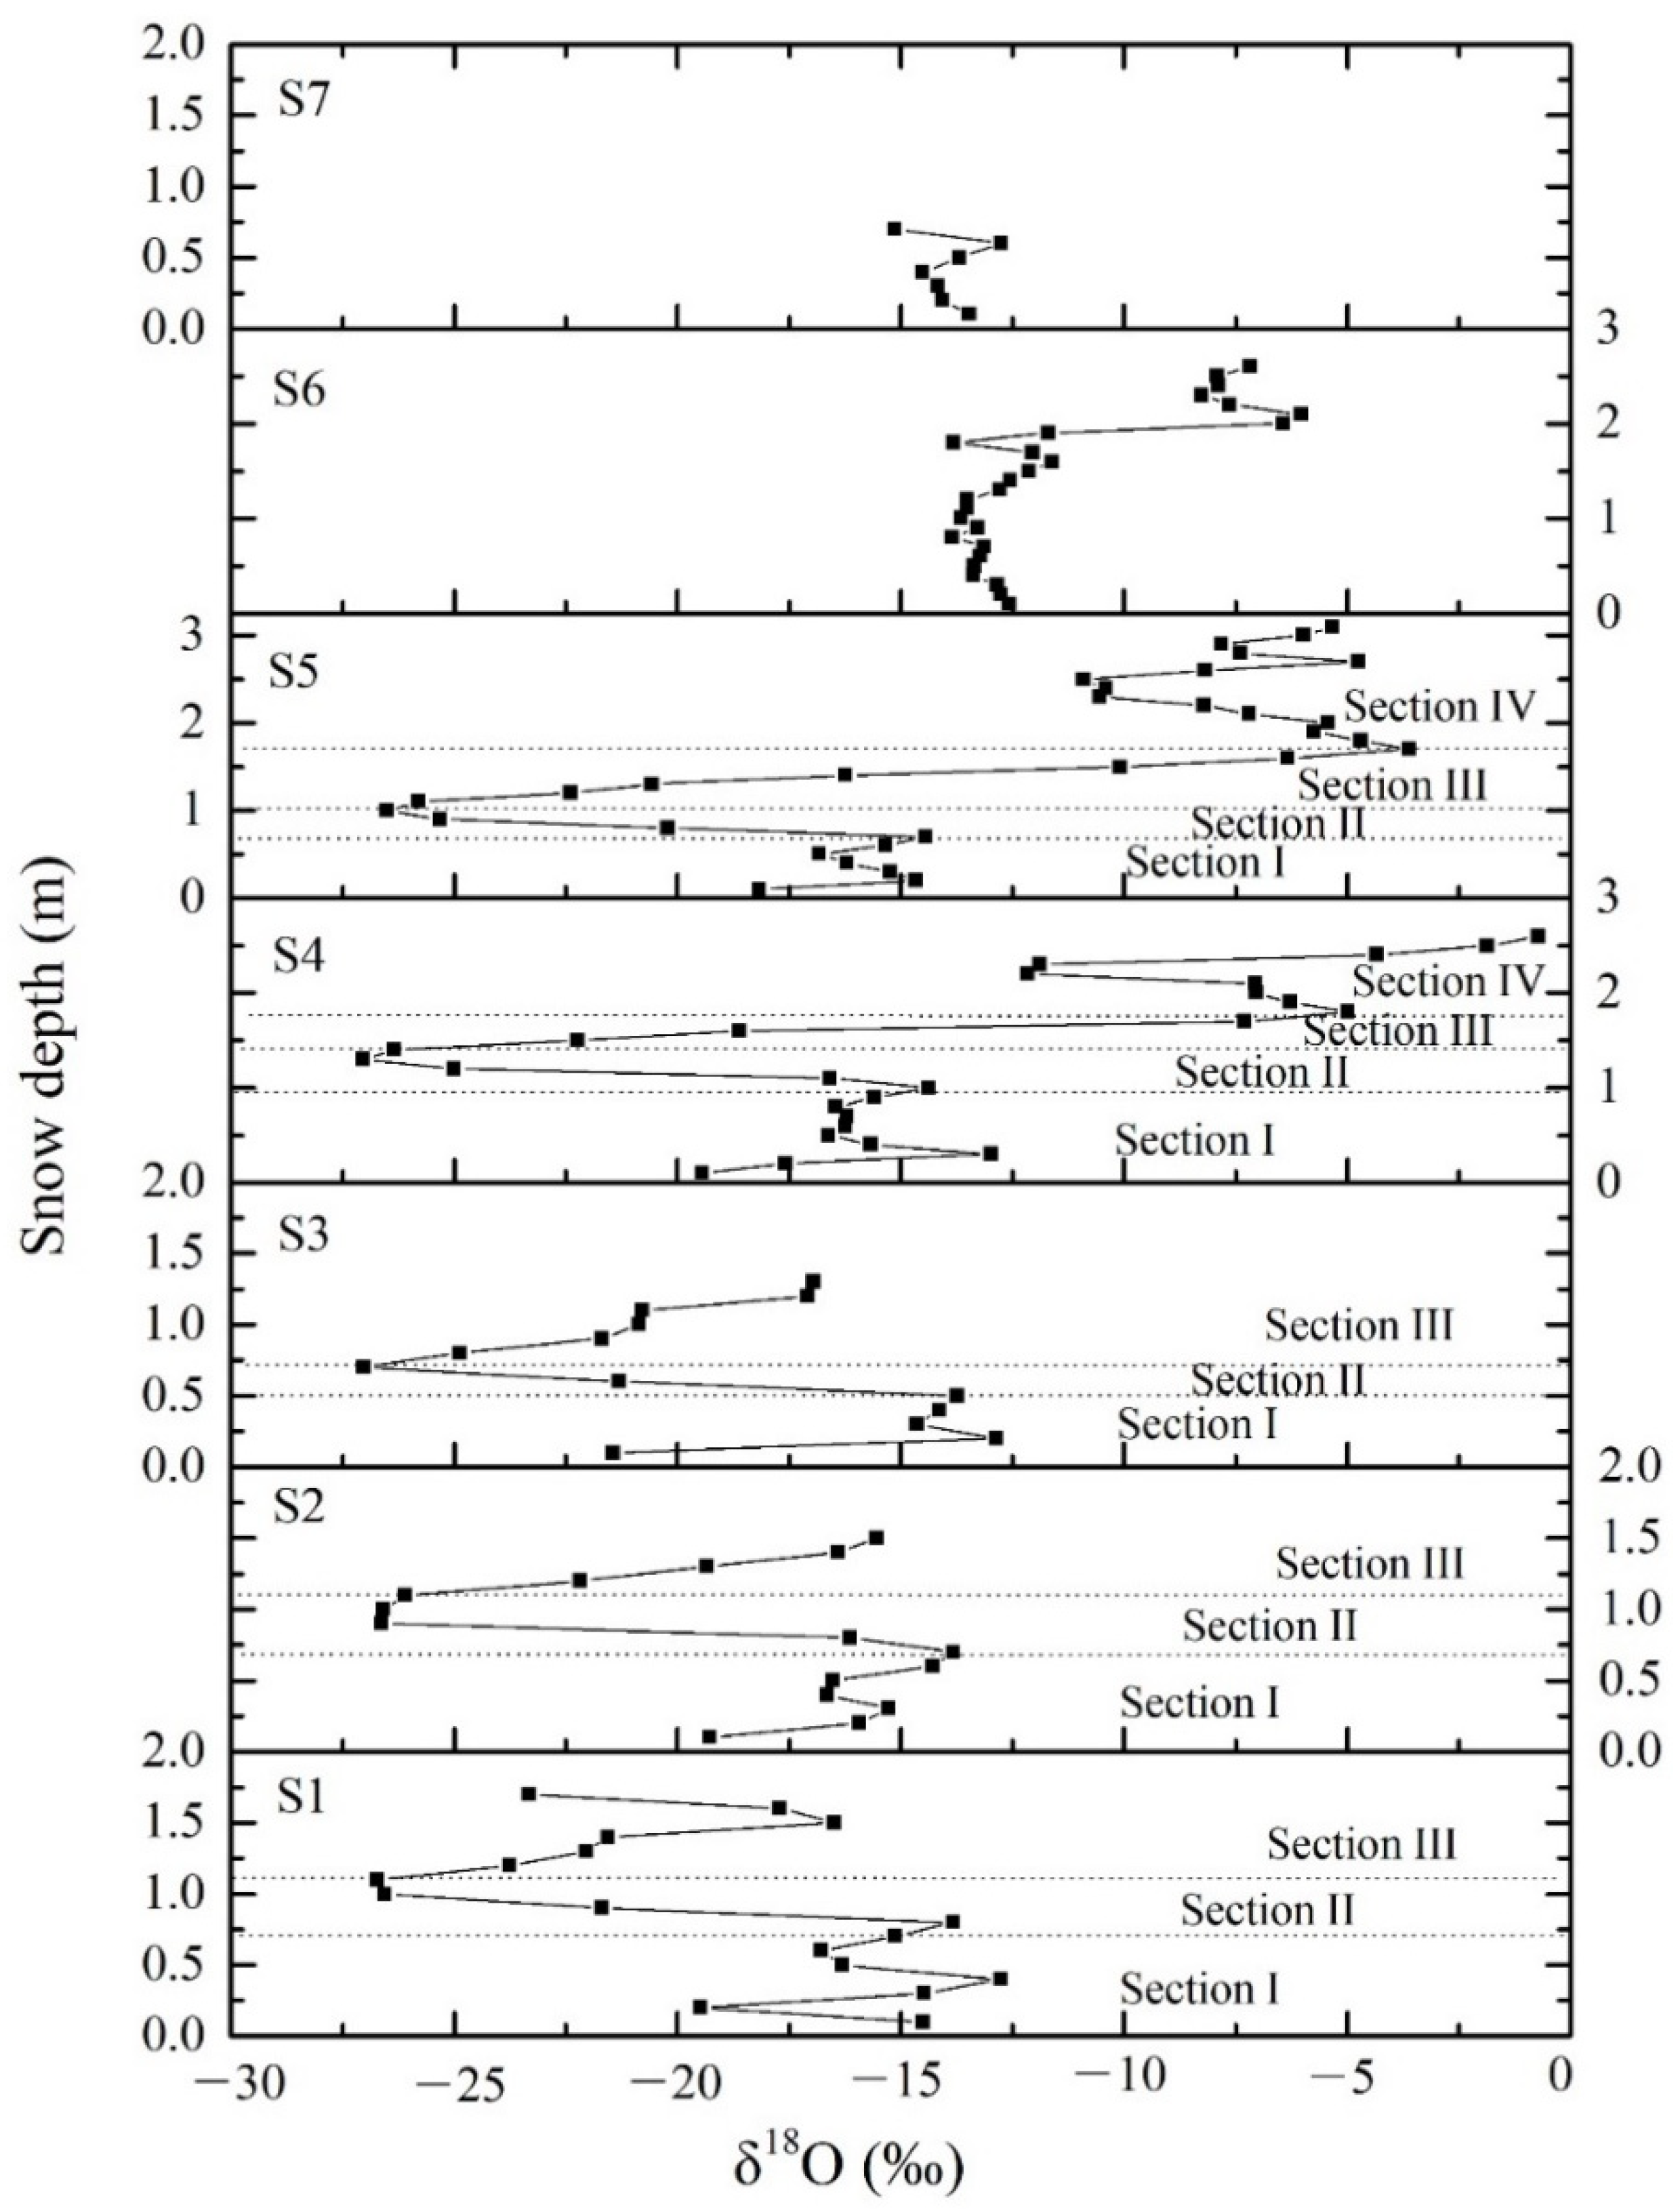
The snow depth decreased from S1 to S3, whereas the vertical δ18O curve was similar (Figure 2). Every snowpack can be divided into three sections according to δ18O. The 18O was relatively enriched in section I. The δ18O values decreased with the increase of snow depth in section II, but increased with the increasing snow depth in section III. Taking S2 as an example, in section I, the area between the bottom and 0.7 m of depth had high δ18O values (average: −16.0‰); in section II, the area between 0.7 m and 1.1 m of depth had low values (average: −25.4‰); and in section III, the area between 1.1 m and 1.4 m of depth had relatively high values (average: −17.1‰). Moreover, the minimum δ18O for the three snowpacks occurred in section Ⅱ, while the maximum values occurred in section I. We noted that the layer for the minimum values transformed from 1.0 m on 9 November to 0.8 m on 9 December and further to 0.6 m on 8 January.
S4 and S5 show larger snow depths relative to S1, S2 and S3 (Figure 2). The following characteristics are observed with respect to S4: (1) the δ18O curve below 1.5 m is still similar to that of S1, S2 and S3, whereas the δ18O value above 1.5 m (section IV) is variable; (2) the δ18O values are generally lower than −10.0‰ in the lower section (sections I, II and III) but higher than −10.0‰ in the upper section (section IV) (Figure 2). The δ18O average of the upper section and lower section for S4 is −6.4‰ and −18.6‰, respectively; (3) the S4 has a low δ18O of −27.0‰ at 1.3 m and a peak of −0.7‰ at 2.6 m Furthermore, S5 shows a larger snow depth and similar δ18O curve to that of S3, although the layers in which the minimum and maximum value occur is different. SP5 had a minimum of −26.5‰ at 1.0 m and a δ18O peak of −3.6‰ at 1.7 m. The June profile (S6) can be divided into two sections (Figure 2): the δ18O values are low in the lower section (average: −12.9‰) and relatively high in the upper section (average: −7.3‰). The δ18O values for snow sampled in July (S7) show smaller changes. The δ18O value ranges from −13.9‰ to −6.0‰ for S6, and from −15.1‰ to −12.7‰ for S7. Notably, the variation of δ18O below 1.5 m observed from November to April disappears in June and July.
3.2. Annual Isotopic Variation
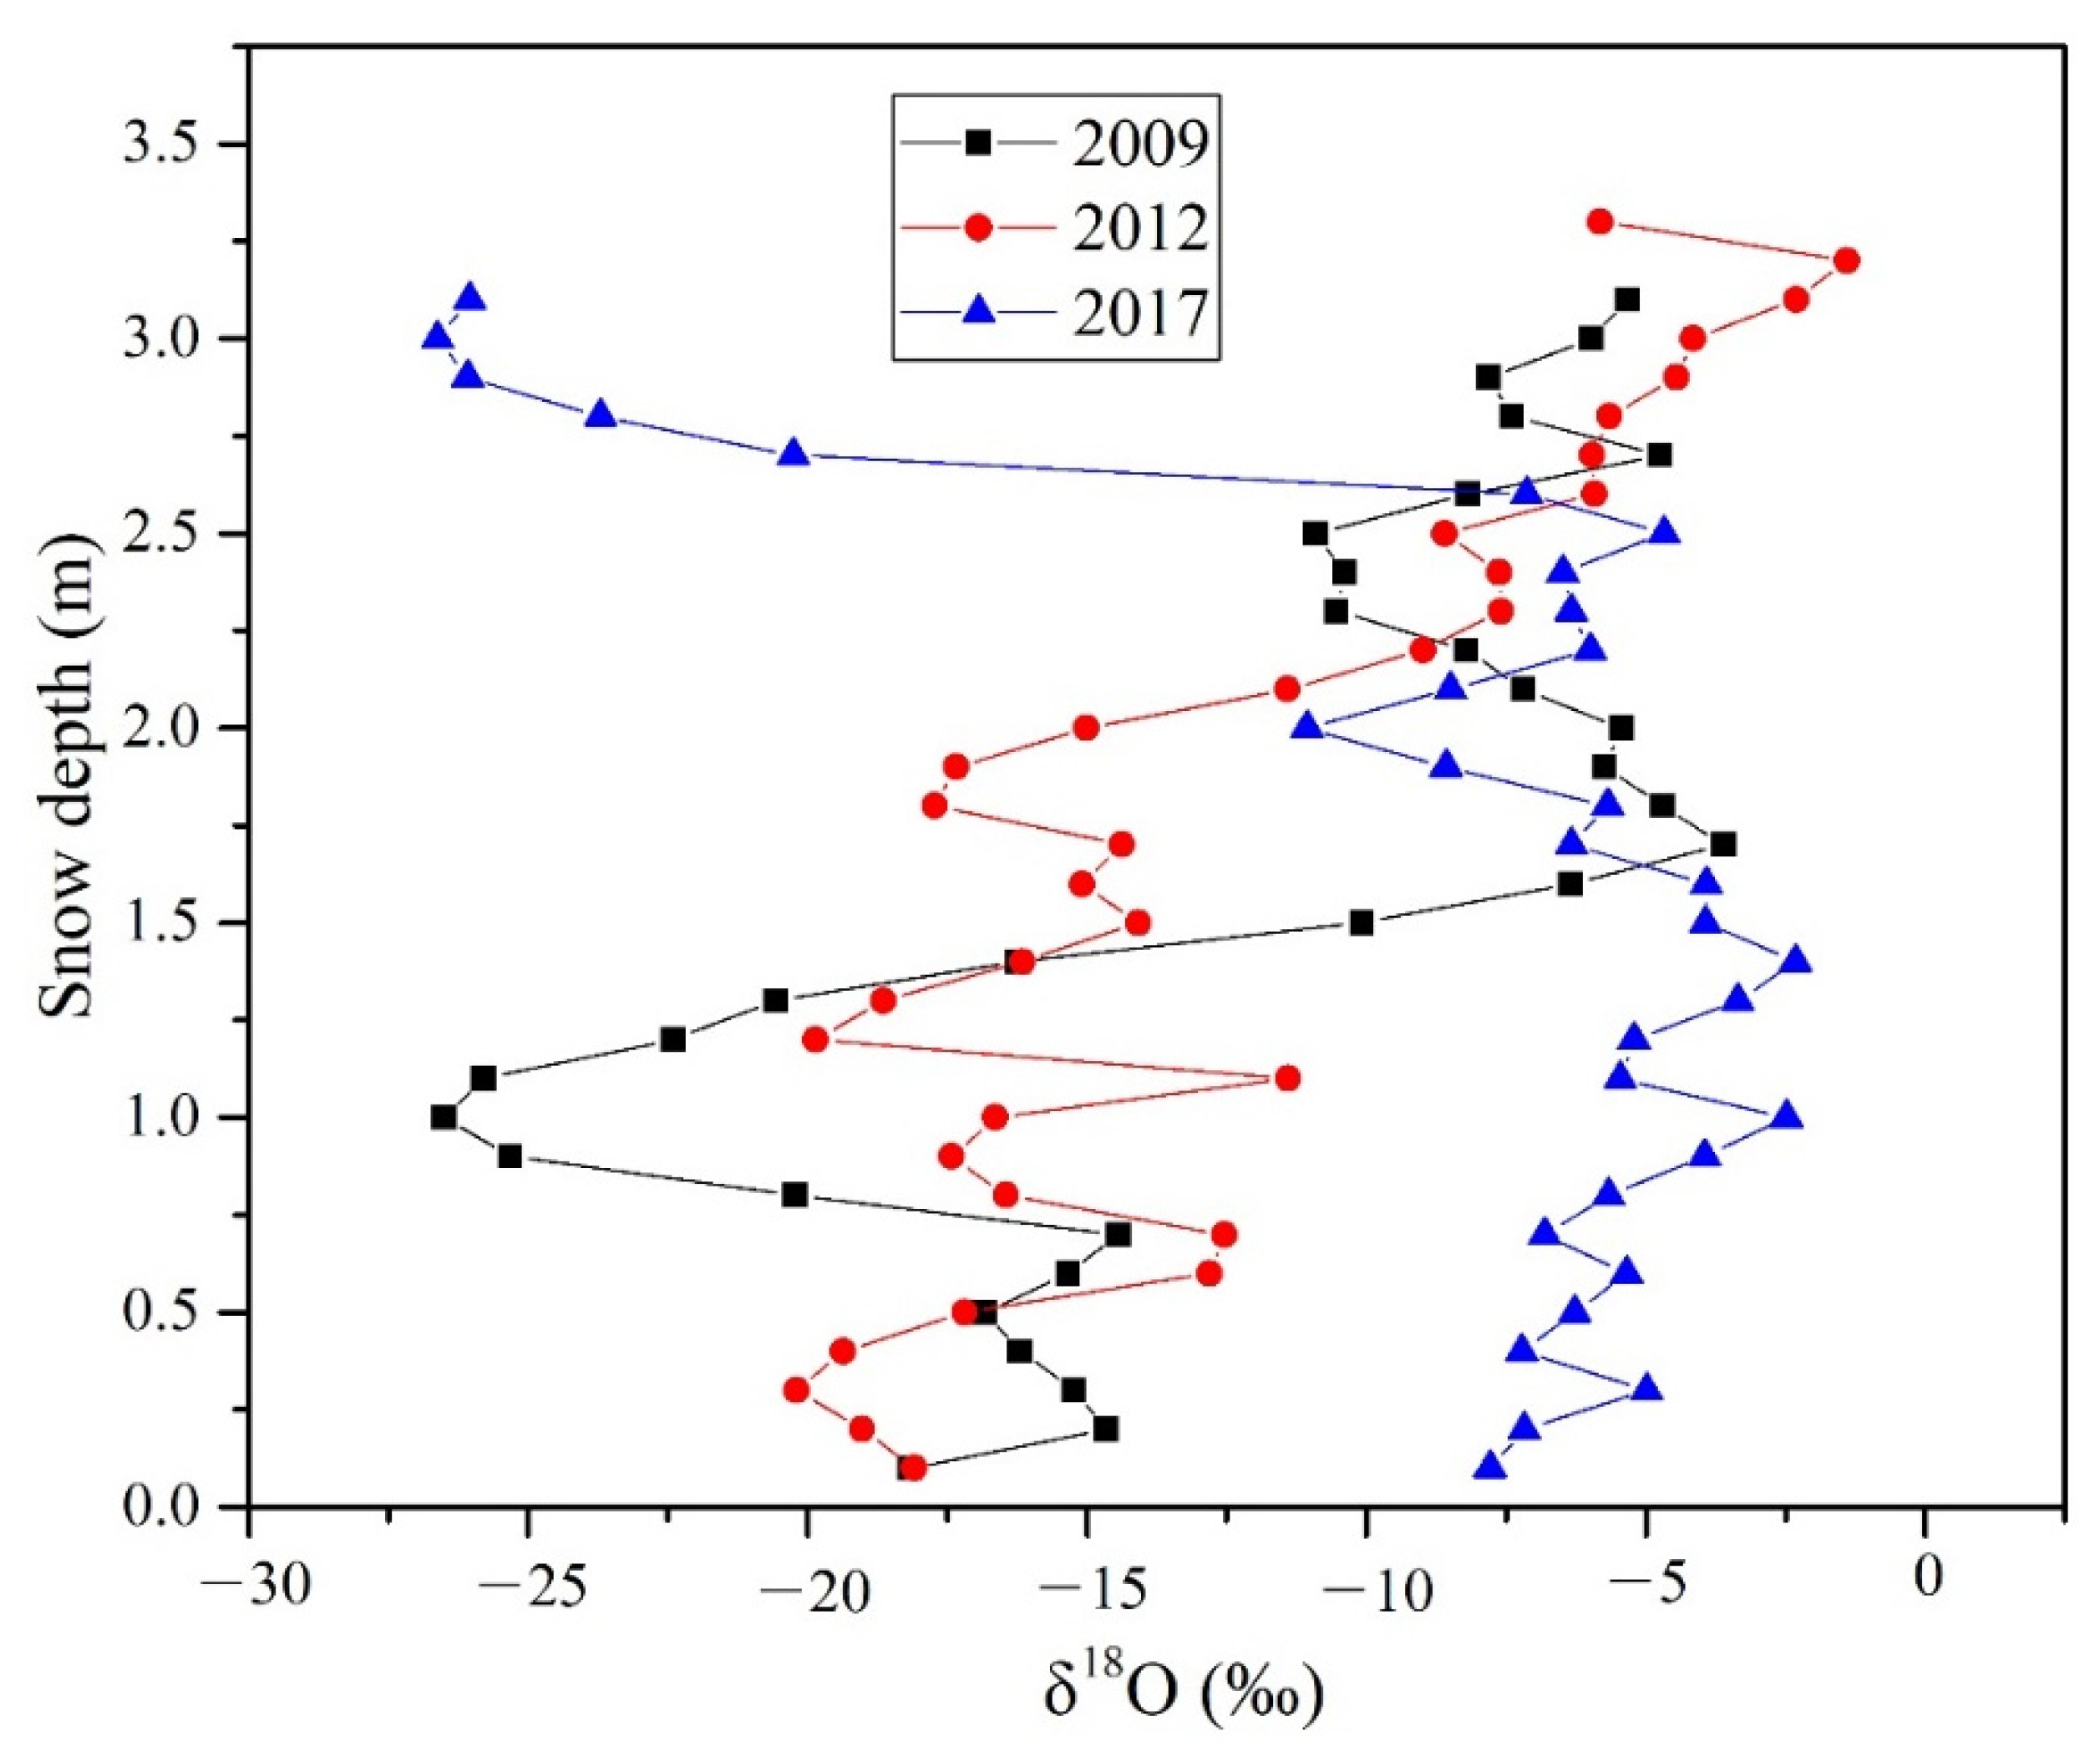
To examine the annual isotopic variation, we compare the δ18O curve of snowpacks in April 2009 (S5), 2012 (S8, from Pu et al., 2020a) and 2017 (S9) (Figure 3). Four features are observed: (1) the δ18O fluctuation range is similar. The δ18O values ranged between −26.5‰ to −3.6‰ in 2009, between −20.2‰ to −1.4‰ in 2012 and between −26.6‰ to −2.3‰ in 2017; (2) the average δ18O was similar in 2009 (−12.6‰) and 2012 (−12.4‰), but higher in 2017 (−8.9‰). The standard deviation was also relatively higher in 2017; (3) although the snowpacks showed similar vertical isotopic curves in 2009 and 2012, the curve differed markedly in 2017. In 2009, the 18O was relatively depleted from 0.0 m to 1.5 m (δ18O < −10.0‰) and was enriched from 1.5 m to the snow surface (>−10.0‰). In 2012, the 18O was relatively depleted below 2.1 m (δ18O < −10.0‰) and enriched above 2.1m (>−10.0‰). In 2017, the 18O was enriched from 0.0 m to 2.6 m (mostly δ18O > −10.0‰) but depleted above 2.6 m (δ18O < −20.0‰); (4) The layer at which the minimum or maximum values occurred was different in different years. The minimum δ18O occurred at the lower section in 2009 and 2012, but this was found at the surface in 2017. The layer with the maximum δ18O was in the middle section in 2009 (1.7 m) and 2017 (1.4 m), but in the upper section (3.2 m) in 2012. In summary, the vertical variations with respect to isotopes exert annual changes for snow deposited in different years.
4. Discussion
4.1. Monthly Variation of Snow 18O
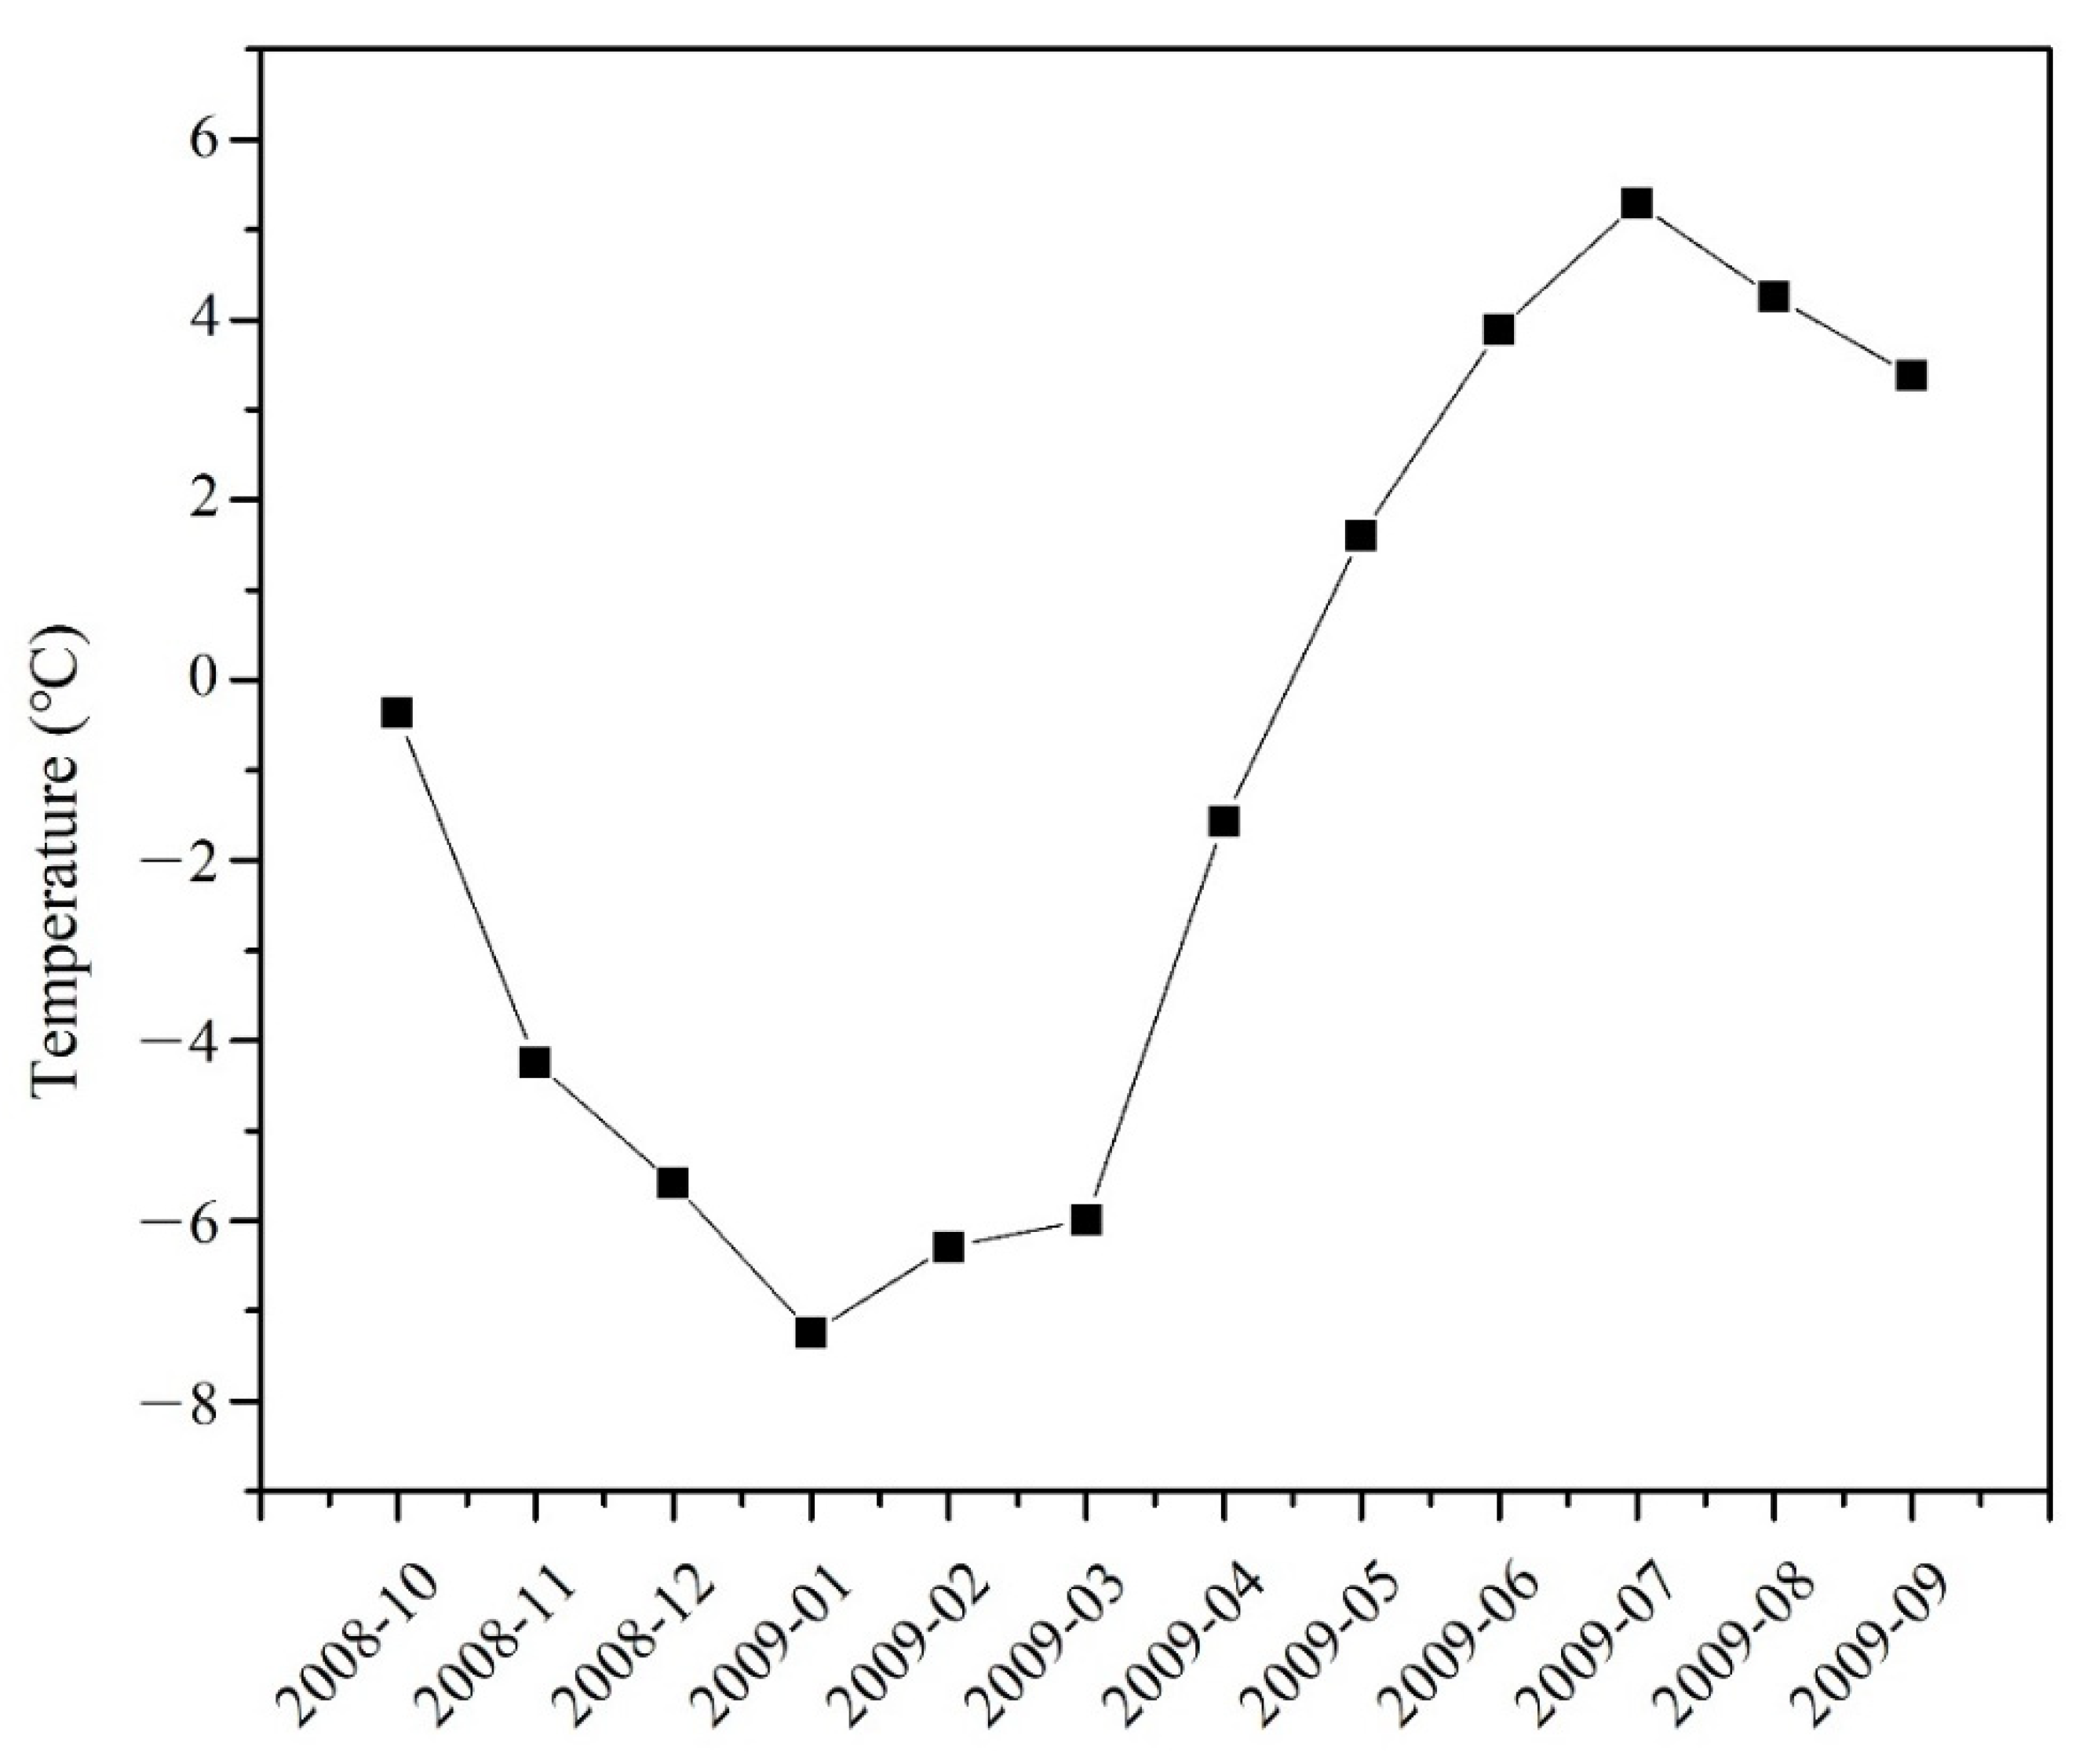
The snow depth decreased from S1 to S3, suggesting that most snow for S1, S2 and S3 was deposited before 9 November. Little snow was deposited from 9 November to 8 January, indicating that the three snowpacks shared the same initial precipitation. In addition, the monthly average of air temperature at 4800 m showed a decreasing trend from October to January (<0 °C) (Figure 4). Melting, which could result in the change of isotope contents in snow, could be negligible during this period. Therefore, the isotopic curve was maintained instead of changing. It is reported that a high temperature usually correlates to high δ18O values and vice versa [38]. Therefore, the vertical isotopic variation of S1, S2 and S3 is a reflection of the temperature variation when snow was deposited, which has also been illustrated in a previous study [31]. Moreover, a downward transformation of the layer’s minimum value is observed, suggesting post-depositional factors might occur after snow is deposited. Overall, the similar initial precipitation and low temperature results show the similarity of the isotopic curves for S1, S2 and S3.
According to our observation, the snow depth decreased by 20 cm per month from 9 November to 8 January. Only 20 cm of snow was deposited in February, while 100 cm and 50 cm of snow were deposited in March and April, respectively. The snow depth began to decrease after May. The snow depth variation suggests that the autumn and spring were the most significant periods for snow accumulation in 2008/2009. With respect to S4 and S5, the δ18O curve below 1.5 m was still similar to that of S1, S2 and S3, suggesting that autumn precipitation could still be distinguished in March and April snowpacks. This can be attributed to the temperature, which is usually lower than 0 °C from October to April when a small melting event occurs. Moreover, the upper layer of S4 and S5 (section IV) was characterized by high δ18O values while the lower layers (sections I, II and II) showed low δ18O values. Taking S6 as an example, the lower section of the snowpack in which snow accumulated in the autumn was depleted in heavy isotopes, whereas the upper-section snow, which mainly accumulated in March and April, was enriched in heavy isotopes. This indicates that autumn precipitation was depleted in 18O while spring precipitation was enriched in 18O in the study area, which is consistent with the precipitation of the South Tibetan Plateau [28].
The variation of δ18O in the lower layers in S1–S5 (sections I, II and III) was not observed in June and July. Instead, isotopic homogenization occurred. To investigate the isotopic homogenization, the coefficient of variation of δ18O values (standard deviation divided by average value) for all snowpacks were computed. The coefficient of −0.24 for S1, S2 and S3 increased to −0.52 and −0.55 for S4 and S5, respectively, and then decreased to −0.23 for S6 and further to −0.05 for S7, indicating that isotopic homogenization occurred in June and July. The isotopic homogenization was particularly distinct in July, which might result from an increase in temperature. Figure 4 indicates that the monthly average of air temperature at 4800 m maintained low values in January, February and March, increased distinctly from March to July and decreased gradually from July to September (Figure 4). The maximum value occurred in July and the minimum value occurred in January. Moreover, the average air temperature as lower than 0 °C from October to April and higher than 0 °C from May to September. This indicates that snow melting might have occurred after May. With the increase of temperature, snow melting became increasingly intense. When the temperature increased and melting occurred, meltwater generated by the surface snow layer flowed downward. During this process, an isotopic exchange occurred between solid and liquid water, resulting in the enrichment of heavy isotopes and isotopic homogenization in snow layers [32,39,40,41,42].
4.2. Annual Variation of Snow 18O
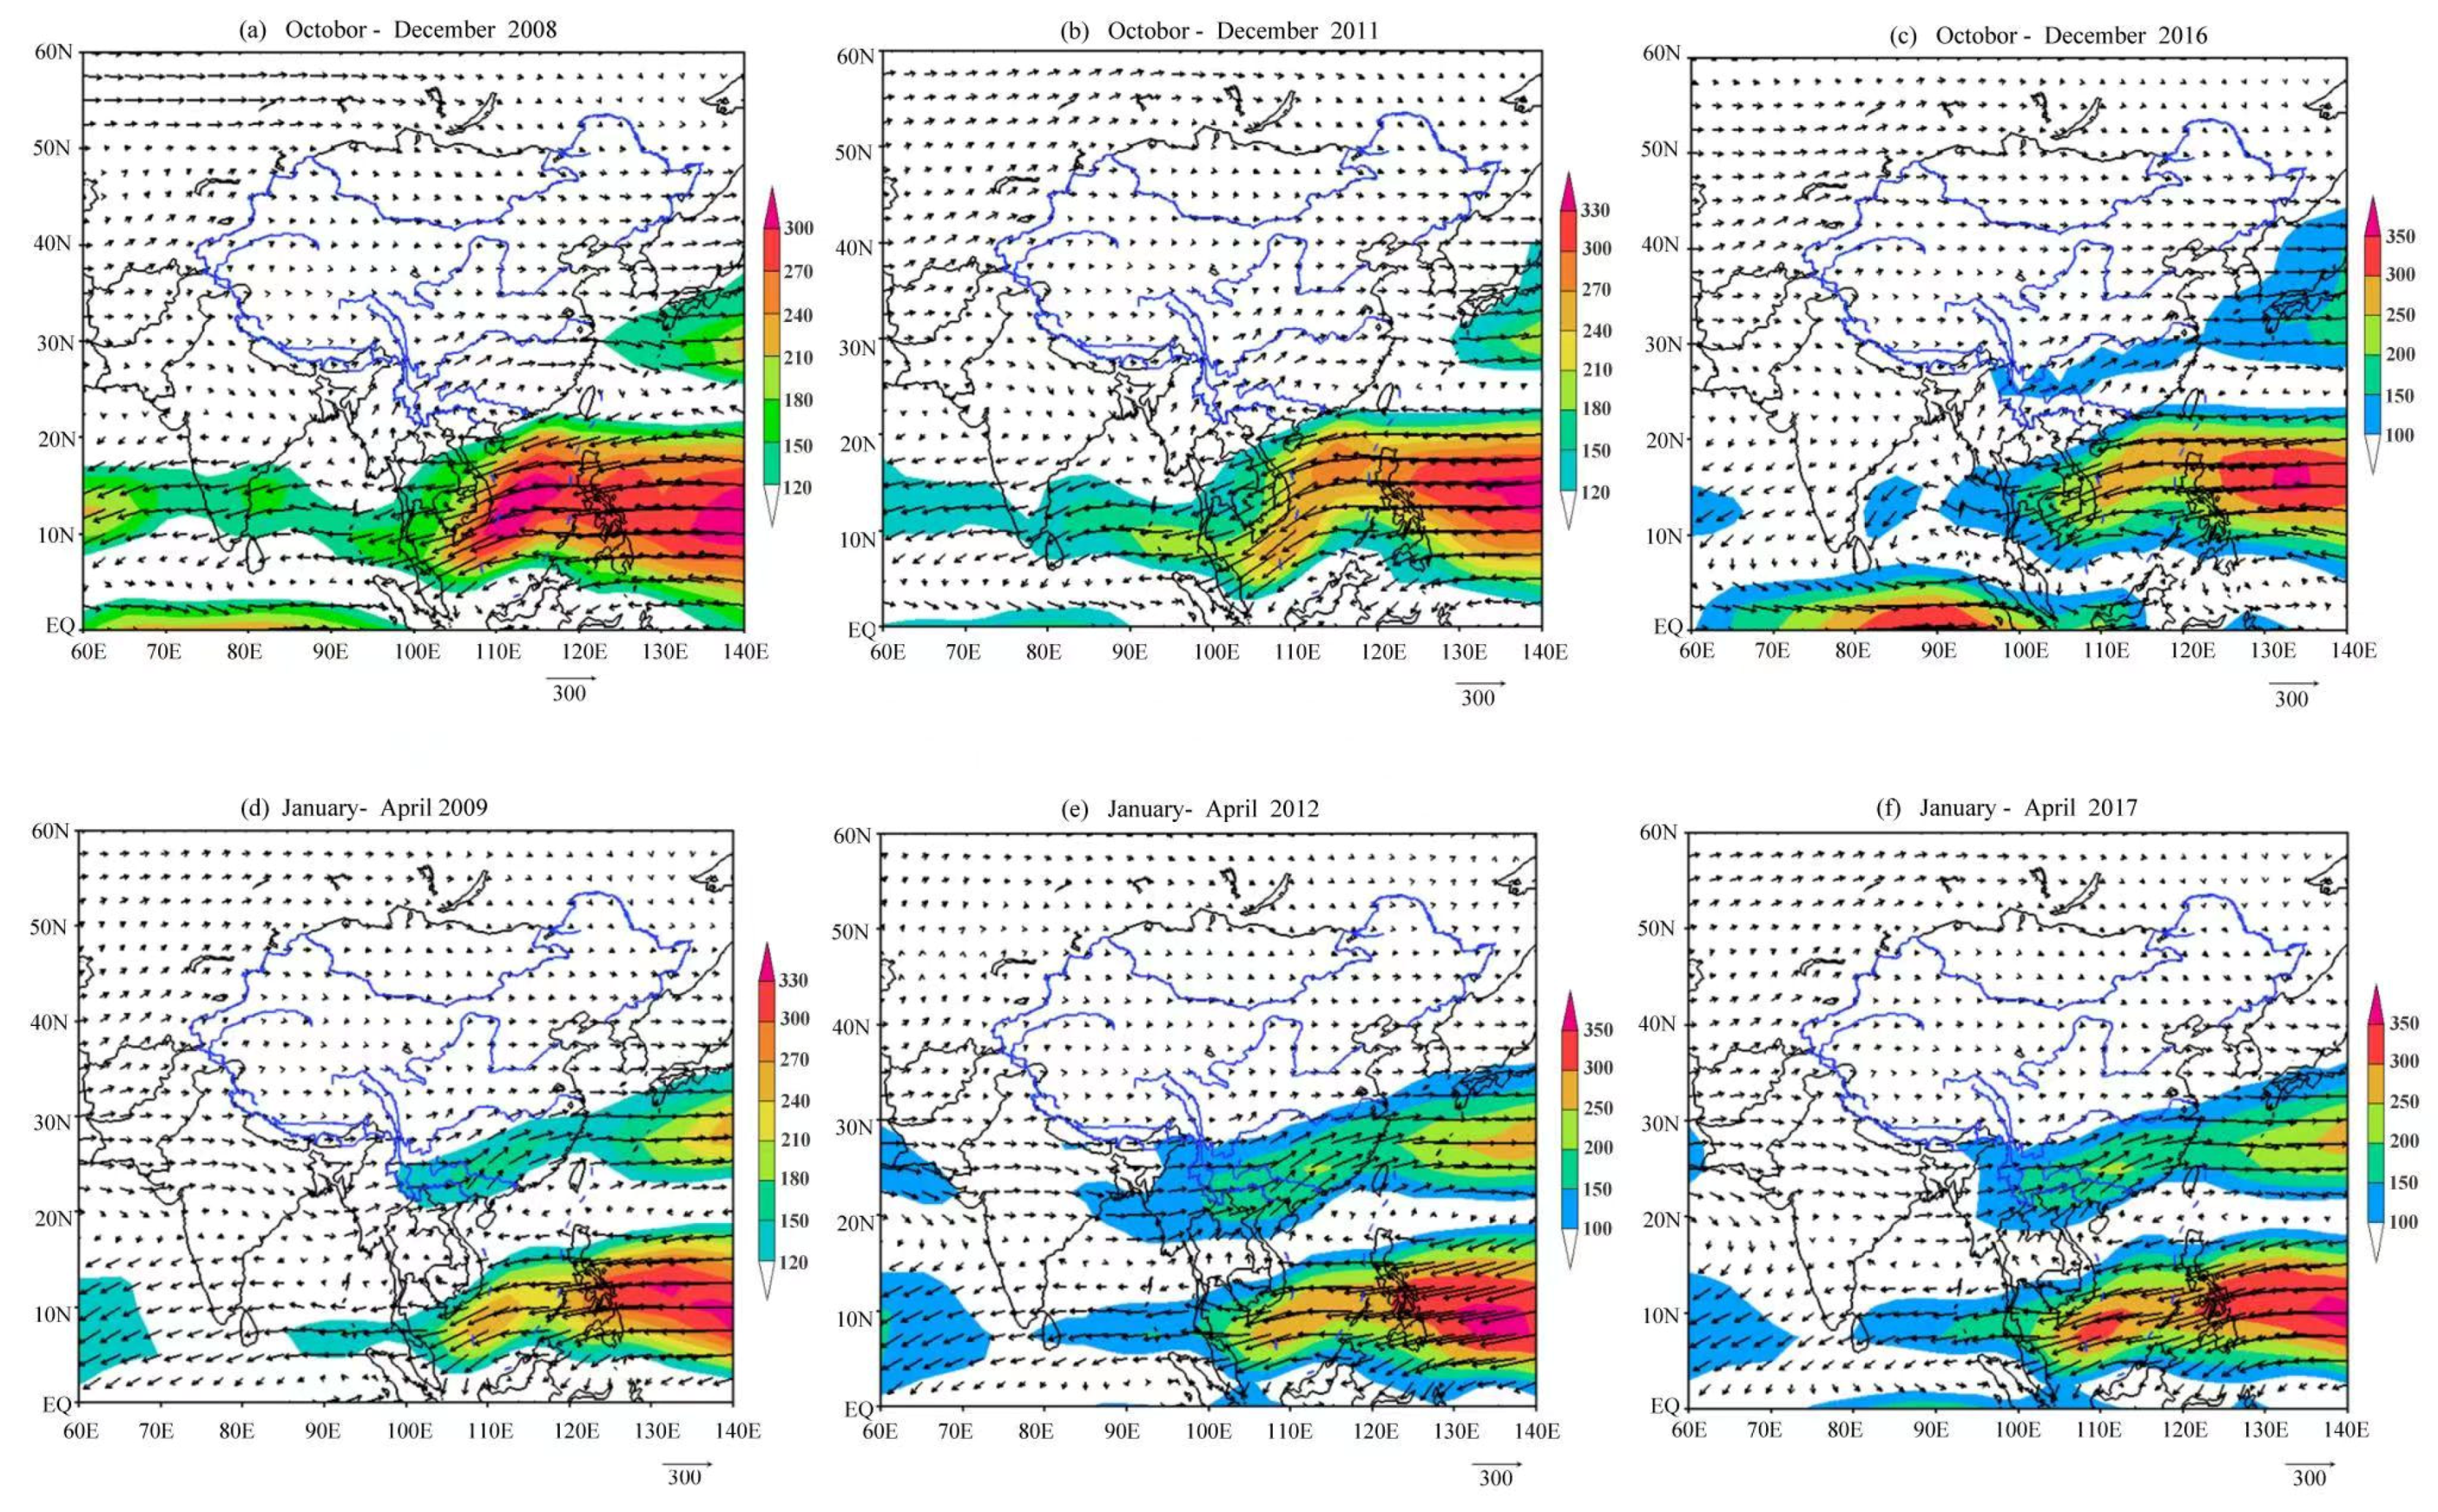
Distinct annual variations of isotope contents in snow profiles have been observed in this study. The depletion of heavy isotopes in the lower section in 2009 (S5) and 2012 (S8) was not observed in the snow sampled in 2017 (S9). Instead, the δ18O values between 0.0 m and 2.6 m in 2017 were found to be as high as those of the upper section (above 1.5 m) in 2009 and 2012. Moreover, heavy isotopes were depleted from 2.6 m to the snow surface in 2017. This might result from the following possible factors: (1) the snow melting occurring before the sampling smoothed the δ18O curve and led to the enrichment of the heavy isotopes in the lower section of 2017 snow; (2) the lower section of snow sampled in 2009, 2012 and 2017 had an entirely different source of water vapor, causing a significant difference of isotope contents; (3) snow below 1.5 m in 2009 and 2012 was deposited in the autumn with low δ18O values, whereas snow below 1.5 m in 2017 was deposited in the spring with high δ18O values. Here, we analyze the temperature data at 4800 m in 2009, suggesting that snow melting should not be the controlling factor because the monthly average of air temperature at 4800 m is lower than 0 °C in April (Figure 4), and most of the daily temperatures are also lower than 0 °C. Snow would therefore not be subject to intense melting in April. This has also been illustrated by previous studies [36]. Additionally, previous studies report that the air temperature at 4800 m and 2400 m in the Mt. Yulong region shows a consistent changing trend [43,44]. The monthly average temperature in April in Lijiang city (2400 m a.s.l.) was 15.6 °C in 2009, 14.5 °C in 2012 and 14.2 °C in 2017 (Figure 4), indicating no distinct increase of the April temperature from 2009 to 2017. Therefore, snow melting should not be the main factor resulting in the annual difference. NCEP/NCAR (National Centers for Environmental Prediction/National Center for Atmospheric Research) reanalysis data were used to analyze the water vapor source over the study area. Figure 5 shows that the westerlies mainly controlled the study area during the non-monsoon period in 2008/2009, 2011/2012 and 2016/2017, suggesting that the source of water vapor was similar in the three years.
Given all that, the annual isotopic variation should result from the fact that snow below 1.5 m in 2009, 2012 and 2017 was deposited in different periods. Pu et al. [31] reported that snow is depleted in heavy isotopes during the post-monsoon period as the vapor that evaporates from the local surface water is still depleted in heavy isotopes due to the recharge of monsoon rainwater. However, the δ18O values of surface water are relatively high during the pre-monsoon period, leading to vapor from the local recycling processes being enriched in 18O during the pre-monsoon period [19]. This indicates that snow in the lower snowpack section was deposited in the autumn (post-monsoon period) in 2009 and 2012, but mainly deposited in spring (pre-monsoon period) in 2017.
4.3. Climate Change and Isotopes in Snow
This study suggests that the isotope contents in snow are influenced by air temperature, snow accumulation and water vapor sources. Accordingly, the isotopes in the snowpack profile can reflect meteorological information. At the monthly scale, we can distinguish the information on snow accumulation and melting by determining the monthly variation of vertical isotope contents in snow. At the yearly scale, we can analyze the annual difference of corresponding meteorological factors.
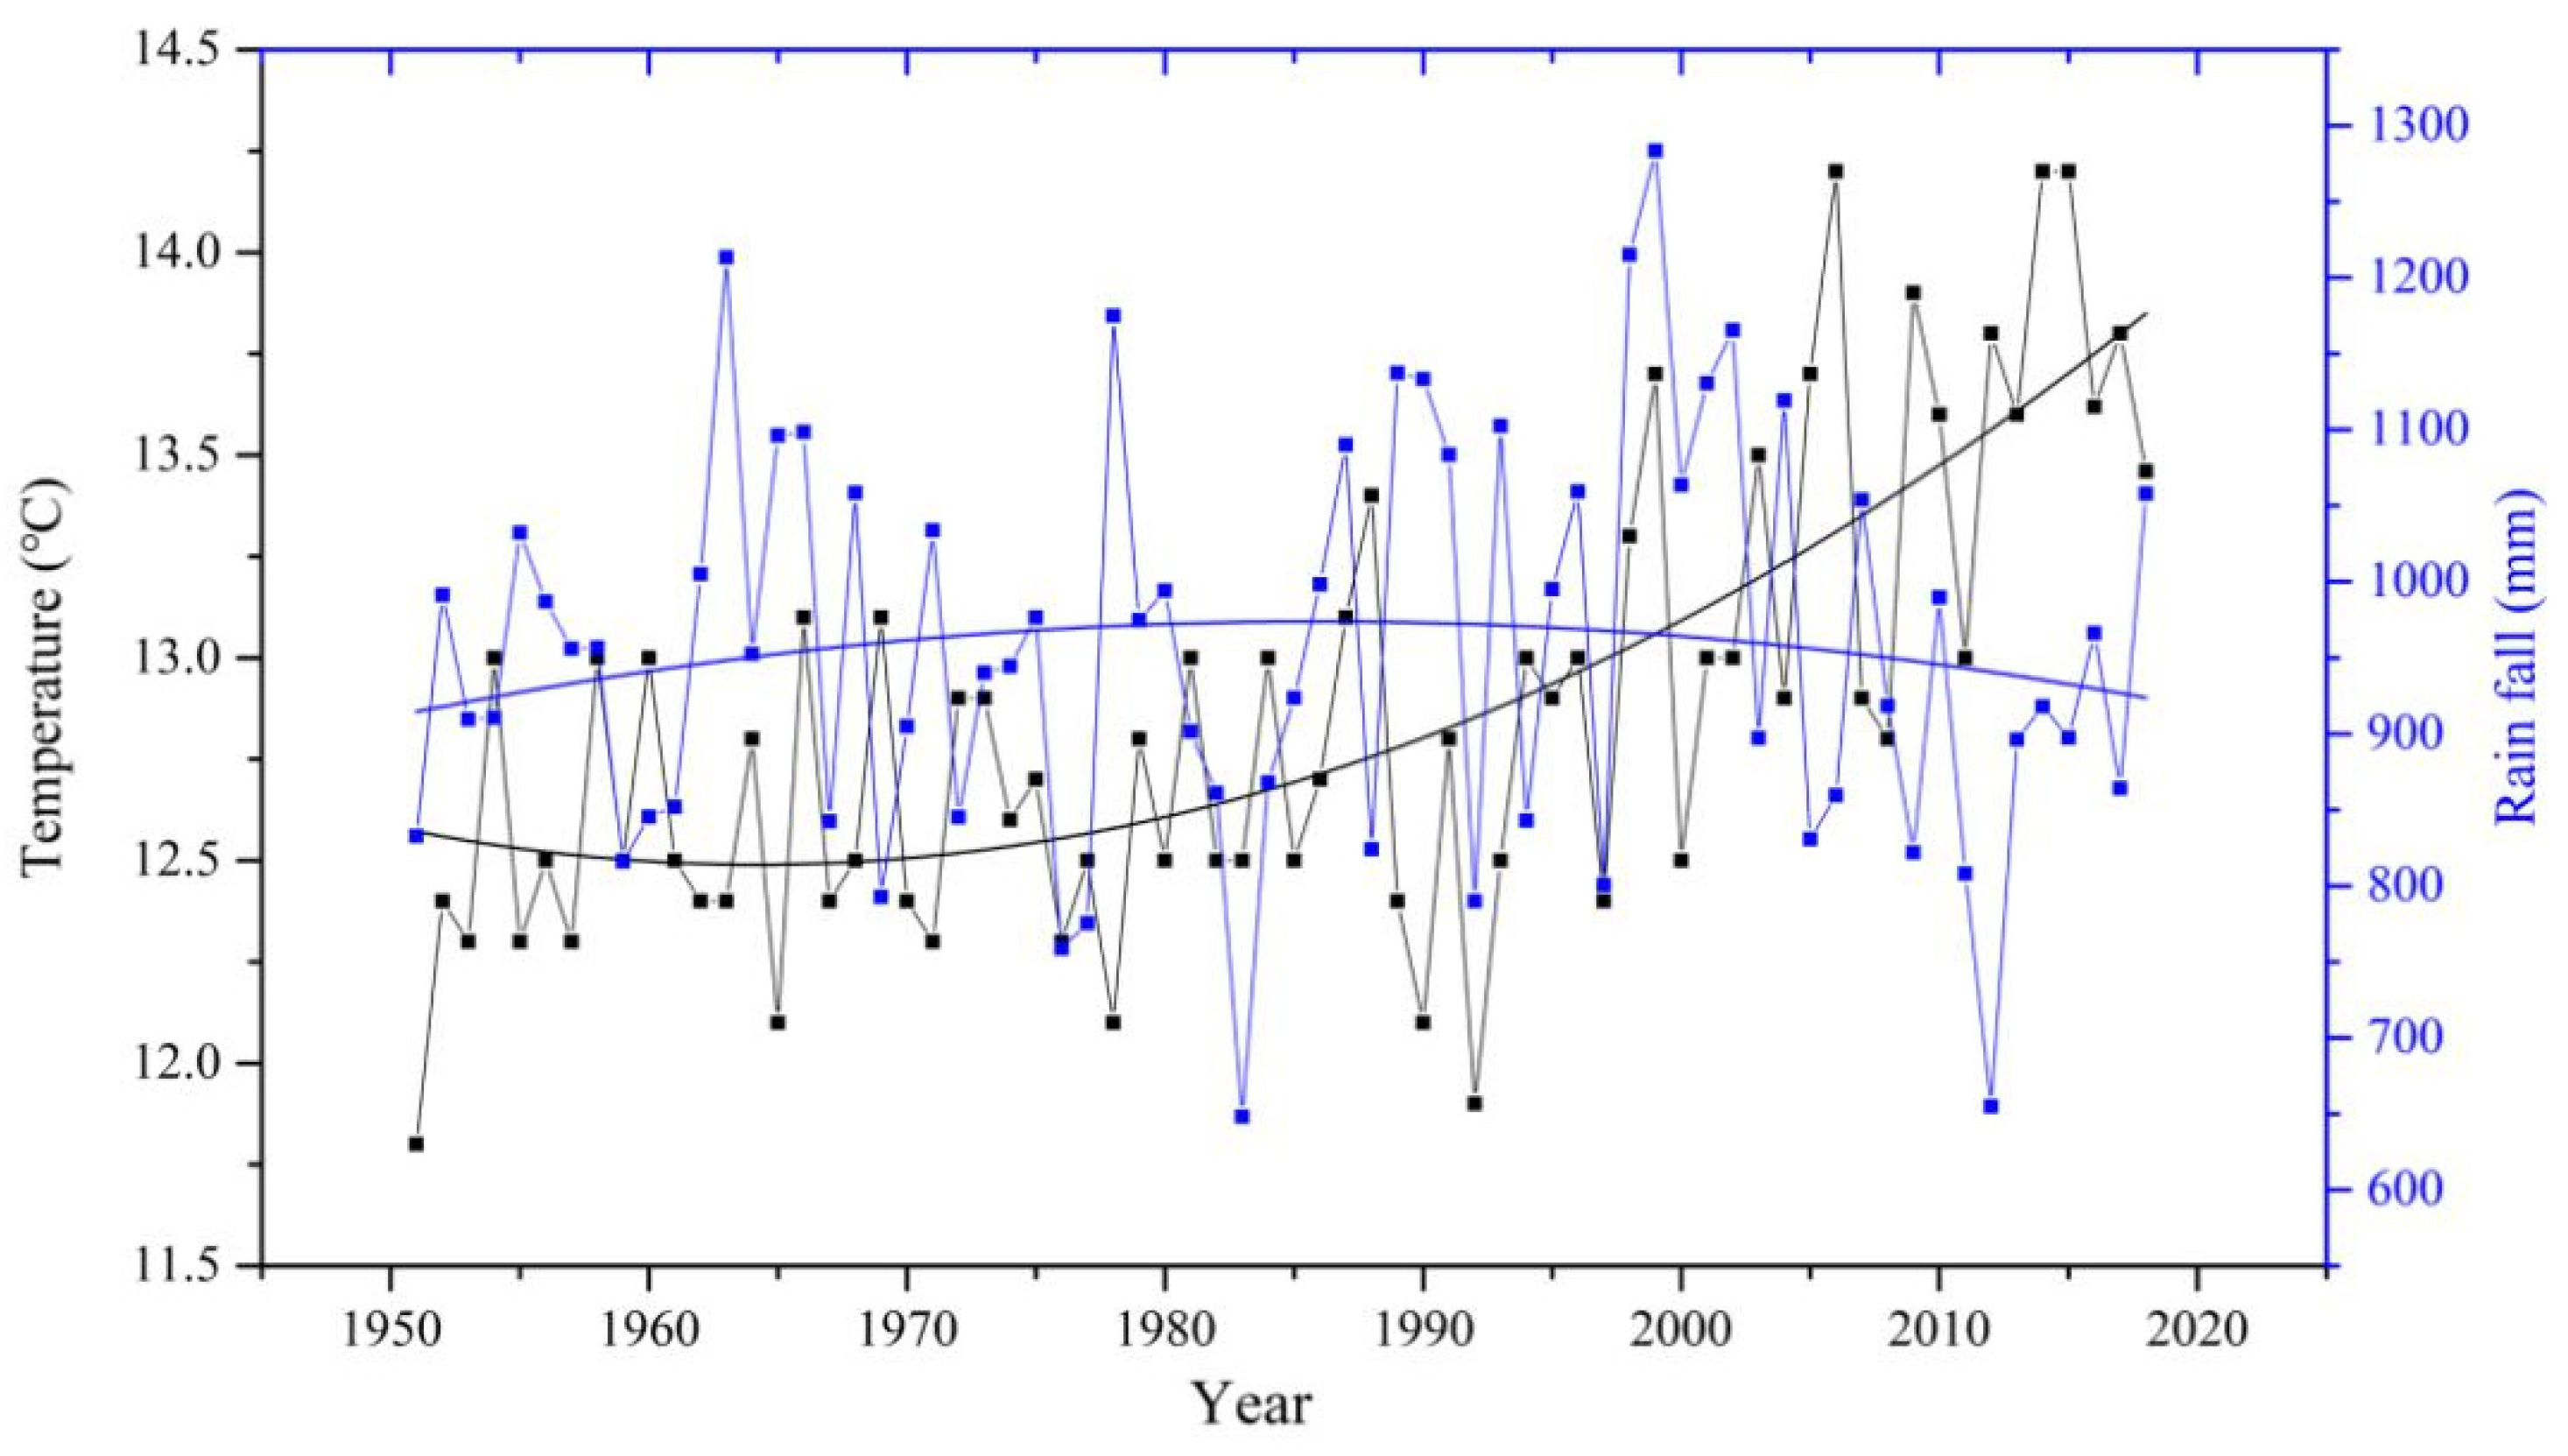
Figure 6 shows that the annual average temperature of Lijiang (2400 m a.s.l.) exhibited an increasing trend during 1951–2018, while precipitation showed no significant changing trend. The increasing trend of temperature has been particularly evident since 1990. Previous studies report that the air temperature on Baishui Glacier No.1 and Lijiang shows a consistent changing trend [43,44]. Wang et al. [13] indicated that the increasing temperature in the Mt. Yulong region has resulted in the acceleration of glacier melting and a lack of precipitation (snow) input for the glacier surface, which can be reflected by the isotopes in snow. On the one hand, the increasing temperature would influence the vertical curve of isotopes in snow; on the other hand, the increasing temperature would result in an increasingly early ablation of snow and the glacier, leading to isotopic homogenization in snow layers. Therefore, observing the monthly variation of snow isotopes could provide evidence for climate change.
The water vapor source is significant for the cryosphere. According to the analysis in this study, the isotope contents in snow can evidence the variation of changes in water vapor. It has been illustrated that the western and southern boundaries are the main water vapor influx boundaries, as for the Tibetan Plateau [45]. Surprisingly, the water vapor contribution rate of the western channel to the Tibetan Plateau has been increasing, whereas the southern channel’s water vapor contribution has been decreasing in the past years [45]. Mt. Yulong region, which is mainly controlled by the westerlies during the non-monsoon period and by the South Asian monsoon during the monsoon period, is in the southeast margin of the Tibetan Plateau. The changes of water vapor on long-term time scales will certainly result in the change of snow accumulation on glaciers on Mt. Yulong. The isotope contents in snow at the end of the accumulation period, therefore, could provide information on climate change when climatic data are lacking or difficult to obtain, particularly in cold, glacierized regions.
5. Conclusions
The monthly variation of the isotopic curve is observed in this study. The snowpacks sampled in the late autumn and winter show similar snow depths and δ18O curves, exhibiting high–low–high variation from the bottom to the snow surface. In the spring snow, the high–low–high curve still exists below 1.5 m, but relatively high values are generally witnessed from 1.5 m to the surface. Isotopic homogenization occurs in June and July, smoothing the vertical variation of δ18O in snow. Moreover, the vertical variations with respect to isotopes exert annual changes for snow deposited in different years. Although the δ18O values show similar vertical isotopic curves in the snow of 2009 and 2012, this differed markedly in 2017. The isotopic depletion in the upper section of snow sampled in 2009 was not found in 2017. In 2017, the δ18O value was enriched from 0.0 m to 2.6 m (mostly >−10.0‰) but was depleted above 2.6 m (<−20.0‰).
Our study suggests that the isotope contents in snow are influenced by meteorological factors. Accordingly, the isotopes in the snow profile can reflect meteorological information. We can distinguish the information on snow accumulation and ablation by determining the monthly variation of vertical isotope contents in snow and examine the annual difference of corresponding meteorological factors by determining the annual difference of vertical isotopic curves in snow layers. In summary, the stable isotopes in snow could provide evidence for climate change, particularly when climatic data are lacking or difficult to obtain in cold, glacierized regions.
Supplementary Materials
The supplementary materials showing the isotopic data to this article are available online at https://www.mdpi.com/2073-4441/12/12/3402/s1, Table S1: The δ18O value of snow samples in different snowpacks.
Author Contributions
T.P.: Conceptualization, Methodology. T.P., X.S.: Data curation, Writing–Original draft preparation. X.S.: Investigation, Resources. L.T., P.C.: Writing—Review and Editing. S.W., P.C.: Funding acquisition. All authors have read and agreed to the published version of the manuscript.
Funding
This research was supported by the National Nature Science Foundation of China (42077188, 41705132), the CAS “Light of West China” program, and the State Key Laboratory of Cryospheric Sciences (SKLCS-ZZ-2020 and SKLCS-OP-2019-10).
Conflicts of Interest
We declare that we have no financial and personal relationships with other people or organizations that could inappropriately influence our work; there is no professional or other personal interest of any nature or kind in any product, service and/or company that could be construed as influencing the position presented in/or the review of the manuscript.
References
- Sha, Y.Y.; Shi, Z.G.; Liu, X.D.; An, Z.S. Distinct impacts of the Mongolian and Tibetan Plateaus on the evolution of the East Asian monsoon. J. Geophys. Res. Atmos. 2015, 120, 4764–4782. [Google Scholar] [CrossRef]
- Yao, T.D.; Thompson, L.; Yang, W.; Yu, W.S.; Gao, Y.; Guo, X.J.; Yang, X.X.; Duan, K.Q.; Zhao, H.B.; Xu, B.Q.; et al. Different glacier status with atmospheric circulations in tibetan plateau and surroundings. Nat. Clim. Chang. 2012, 2, 663–667. [Google Scholar] [CrossRef]
- Guo, D.L.; Yu, E.T.; Wang, H.J. Will the Tibetan Plateau warming depend on elevation in the future? J. Geophys. Res: Atmos. 2016, 121, 3969–3978. [Google Scholar] [CrossRef] [Green Version]
- Yao, T.D.; Wu, F.Y.; Ding, L.; Sun, J.M.; Zhu, L.P.; Piao, S.L.; Deng, T.; Ni, X.J.; Zheng, H.B.; Ouyang, H. Multispherical interactions and their effects on the Tibetan Plateau’s earth system: A review of the recent researches. Nat. Sci. Rev. 2015, 2, 468–488. [Google Scholar] [CrossRef] [Green Version]
- Gao, J.; Yao, T.D.; Masson-Delmotte, V.; Steen-Larsen, H.C.; Wang, W.C. Collapsing glaciers threaten Asia’s water supplies. Nature 2019, 565, 19–21. [Google Scholar] [CrossRef] [PubMed] [Green Version]
- You, Q.L.; Zhang, Y.Q.; Xie, X.Y.; Wu, F.Y. Robust elevation dependency warming over the Tibetan Plateau under global warming of 1.5 °C and 2 °C. Clim. Dyn. 2019, 53, 2047–2060. [Google Scholar] [CrossRef]
- Zhou, B.T.; Wen, Q.H.; Xu, Y.; Song, L.C.; Zhang, X.B. Projected changes in temperature and precipitation extremes in China by the CMIP5 multi-model ensembles. J. Clim. 2014, 27, 6591–6611. [Google Scholar] [CrossRef]
- Immerzeel, W.W.; van Beek, L.P.H.; Bierkens, M.F.P. Climate Change Will Affect the Asian Water Towers. Science 2010, 328, 1382–1385. [Google Scholar] [CrossRef]
- Yang, M.X.; Wang, X.J.; Pang, G.J.; Wang, G.N.; Liu, Z.C. The Tibetan Plateau cryosphere: Observations and model simulations for current status and recent changes. Earth Sci. Rev. 2019, 190, 353–369. [Google Scholar] [CrossRef]
- Ren, L.Y.; Duan, K.Q.; Xin, R. Impact of future loss of glaciers on precipitation pattern: A case study from south-eastern Tibetan Plateau. Atmos. Res. 2020, 242, 104984. [Google Scholar] [CrossRef]
- He, Y.Q.; Zhang, Z.L.; Theakstone, W.H.; Chen, T.; Yao, T.D.; Pang, H.X. Changing features of the climate and glaciers in China’s monsoonal temperate glacier region. J. Geophys. Res. Atmos. 2003, 108, 4530. [Google Scholar] [CrossRef]
- Wang, S.J.; Shi, X.Y.; Cao, W.H.; Pu, T. Seasonal Variability and Evolution of Glaciochemistry at An Alpine Temperate Glacier on the Southeastern Tibetan Plateau. Water 2018, 10, 114. [Google Scholar] [CrossRef] [Green Version]
- Wang, S.J.; Che, Y.J.; Pang, H.X.; Du, J.K.; Zhang, Z.L. Accelerated changes of glaciers in the Yulong Snow Mountain, Southeast Qinghai-Tibetan Plateau. Reg. Environ. Chang. 2020, 20, 38. [Google Scholar] [CrossRef] [Green Version]
- Klaus, J.; McDonnell, J.J. Hydrograph separation using stable isotopes: Review and evaluation. J. Hydrol. 2013, 505, 47–64. [Google Scholar] [CrossRef]
- Yao, T.D.; Masson-Delmotte, V.; Gao, J.; Yu, W.S.; Yang, X.X.; Risi, C.; Sturm, C.; Werner, M.; Zhao, H.B.; He, Y.; et al. A review of climatic controls on δ18O in precipitation over the Tibetan Plateau: Observations and simulations. Rev. Geophys. 2013, 51, 525–548. [Google Scholar] [CrossRef]
- Vespasiano, G.; Apollaro, C.; De Rosa, R.; Muto, F.; Larosa, S.; Fiebig, J.; Mulch, A.; Marini, L. The Small Spring Method (SSM) for the definition of stable isotope—Elevation relationships in Northern Calabria (Southern Italy). Appl. Geochem. 2015, 63, 333–346. [Google Scholar] [CrossRef]
- Li, Z.X.; Feng, Q.; Wang, Q.J.; Kong, Y.L.; Cheng, A.F.; Song, Y.; Li, Y.G.; Li, J.G.; Guo, X.Y. Contributions of local terrestrial evaporation and transpiration to precipitation using δ18O and D-excess as a proxy in Shiyang inland river basin in China. Glob. Planet. Chang. 2016, 146, 140–151. [Google Scholar] [CrossRef]
- Pu, T.; He, Y.Q.; Zhu, G.F.; Zhang, N.N.; Du, J.K.; Wang, C.F. Characteristics of water stable isotopes and hydrograph separation in Baishui catchment during the wet season in Mt. Yulong region, south western China. Hydrol. Process. 2013, 27, 3641–3648. [Google Scholar] [CrossRef]
- Pu, T.; Qin, D.H.; Kang, S.C.; Niu, H.W.; He, Y.Q.; Wang, S.J. Water isotopes and hydrograph separation in different glacial catchments in the southeast margin of the Tibetan Plateau. Hydrol. Process. 2017, 31, 3810–3826. [Google Scholar] [CrossRef]
- Ala-Aho, P.; Tetzlaff, D.; Mcnamara, J.P.; Laudon, H.; Kormos, P.; Soulsby, C. Modeling the isotopic evolution of snowpack and snowmelt: Testing a spatially distributed parsimonious approach. Water Resour. Res. 2017, 53, 5813–5830. [Google Scholar] [CrossRef]
- Kong, Y.L.; Pang, Z.H. A positive altitude gradient of isotopes in the precipitation over the Tianshan Mountains: Effects of moisture recycling and sub-cloud evaporation. J. Hydrol. 2016, 542, 222–230. [Google Scholar] [CrossRef]
- Kong, Y.L.; Wang, K.; Pu, T.; Shi, X.Y. Non-monsoon precipitation dominates groundwater recharge beneath a monsoon affected glacier in Tibetan Plateau. J. Geophys. Res. Atmos. 2019, 124, 10913–10930. [Google Scholar] [CrossRef]
- Kong, Y.L.; Wang, K.; Li, J.; Pang, Z.H. Stable Isotopes of Precipitation in China: A Consideration of Moisture Sources. Water 2019, 11, 1239. [Google Scholar] [CrossRef] [Green Version]
- Tian, L.D.; Yao, T.D.; Li, Z.; MacClune, K.; Wu, G.J.; Xu, B.Q.; Li, Y.F.; Lu, A.X.; Shen, Y.P. Recent rapid warming trend revealed from the isotopic record in Muztagata ice core, eastern Pamirs. J. Geophys. Res. Atmos. 2006, 111, D13103. [Google Scholar] [CrossRef]
- Pang, H.X.; He, Y.Q.; Theakstone, W.H.; Zhang, D.D. Soluble ionic and oxygen isotopic compositions of a shallow firn profile, Baishui glacier No. 1, southeastern Tibetan Plateau. Ann. Glaciol. 2007, 46, 325–330. [Google Scholar] [CrossRef] [Green Version]
- Yu, W.; Tian, L.; Ma, Y.; Xu, B.; Qu, D. Simultaneous monitoring of stable oxygen isotope composition in water vapour and precipitation over the central Tibetan Plateau. Atmos. Chem. Phys. 2015, 15, 10251–10262. [Google Scholar] [CrossRef] [Green Version]
- Thompson, L.G.; Yao, T.D.; Davis, M.E.; Mosley-Thompson, E.; Wu, G.J.; Porter, S.E.; Xu, B.Q.; Lin, P.N.; Wang, N.L.; Beaudon, E.; et al. Ice core records of climate variability on the Third Pole with emphasis on the Guliya ice cap, western Kunlun Mountains. Quat. Sci. Rev. 2018, 188, 1–14. [Google Scholar] [CrossRef]
- Shi, X.Y.; Risi, C.; Pu, T.; Lacour, J.-L.; Kong, Y.L.; Wang, K.; He, Y.Q.; Xia, D.S. Variability of isotope composition of precipitation in the Southeastern Tibetan Plateau from the synoptic to seasonal time scale. J. Geophys. Res. Atmos. 2020, 125. [Google Scholar] [CrossRef]
- Zhou, S.Q.; Nakawo, M.; Hashimoto, S.; Sakai, A. The effect of refreezing on the isotopic composition of melting snowpack. Hydrol. Process. 2008, 22, 873–882. [Google Scholar] [CrossRef]
- Koeniger, P.; Hubbart, J.A.; Link, T.; Marshall, J.D. Isotopic variation of snow cover and streamflow in response to changes in canopy structure in a snow-dominated mountain catchment. Hydrol. Process. 2008, 22, 557–566. [Google Scholar] [CrossRef]
- Pu, T.; Kong, Y.L.; Wang, S.J.; Shi, X.Y.; Wang, K.; Niu, H.W.; Chen, P. Modification of stable isotopes in snow and related post-depositional processes on a temperate glacier of Mt. Yulong, southeast Tibetan Plateau. J. Hydrol. 2020, 584, 124675. [Google Scholar] [CrossRef]
- Pu, T.; Wang, K.; Kong, Y.L.; Shi, X.Y.; Kang, S.C.; Huang, Y.H.; He, Y.Q.; Wang, S.J.; Jeonghoon, L.; Matthias, C. Observing and modeling the isotopic evolution of snow meltwater on the southeastern Tibetan Plateau. Water Resour. Res. 2020. [Google Scholar] [CrossRef]
- Zhou, S.Q.; Wang, Z.; Joswiak, D.R. From precipitation to runoff: Stable isotopic fractionation effect of glacier melting on a catchment scale. Hydrol. Process. 2014, 28, 3341–3349. [Google Scholar] [CrossRef]
- He, Y.Q.; Theakstone, W.H.; Zhang, Z.L.; Zhang, D.; Yao, T.D.; Chen, T.; Shen, Y.P.; Pang, H.X. Asynchronous Holocene climatic change across China. Quat. Res. 2004, 61, 52–63. [Google Scholar] [CrossRef]
- Niu, H.W.; He, Y.Q.; Zhu, G.F.; Xin, H.J.; Du, J.K.; Pu, T.; Lu, X.X.; Zhao, G.Y. Environmental implications of the snow chemistry from Mt. Yulong, southeastern Tibetan Plateau. Quat. Int. 2013, 313–314, 168–178. [Google Scholar] [CrossRef]
- Du, J.K.; He, Y.Q.; Li, S.; Wang, S.J.; Niu, H.W.; Xin, H.J.; Pu, T. Mass balance and near-surface ice temperature structure of Baishui Glacier No.1 in Mt. Yulong. J. Geogr. Sci. 2013, 23, 668–678. [Google Scholar] [CrossRef]
- Kong, Y.L.; Pang, Z.H. Evaluating the sensitivity of glacier rivers to climate change based on hydrograph separation of discharge. J. Hydrol. 2012, 434–435, 121–129. [Google Scholar] [CrossRef]
- Clark, I.D.; Fritz, P. Environmental Isotopes in Hydrogeology; CRC Press: Boca Raton, FL, USA, 1997. [Google Scholar]
- Taylor, S.; Feng, X.H.; Renshaw, C.E.; Kirchner, J.W. Isotopic evolution of snowmelt 2. Verification and parameterization of a one-dimensional model using laboratory experiments. Water Resour. Res. 2002, 38, 1218. [Google Scholar] [CrossRef] [Green Version]
- Feng, X.H.; Taylor, S.S.; Renshaw, C.E.; Kirchner, J.W. Isotopic evolution of snowmelt 1. A physically based one-dimensional model. Water Resour. Res. 2002, 38, 1217. [Google Scholar] [CrossRef]
- Lee, J.; Feng, X.H.; Faiia, A.M.; Posmentier, E.S.; Kirchner, J.W.; Osterhuber, R.; Taylor, S.S. Isotopic evolution of a seasonal snowcover and its melt by isotopic exchange between liquid water and ice. Chem. Geol. 2010, 270, 126–134. [Google Scholar] [CrossRef]
- Lee, J.; Feng, X.H.; Posmentier, E.S.; Faiia, A.M.; Taylor, S.S. Stable isotopic exchange rate constant between snow and liquid water. Chem. Geol. 2009, 260, 57–62. [Google Scholar] [CrossRef]
- Xin, H.J.; He, Y.Q.; Li, Z.X.; Wang, S.J.; Du, J.K.; Wang, C.F.; Pu, T.; Zhang, W. Inter-Annual Variation of Temperature and Precipitation Gradient at the Eastern Slope of Yulong Snow Mountain. Earth Sci.-J. China Univ. Geosci. 2012, 37, 188–194. [Google Scholar]
- Xin, H.J.; He, Y.Q.; Zhang, T.; Niu, H.Q.; Du, J.K. The features of climate variation and glacier response in Mt. Yulong, southeastern Tibetan Plateau. Adv. Earth Sci. 2013, 28, 1257–1268, (In Chinese, English abstract). [Google Scholar]
- Xu, K.P.; Zhong, L.; Ma, Y.M.; Zou, M.J.; Huang, Z.Y. A study on the water vapor transport trend and water vapor source of the Tibetan Plateau. Theor. Appl. Climatol. 2020, 140, 1031–1042. [Google Scholar] [CrossRef]
Figure 1.
Maps showing the study area (a) and sampling sites (b).

Figure 2.
Isotopic profiles of snow sampled in different months in 2008 and 2009 (S1—November 2008, S2—December 2008, S3—January 2009, S4—March 2009, S5—April 2009, S6—June 2009, S7—July 2009).
Figure 2.
Isotopic profiles of snow sampled in different months in 2008 and 2009 (S1—November 2008, S2—December 2008, S3—January 2009, S4—March 2009, S5—April 2009, S6—June 2009, S7—July 2009).

Figure 3.
Isotopic profiles of snow sampled in April 2009 (S5), April 2012 (S8) and April 2017 (S9) (the data for S8 are from Pu et al., 2020a, while the data for S5 and S8 are from this study).
Figure 3.
Isotopic profiles of snow sampled in April 2009 (S5), April 2012 (S8) and April 2017 (S9) (the data for S8 are from Pu et al., 2020a, while the data for S5 and S8 are from this study).

Figure 4.
The monthly temperature variation at 4800 m a.s.l in the Mt. Yulong region in 2008/2009.

Figure 5.
The figures of integrated vapor flux from the ground to 300 hpa from NCEP/NCAR reanalysis data over the study area during the non-monsoon period of 2008/2009, 2011/2012 and 2016/2017.
Figure 5.
The figures of integrated vapor flux from the ground to 300 hpa from NCEP/NCAR reanalysis data over the study area during the non-monsoon period of 2008/2009, 2011/2012 and 2016/2017.

Figure 6.
The annual average temperature and precipitation at 2400 m a.s.l. of the Mt. Yulong region during 1951–2018.
Figure 6.
The annual average temperature and precipitation at 2400 m a.s.l. of the Mt. Yulong region during 1951–2018.


Table 1.
The statistics of δ18O of snow samples in different snowpack (Ave—average value, Max—maximum, Min—minimum. The data for S8 are from Pu et al., 2020a, and other data are from this study).
Table 1.
The statistics of δ18O of snow samples in different snowpack (Ave—average value, Max—maximum, Min—minimum. The data for S8 are from Pu et al., 2020a, and other data are from this study).
| Year | Snowpack ID | Sampling Data | Sampling Altitude (m a.s.l.) | Depth(m) | Number of Samples | Ave (‰) | Max (‰) | Min (‰) |
|---|---|---|---|---|---|---|---|---|
| 2008 | S1 | 2008-11-9 | 4800 | 1.7 | 17 | −19.0 | −12.8 | −26.7 |
| 2008 | S2 | 2008-12-9 | 4800 | 1.5 | 15 | −18.7 | −13.8 | −26.6 |
| 2009 | S3 | 2009-1-8 | 4800 | 1.3 | 13 | −19.0 | −12.9 | −27.0 |
| 2009 | S4 | 2009-3-19 | 4800 | 2.6 | 26 | −13.9 | −0.7 | −27.0 |
| 2009 | S5 | 2009-4-17 | 4800 | 3.1 | 31 | −12.6 | −3.6 | −26.5 |
| 2009 | S6 | 2009-6-17 | 4800 | 2.6 | 26 | −11.4 | −6.0 | −13.8 |
| 2009 | S7 | 2009-7-3 | 4800 | 0.6 | 6 | −14.0 | −12.7 | −15.1 |
| 2012 | S8 | 2012-4-21 | 4680 | 3.3 | 33 | −12.4 | −1.4 | −20.2 |
| 2017 | S9 | 2017-4-19 | 4680 | 3.1 | 31 | −8.9 | −2.3 | −26.6 |
Publisher’s Note: MDPI stays neutral with regard to jurisdictional claims in published maps and institutional affiliations. |
© 2020 by the authors. Licensee MDPI, Basel, Switzerland. This article is an open access article distributed under the terms and conditions of the Creative Commons Attribution (CC BY) license (http://creativecommons.org/licenses/by/4.0/).
Share and Cite
MDPI and ACS Style
Pu, T.; Chen, P.; Wang, S.; Shi, X.; Tripathee, L. Isotopic Evolution in Snowpacks from a Typical Temperate Glacier in the South-Asia Monsoon Region. Water 2020, 12, 3402. https://doi.org/10.3390/w12123402
AMA Style
Pu T, Chen P, Wang S, Shi X, Tripathee L. Isotopic Evolution in Snowpacks from a Typical Temperate Glacier in the South-Asia Monsoon Region. Water. 2020; 12(12):3402. https://doi.org/10.3390/w12123402
Chicago/Turabian StylePu, Tao, Pengfei Chen, Shijin Wang, Xiaoyi Shi, and Lekhendra Tripathee. 2020. "Isotopic Evolution in Snowpacks from a Typical Temperate Glacier in the South-Asia Monsoon Region" Water 12, no. 12: 3402. https://doi.org/10.3390/w12123402
Note that from the first issue of 2016, this journal uses article numbers instead of page numbers. See further details here.