A Numerical Simulation of Membrane Distillation Treatment of Mine Drainage by Computational Fluid Dynamics

1
School of Chemical & Environmental Engineering, China University of Mining & Technology, Beijing 100083, China
2
State Key Laboratory of Water Resource Protection and Utilization in Coal Mining, China Energy Investment Corporation, Beijing 100011, China
*
Author to whom correspondence should be addressed.
Water 2020, 12(12), 3403; https://doi.org/10.3390/w12123403
Submission received: 13 October 2020
/
Revised: 12 November 2020
/
Accepted: 30 November 2020
/
Published: 3 December 2020
(This article belongs to the Special Issue Membrane Technologies and Water Treatment)
Abstract
:Membrane distillation (MD) is a promising technology to treat mine water. This work aims to investigate the change in mass and heat transfer in reverse osmosis mine water treatment by vacuum membrane distillation (VMD). A 3D computational fluid dynamics (CFD) model was carried out using COMSOL Multiphysics and verified by the experimental results. Then, response Surface Methodology (RSM) was used to explore the effects of various parameters on the permeate flux and heat transfer efficiency. In terms of the influence degree on the permeation flux, the vacuum pressure > feed temperature > membrane length > feed temperature membrane length, and the membrane length has a negative correlation with the membrane flux. Increasing the feed temperature can also increase the convective heat transfer at the feed side, which will affect the heat transfer efficiency. Furthermore, the feed temperature also has a critical effect on the temperature polarization phenomenon. The temperature polarization becomes more notable at high temperatures.
1. Introduction
The western region is the main coal production area in China with production accounting for about 77% of the country’s total [1]. However, this region is short of water resources, accounting for only 7.9% of the national coal production in China [2]. Coal mining must be accompanied by the production of mine water, but according to statistics, the utilization rate of mine water is less than 30% [3]. The salt content of mine water in Western China is high; direct discharge will cause environmental pollution, soil salinization, and waste of water resources [4], although the reverse osmosis treatment of mine water has comprehensive advantages in wastewater quality, power consumption, desalination efficiency, and land use. Nevertheless, the current ecological civilization construction puts forward higher requirements for the utilization of mine water. New coal mines in some areas need to achieve zero liquid discharge (ZLD). As a heat-driven membrane separation process, membrane distillation (MD) has a wide range of applications in industry, such as seawater desalination, the concentration of chemical products and recycling of industrial wastewater [5,6]. Compared with other separation technologies, MD has lower requirements for heat source quality, so it can be combined with abundant solar energy and industrial waste heat resources in mining areas. Besides, the content of organic content in the mine water is low, reducing the risk of membrane wetting. Therefore, MD can be used for the secondary treatment of reverse osmosis concentrated mine water to achieve higher recovery efficiency and ZLD.
There are four main types of MD configuration: VMD, direct contact membrane distillation (DCMD), sweeping gas membrane distillation (SGMD), and air gap membrane distillation (AGMD). Among the four types of MD configuration, VMD has attracted more attention due to its weak electrical resistance and relatively high permeation flux [7,8]. Additionally, VMD can better reduce the temperature polarization coefficient (TPC) and the possibility of membrane pore wetting due to the application of a vacuum on the permeate side [9].
Although the MD has many attractive features, there are still some challenges that hinder its wider application. The main challenges are continuous treatment of high-concentration wastewater, which will cause a significant reduction in flux, and uneven distribution of internal fluids and TPC [10,11]. CFD can provide an effective method to analyze the characteristics of mass and heat transfer and dynamic behavior during various complex operations [12,13]. Tang et al. [14] applied CFD simulation to the VMD process. The author simplified the membrane module into a two-dimensional structure of fiber and regarded the VMD process as a multiphase flow process, and simulated the effects of feed temperature and flow rate on membrane flux. Milad Shokrollahi et al. [15] used response surface optimization and CFD exploration to explore the influence of different parameters on the thermal efficiency and flux of DCMD and find the best parameters. Liu et al. [16] has constructed a series of 3D simulation modules with 23 fibers to study the effect of fiber arrangement on the VMD process of the cross-flow hollow fiber. The phase transition process is considered in the simulation process. Ahmad s. alsaadi et al. [17]. established a three-dimensional CFD model by COMSOL multiphysics, and predicted the permeation flux and interfacial temperature of naphthol blue-black dye aqueous solution by VMD.
The structure and geometry of the membrane module are the same as the operating conditions, which have an important influence on the operation process of MD. Ho et al. [18] applied the rough surface flow channel to improve the performance of countercurrent DCMD to 42%. Zhengfei Kuang et al. [19] systematically studied the effect of additional baffles on the feed and permeation channel shells on DCMD under laminar flow and turbulent flow and found that structural modification can promote TPC and suppress concentration polarization. However, the storage of the baffle also adds additional energy consumption.
In some previous studies, the change in feed concentration in the flow process has often been ignored. However, the high salt content of reverse osmosis mine water will affect the part of the vapor pressure difference, thus affecting the transmembrane mass flux. Hence, it is necessary to study the change in TPC and mass transfer coefficient when VMD is used to treat reverse osmosis mine water. A mass transfer and heat transfer model suitable for reverse osmosis mine water system was established. Since different parameters will affect the operation of MD, the RSM was used to study the interaction between each factor and its influence on TPC, transmembrane flux, and thermal efficiency. The purpose of this work is to explore the phenomenon of mass transfer and heat transfer in VMD treatment of mine water and to provide a theoretical basis for the industrial treatment of reverse osmosis mine water.
2. Theory
2.1. Governing Theory
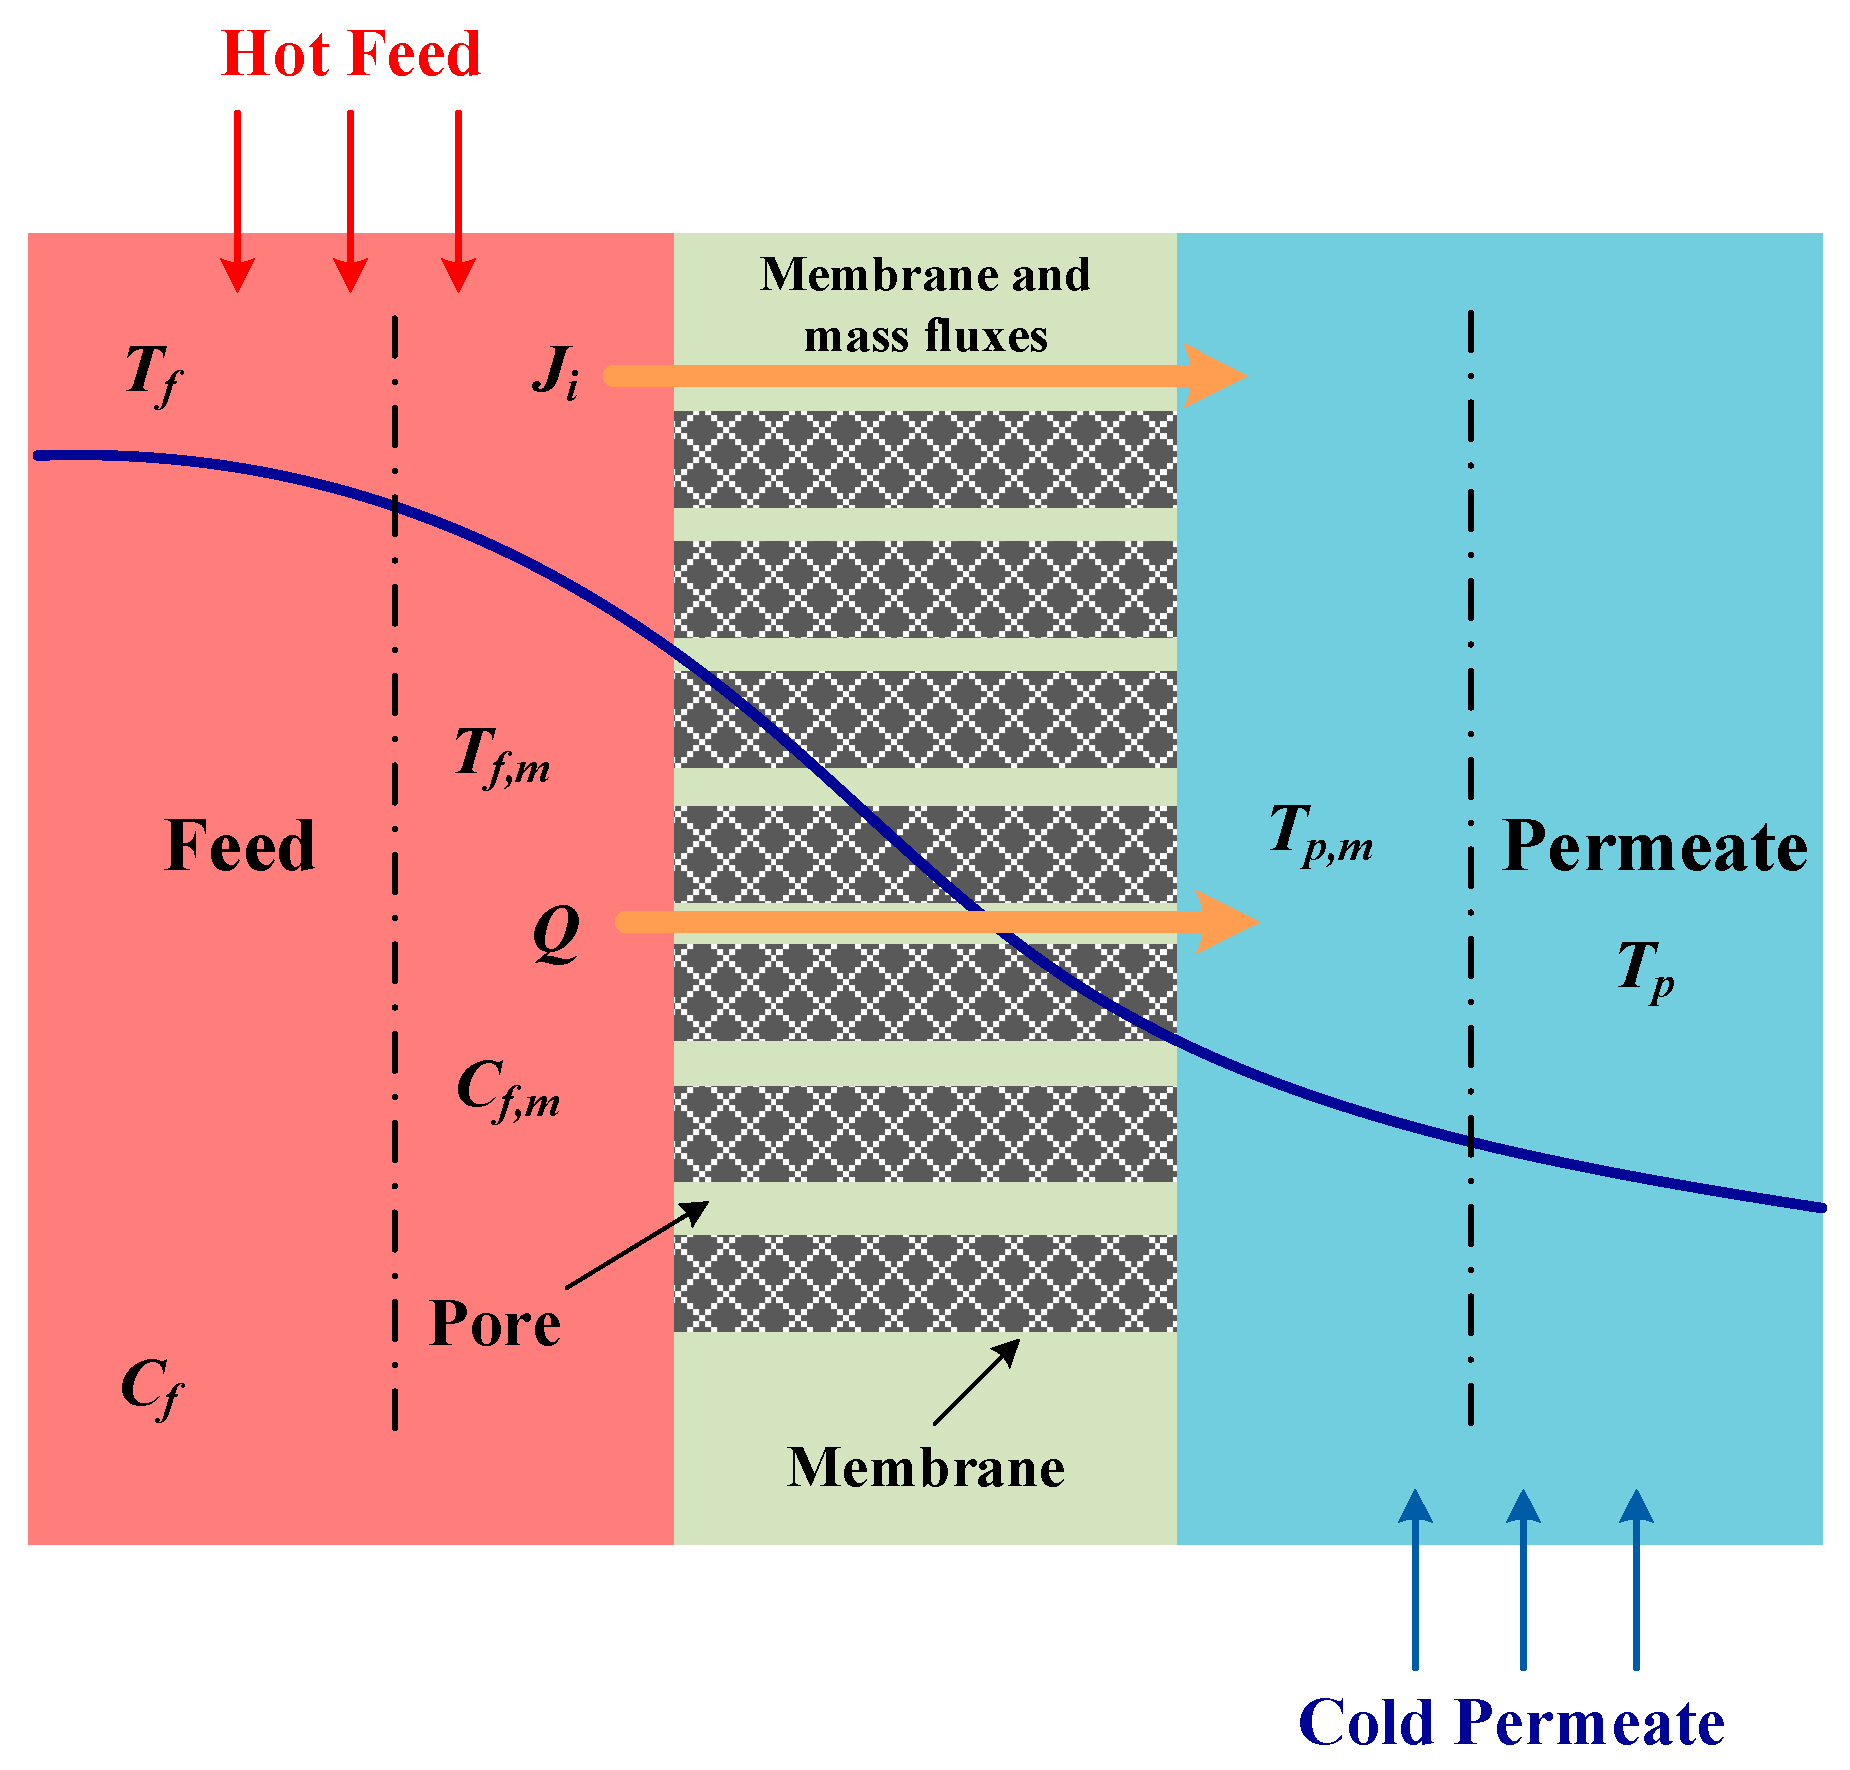
MD is a complex process in which mass transfer and heat transport occur simultaneously and interact with each other. As shown in Figure 1, the main transportation process is generally divided into three parts: (1) The feed evaporates on the surface of the membrane; (2) Water vapor transports across the membrane under the local vapor pressure difference; (3) Water vapor is pumped out on the permeate side and condenses in the condensation chamber [20]. The equations of energy, momentum, and mass must be solved simultaneously throughout the fluid dynamics process. Therefore, under the laminar heat transfer process, the overall govern transport equation of the feed side, permeate side, and membrane are expressed as follows [21,22]
The continuity equation is
the energy conservation equation is
and the momentum transport equation is
Among them, Sm, Sh, Sv represent the quantitative changes in energy, momentum, and mass in the system, respectively. Table 1 summarizes the expression of the source term in the MD operation. It is worth noting that the source term may reflect a decrease in momentum, mass, and energy (at the feed membrane interface) or gain (at the permeable membrane interface) [23].
2.2. Mass Transfer
The permeate flux of MD can be calculated by the vapor pressure difference across the membrane
where KM represents the membrane distillation coefficient, and and and represents the vapor pressure at the feed membrane interface and the vacuum pressure at the membrane permeation side, respectively. In MD operation, transmembrane mass transfer is the material transfer process of vapor molecules in porous media. There are three basic mechanisms: Knudsen flow, viscous flow, and molecular diffusion [24,25,26]. Hence, the actual mass transfer process in the MD process can be judged by the specific value of the Knudsen number (Kn). Kn can be defined as the ratio of the mean free path of water vapor to the pore size [27]
The mean free path of water molecules can be described as
where T, KB, and P are the average temperatures, and the Boltzmann constants and the absolute pressure (about 0.01 MPa) in the membrane pores, is the collision diameter (water vapor is 2.641 × 10⁻¹⁰ m). When Kn > 1, the influence of the pore radius dominates due to the collision of diffusion molecules with the membrane pore wall, which can be solved by the Knudsen diffusion mechanism. When Kn < 0.01, the mass transfer resistance is primarily the collision between diffusion molecules, and the pore radius has little effect, so the transmembrane mass transfer process is considered to be a molecular diffusion mechanism. When 0.01 < Kn < 1, the mass transfer is combined with the molecular diffusion mechanism and Knudsen diffusion [28,29].
In this experiment, the hollow fiber membranes of PVDF were explored. According to formulas (9), the mean free path (λ) of water vapor molecules is in the range of 0.24–0.35 μm. Therefore, the control mechanism in the mass transfer process is dominated by Knudsen diffusion, and KM can be expressed by the following formula [30]
where r represents the average pore size, is the porosity, is the membrane thickness, and is the tortuosity factor; η is the viscosity of the gas passing through the membrane pores (1.13 × 10⁻⁵ Pa s); R is the gas universal constant (8.31 J mol−1K−1), is the mean temperature across the membrane surfaces, and is the average pressure in the pores.
The saturated vapor pressure of pure water on the feed side can be obtained by the Antoine equation [31]
However, since the reverse osmosis mine water contains a large non-volatile substance, such components will affect the water activity. Additionally, because the content of Na + and Cl− in reverse osmosis mine water is higher than other ions, it is calculated as sodium chloride aqueous solution based on the NaCl concentration in reverse osmosis mine water (3 kg/L), and its water vapor partial pressure can be described by the following formula
The activity coefficient of water at different concentrations can be expressed by the following formula [32,33]
where is the mole fraction of sodium chloride, which can be calculated according to the mass concentration of feed solution
When the concentration of salt is high, the membrane permeability intercepts some macromolecules in the feed liquid and forms a mass transfer boundary layer on the feed side, resulting in the concentration gradient on the membrane forming concentration polarization. The appearance of concentration polarization has a significant effect on the whole mass transmission process. The concentration polarization coefficient (CPC) can be expressed by
During the experiment, the flow state of the feed liquid in the hollow fiber tube was laminar, and Kf can be calculated by the following formula
where is Sherwood number, represents Reynolds number, is Schmidt number.
DAB is the diffusion coefficient of the salt from the main body of the feed liquid to the membrane surface, and its relationship with temperature is
2.3. Heat Transfer
As shown in Figure 1, MD is a heat-driven process, and its heat transfer can be divided into three steps:
- (1)
- Heat flows from the main body of the feed liquid through the thermal boundary layer to the surface of the membrane by natural convectionwhere is the local heat transfer coefficient of the feed liquid; is the main body temperature of the feed liquid; is the membrane surface temperature on the feed side.where hf is the local heat transfer coefficient;
- (2)
- Heat passes through the membrane in two ways: latent heat of vaporization and heat conduction:
At different temperatures, the latent heat of vaporization of water vapor is shown in Equation (24)
where kM is the average thermal conductivity of the membrane; ε represents the porosity of the membrane, kg is the thermal conductivity of gas molecules, and ks is the thermal conductivity of the polymer material.
However, due to the low thermal conductivity of the VMD, this part of the membrane conduction heat can be ignored.
The vaporized steam on the hot side condenses on the permeate side:
Due to the existence of the thermal boundary layer on the membrane surface, temperature polarization will occur during the MD operation. TPC is expressed as the ratio of the temperature of the membrane surface on the feed fluid side to the temperature of the feed fluid body. The TPC value is close to 1, which means that the surface temperature is similar to that of the feed liquid body, and the influence of temperature polarization is small. TPC value close to 0 indicates that the temperature of the membrane surface is quite different from that of the feed liquid body and the temperature polarization effect is great [34,35].
Thermal efficiency is the ratio of the heat transferred through the transmembrane water vapor to the total heat transferred. The calculation formula is shown in Equation (31)
3. CFD Model Formation
3.1. Geometry and Mesh
This experiment utilized COMSOL Multiphysics 5.5 to establish a detailed 3D model to simulate and discuss the mass and heat transfer phenomena during the VMD experiment. The model for the momentum, energy and quality, three modes of transport phenomena, have been considered. The model consists of a feed channel on the shell side, a permeate channel, and a membrane module between them. The membrane used in this test was PVDF hollow fiber membranes. Table 2 lists all the parameters of different membrane modules and membranes. During operation, the feed liquid can flow either in the module or in fibers. However, some of the literature indicated that due to the uneven distribution of fibers, a greater flux can be obtained by the flow of the liquid in the fibers [36,37]. Therefore, the feed liquid flowed in the fiber during the experiment and simulation, and the vacuum pump was used for vacuum processing outside the module. Besides this, the physical parameters of each membrane fiber in the module are all the same, and the physical parameters of material and liquid entering each membrane fiber are also the same. Because of the universality of the model and the reduction in calculation burden, the calculation domain model of membrane fiber only selects the internal flow space of one membrane fiber. All assumptions in the modeling are specified as follows:
- (1)
- Steady-state operation;
- (2)
- Both the feed side and the permeate side are incompressible flow, laminar flow model;
- (3)
- The membrane has a 100% rejection rate of the feed liquid, and the removal rate of the precipitate from the membrane surface is ignored;
- (4)
- No chemical reaction;
- (5)
- No heat loss to the open environment.
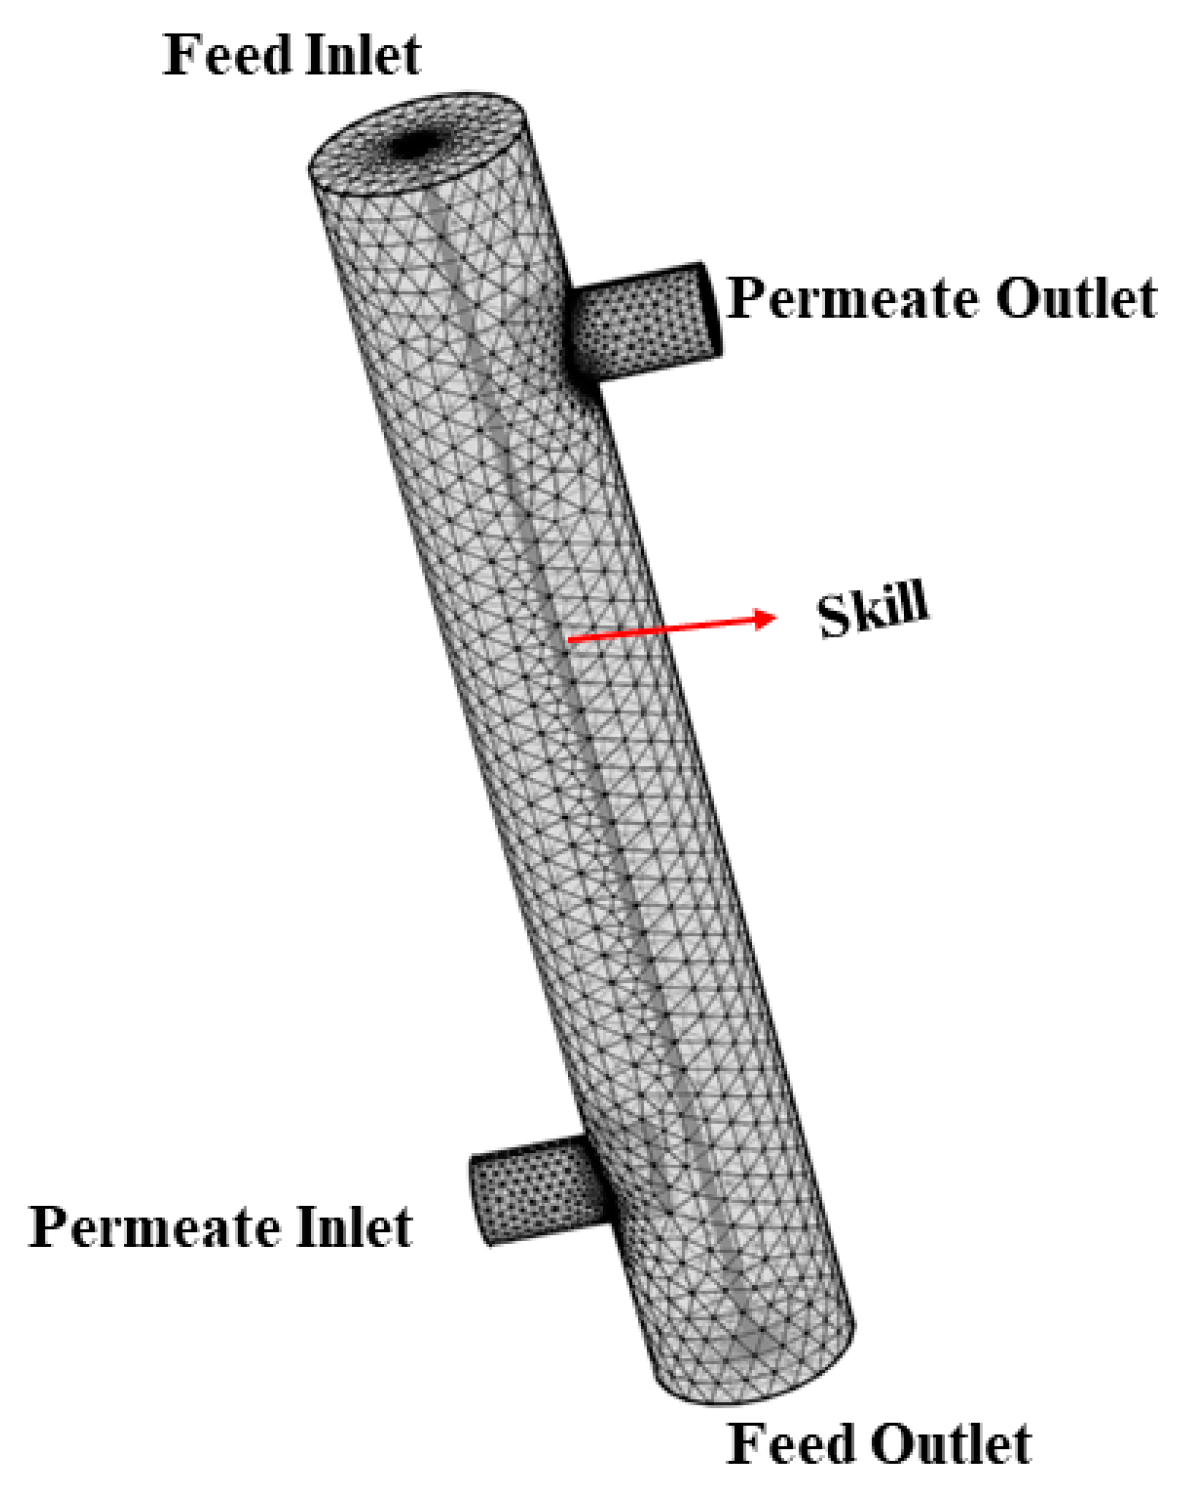
Before solving the complex governing equations, it is necessary to discretize the governing equations in the spatial domain so that the solution domain is approximately a discrete domain composed of finite elements with different sizes and shapes and connected. This process is called finite element network partition. The meshing of the 3D model was implemented by the physical field control mechanism, and on this basis, the fluid area was as refined as possible, thereby eliminating the error between simulation and actual experiment. The first layer of mesh inflations with a thickness of 1 × 10⁻⁵ m was selected as the liquid–film interface between the lumen and the shell side to ensure that the temperature polarization phenomena occur in the area with higher mesh resolution. Besides, the grid is also tested for independence to check the quality of the grid. Figure 2 shows the 3D model and the grid division, there are 761,471 grids in total.
3.2. Boundary Conditions
All feed inlet and outlet boundaries were set according to the conditions given in Table 3. The inlets of the feed and permeate section were set as the velocity inlet. The outlet boundaries of the feed section and permeate section were set as the pressure outlet. The feed boundary is open to atmospheric pressure and a certain vacuum value is set at the outlet pressure of the permeate side. Furthermore, the feed and permeate sides were set as fluid domains. The outer surface of the membrane module was set as the smooth wall without slippage, and the internal interface boundary was set as a conjugate heat transfer boundary.
3.3. Design of CFD Simulation
In the experimental inquiry, an experimental design method is an effective approach for analyzing the process, modeling, and optimizing the problem by involving various factors with different possible values [38]. RSM is a set of statistical and mathematical techniques that can help design, model, and analyze problems whose response is affected by multiple variables or factors [39]. In this study, the BBD method, which is one of the RSM methods, was implemented to analyze the impact of key factors (feed temperature, vacuum pressure, membrane length) on the flux and thermal efficiency. The corresponding MD parameters of the design are listed in Table 4. The CFD model results (flux and thermal) of each CFD run were input into the Design-Expert software (Version 8.0.6) to obtain the relationship diagram and analyze the influence of factors.
4. Experiment Method
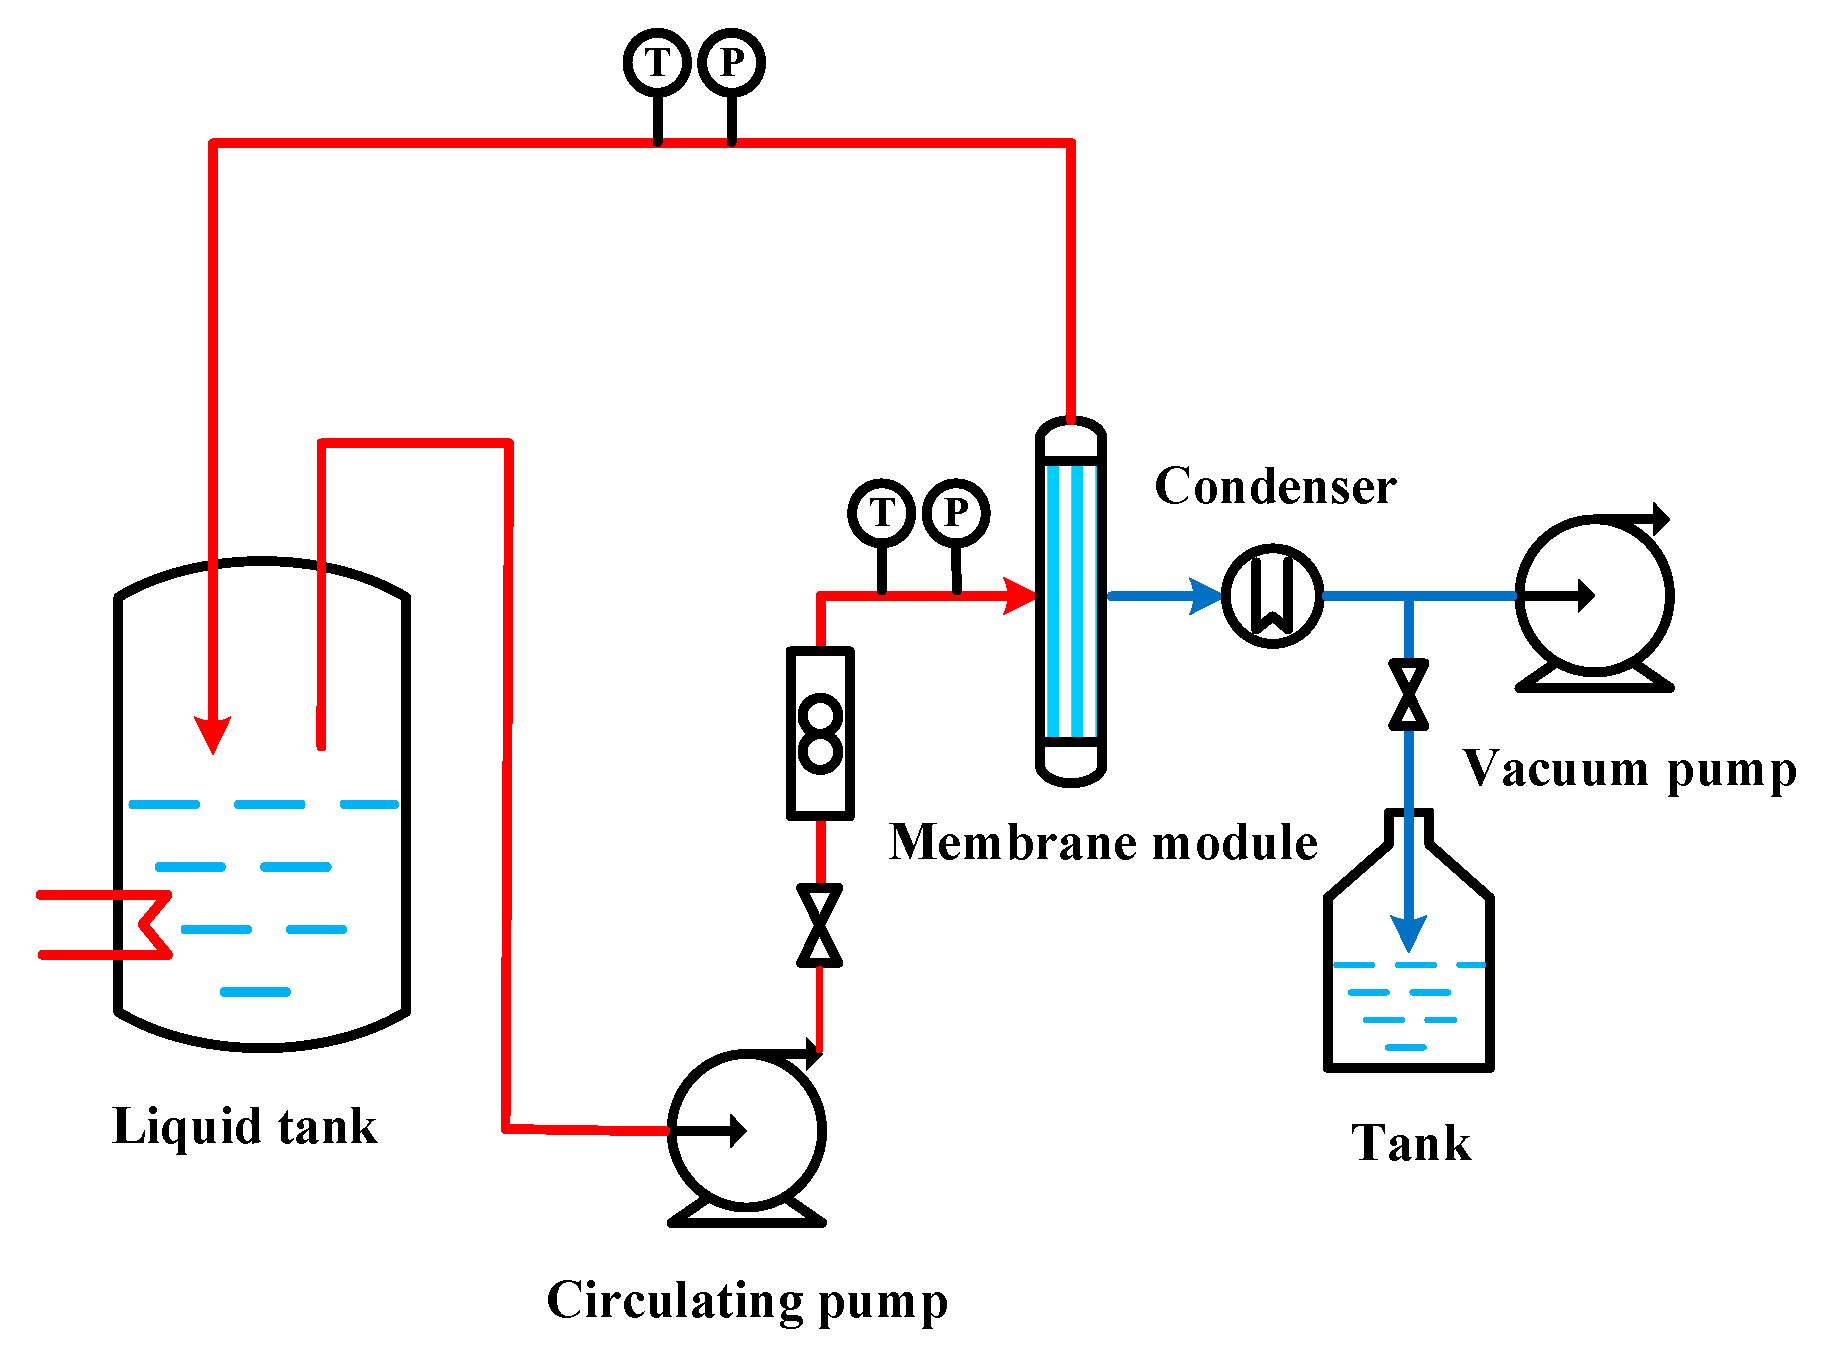
The schematic diagram of the VMD experimental device is shown in Figure 3. In this experiment, the feed solution was prepared by reverse osmosis mine water. The feed solution was first heated by the heating element in the feed liquid tank, and was continuously pumped into the membrane module by a peristaltic pump. Furthermore, the feed flow was adjusted to a preset flow rate through the flow meter. When the feed temperature reached the specified temperature, turning on the vacuum pump maintained the negative pressure state. The condensed product water was finally collected in a water collection tank connected to an electronic balance, which can be used to monitor the weight of the product water. All experimental data were measured under stable conditions. To verify the consistency between the model and the experiment, tests were performed at different feed temperatures (323.15 to 353.15 K) and different vacuum pressures (−0.05 to −0.09 MPa).
5. Results and Discussion
5.1. Model Validation
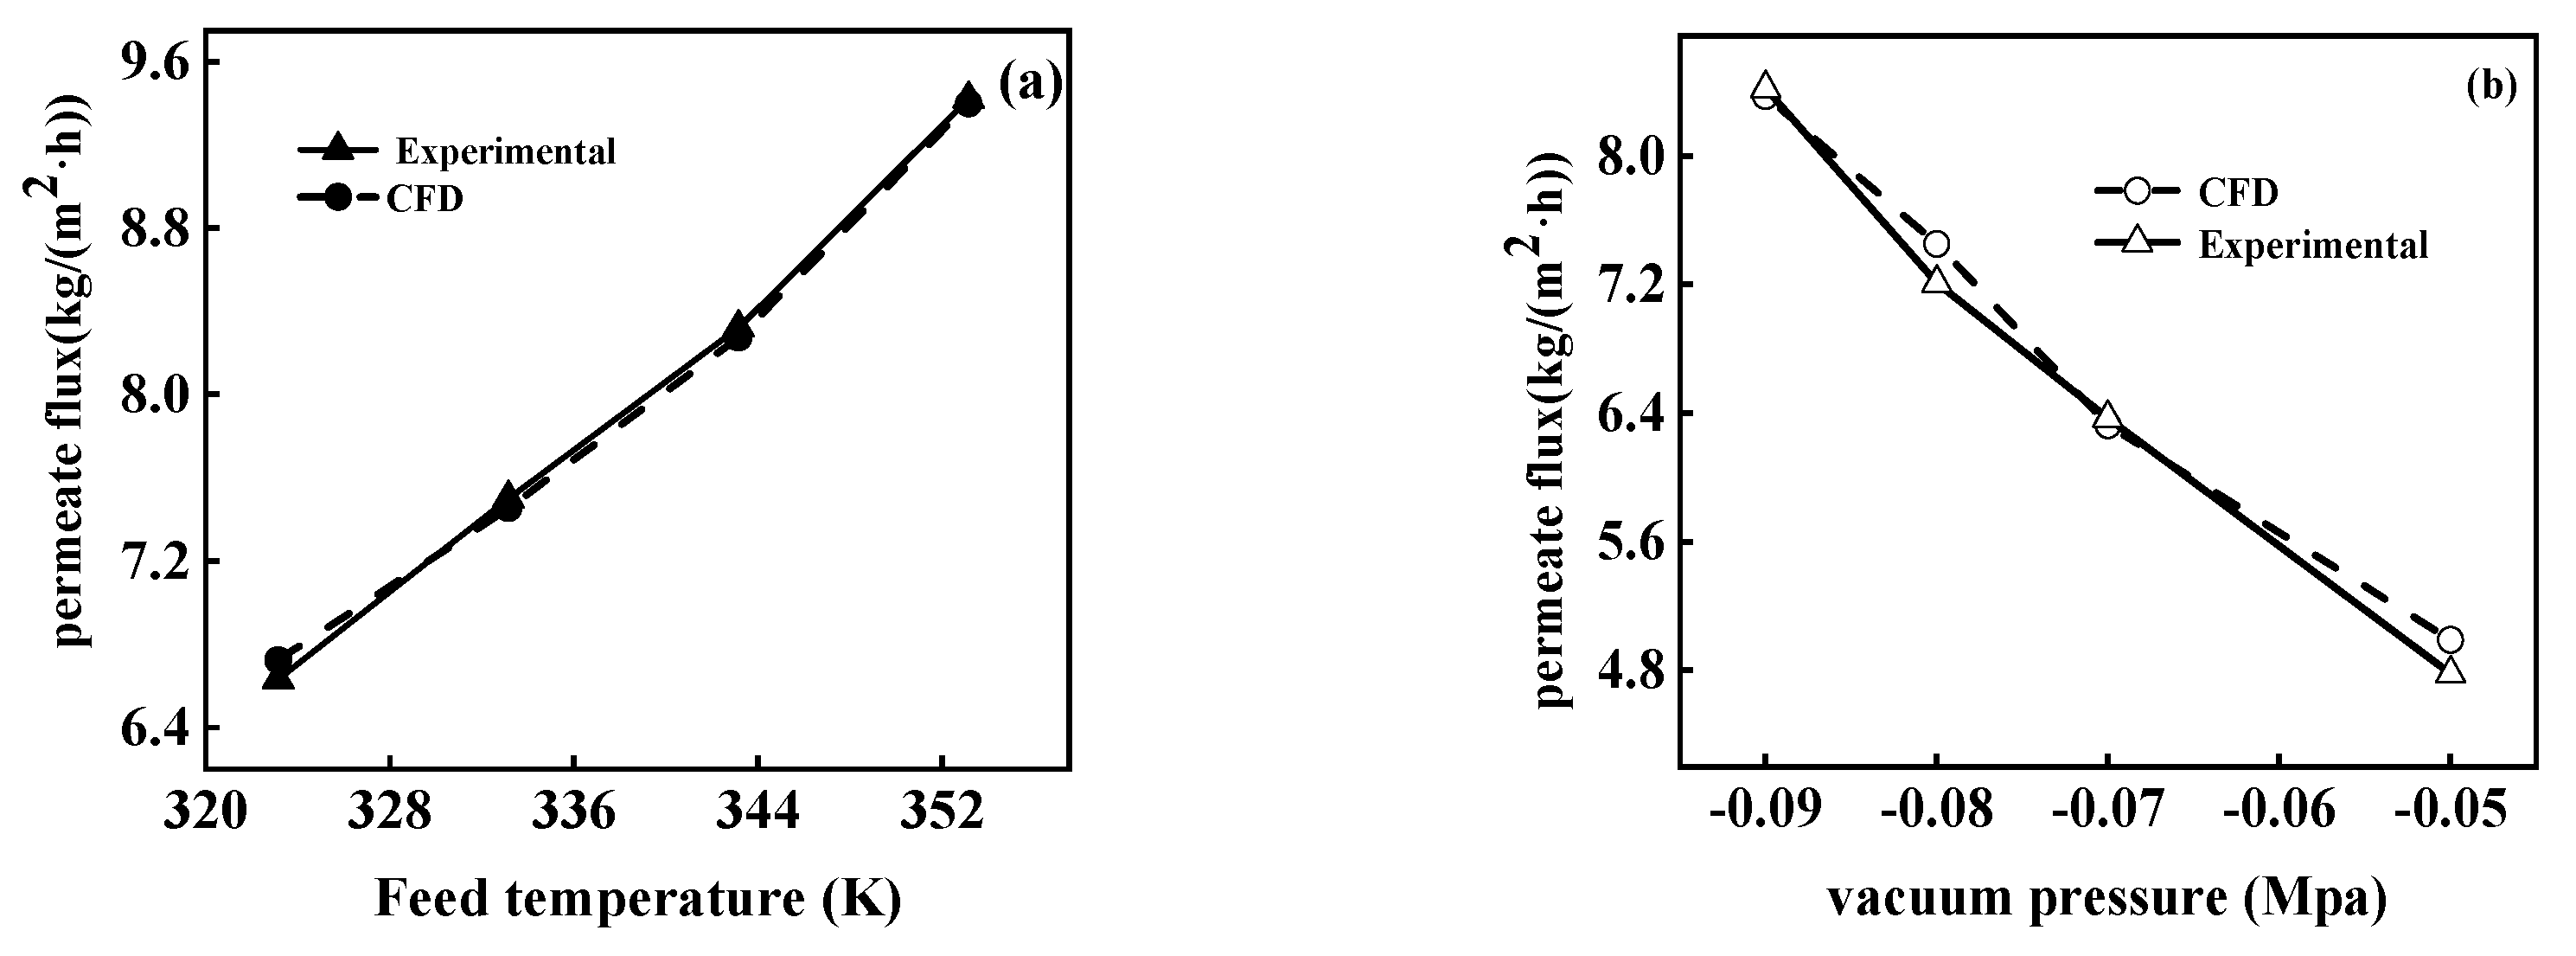
To verify the accuracy of the numerical model, the calculated flux was compared with the experimental flux. The simulated flux under different temperatures and vacuum pressures were consistent with the experimental results; the maximum error did not exceed 1.04% (Figure 4). Therefore, the feasibility of the model was proven. As shown in Figure 4b, with the increase in temperature and vacuum pressure, the permeate flux also shows an inclined trend, which was consistent with the literature report [40,41].
5.2. Mass Transfer in VMD
The permeate flux in CFD simulation based on RSM is presented in Table 5. The p-value < 0.05 in the model indicates that the influencing factors are significantly effective. At the same time, “Sum of Squares” is also an important parameter for model verification. The higher the “Sum of Squares” value of the influencing factors in the model, the greater the impact on the model. It is obvious that individual factors A, B, C, A2, and the interrelated factors AC have a significant influence on flux, but their effects are not the same. B was found to be the most critical factor, and AC has the weakest effect. The following will analyze the impact of each factor to deeply analyze the influence of each factor.
5.2.1. Effect of Membrane Parameters on Flux
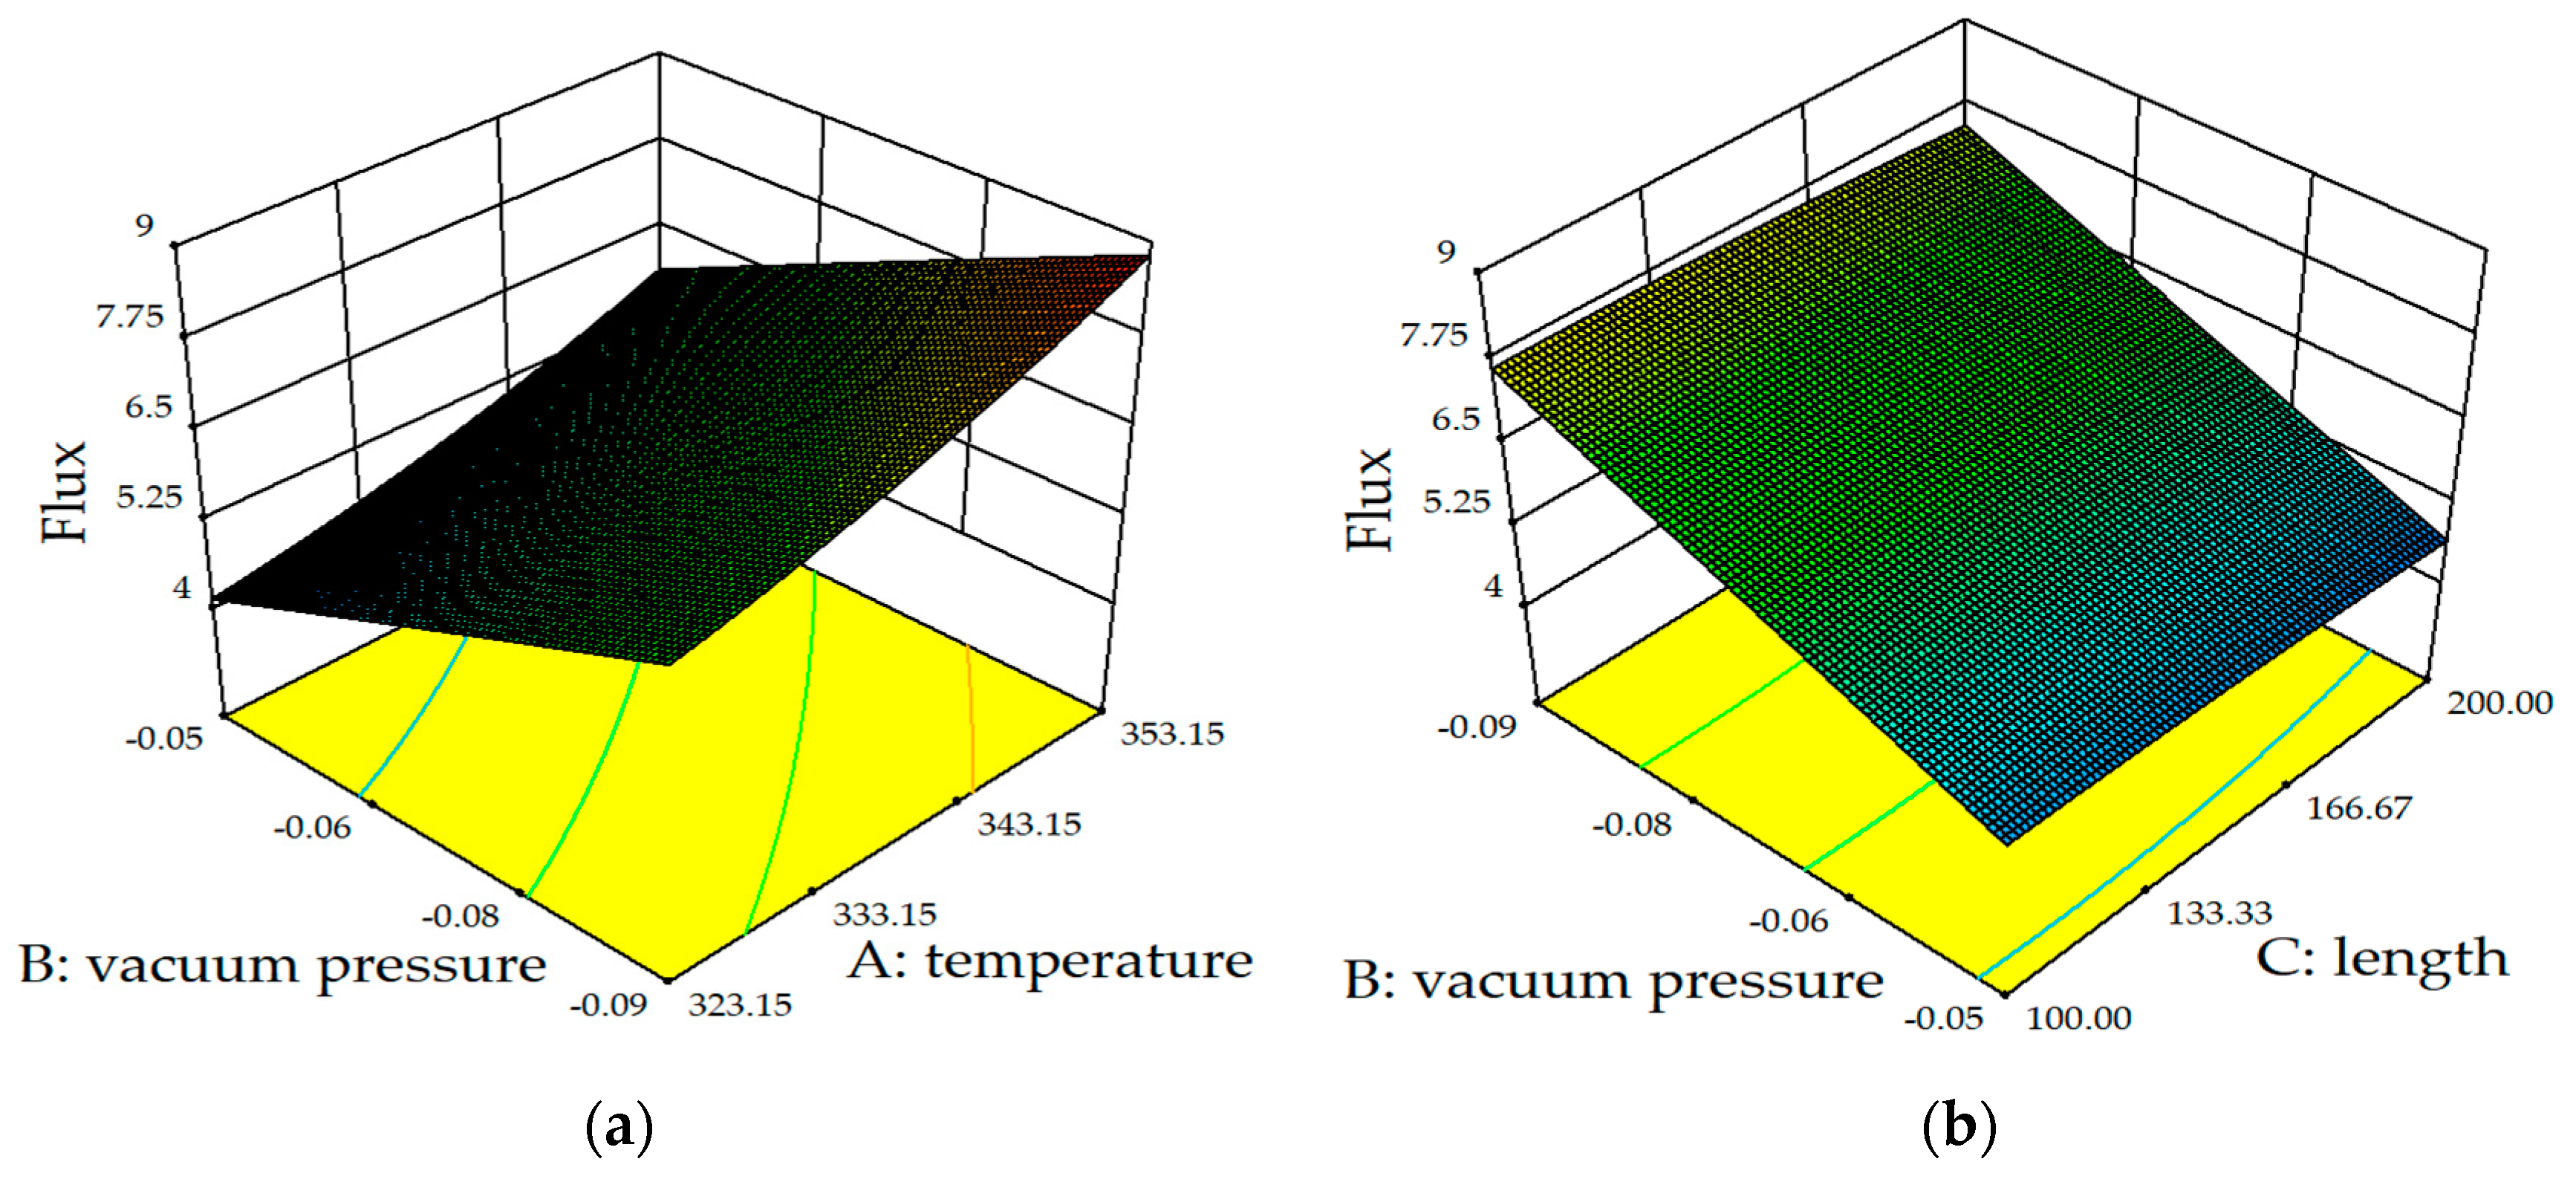
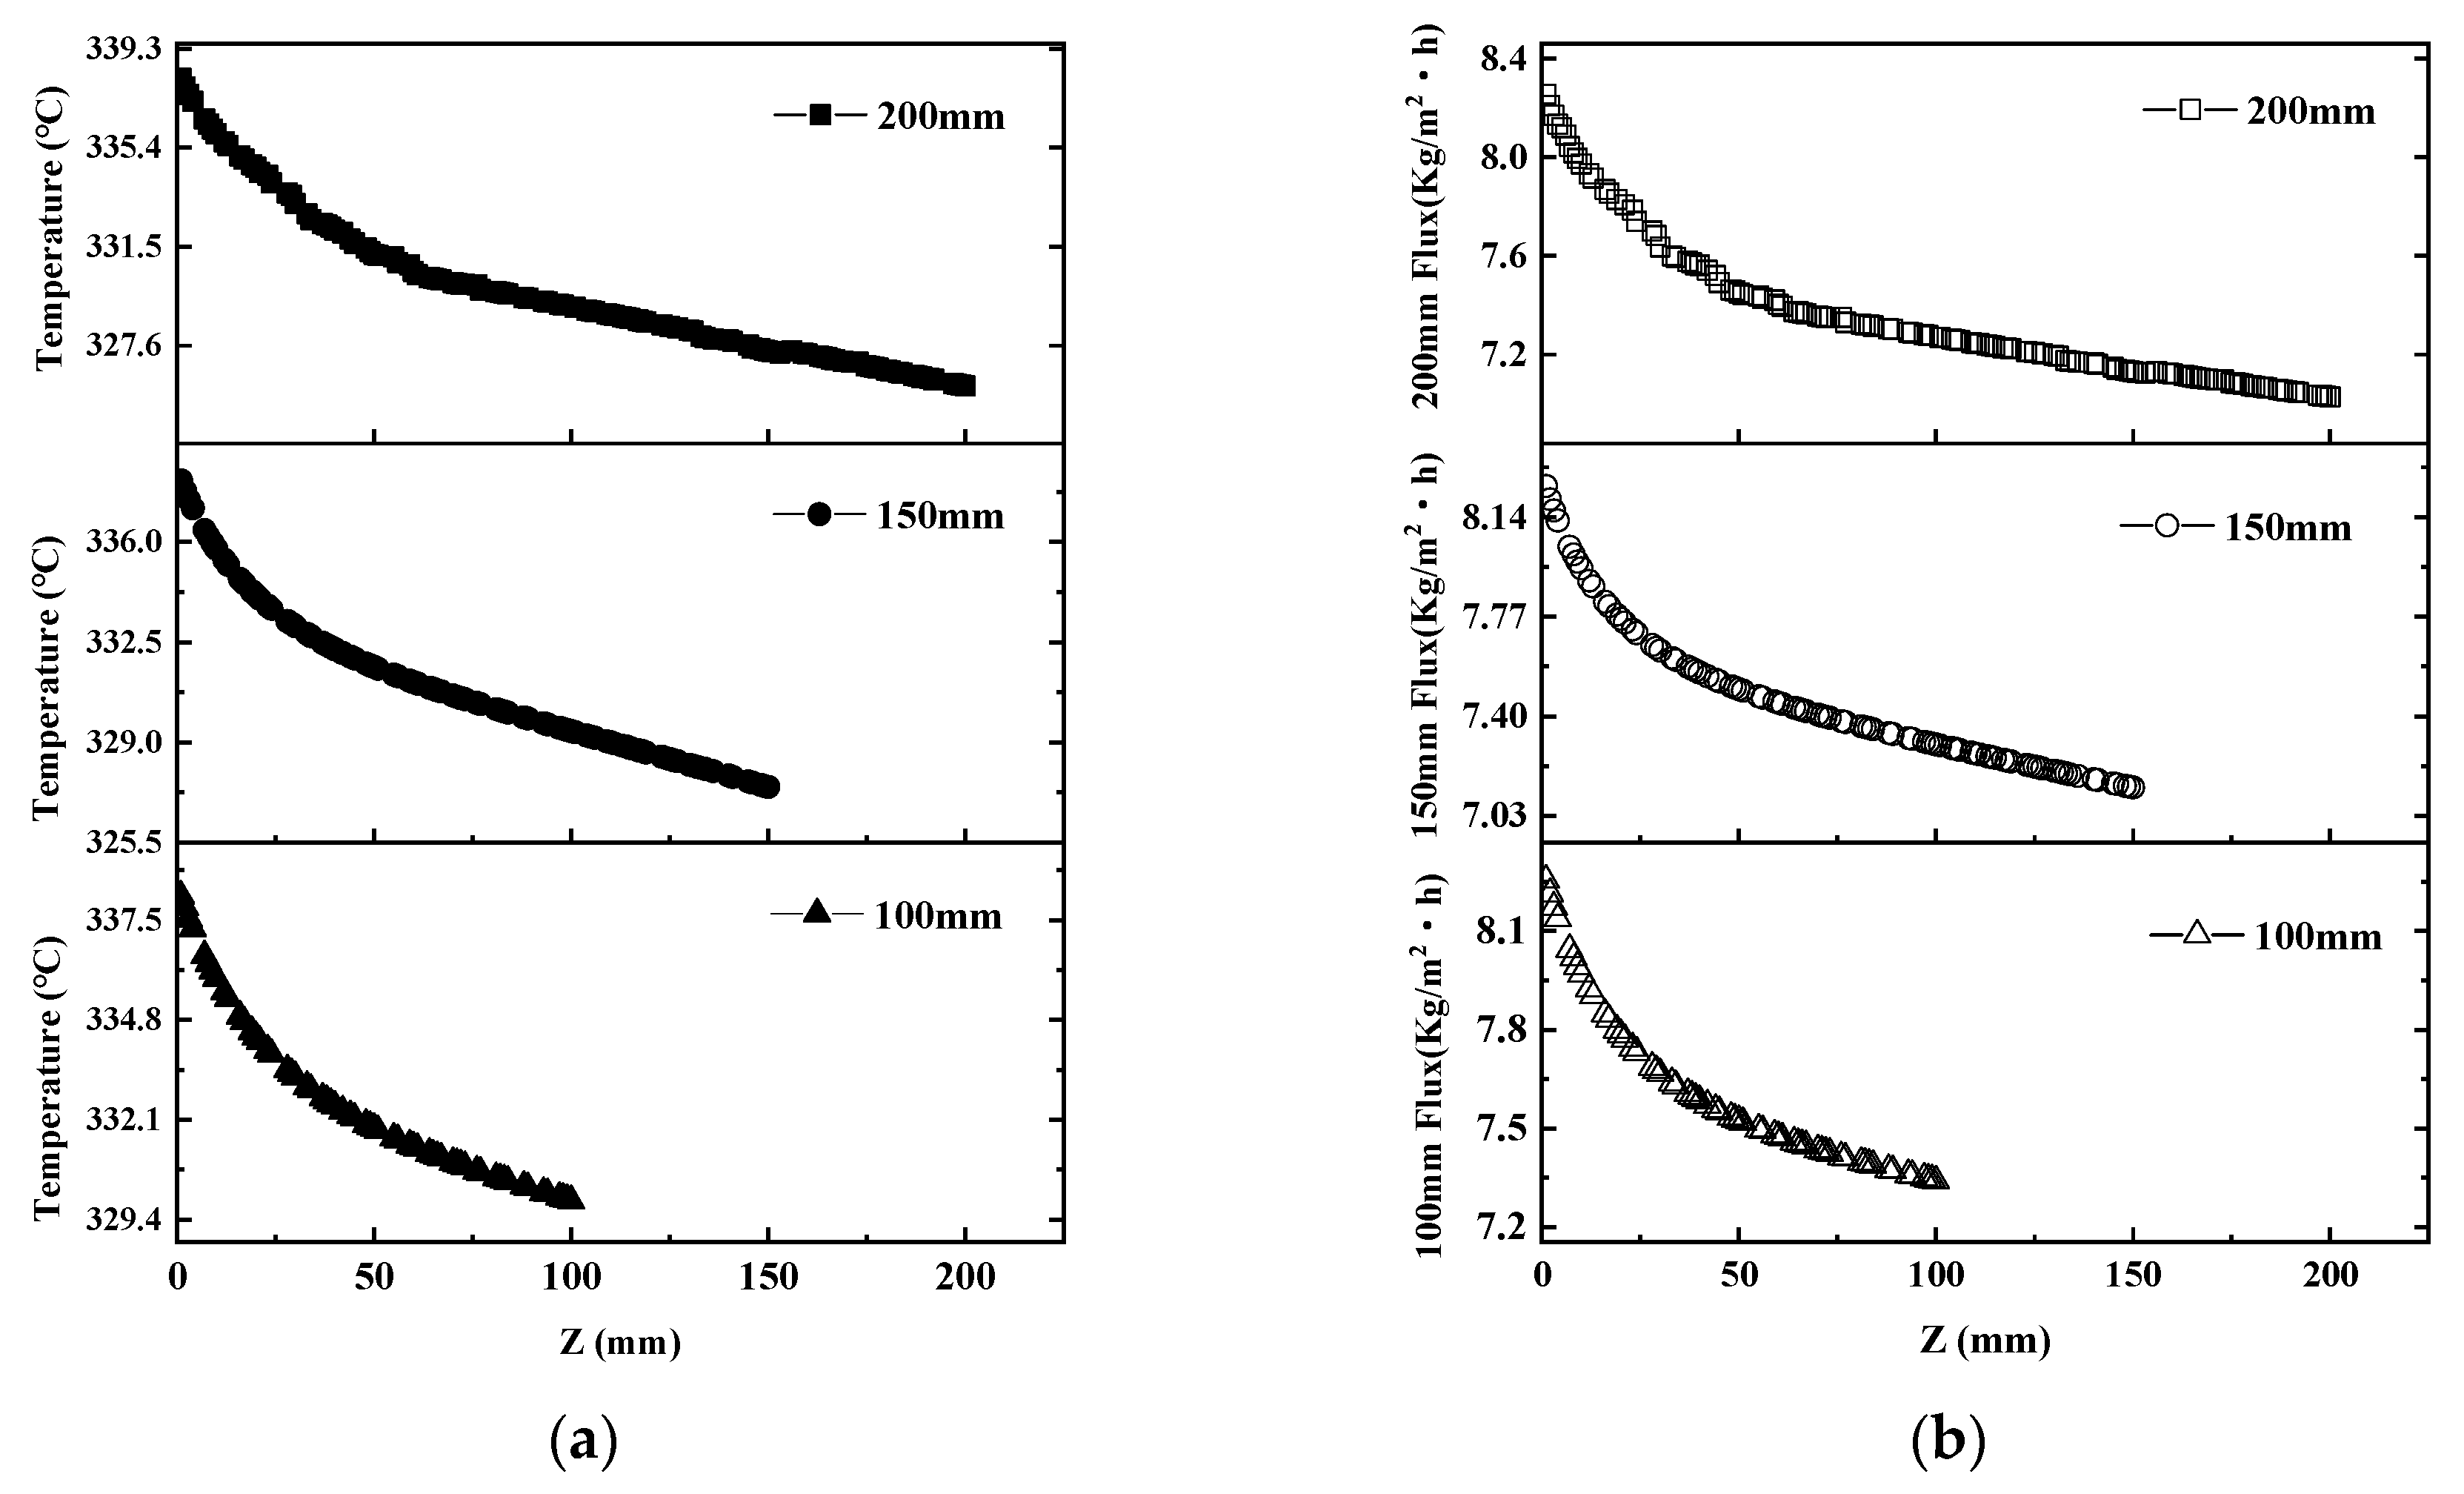
Figure 5 is the 3D contour plots of the interaction between various factors, which helps to understand the permeate flux trend in more detail. Figure 5b shows the flux results of different membrane lengths obtained in the CFD simulation. With the increase in membrane length, the flux continued to decline, but the downward trend was relatively gentle. In Antoine’s equation (Equation (11)), temperature and saturated vapor pressure have an exponential relationship. Thus, during the operation of VMD, when the pressure on the permeate side is kept constant, a higher membrane surface temperature (Tf,m) can provide a more powerful driving force for mass transfer and increase the permeate flux. Figure 6a shows the distribution of membrane surface temperature along the flow direction under different membrane lengths. During operation, due to the continuous evaporation of water vapor, the surface temperature of the membrane continuously decreased from the feed inlet to the outlet region. With the increased length of the membrane, the temperature continued to decline, which leads to the decrease in mass transfer driving force [20]. Figure 6b represents the local flux changes along the length of the membrane. The local permeate flux, along with the fiber, continuously decreased, especially when the length of the membrane was longer. For instance, when the length of the membrane was 100 mm, the local permeation flux at the liquid outlet was 7.34 (kg/m2·h), while when the length of the membrane increased to 200 mm, the final local flux at the outlet dropped to 7.02 (kg/m2·h). Comparing Figure 6, the local permeation flux has the same changing trend as the membrane surface temperature. Thus, a shorter membrane length can produce a more elevated permeate flux in this experiment.
5.2.2. Effect of Operational Factors on Flux
In addition to the characteristics of the membrane itself, operating conditions such as vacuum and feed liquid temperature have a more pronounced effect on flux. From the CFD simulation data (Figure 5a), It is obvious that the permeation flux is positively correlated with the feed temperature. Figure 7a depicts the mass transfer coefficient along the flow direction at different feed temperatures. In this experiment, Knudsen diffusion dominates the transmembrane mass transfer mechanism. It can be seen from Equation (10) that the mass transfer coefficient is associated with the main characteristics of the membrane itself and the membrane surface temperature. Therefore, the mass transfer coefficient and flux increased with the raise in feed liquid temperature, so the curves in the two graphs exhibited the same trend. Besides, the local permeate flux showed an L-shaped downward trend at various temperatures. However, when the feed temperature was 323 K, the L-shaped gradually became moderate. Zhang Yonggang et al. [20] obtained an identical tendency when using hollow fiber membranes to run VMD.
Vacuum pressure has the greatest impact on flux. It can be seen from Figure 5b that under the condition of 150 mm membrane length and 353.15 K feed temperature, with the increase in vacuum pressure from −0.05 to −0.09 MPa, the permeate flux increased from 4.09 to 8.85 (kg/m2·h), showing an exponential growth trend. The principal reason for the trend is the growth in the driving force of VMD mass transfer. It can be seen from Equation (7) that at a certain temperature, the difference between the saturated vapor pressure and the vacuum pressure in the system increased, which can produce a larger driving force, thus promoting the permeate flux. Therefore, with the vacuum degree increased, a larger flux was generated.
5.2.3. CPC
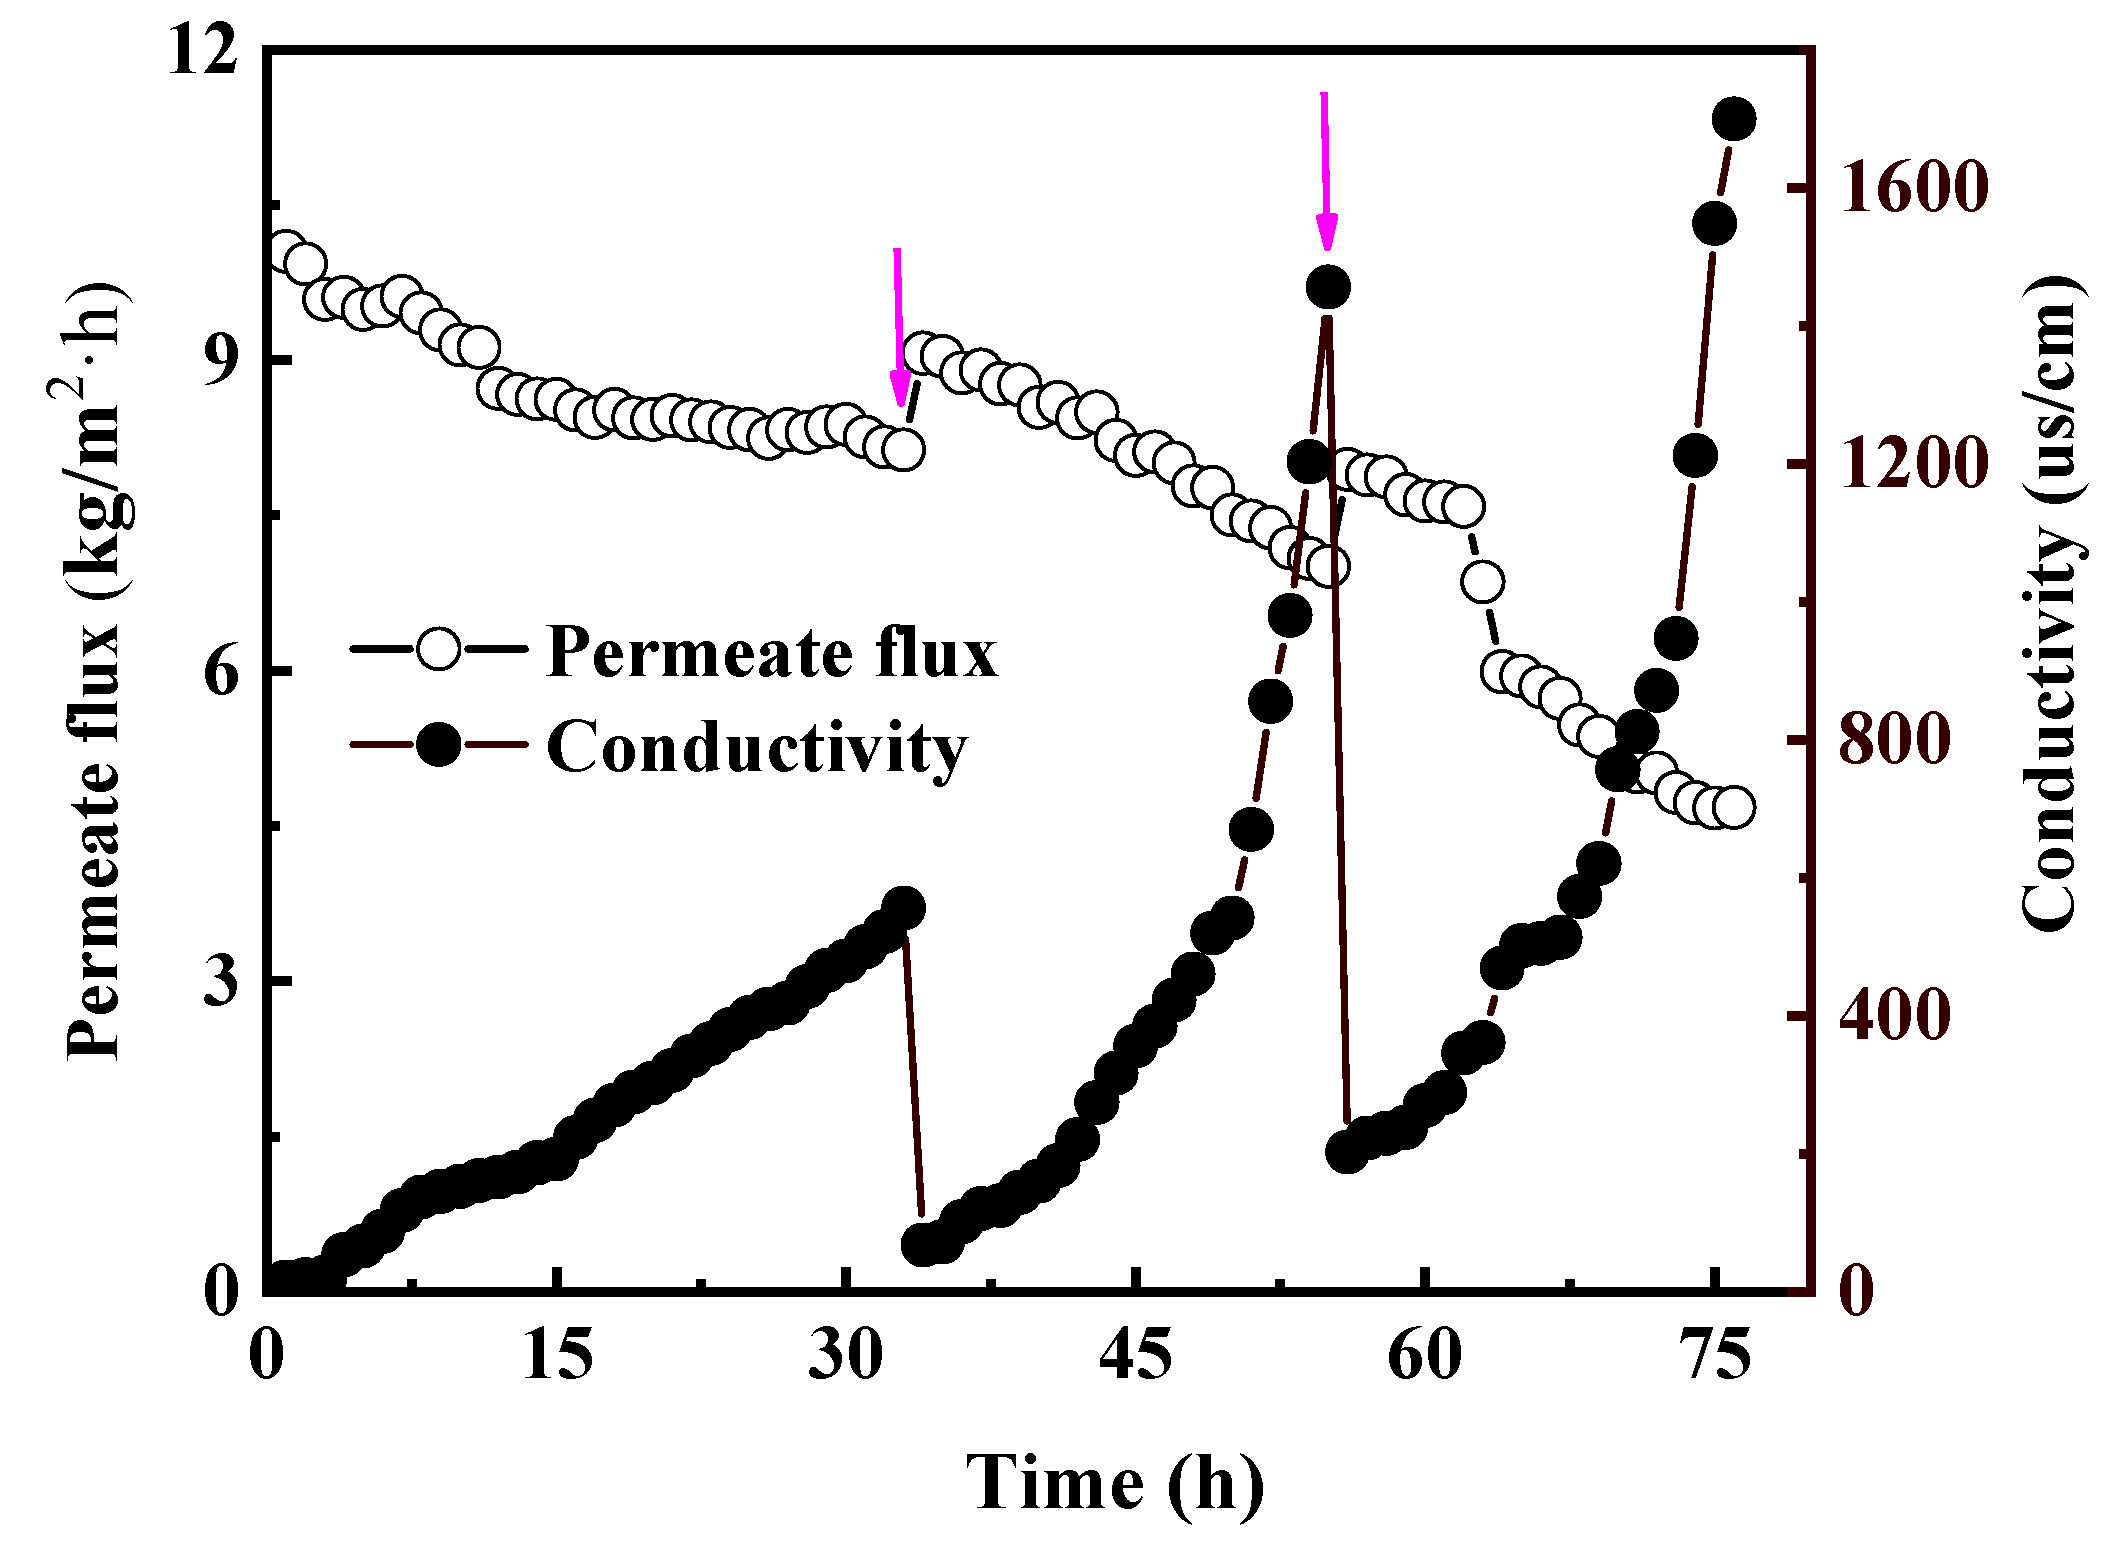
In this study, the continuous experiment was conducted for 76 h under the best conditions to explore the phenomenon of concentration polarization during operation. Figure 8 shows the changes in water flux and conductivity during the continuous operation. When the flux decreases by 50%, the membrane module was cleaned using deionized water. Within 76 h of continuous operation, the flux dropped from 10.05 to 3.482 (kg/m2·h). After two cleanings, the flux cannot be restored to the initial value.
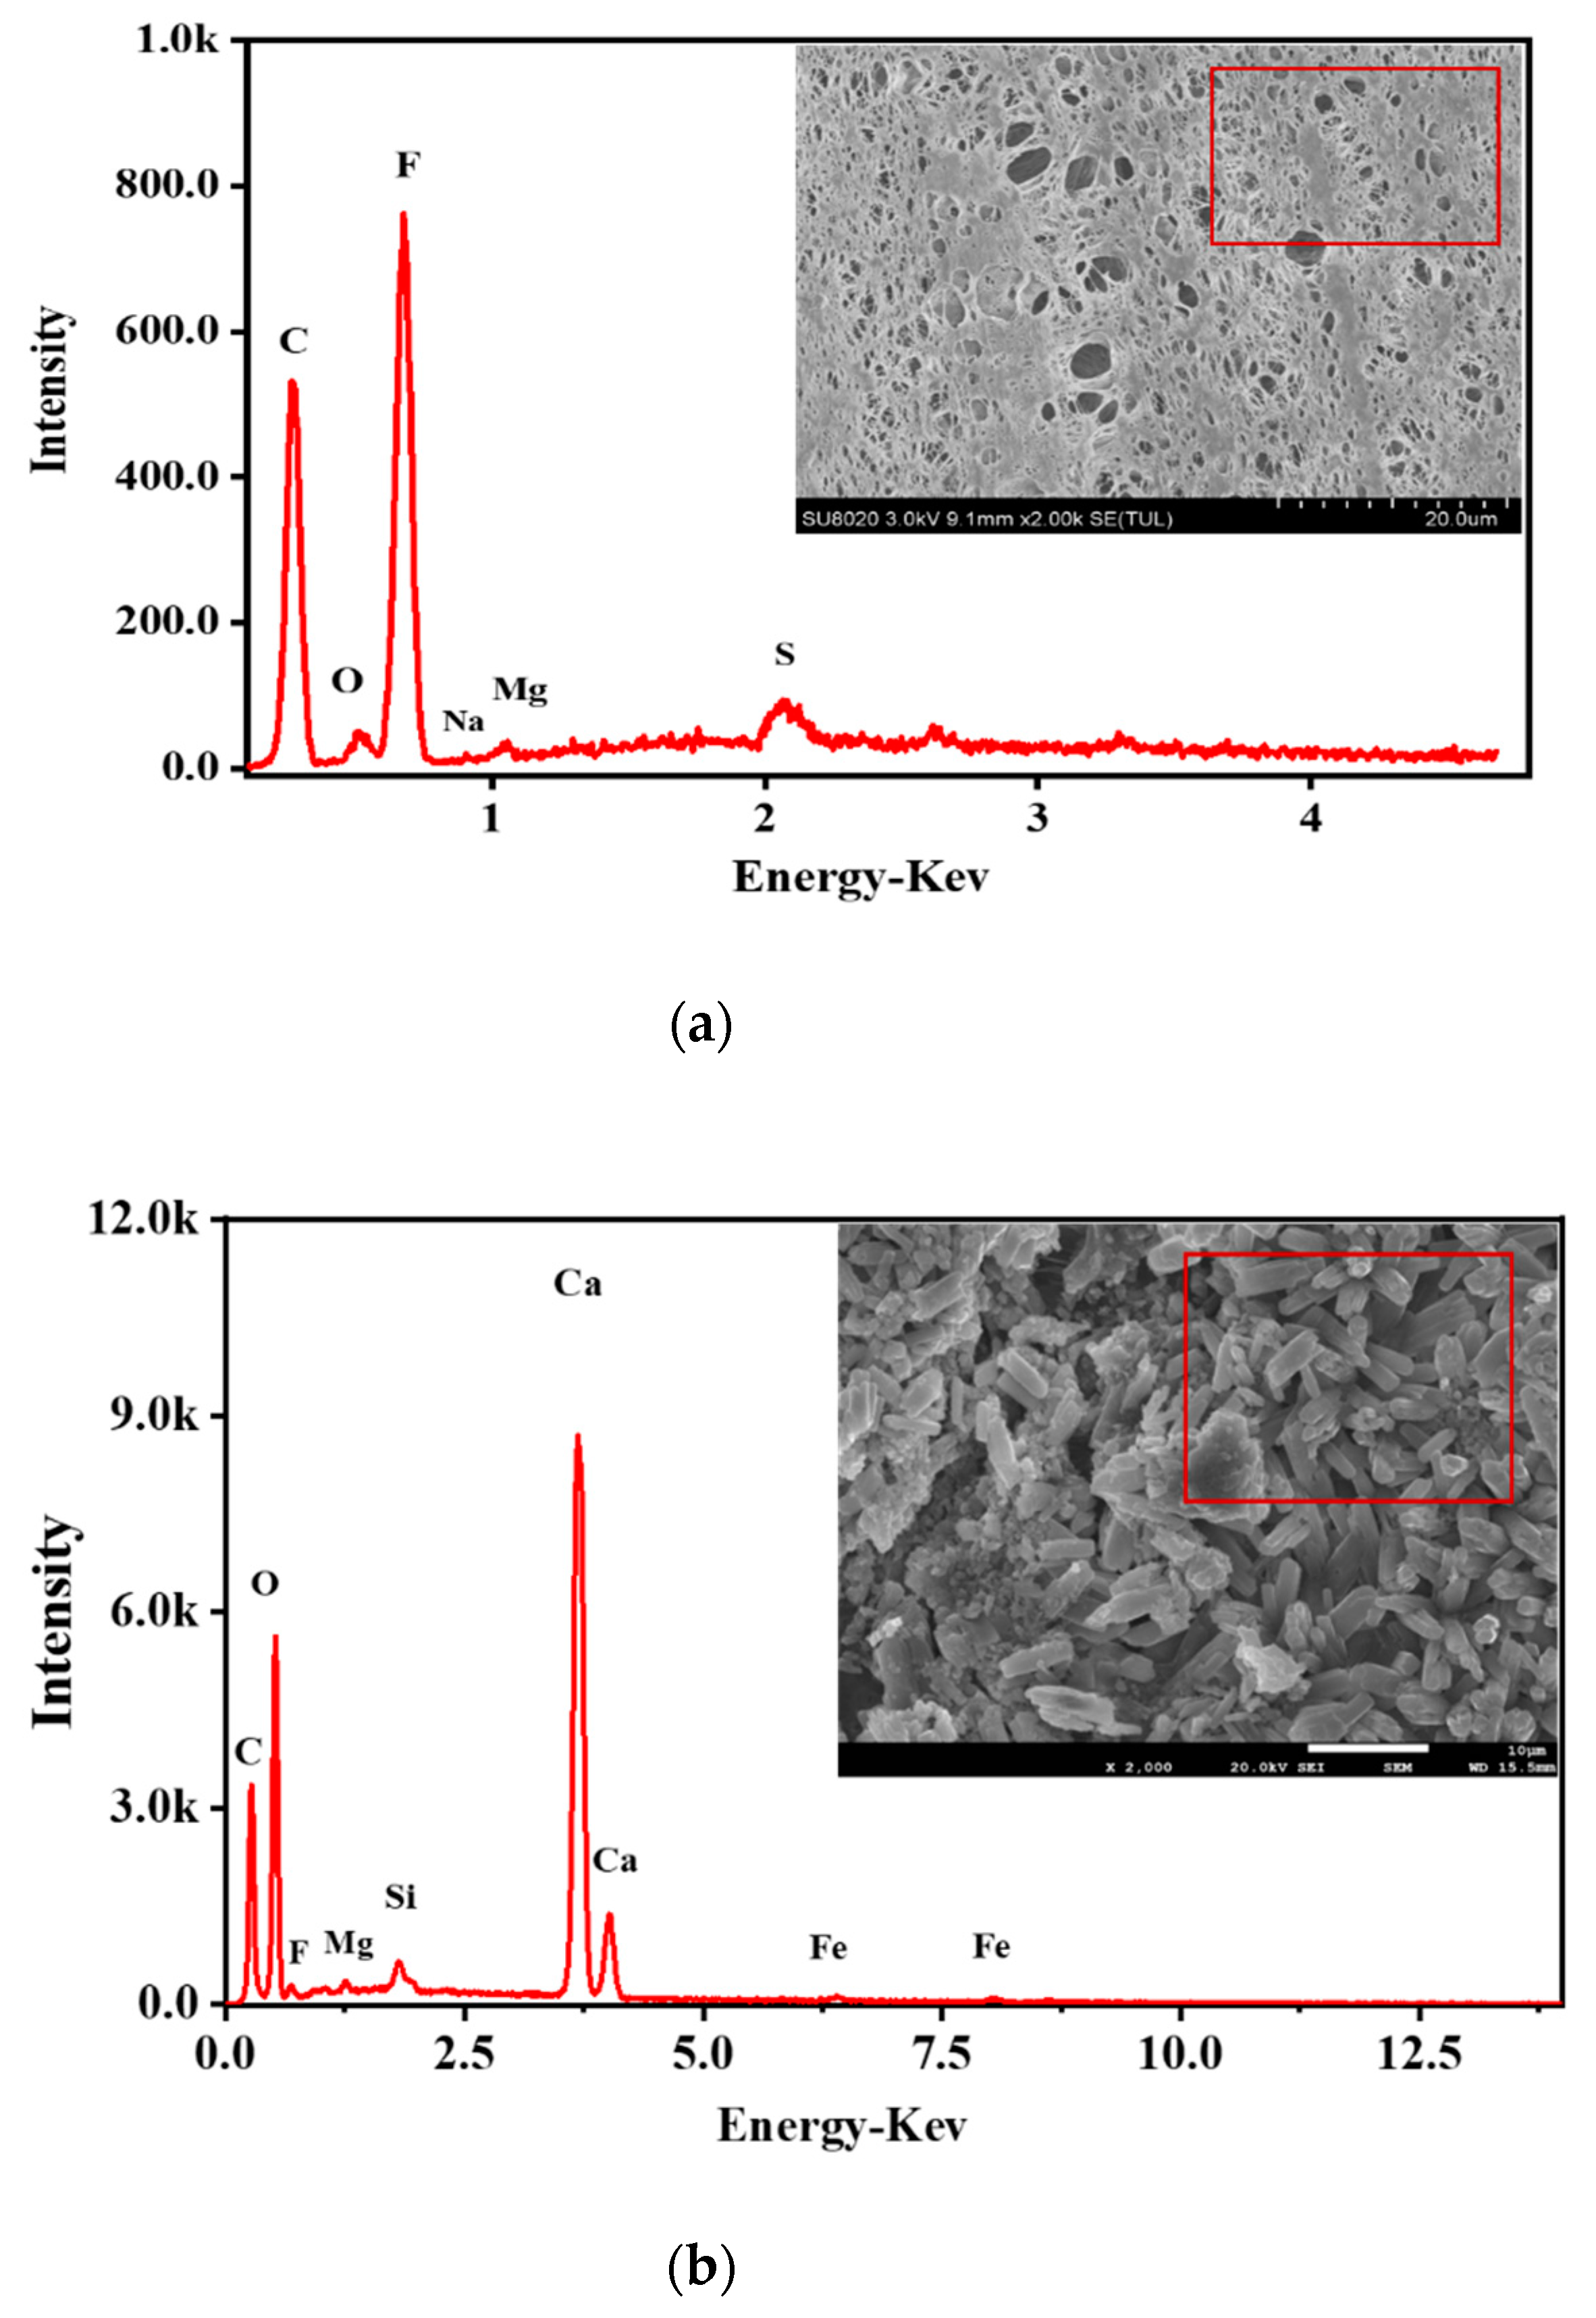
However, reverse osmosis mine water is high salinity mine water, which contains low organic matter. Therefore, the main reason for this may be that concentration polarization occurred during operation, and the inorganic salt in the mine water was saturated and crystallized on the membrane surface, which blocks the membrane pores. By comparing the SEM and EDS of the virgin and the used membrane (Figure 9), it was found that calcium carbonate accumulated on the membrane surface after use, which confirmed the occurrence of concentration polarization in the process of MD treatment of reverse osmosis mine water.
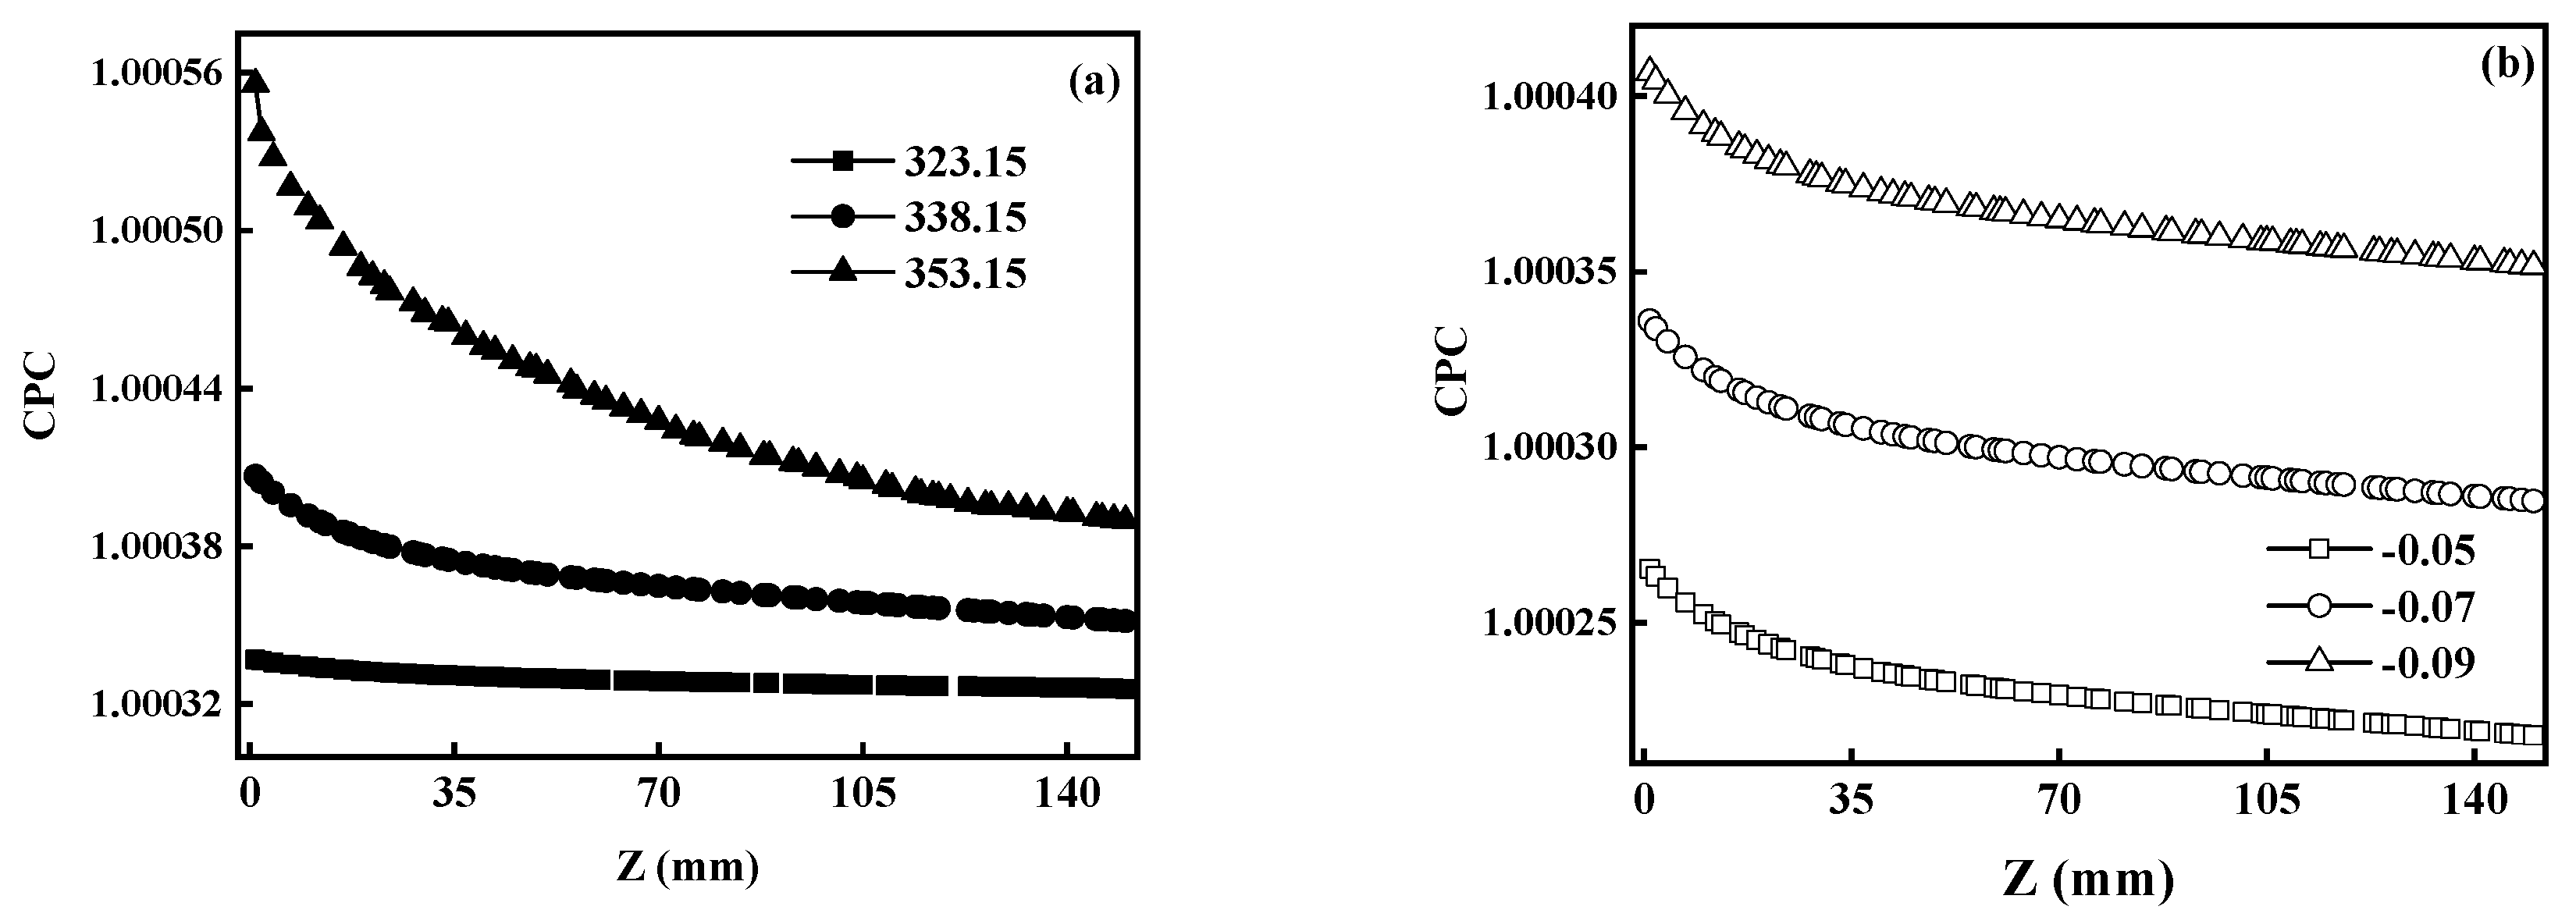
Figure 10 explores the variation of CPC under different conditions. As the temperature of the feed liquid increases, the CPC increases (Figure 10a). When the temperature of the feed liquid increases, the water molecules diffuse faster and pass through the membrane in the form of steam. However, the inorganic salt in the mine water cannot permeate the membrane, resulting in a slight increase in the salt concentration on the membrane surface.
As shown in Figure 10b, CPC increased as the vacuum pressure raised. The increase in the degree of vacuum increases the flux, and more feed liquid diffuses to the membrane surface, which leads to an increase in permeate flux. However, the inorganic salt was intercepted by the hydrophobic membrane, causing the salt concentration on the membrane surface to increase, and then the CPC increases.
5.3. Heat Transfer in VMD
In addition to permeate flux, heat transfer efficiency is another crucial criterion to evaluate the overall performance of MD. Table 6 shows the variance analysis of various related factors on the thermal efficiency model. The “p-value” of this model is <0.05, and the “Lack of Fit F-value” is 1.87, indicating that the model is valid. As shown in Figure 6, both independent factors and mutual factors have an important influence on thermal efficiency. The feed temperature (A), vacuum pressure (B) and interaction of feed-temperature–length (AC) parameters are valid in thermal efficiency and were included in the analysis. According to the sum of squares, it can be judged that B has the greatest influence on the thermal efficiency and the feed temperature has the weakest effect.
5.3.1. Effects of Membrane Characteristics on Heat Transfer
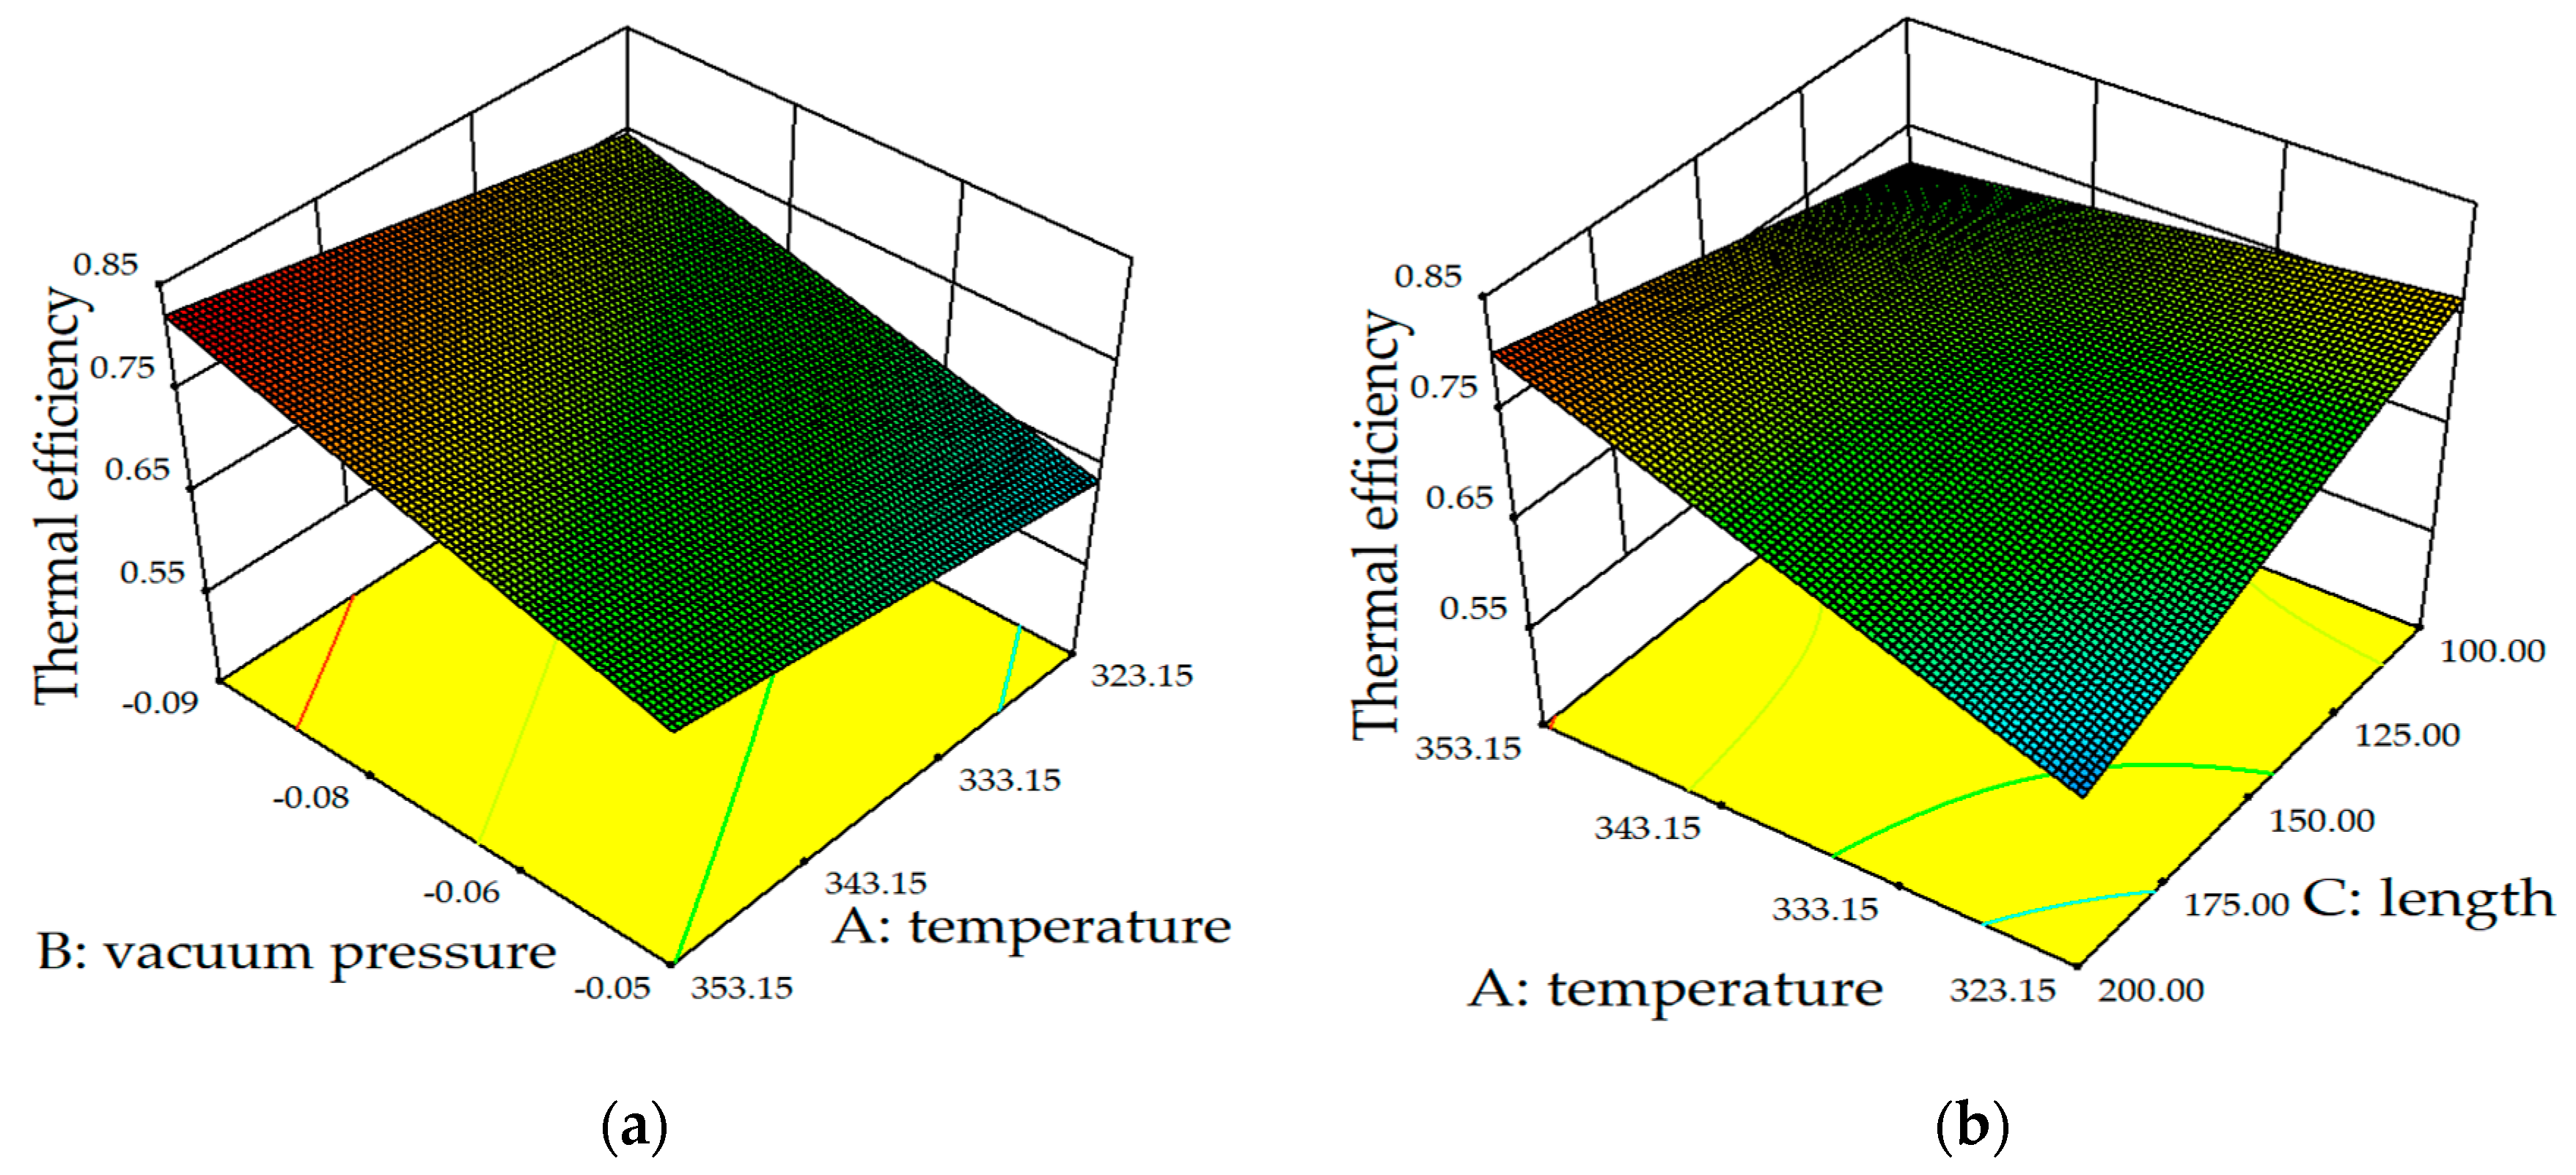
From the 3D contour plot of Figure 11a, it is clear that the membrane length is negatively related to the heat transfer efficiency. When the membrane length increased from 100 to 200 mm, the heat transfer efficiency decreased from 0.746 to 0.71 (Tfeed = 338.15 K, P = −0.07 MPa). Under different membrane lengths, the decline in heat transfer efficiency is mainly due to the decrease in permeate flux. In the above discussion (Figure 6), the membrane surface temperature decreases continuously from the feed inlet to the outlet. With the increase in the membrane length, the Tf,m dropped 2 to a lower level, which leads to a decrease in the flux across the membrane. Therefore, the heat transfer efficiency and membrane flux have the same downward trend.
5.3.2. Effect of Operational Factors on Heat Transfer
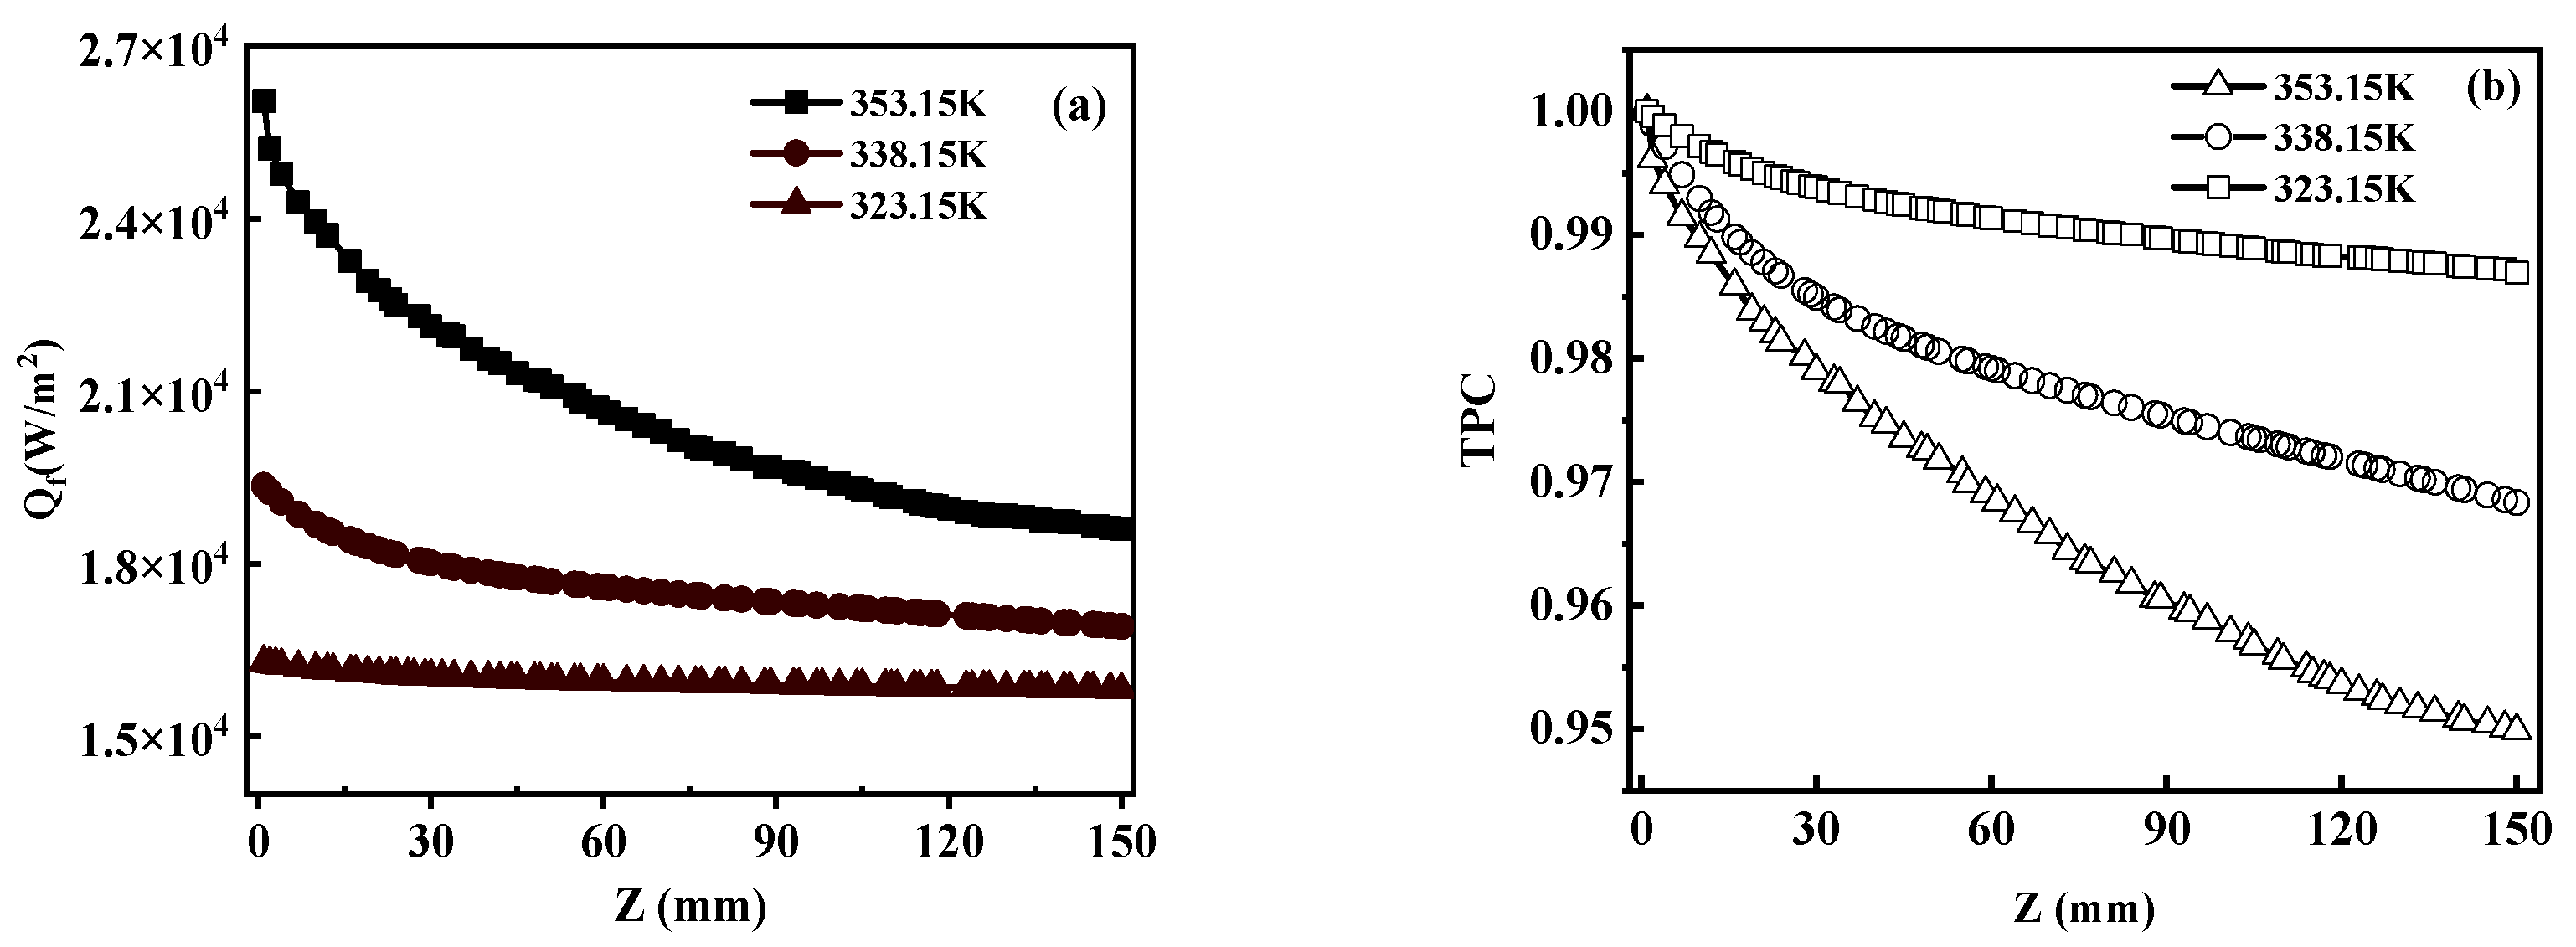
For the least influential factor, the temperature of the feed has a positive correlation with the heat transfer efficiency (Figure 11a). When the vacuum degree was −0.07 MPa and the membrane length was 150 mm, the feed temperature increases from 323.15 to 353.15 K, resulting in the increase in thermal efficiency from 0.693 to 0.761. According to the above discussion, the permeate flux increased with the increase in feed temperature (Figure 5a). Equation (19) indicates that an increase in feed temperature produces a greater latent heat of evaporation. Furthermore, Qm becomes larger. In addition to the change in Qm, the change in the heat input side also has a slight effect on heat transfer efficiency [20]. It is evident that Qf increased with the increase in feed temperature (Figure 12a). For example, when the feed temperature increased from 323.15 to 353.15 K, Qf can be increased from 16,283.92 to 26,035.69 W/m2. The increase in Qf can provide energy for the evaporation of water vapor at the feed side. The more steam produced, the higher the efficiency of heat input energy used in the VMD system [15].
The vacuum pressure is the most significant of several factors. Figure 11b confirms that heat transfer efficiency increases with vacuum pressure. The above discussion found that vacuum pressure has the most marked effect on the increase in permeate flux. The effect of vacuum pressure on heat transfer efficiency was similar to that of membrane length, and the influence of membrane flux on heat transfer efficiency was also affected by membrane flux.
5.3.3. TPC
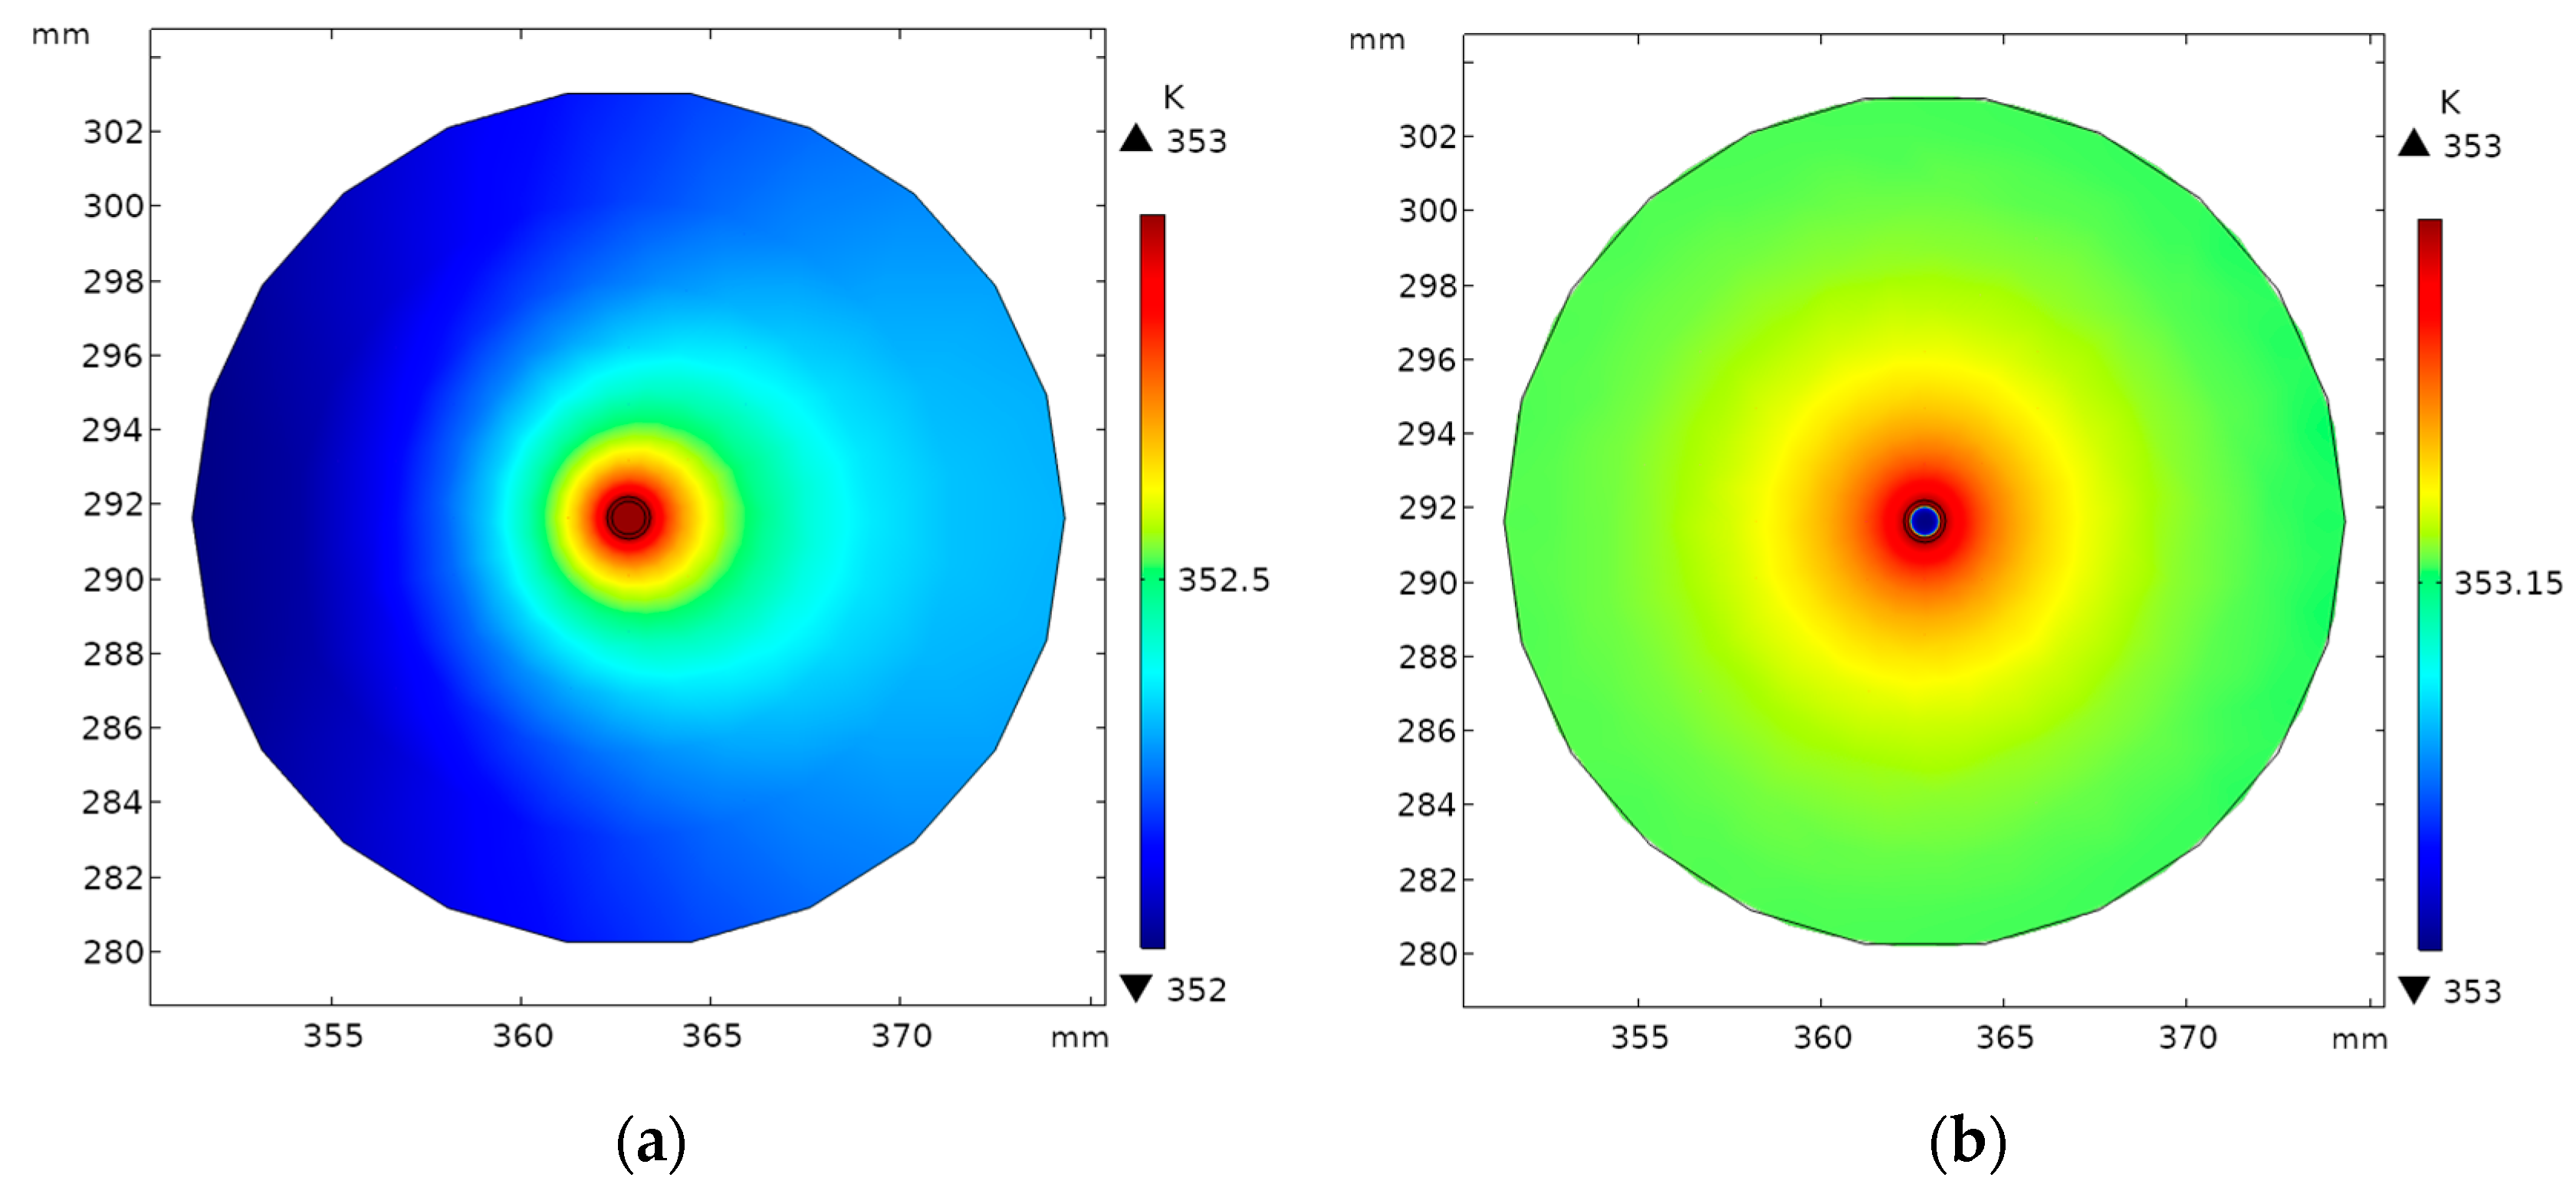
Temperature polarization also plays an important role in the heat transfer process of MD. Figure 13 is a cross-sectional view of the temperature distribution of the membrane and the membrane module; the existence of the temperature boundary layer can be found. From the feed inlet to the outlet, the high temperature area in the middle of the membrane gradually decreases along the flow direction, and the thermal boundary layer begins to appear, resulting in temperature polarization.
From the above discussion, it is understood that the vacuum pressure and the length of the membrane mainly affect the heat transfer by controlling the membrane flux, and the feed temperature enhances the thermal efficiency in terms of membrane flux and convective heat transfer. Therefore, this study only discusses the relationship between feed temperature and TPC. As shown in Figure 12, it can be clearly found that at different feed temperatures, TPC decreases sharply with the increase in feed temperature, which means that the difference between feed body temperature and membrane surface temperature is increasing. It is notable that the higher the temperature, the greater the decrease in TPC with the distribution of membrane. The cause of this fact is that when the feed temperature is higher, the vaporization requires more energy, so the temperature drop is larger [42]. The feed flow rate adopted in this experiment was 1.5 L/min, which is relatively low. In the future improvement experiments, the feed flow rate can be appropriately increased to reduce the residence time of the feed liquid on the membrane surface, alleviating the temperature polarization phenomenon. The team found in this experiment that, due to the small inner diameter of the fiber, if the feed flow rate is too large, the local resistance in the membrane will increase, resulting in excessive internal pressure and rupture.
6. Conclusions
In this study, to explore the mass and heat transfer process of reverse osmosis mine water in the MD process, COMSOL Multiphysics was used to establish a 3D model and CFD simulation was performed, which was verified by the experimental results. The operating conditions: the feed temperature, the vacuum pressure, and the membrane length were compared and simulated. Based on the simulation results (flux and thermal efficiency), these parameters and their interactions were systematically compared by RSM. According to the simulation results, the following conclusions can be drawn:
- (1)
- In addition to the membrane length, the two operating conditions were positively correlated with permeate flux. With the increase in feed temperature/vacuum pressure, the permeate flux was raised;
- (2)
- The results of RSM showed that the impact on the permeate flux was: vacuum pressure > feed temperature > membrane length > feed-temperature–membrane length;
- (3)
- The heat transfer efficiency can be improved by increasing vacuum pressure and feed temperature, but the effects of them were different. The vacuum pressure affected the permeate flux, and thus changes the heat transfer efficiency. However, the feed temperature can provide heat for the evaporation of water vapor through convective heat transfer, which plays a certain role in heat transfer efficiency;
- (4)
- The influence on heat transfer efficiency was: vacuum pressure > feed temperature > film length > feed temperature;
- (5)
- TPC also has a significant effect on MD heat transfer. The temperature of the feed liquid is negatively correlated with TPC. There was a negative correlation between temperature and TPC. TPC decreased with the increase in feed temperature.
Author Contributions
J.Q.: conceptualization, methodology, software development, writing—original draft. J.L. (Jiafeng Lv): validation, formal analysis. Z.L.: data curation. W.B.: supervision. J.L. (Jingfeng Li): contributed data. S.L.: project administration. All authors have read and agreed to the published version of the manuscript.
Funding
This research was supported by the fund project: The Open Fund Project of the State Key Laboratory of Water Resources Protection and Utilization in Coal Mining (GJNY-18-73.13).
Acknowledgments
The authors thank in The Open Fund Project of the State Key Laboratory of Water Resources Protection and Utilization in Coal Mining funding this project.
Conflicts of Interest
The authors state that they have no known competing financial interests or individual relationships that could have appeared to affect the work reported in this article.
Nomenclature
| Cp | Heat capacity (KJ/(Kg·K)) |
| Df,b | Diffusion coefficient (m/s) |
| d | Hydraulic diameter (m) |
| hf | Local heat transfer coefficient (W/(m2·K)) |
| Latent heat of vaporization of water (J/ kg) | |
| J | Membrane flux (kg/(m2·h)) |
| K | Heat conductivity (W/(m·K)) |
| KB | Boltzmann constant |
| KM | Membrane distillation coefficient (W/(m·K)) |
| Kn | Knudsen Number |
| M | Molecular mass (kg /mol) |
| P | Average pressure (pa) |
| Pf,m | Vapor pressure at feed membrane interface |
| Pvacuum | Vacuum pressure (pa) |
| Psv | Water vapor pressure (pa) |
| Q | Heat flux (W/m2) |
| R | Gas universal constant (J/(mol·K)) |
| Re | Reynolds number |
| r | Average pore size (m) |
| rw | Activity coefficient of water |
| S | Membrane area(m2) |
| Sc | Schmidt number |
| Sh | Energy source term (J/(m3·s)) |
| Sm | Mass source term (Kg/(m3·s)) |
| Sv | Momentum source term (N/m3) |
| T | Temperature (K) |
| u | Velocity of feed (m/s) |
| xs | Molar fraction of sodium chloride |
| Greek symbols | |
| Porosity (%) | |
| Mean free path of water molecule (m) | |
| Collision diameter(m) | |
| Membrane thickness (m) | |
| Tortuosity | |
| Thermal efficiency (%) | |
| Viscosity (Pa·S) | |
| Subscript | |
| f,b | Feed bulk |
| f,m | Membrane surface on the feed side feed |
| p | Permeate |
| P,m | Membrane surface on the permeate side |
| Abbreviations | |
| CFD | Computational fluid dynamics |
| MD | Membrane distillation |
| VMD | Vacuum membrane distillation |
| TPC | Temperature polarization coefficient |
References
- Dazhao, G.; Yong, Z.; Zhiguo, C. Technical progress of water resource protection and utilization by coal mining in China. Coal Sci. Technol. 2016, 44, 1–7. [Google Scholar]
- Ministry of Water Resources People’s Republic of China. China Water Resources Bulletin; Ministry of Water Resources People’s Republic of China: Beijing, China, 2018.
- Binbin, J.; Xiaolong, H.; Qiang, G.; Xinjie, L. Research on underground classification treatment technology of highly mineralized mine water in Lingxin Coal Mine. Coal Eng. 2018, 50, 83–85. [Google Scholar]
- Andrjesdottir, O.; Ong, C.L.; Nabavi, M.; Paredes, S.; Khalil, A.S.G.; Michel, B.; Poulikakos, D. An experimentally optimized model for heat and mass transfer in direct contact membrane distillation. Int. J. Heat Mass Transf. 2013, 66, 855–867. [Google Scholar] [CrossRef]
- Khayet, M. Membranes and theoretical modeling of membrane distillation: A review. Adv. Colloid Interface. 2011, 164, 56–88. [Google Scholar] [CrossRef] [PubMed]
- Fuqin, L.; Guifeng, Z.; Yunhao, Z. Research on Zero Drainage Process of Highly Mineralized Mine Water. Coal Sci. Technol. 2018, 46, 81–86. [Google Scholar]
- Abu-Zeid, M.A.E.-R.; Zhang, Y.; Dong, H.; Zhang, L.; Chen, H.-L.; Hou, L. A comprehensive review of vacuum membrane distillation technique. Desalination 2015, 356, 1–14. [Google Scholar] [CrossRef]
- El-Zanati, E.; El-Khatib, K.M. Integrated membrane—Based desalination system. Desalination 2007, 205, 15–25. [Google Scholar] [CrossRef]
- Drioli, E.; Ali, A.; Macedonio, F. Membrane distillation: Recent developments and perspectives. Desalination 2015, 356, 56–84. [Google Scholar] [CrossRef]
- Schofield, R.W.; Fane, A.G.; Fell, C.J. Heat and mass transfer in membrane distillation. J. Membr. Sci. 1987, 33, 299–313. [Google Scholar] [CrossRef]
- Lawson, K.W.; Lloyd, D.R. Membrane distillation. J. Membr. Sci. 1997, 124, 1–25. [Google Scholar] [CrossRef]
- Li, H.; Yi, F.; Li, X.; Pavlenko, A.N.; Gao, X. Numerical simulation for falling film flow characteristics of refrigerant on the smooth and structured surfaces. J. Eng. Thermophys. Rus. 2018, 27, 1–19. [Google Scholar] [CrossRef]
- Long, R.; Kuang, Z.; Liu, Z.; Liu, W. Ionic thermal up-diffusion in nanofluidic salinity gradient energy harvesting. Nat. Sci. Rev. 2019, 6. [Google Scholar] [CrossRef]
- Tang, N.; Zhang, H.; Wang, W. Computational fluid dynamics numerical simulation of vacuum membrane distillation for aqueous NaCl solution. Desalination 2011, 274, 120–129. [Google Scholar] [CrossRef]
- Shokrollahi, M.; Rezakazemi, M.; Younas, M. Producing water from saline streams using membrane distillation: Modeling and optimization using CFD and design expert. Int. J. Energy Res. 2020, 44. [Google Scholar] [CrossRef]
- Liu, J.; Wang, Q.; Han, L.; Li, B. Simulation of heat and mass transfer with cross-flow hollow fiber vacuum membrane distillation: The influence of fiber arrangement. Chem. Eng. Res. Des. 2017, 119, 12–22. [Google Scholar] [CrossRef]
- Parakala, S.; Moulik, S.; Sridhar, S. Effective separation of methylene blue dye from aqueous solutions by integration of micellar enhanced ultrafiltration with vacuum membrane distillation. Chem. Eng. Res. Des. 2019, 375. [Google Scholar] [CrossRef]
- Ho, C.-D.; Huang, C.-H.; Tsai, F.-C.; Chen, W.-T. Performance improvement on distillate flux of countercurrent-flow direct contact membrane distillation systems. Desalination 2014, 338, 26–32. [Google Scholar] [CrossRef]
- Kuang, Z.; Long, R.; Liu, Z.; Liu, W. Analysis of temperature and concentration polarizations for performance improvement in direct contact membrane distillation. Int. J. Heat Mass Transf. 2019, 145, 118724. [Google Scholar] [CrossRef]
- Zhang, Y.; Peng, Y.; Ji, S.; Wang, S. Numerical simulation of 3d hollow-fiber vacuum membrane distillation by computational fluid dynamics. Chem. Eng. Sci. 2019, 152, 172–185. [Google Scholar] [CrossRef]
- Versteeg, H.K.; Malalasekera, W. An Introduction to Computational Fluid Dynamics: The Finite Volume Method; Wiley: New York, NY, USA, 1995. [Google Scholar]
- Yu, H.; Yang, X.; Wang, R.; Fan, A.G. Numerical simulation of heat and mass transfer in direct membrane distillation in a hollow fiber module with laminar flow. J. Membr. Sci. 2011, 384, 107–116. [Google Scholar] [CrossRef]
- Julian, H.; Lian, B.; Li, H.; Liu, X.; Wang, Y.; Leslie, G.; Chen, V. Numerical study of CaCo3 scaling in submerged vacuum membrane distillation and crystallization (VMDC). J. Membr. Sci. 2018, 559, 87–97. [Google Scholar] [CrossRef]
- Martnez, L.; Florido-Daz, F.J.; Hernández, A.; Prádanos, P. Characterisation of three hydrophobic porous membranes used in membrane distillation modelling and evaluation of their water vapour permeabilities. J. Membr. Sci. 2002, 203, 15–27. [Google Scholar] [CrossRef]
- El-Bourawi, M.S.; Ding, Z.; Ma, R.; Khayet, M. A framework for better understanding membrane distillation separation process. J. Membr. Sci. 2006, 285, 24–29. [Google Scholar] [CrossRef]
- Phattaranawik, J.; Jiraratananon, R.; Fane, A.G. Effect of pore size distribution and air flux on mass transport in direct contact membrane distillation. J. Membr. Sci. 2003, 215, 75–85. [Google Scholar] [CrossRef]
- Yang, Y.; Rana, D.; Matsuura, T.; Lan, C.Q. The heat and mass transfer of vacuum membrane distillation: Effect of active layer morphology with and without support material. Sep. Purif. Technol. 2016, 164, 56–62. [Google Scholar] [CrossRef]
- Bandini, S.; Sarti, G.C. Heat and mass transport resistances in vacuum membrane distillation per drop. AIChE J. 1999, 45, 1422–1433. [Google Scholar] [CrossRef]
- Bandini, S.; Gostoli, C.; Sarti, G.C. Separation efficiency in vacuum membrane distillation. J. Membr. Sci. 1992, 73, 217–229. [Google Scholar] [CrossRef]
- Zhang, J.; Li, J.; Duke, M.; Hoang, M.; Xie, Z.; Groth, A.; Tun, C.; Gray, S. Modelling of vacuum membrane distillation. J. Membr. Sci. 2013, 434, 1–9. [Google Scholar] [CrossRef] [Green Version]
- Sherwood, T.K.; Pigford, R.L.; Wilke, C.R. Mass Transfer; McGraw-Hill: New York, NY, USA, 1975. [Google Scholar]
- Ibrahim, S.S.; Alsalhy, Q.F. Modeling and simulation for direct contact membrane distillation in hollow fiber modules. AIChE J. 2013, 59, 589–603. [Google Scholar] [CrossRef]
- Ameen, N.A.M.; Ibrahim, S.S.; Alsalhy, Q.F.; Figoli, A. Highly Saline Water Desalination Using Direct Contact Membrane Distillation (DCMD): Experimental and Simulation Study. Water 2020, 12, 1–24. [Google Scholar] [CrossRef]
- Lian, B.; Wang, Y.; Le-Clech, P.; Chen, V.; Leslie, G. A numerical approach to module module design for crossflow vacuum membrane distillation systems. J. Membr. Sci. 2016, 510, 489–496. [Google Scholar] [CrossRef]
- Bandini, S.; Sarti, G.C. Concentration of must through vacuum membrane distillation. Desalination 2002, 149, 253–259. [Google Scholar] [CrossRef]
- Ding, Z.; Liu, L.; Ma, R. Study on the effect of flow maldistribution on the performance of the hollow fiber modules used in membrane distillation. J. Membr. Sci. 2003, 215, 11–23. [Google Scholar] [CrossRef]
- Wang, Y.; Chen, F.; Luo, G.; Dai, Y. Effect of Random packing on shell-side flow and mass transfer in hollow fiber module described by normal distribution function. J. Membr. Sci. 2003, 216, 81–93. [Google Scholar] [CrossRef]
- Taamneh, Y.; Bataineh, K. Improving the performance of direct contact membrane distillation utilizing spacer-filled channel. Desalination 2017, 408, 25–35. [Google Scholar] [CrossRef]
- Singh, S.; Chakraborty, J.P.; Mondal, M.K. Optimization of process parameters for torrefaction of Acacia nilotica using response surface methodology and character istics of torrefied biomass as upgraded fuel. Energy 2019, 186, 115865. [Google Scholar] [CrossRef]
- Liu, J.; Liu, M.; Guo, H.; Zhang, W.; Xu, K.; Li, B. Mass transfer in hollow fiber vacuum membrane distillation process based on membrane structure. J. Membr. Sci. 2017, 532, 115–123. [Google Scholar] [CrossRef]
- Baghel, R.; Kalla, S.; Upadhyaya, S.; Chaurasia, S.P.; Singh, K. Cfd modeling of vacuum membrane distillation for removal of naphthol blue black dye from aqueous solution using COMSOL multiphysics. Chem. Eng. Res. Des. 2020, 158. [Google Scholar] [CrossRef]
- Lovineh, S.G.; Asghari, M.; Rajaei, B. Numerical simulation and theoretical study on simultaneous effects of operating parameters in vacuum membrane distillation. Desalination 2013, 314. [Google Scholar] [CrossRef]
Figure 1.
Mass and temperature profile in vacuum membrane distillation (VMD).

Figure 2.
3D geometry and meshing of membrane and its module.

Figure 3.
Schematic of VMD unit.

Figure 4.
Validation of CFD simulation flux and experimental flux under (a) different temperatures and (b) different vacuum pressures (Tf = 323.15–353.15 K, Ppermeate = −0.05–0.09 MPa, vfeed = 1.5 L/min).
Figure 4.
Validation of CFD simulation flux and experimental flux under (a) different temperatures and (b) different vacuum pressures (Tf = 323.15–353.15 K, Ppermeate = −0.05–0.09 MPa, vfeed = 1.5 L/min).

Figure 5.
Plots for contour and response surface presenting the effects of vacuum pressure (MPa), membrane length (mm) on flux. the picture shows the interaction curve: (a) AB; (b) BC.
Figure 5.
Plots for contour and response surface presenting the effects of vacuum pressure (MPa), membrane length (mm) on flux. the picture shows the interaction curve: (a) AB; (b) BC.

Figure 6.
(a) Temperature and (b) local flux distributions of membrane surface along the fiber length at different membrane length (mm) (Tfeed = 338.15 K, P = −0.09 MPa, Vfeed = 1.5 L/min).
Figure 6.
(a) Temperature and (b) local flux distributions of membrane surface along the fiber length at different membrane length (mm) (Tfeed = 338.15 K, P = −0.09 MPa, Vfeed = 1.5 L/min).

Figure 7.
(a) Mass transfer coefficient and (b) local flux distributions of membrane surface along the fiber length at different feed temperature (Lmembrane = 150 mm, P = −0.09 MPa, Vfeed = 1.5 L/min).
Figure 7.
(a) Mass transfer coefficient and (b) local flux distributions of membrane surface along the fiber length at different feed temperature (Lmembrane = 150 mm, P = −0.09 MPa, Vfeed = 1.5 L/min).

Figure 8.
Variation in water flux, produced water conductivity during the VMD treatment of reverse osmosis mine water (75 °C, −0.09 MPa, 1.5 L/min). Magenta arrows show the timing of the cleaning membrane.
Figure 8.
Variation in water flux, produced water conductivity during the VMD treatment of reverse osmosis mine water (75 °C, −0.09 MPa, 1.5 L/min). Magenta arrows show the timing of the cleaning membrane.

Figure 9.
SEM images and EDS spectrum from (a) virgin, (b) used membrane.

Figure 10.
CPC along the fiber length at (a) different feed temperature and (b) vacuum pressure (Lmembrane = 150 mm, Vfeed = 1.5 L/min).
Figure 10.
CPC along the fiber length at (a) different feed temperature and (b) vacuum pressure (Lmembrane = 150 mm, Vfeed = 1.5 L/min).

Figure 11.
Plots for contour and response surface presenting the effects of vacuum pressure (MPa), membrane length (mm) on thermal efficiency, (a) AB, (b) AC.
Figure 11.
Plots for contour and response surface presenting the effects of vacuum pressure (MPa), membrane length (mm) on thermal efficiency, (a) AB, (b) AC.

Figure 12.
(a) Qf and (b) TPC along the fiber length at different feed temperature (Lmembrane = 150mm, P = −0.09 MPa, Vfeed = 1.5 L/min).
Figure 12.
(a) Qf and (b) TPC along the fiber length at different feed temperature (Lmembrane = 150mm, P = −0.09 MPa, Vfeed = 1.5 L/min).

Figure 13.
Membrane modules and fiber temperature distribution in different sections. (a) 0 mm, (b) 50 mm (Tfeed = 338.15 K, Vfeed = 1.5 L/min, P = −0.09 MPa).
Figure 13.
Membrane modules and fiber temperature distribution in different sections. (a) 0 mm, (b) 50 mm (Tfeed = 338.15 K, Vfeed = 1.5 L/min, P = −0.09 MPa).


Table 1.
Source term in MD.
| Expression | ||
|---|---|---|
| (4) | ||
| (5) | ||
| (6) | ||
J, S, V, Cp, u and h are the permeate flux, membrane area, volume, the heat capacity of feed, velocity of feed, and latent heat, respectively.
Table 2.
Hollow membrane module parameters.
| Characteristics | PVDF |
|---|---|
| Inner diameter (mm) | 0.849 |
| Outer diameter (mm) | 1.139 |
| Thickness (mm) | 0.186 |
| Contact angle (°) | 106.5 |
| Effective membrane surface area (m2) | 0.1066 |
| Thermal conductivity (Wm−1K−1) | 0.2 |
Table 3.
Boundary conditions for VMD.
| Conditons | Value |
|---|---|
| Feed temperature (k) | 323.15 to 353.15 K |
| Permeate Temperature (K) | 303.15 |
| Feed solution concentration (Kg/L) | 0.3 |
| Feed inlet rate (L/min) | 1.5 |
| Permeate inlet rate (L/min) | 1.5 |
| Permeate pressure (MPa) | −0.05 to −0.09 |
Table 4.
Independent design values and variables used in simulation studies.
| Variables | Levels | ||
|---|---|---|---|
| Lower (−1) | Central (0) | Upper (+1) | |
| Feed temperature (K) | 323.15 | 33.15 | 353.15 |
| Vacuum pressure (Mpa) | −0.05 | −0.07 | −0.09 |
| Membrane length (mm) | 100 | 150 | 200 |
Table 5.
ANOVA results of response surface test for permeate flux.
| Source | Sum of Squares | Df | Mean Square | F Value | p-Value | Distinctiveness |
|---|---|---|---|---|---|---|
| Model | 23.17 | 9 | 2.57 | 371.26 | <0.0001 | ** |
| A-feed temperature | 7.29 | 1 | 7.29 | 1051.25 | <0.0001 | ** |
| B-vacuum pressure | 15.57 | 1 | 15.57 | 2245.10 | <0.0001 | ** |
| C-length | 0.067 | 1 | 0.067 | 9.68 | 0.0171 | * |
| AC | 0.053 | 1 | 0.053 | 7.60 | 0.0282 | * |
| A2 | 0.16 | 1 | 0.16 | 23.54 | 0.0019 | ** |
| Residual | 0.049 | 1 | 6.935 × 10⁻³ | |||
| Lack of Fit | 3.512 × 10⁻³ | 3 | 1.171 × 10⁻³ | 0.10 | 0.9535 | |
| Pure Error | 0.045 | 4 | 0.011 | |||
| Cor Total | 23.22 | 16 |
Note: “*” indicates that the effect of the result is significant (p < 0.05); “**” indicates that the result is extremely significant (p <0.01).
Table 6.
ANOVA results of response surface test for thermal efficiency.
| Source | Sum of Squares | Df | Mean Square | F Value | p-Value | Distinctiveness |
|---|---|---|---|---|---|---|
| Model | 0.053 | 6 | 8.764 × 10⁻³ | 8.69 | 0.0017 | ** |
| A-feed temperature | 9.143 × 10⁻³ | 1 | 9.143 × 10⁻³ | 9.07 | 0.0131 | * |
| B-vacuum pressure | 0.027 | 1 | 0.027 | 27.15 | 0.0004 | ** |
| AC | 0.013 | 1 | 0.013 | 13.10 | 0.0047 | * |
| Residual | 0.010 | 1 | 1.008 × 10⁻³ | |||
| Lack of Fit | 7.434 × 10⁻³ | 6 | 1.239 × 10⁻³ | 1.87 | 0.2833 | |
| Pure Error | 2.649 × 10⁻³ | 4 | 6.622 × 10⁻⁴ | |||
| Cor Total | 0.063 | 16 |
Note: “*” indicates that the effect of the result is significant (p < 0.05); “**” indicates that the result is extremely significant (p < 0.01).
Publisher’s Note: MDPI stays neutral with regard to jurisdictional claims in published maps and institutional affiliations. |
© 2020 by the authors. Licensee MDPI, Basel, Switzerland. This article is an open access article distributed under the terms and conditions of the Creative Commons Attribution (CC BY) license (http://creativecommons.org/licenses/by/4.0/).
Share and Cite
MDPI and ACS Style
Qi, J.; Lv, J.; Li, Z.; Bian, W.; Li, J.; Liu, S. A Numerical Simulation of Membrane Distillation Treatment of Mine Drainage by Computational Fluid Dynamics. Water 2020, 12, 3403. https://doi.org/10.3390/w12123403
AMA Style
Qi J, Lv J, Li Z, Bian W, Li J, Liu S. A Numerical Simulation of Membrane Distillation Treatment of Mine Drainage by Computational Fluid Dynamics. Water. 2020; 12(12):3403. https://doi.org/10.3390/w12123403
Chicago/Turabian StyleQi, Ji, Jiafeng Lv, Zhen Li, Wei Bian, Jingfeng Li, and Shuqin Liu. 2020. "A Numerical Simulation of Membrane Distillation Treatment of Mine Drainage by Computational Fluid Dynamics" Water 12, no. 12: 3403. https://doi.org/10.3390/w12123403
Note that from the first issue of 2016, this journal uses article numbers instead of page numbers. See further details here.