Article

Evaluating the Impacts of Future Urban Expansion on Surface Runoff in an Alpine Basin by Coupling the LUSD-Urban and SCS-CN Models

1
Center for Human-Environment System Sustainability (CHESS), State Key Laboratory of Earth Surface Processes and Resource Ecology (ESPRE), Beijing Normal University, Beijing 100875, China
2
Faculty of Geographical Science, School of Natural Resources, Beijing Normal University, Beijing 100875, China
*
Author to whom correspondence should be addressed.
Water 2020, 12(12), 3405; https://doi.org/10.3390/w12123405
Submission received: 17 November 2020 / Revised: 1 December 2020 / Accepted: 2 December 2020 / Published: 3 December 2020
(This article belongs to the Section Hydrology)

Abstract

:
Effective evaluations of the future urban expansion impacts (UEI) on surface runoff in alpine basins are full of challenges due to the lack of reliable methods. Our objective was to provide a new approach by coupling the Land Use Scenario Dynamics-urban (LUSD-urban) and Soil Conservation Service-Curve Number (SCS-CN) models to estimate the future UEI on surface runoff. Taking the Qinghaihu-Huangshui basin (QHB) in the Tibetan Plateau, China, as an example, we first applied the SCS-CN model to quantify the surface runoff in 2000 and 2018 and analyzed the changes in surface runoff. Next, we applied the LUSD-urban model to simulate urban expansion under five localized shared socioeconomic pathways (SSPs) from 2018 to 2050. Finally, we assessed the UEI on surface runoff in the QHB from 2018 to 2050. We found that coupling the LUSD-urban and SCS-CN models could effectually evaluate the future UEI on surface runoff. Compared with the combination of the Future Land Use Simulation (FLUS) and SCS-CN models, our method reduced the absolute evaluation errors from 3.40% and 11.78% to 0.18% and 4.23%, respectively. In addition, the results showed that future urban expansion will have severe impacts on surface runoff in the valley region. For example, as a result of urban expansion, the surface runoff in the Huangzhong, Xining, and Datong catchments will increase by 4.90–9.01%, 4.25–7.36%, and 2.33–3.95%, respectively. Therefore, we believe that the coupled model can be utilized to evaluate the future UEI on surface runoff in alpine basins. In addition, the local government should pay attention to flood risk prevention, especially in the valley region, and adopt reasonable urban planning with soft and hard adaptation measures to promote the sustainable development of alpine basins under rapid urban expansion.

1. Introduction

The alpine basin is a basin with frozen soil, high altitude, and low temperature throughout the year. The alpine basin generally refers to an area with an average altitude above 1500 m and an annual temperature below 10 °C [1,2,3]. Due to its unique environmental characteristics, the alpine basin has poor self-regulation and restoration ability, and its ecological environment is highly vulnerable to human interference [4]. Surface runoff is the part of natural precipitation that flows through the surface after being absorbed by the soil or the ground and is evaporated in the air [5]. As an important part of the water cycle, surface runoff is a key index to measure the risk of flood and waterlogging disasters in the basin [6,7]. Due to rapid socioeconomic development, urbanization has become one of the important elements affecting surface runoff [8,9,10]. In the process of urban expansion, the newly added urban land will occupy cultivated land, forestland, and wetland, transform vegetated covers into sealed surfaces, weaken the infiltration capacity of water, and increase the surface runoff [11,12]. The changes in surface runoff caused by urban expansion have already led to flood disasters in alpine basins [13]. For example, in July 2010, a rare rainstorm flood occurred in the Huangshui basin, causing a total of 13 deaths, affecting 60,092 people, with a direct economic loss of 225 million yuan [14]. With the further promotion of urbanization in China, alpine basins will continue to experience high-speed urbanization in the future [15,16]. Therefore, effectively assessing the future urban expansion impacts (UEI) on surface runoff in alpine basins is of great importance to the prevention of flood disasters and sustainable urban development.
Recently, some researchers have assessed the UEI on surface runoff in alpine basins. Aghakhani et al. [17] estimated the UEI on surface runoff in the Taleqan basin of Iran from 1971 to 2003. Li et al. [18] estimated the UEI on surface runoff in the upper and middle reaches of the Heihe River basin in China from 2000 to 2008. According to urban expansion data from 1985 to 2000, Wang et al. [19] evaluated the UEI on surface runoff in the Taohe River basin, China. However, current studies still have two deficiencies. First, due to the lack of a reliable model to predict future urban expansion, existing studies mainly concentrate on assessing the historical UEI on surface runoff, and research on the future UEI on surface runoff is lacking. Second, because of the complex terrain of alpine basins and relatively few hydrological sites and observation data, existing studies could not accurately quantify the UEI on surface runoff.
The Land Use Scenario Dynamics-urban (LUSD-urban) model offers a useful tool for simulating future urban expansion. The LUSD-urban model is an urban expansion model that couples system dynamics and cellular automata [20]. This model can clearly reflect the macro and micro driving forces of land-use change, so it can effectually estimate the spatial process of urban expansion [20]. For example, Zhang et al. [21] projected urban expansion from 2014 to 2040 in the Beijing-Tianjin-Hebei urban agglomeration based on the LUSD-urban model. Song et al. [22] applied the LUSD-urban model to simulate urban expansion of the Hohhot-Baotou-Ordos-Yulin urban agglomeration from 2017 to 2050.
The Soil Conservation Service-Curve Number (SCS-CN) model offers an easy and simple way to quantify surface runoff in alpine basins. The SCS-CN model establishes a direct connection between the parameters of the hydrological model and remote sensing information and can obtain the surface runoff of each pixel based on land use data. Because the model requires limited hydrological data, it is widely used and can even be carried out in data-free basins [23,24]. For instance, Gregoretti et al. [25] accurately simulated the surface runoff in the North-Eastern Italian Alps from 2011 to 2014 based on the SCS-CN model. Hu et al. [26] utilized the SCS-CN model to assess the UEI on surface runoff in the central urban area of Beijing from 1984 to 2009. Therefore, coupling the LUSD-urban and SCS-CN models provides a solution to assess the UEI on surface runoff in alpine basins.
Thus, the purpose of this research was to evaluate the UEI on surface runoff in alpine basins by coupling the LUSD-urban and SCS-CN models. First, we selected the Qinghaihu-Huangshui basin (QHB) in the Tibetan Plateau, China, as an example and quantified the surface runoff changes from 2000 to 2018 based on the SCS-CN model. Second, we used the LUSD-urban model to estimate urban expansion from 2018 to 2050 by combining the localized shared socioeconomic pathways (SSPs). Finally, we assessed the UEI on surface runoff from 2018 to 2050 to provide assistance for sustainable urban development in alpine basins.

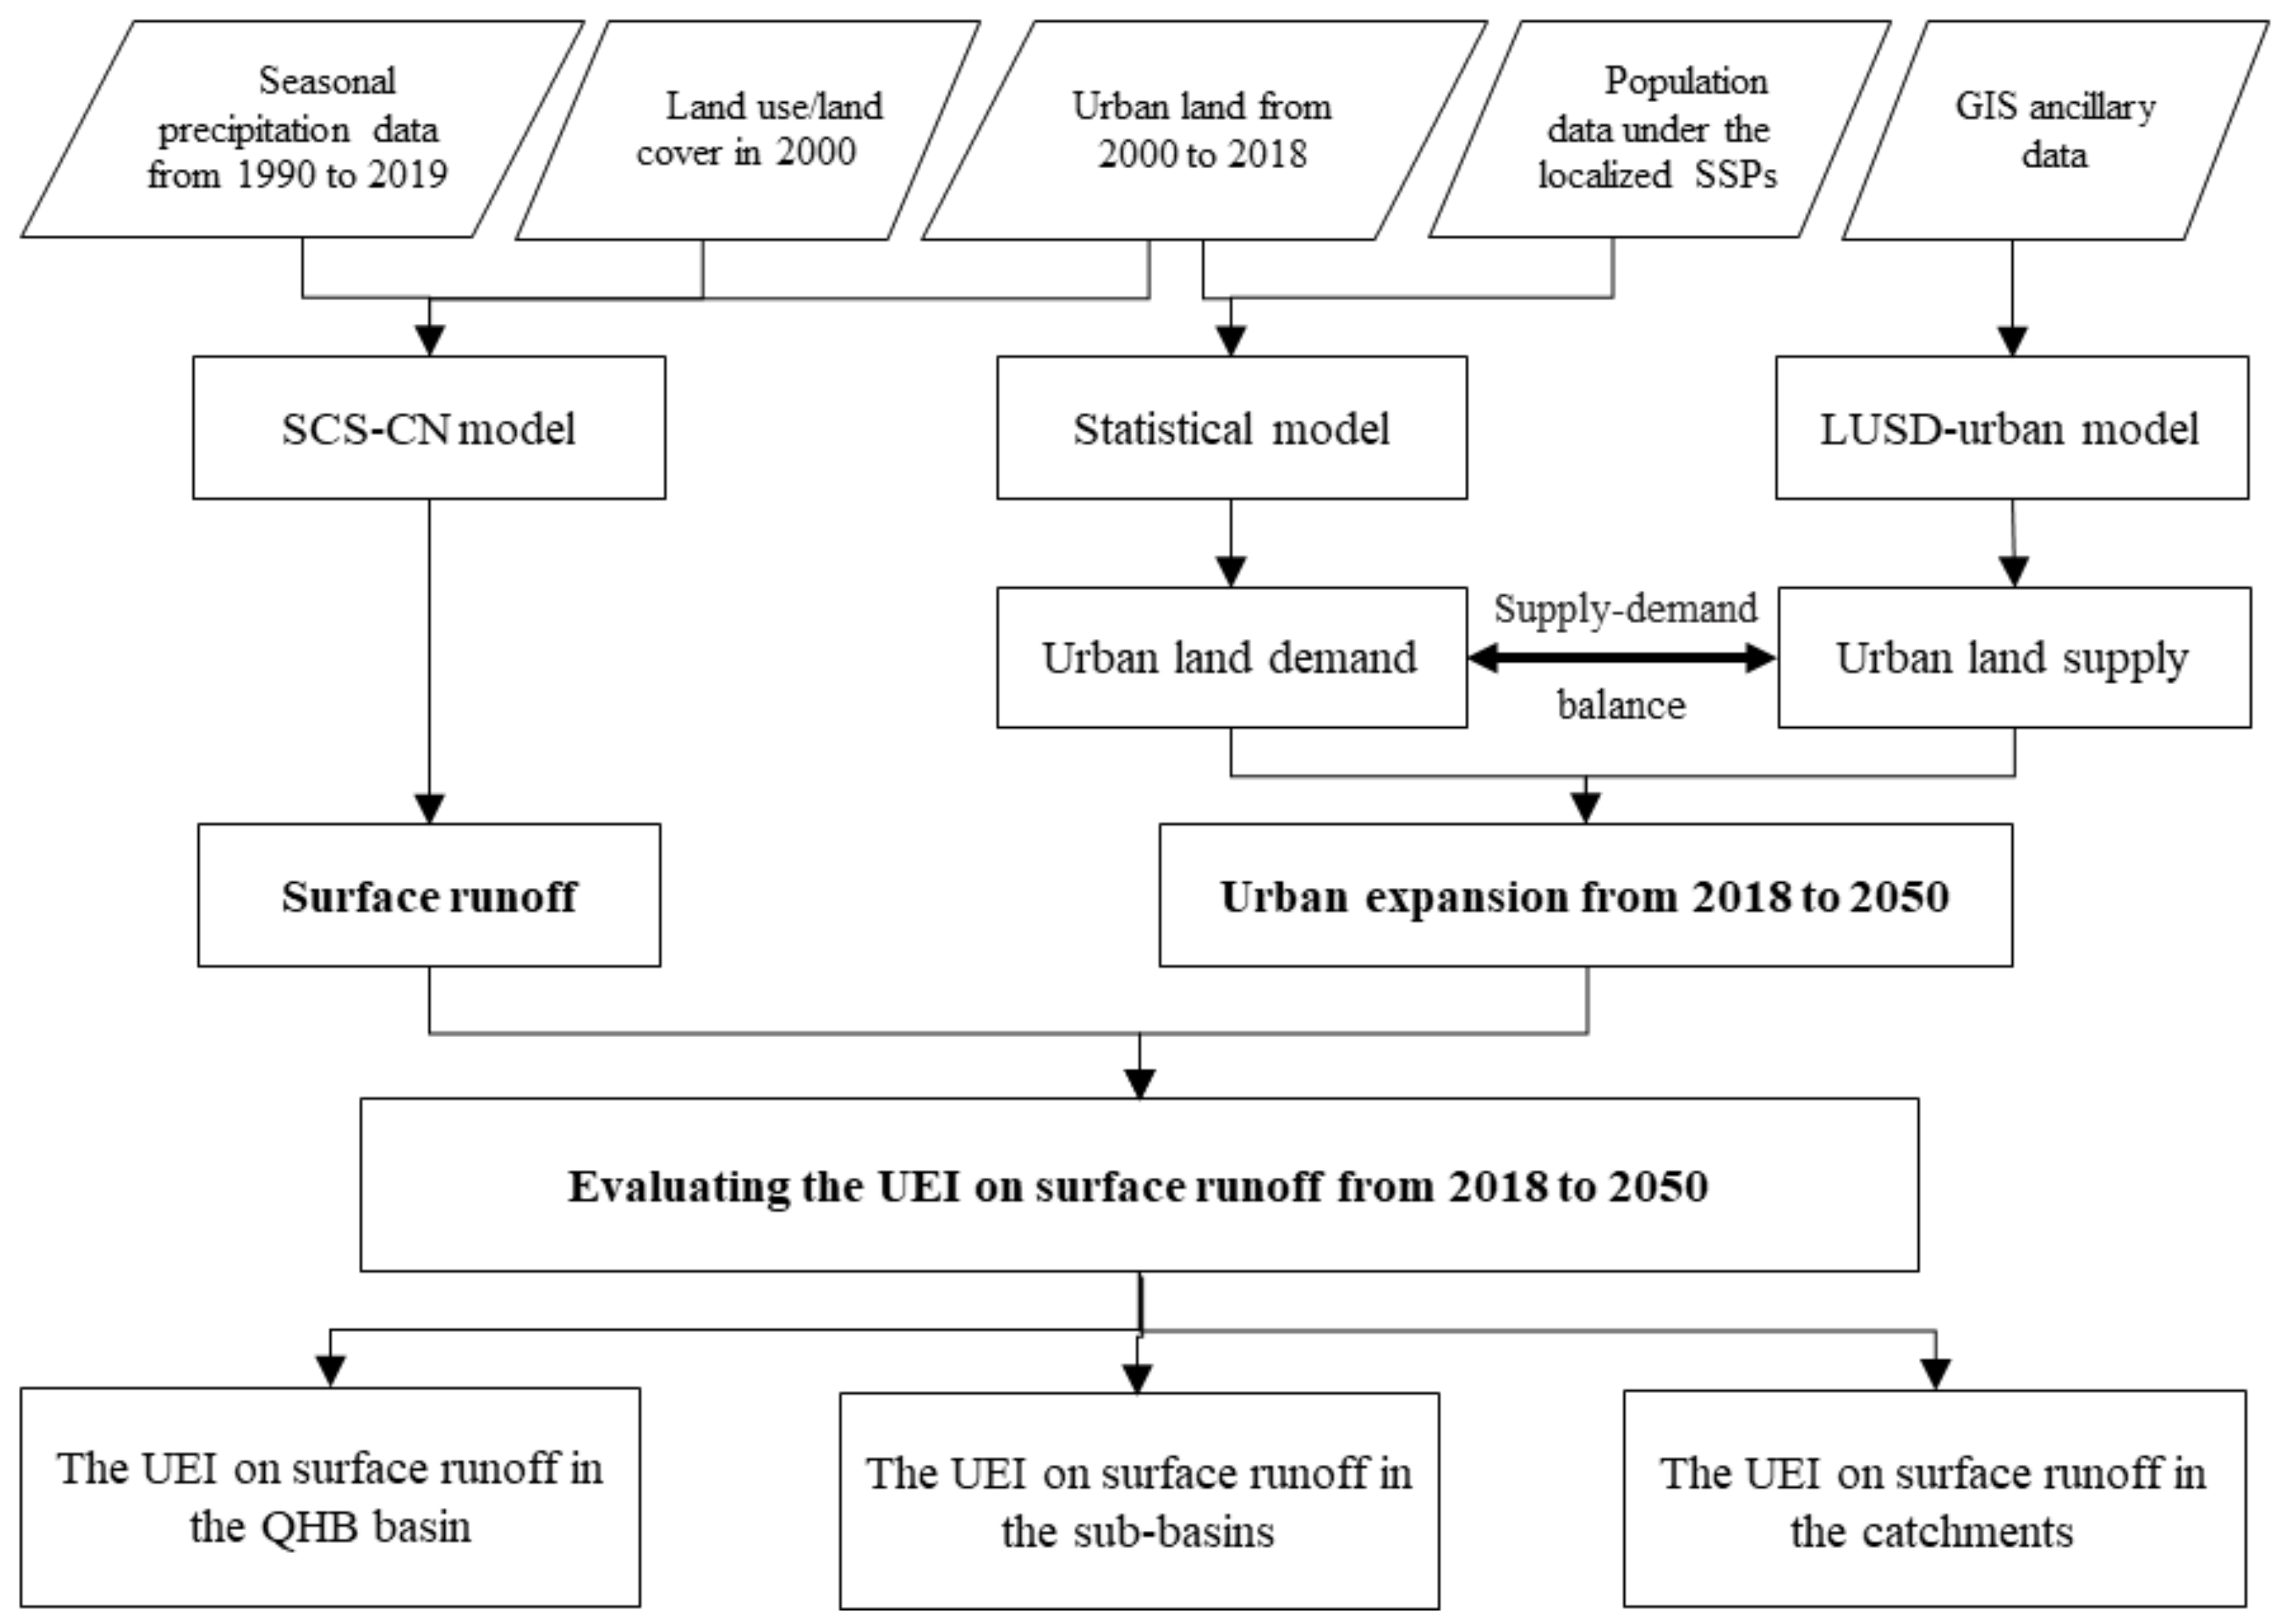
2. Materials and Methods
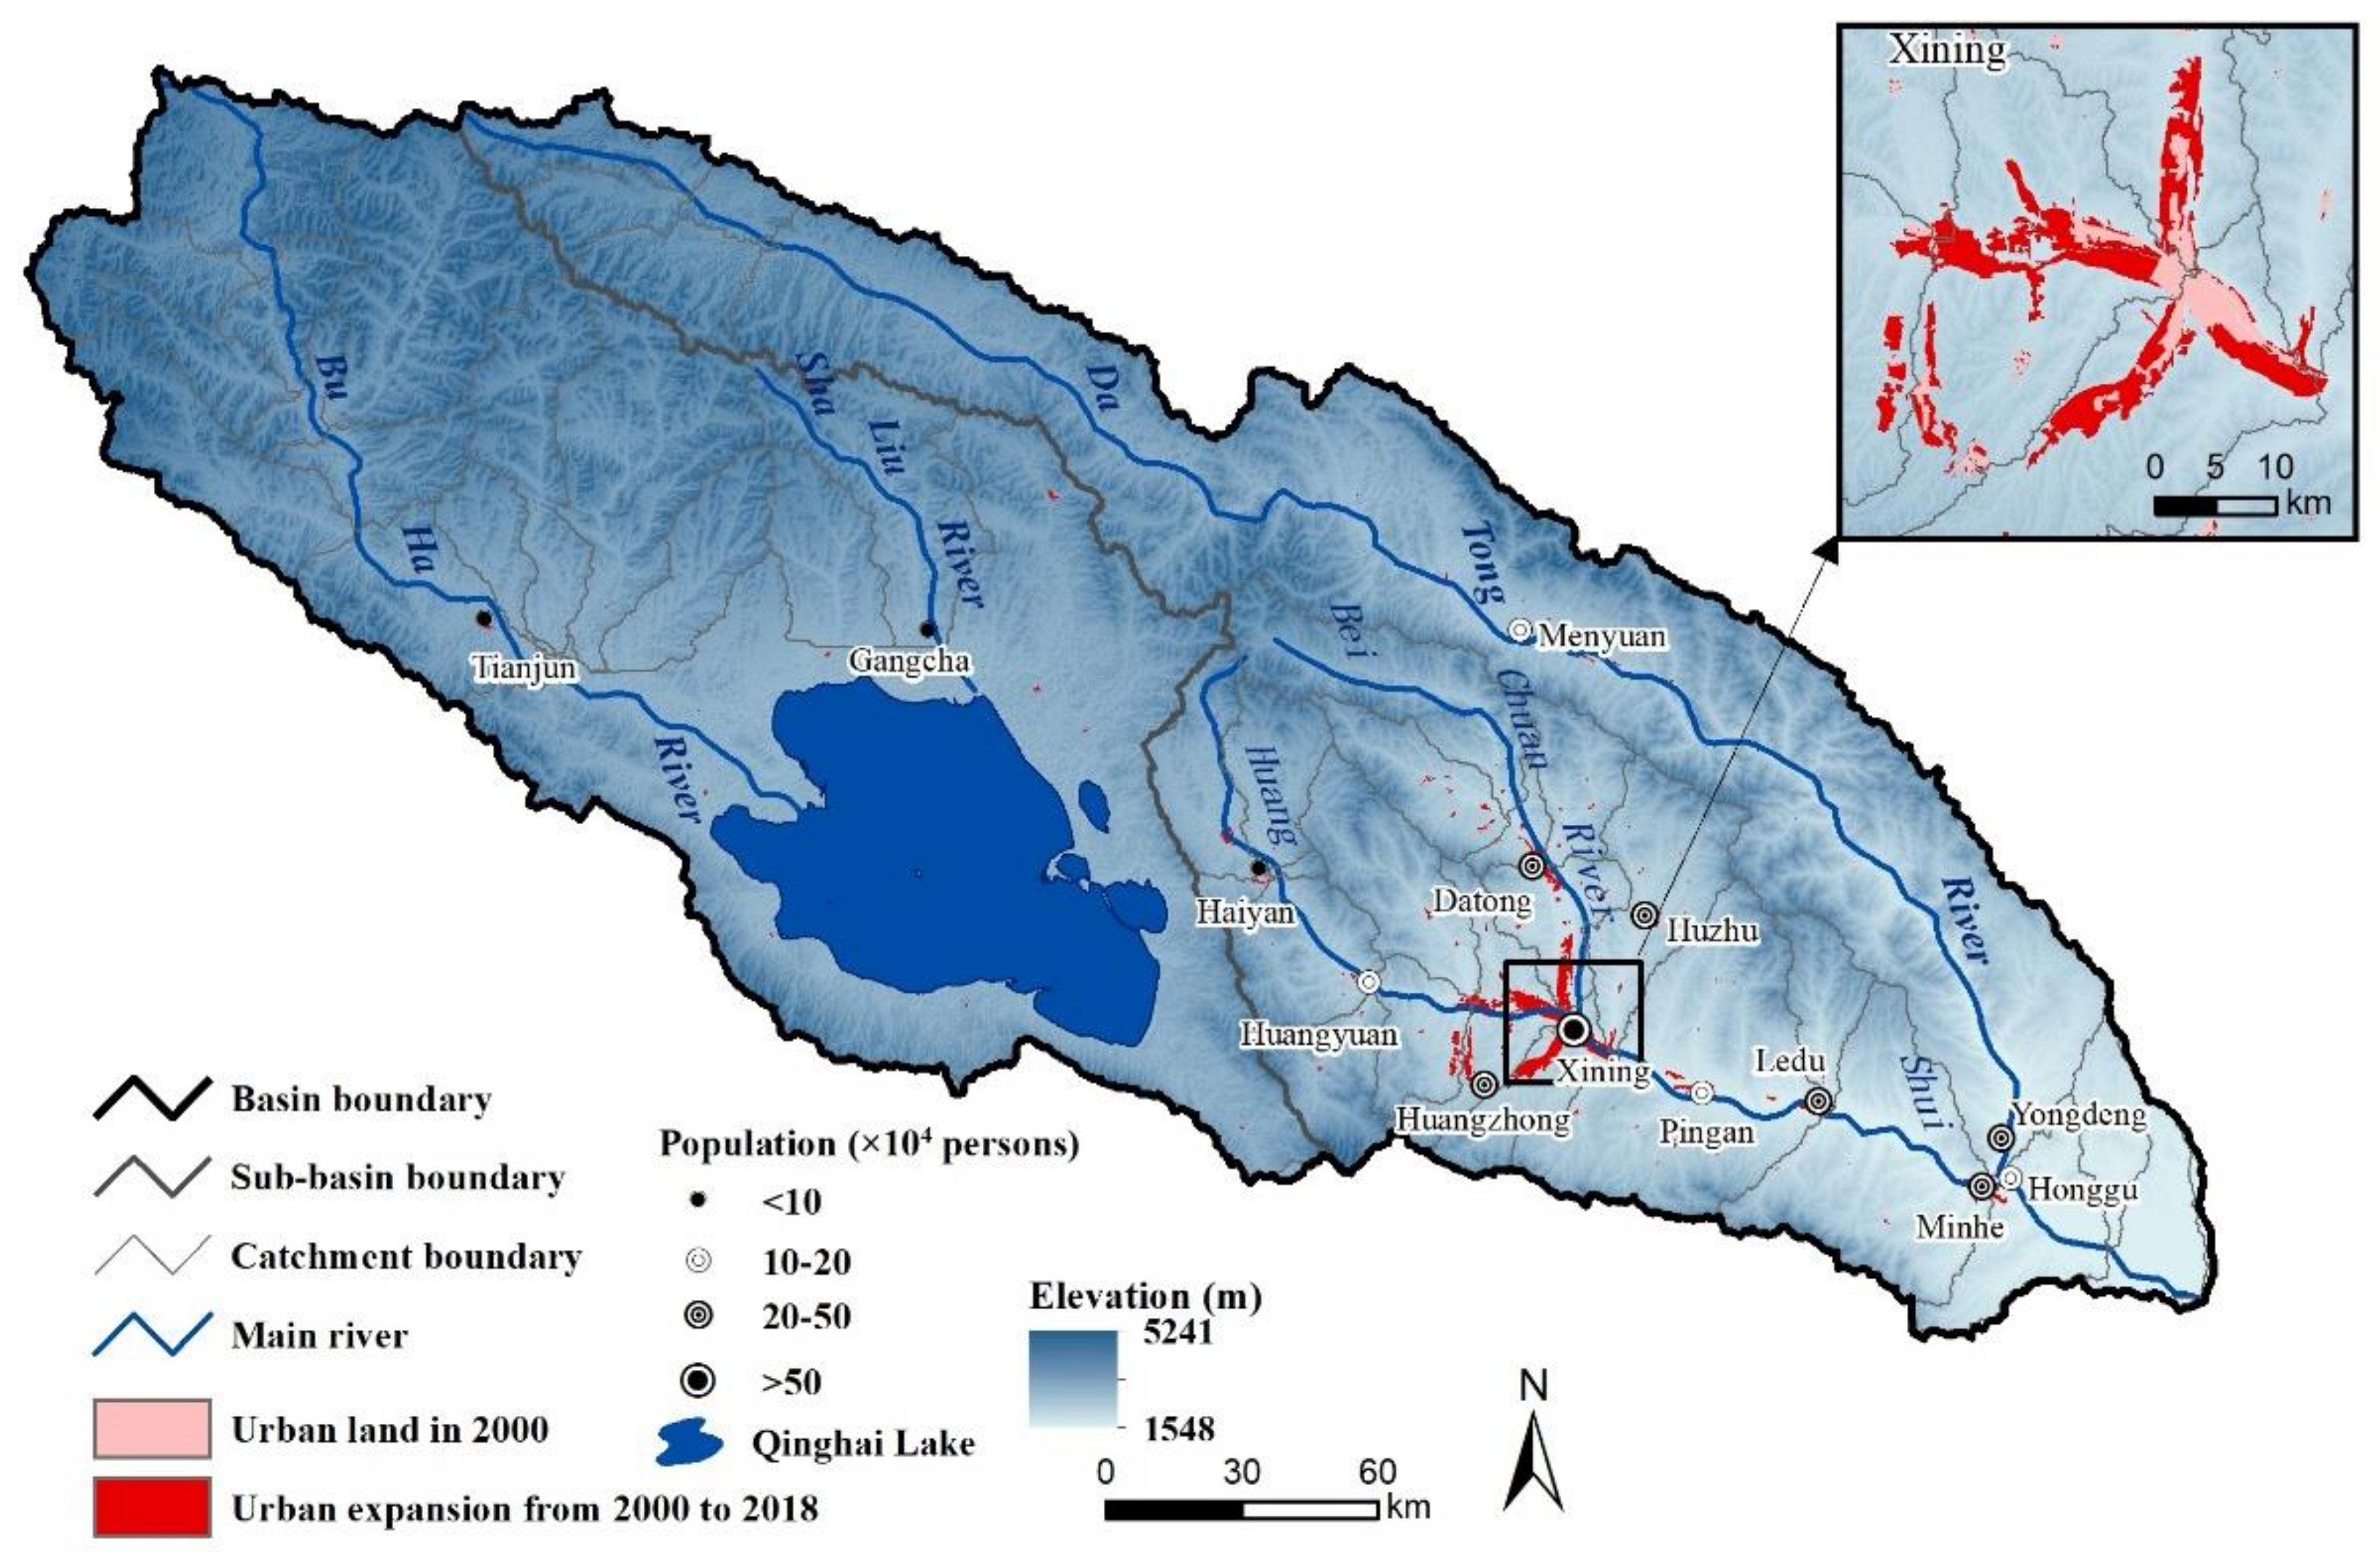
2.1. Study Area

The QHB is located in the northeast margin of the Tibetan Plateau, with a geographical location between 97°50′–103°15′ E and 36°15′–38°25′ N, covering an area of 6.25 × 10⁴ km2. The terrain of the basin is high in the northwest and low in the southeast, with an altitude range of 1548–5241 m (Figure 1). The climatic type of the basin is a semiarid, alpine, continental climate with arid, cold, and windy as its main characteristics. The multi-year average precipitation and temperature are 405.05 mm and 1.4 °C, respectively [27]. The precipitation is mainly concentrated in June-September, and the form of precipitation is mainly convective rain [28]. The basin includes the Qinghaihu sub-basin and Huangshui sub-basin. The Qinghaihu sub-basin is a typical alpine wetland natural protection area in the world that plays an important role in maintaining the water conservation and biodiversity service functions of the northeast Tibetan Plateau, as well as the regional ecological security [29]. The basin mainly includes the Buha River, the Shaliu River, the Datong River, the Beichuan River, and the Huangshui River. The QHB spans Qinghai and Gansu provinces, including 14 major cities. In 2018, the total population was approximately 3.75 million, among which there was one city with a total population of more than 0.5 million, six cities with the population of 0.2 million to 0.5 million, four cities with a population of 0.1 million to 0.2 million, and three cities with the population of less than 0.1 million.
The QHB has experienced rapid urbanization in recent years. In the two sub-basins, the urban area of the Qinghaihu sub-basin increased from 7.93 km2 in 1997 to 18.56 km2 in 2004, more than doubling [30]. The urban area of the Huangshui sub-basin increased by 75 km2 from 2000 to 2010, with an increase of approximately 25% [31]. In addition, the QHB is the main population and industrial gathering region of the Tibetan Plateau and one of the core areas for sustainable development. The area of the basin accounts for only 2.43% of the total area of the Tibetan Plateau, but its total population and gross domestic product (GDP) reached 30.50% and 33.95% in the region in 2017, respectively [32].

2.2. Materials

The Landsat remote sensing images were obtained from the United States Geological Survey (https://earthexplorer.usgs.gov/). The image data in 2000 and 2010 were from the Landsat Thematic Mapper (TM) sensor, and the image data in 2018 were from the Landsat Operational Land Imager (OLI) sensor, with a spatial resolution of 30 m. The 1:100,000 land use/cover data in 2000 were derived from the National Tibetan Plateau Data Center [33], and the resolution was 30 m after rasterization. The digital elevation model (DEM) data were obtained from the geospatial data cloud of the Computer Network Information Center, with a resolution of 30 m. The soil data were obtained from the National Tibetan Plateau Data Center [34], with a resolution of 1 km.
The precipitation data were derived from the China Meteorological Data Service Center (http://data.cma.cn), including monthly precipitation data from 1990 to 2019 at 39 stations located in the QHB and its surrounding area within 300 km. According to the study by Fang et al. [35] and the local rainfall characteristics, we applied the inverse distance weighting method to obtain the seasonal precipitation from June to September with a precipitation frequency of 50% from 1990 to 2019 in the basin as the precipitation input for the SCS-CN model.
The population data under the localized SSPs were obtained from China’s population data from 2010 to 2100 produced by Jiang et al. [36], with a resolution of 0.5°. The basic geographic information data included administrative boundaries, county-level locations, highways, railways, national highways, and rivers of the study area. The data were derived from the National Geographic Information Center. To ensure data consistency, all data adopted a unified Albers projection and were resampled to 30 m.

2.3. Quantifying Surface Runoff in 2000

According to Shi et al. [8], the surface runoff of each pixel was calculated by using the SCS-CN model (Figure 2).
The SCS-CN model is an empirical hydrological model, which is based on the hypothesis of equal proportion and the relationship between initial loss value and maximum potential retention at that time [24,37]. The runoff in the catchment was determined by rainfall and the maximum soil water storage before rainfall, and the maximum soil water storage was related to the soil texture, land use type, and degree of antecedent moisture condition (AMC). The calculation method of the SCS-CN model was constructed based on these relationships [37]. The computation formula is as follows
q i , x = P λ S i , x 2 P + 1 λ S i , x ,         P > λ S i , x 0 ,               P λ S i , x
where q i , x represents the annual surface runoff of pixel i in region x , P represents the seasonal precipitation from June to September with a precipitation frequency of 50% from 1990 to 2019. λ represents the initial abstraction ratio. According to Patil et al. [37], we selected the standard value of the initial abstraction ratio ( λ = 0.2) to calculate the surface runoff. S i , x is the maximum infiltration of the underlying surface of pixel i in region x , which is calculated from the Curve Number (CN) value [23]. The specific formula is as follows
S i , x = 10 × 2540 C N i , x 25.4
where C N i , x represents the CN value of pixel i in region x . The CN value refers to the parameter used to describe the rainfall-runoff relationship in the SCS-CN model and represents the runoff generation capacity of the underlying surface of the basin [38]. The size of the CN value was determined by the land use type, soil type, and AMC [24]. According to Yuan and Shi [38], when the AMC is AMCⅠ, according to the land use type and soil type of the QHB, the CN value of each pixel in the basin can be obtained by consulting the CN value look-up table [23,39]. Based on Yao et al. [40], according to the ratio of surface runoff to rainfall, surface runoff was divided into five grades, namely, low runoff (<0.35), low-medium runoff (0.35–0.5), medium runoff (0.5–0.6), high-medium runoff (0.6–0.7) and high runoff (>0.7).

2.4. Quantifying Urban Expansion from 2000 to 2018

2.4.1. Acquiring Urban Land Information

First, we used Landsat TM/OLI images to extract the urban land information of the QHB from 2000 to 2018 through visual interpretation. On the basis of Liu et al. [41], the urban land acquired in this study refers to the area dominated by man-made features (that is, more than 50% of the total area of the region) without vegetation cover, such as buildings, roads, airstrips, and industrial facilities. Then, according to the study of He et al. [42], we corrected the time series of urban land data. The specific formula is as follows
U L a , i = 0                                                                         U L a + 1 , i = 0                           1                                         U L a + 1 , i = 1 & U L a 1 , i = 1   U L a , i                                                                             o t h e r w i s e                                  
where U L a , i ,   U L a + 1 , i and U L a 1 , i represent whether pixel i is a city in the year a , a + 1 and a − 1; 1 means city, 0 means noncity.

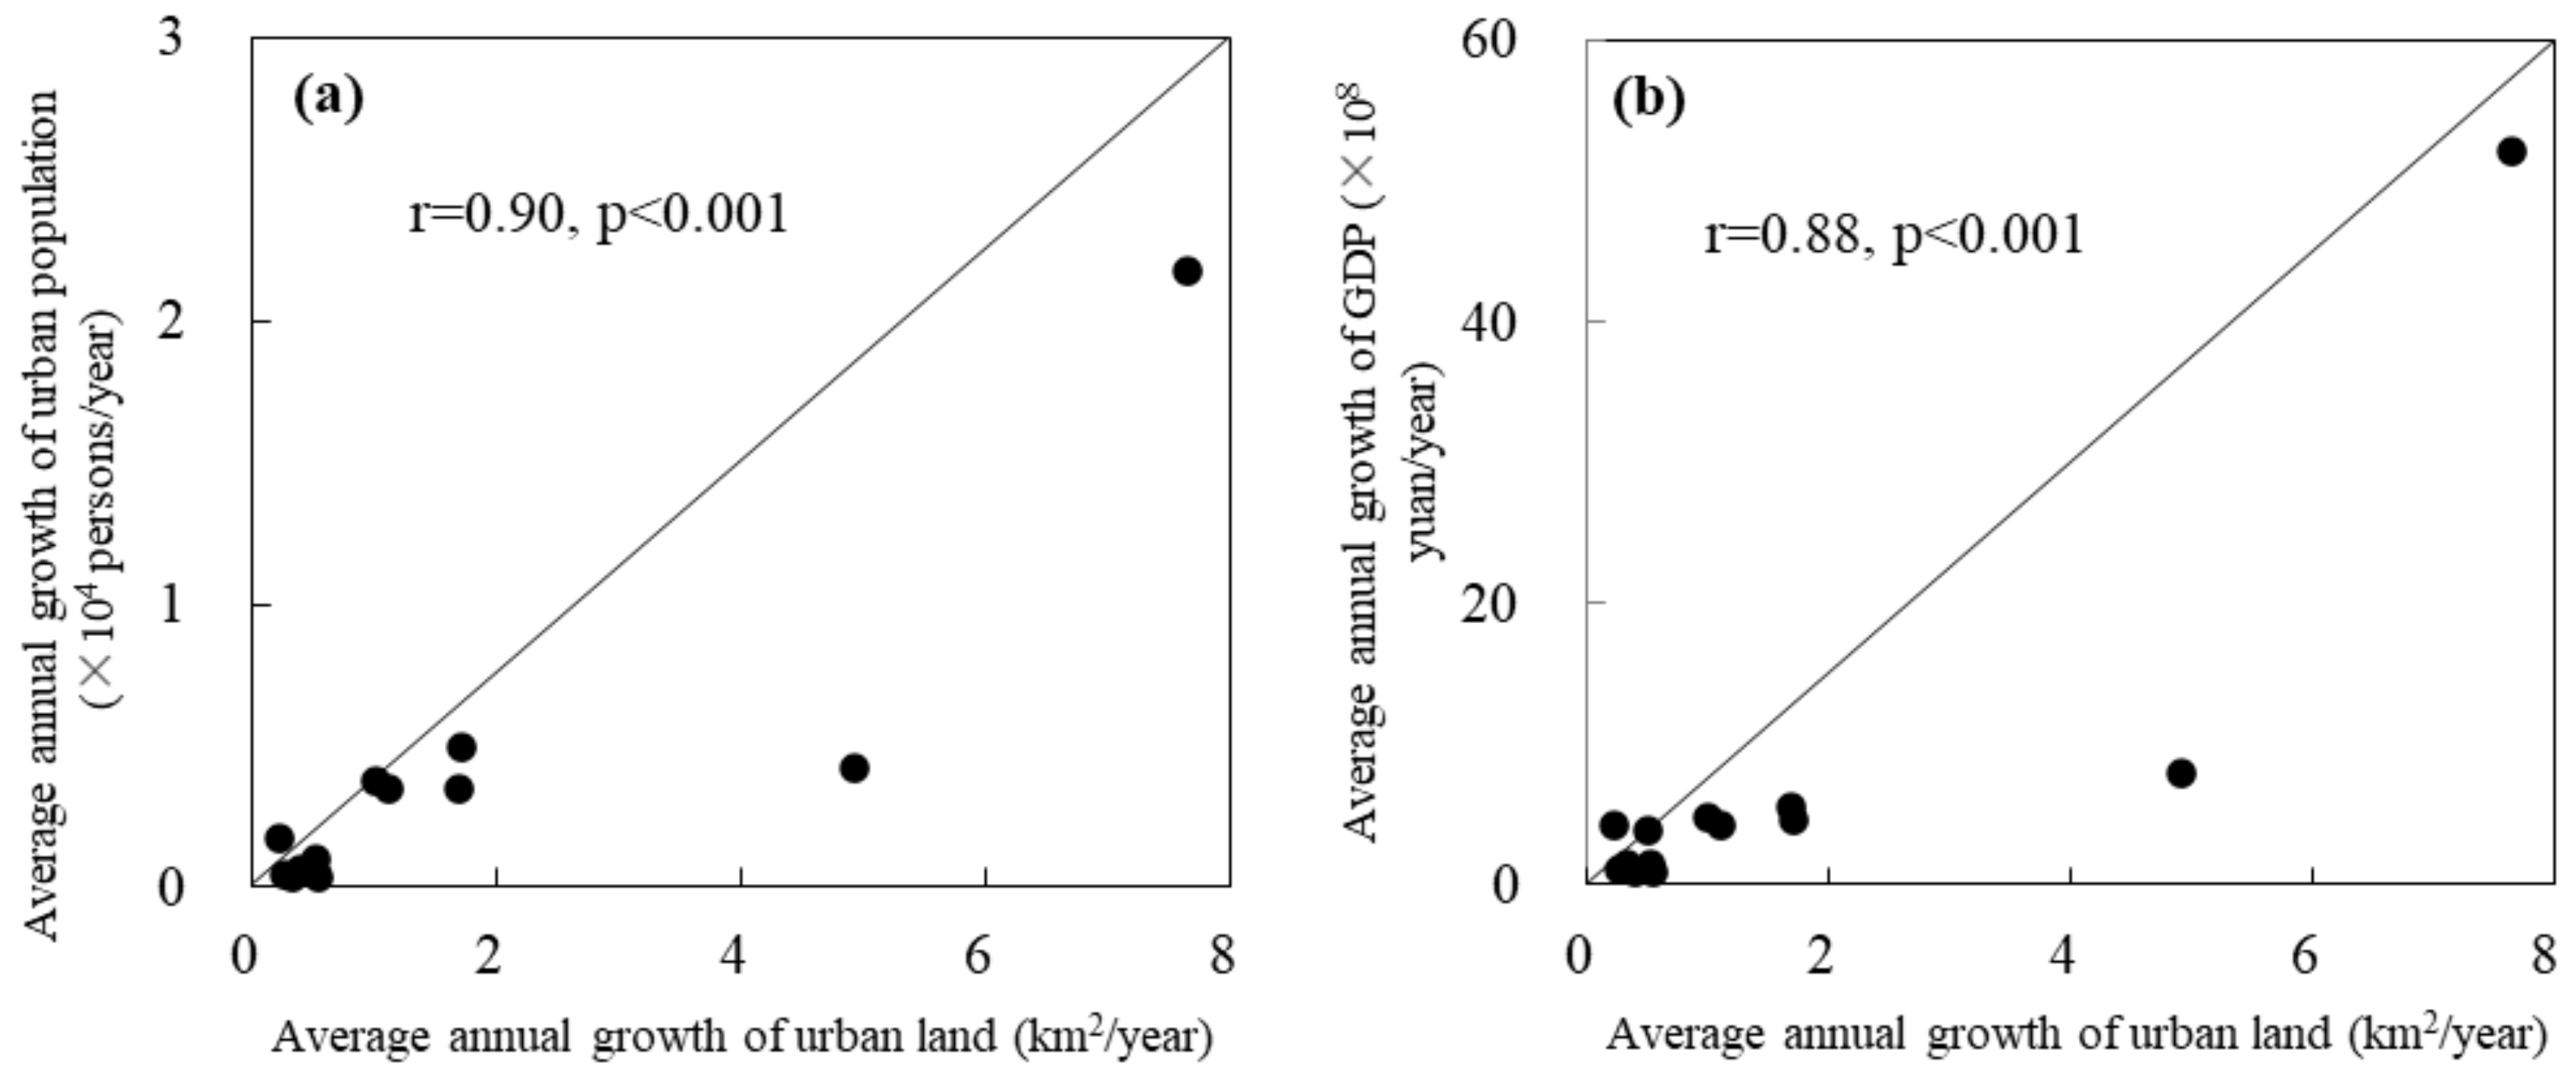
2.4.2. Analyzing Urban Expansion

According to the study of He et al. [42], we used the amount and rate of urban land change to analyze urban expansion. The calculation formula is as follows
Q = Q j Q i
where Q represents the amount of urban land change, Q j   and   Q i represent the urban land area in year j and year i , respectively.
R i , j = Q j Q i j i × 100 %
where R i , j represents the rate of urban land change from year i to j .

2.5. Modeling Urban Expansion from 2018 to 2050

2.5.1. Quantifying Urban Land Demand under Localized SSPs

The SSP concept is a socioeconomic scenario framework proposed by the Intergovernmental Panel on Climate Change (IPCC) in 2010 that describes the path of future socioeconomic development by considering multiple factors, including population, policy, economy, technology, resources, and environment [43]. However, the original SSPs have deficiencies in future population estimation, which makes it impossible to reliably project future urban expansion [22]. Localized SSPs refer to the improvement of the simulation results of the original SSPs based on the newly released socioeconomic data and related policies of different countries under the original SSPs framework to improve the reliability of the population and economic indicators under the SSPs [36]. For instance, Jiang et al. [36] utilized China’s 2010 population data to re-estimate the population of China from 2010 to 2100 under the SSPs framework on the basis of a comprehensive consideration of China’s total population fertility rate data from 2011 to 2014, two-child policy and household registration policy.
According to He et al. [44] and Zhang et al. [21], we first took the urban land area from 2000 to 2018 as the independent variable and a historical total population of the QHB as the dependent variable to construct a linear regression equation.
y = 4.4 x 1478.5
The R2 of the regression equation was 0.96, and the p < 0.005. Then, the total population from 2018 to 2050 under five localized SSPs (i.e., SSP1, SSP2, SSP3, SSP4, and SSP5) was calculated. Finally, we utilized the regression equation to calculate the urban land demand from 2018 to 2050 under the localized SSPs in the QHB (Table 1).

2.5.2. Estimating Urban Expansion: 2018 to 2050

According to the study of He et al. [44], the LUSD-urban model was applied to carry out the spatial allocation of urban land. First, the model needed to be corrected and verified to undertake the accuracy of the model simulation. Specifically, the land use data and impact factor data in 2000 were input into the model to simulate the urban land data in 2010, and 500 simulation results were obtained. Then, the results were compared with the actual urban land data in 2010, and the weight combination corresponding to the best Kappa coefficient was selected (Table 2). Similarly, using the data in 2010 as input, we simulated the spatial distribution of urban land in 2018. Next, the model was tested with the actual urban land data in 2018, and the weight combination corresponding to the best Kappa coefficient was selected (Table 2). Finally, we used the adjusted and tested LUSD-urban model to allocate space for urban land in the QHB from 2018 to 2050.

2.6. Evaluating the UEI on Surface Runoff

Based on the research of Shi et al. [23], we used the rate of change in surface runoff to characterize the UEI on surface runoff. The specific formula is as follows
Q x i j = Q x j Q x i Q x i × 100 %
where Q x i j represents the rate of change in surface runoff caused by the urban expansion in region x from year i to j, Q x i represents the surface runoff of region x in year i, and Q x j represents the surface runoff of region x in year j. The surface runoff of region x is calculated by the surface runoff of each pixel using the arithmetic average method [8]. The calculation formula is as follows
Q x = 1 n q 1 , x + q 2 , x + + q n , x n
where Qx represents the surface runoff of region x, n is the total number of pixels in region x, and q1,x…qn,x represents the surface runoff of each pixel in region x. Finally, according to the research of Sun et al. [45], the UEI on surface runoff were divided into three categories, namely, light (0–0.05%/10a), moderate (0.05%/10a–0.2%/10a), and severe (>0.2%/10a), according to the runoff change rate per decade.

3. Results

3.1. The UEI on Surface Runoff from 2000 to 2018

There was high spatial heterogeneity in the distribution of surface runoff in the QHB in 2000. The surface runoff of the whole basin was dominated by low and low-medium runoff, covering 1.96 × 10⁴ km2 and 3.15 × 10⁴ km2, occupying 31.40% and 34.43% of the basin, respectively. Specifically, the low runoff was mainly located in the middle and northeast, while the low-medium runoff was mainly concentrated in the middle and southeast. In the two sub-basins, the surface runoff in the Qinghaihu sub-basin mainly included low and low-medium runoff, which accounted for 28.65% and 26.72% of the sub-basin, respectively. The low runoff was mainly located in the middle, while the low-medium runoff was distributed around the sub-basin. In the Huangshui sub-basin, low and low-medium runoff were the main types, accounting for 33.82% and 41.38% of the sub-basin, respectively. The low runoff was mainly located in the north, while the low-medium runoff was mainly concentrated in the south. Among all catchments, the surface runoff was dominated by low-medium runoff. There were 36 catchments reaching low-medium runoff, accounting for 72.52% of the total catchment area (Figure 3 and Table 3).
The QHB experienced rapid urban expansion from 2000 to 2018. The urban land area of the whole basin increased from 135.49 km2 to 410.85 km2, with an annual growth rate of 11.29% (Figure 4 and Table 4). The newly added urban land from 2000 to 2018 was mainly distributed in the Huangshui sub-basin. Specifically, the newly added urban land in the Huangshui sub-basin was 264.57 km2, accounting for 96.08% of the total expanded area (Table 4). Among all catchments, the newly added urban land was mainly distributed in the Xining, Huangzhong, Datong, and Pingan catchments. The newly increased areas were 68.23 km2, 52.73 km2, 34.51 km2, and 24.59 km2, accounting for 24.78%, 19.15%, 12.53%, and 8.93% of the total expanded area, respectively (Table 4).
Urban expansion from 2000 to 2018 had little effect on surface runoff throughout the basin but had severe impacts on some catchments. Throughout the basin, the surface runoff was basically stable under the UEI from 2000 to 2018, which only changed from 97.02 mm to 97.10 mm, with a change of 0.08%. In the two sub-basins, the surface runoff of the Qinghaihu and Huangshui sub-basins was also stable, with a change of 0.01% and 0.16%, respectively. In particular, urban expansion led to a massive increase in surface runoff in the Huangzhong, Xining, and Datong catchments. These catchments are all located in the flat and low-lying valley region. Among them, the surface runoff in the Huangzhong catchment increased from 87.15 mm in 2000 to 89.05 mm in 2018, with an increase of 2.18%, reaching 23.92 times the average increase in the QHB. In the Xining catchment, the growth of surface runoff was 1.84 mm, with an increase of 2.10%, which was 23.14 times the average level throughout the basin. The surface runoff in the Datong catchment increased by 0.79%, which was 10.05 times the level throughout the basin (Figure 5 and Table 5).

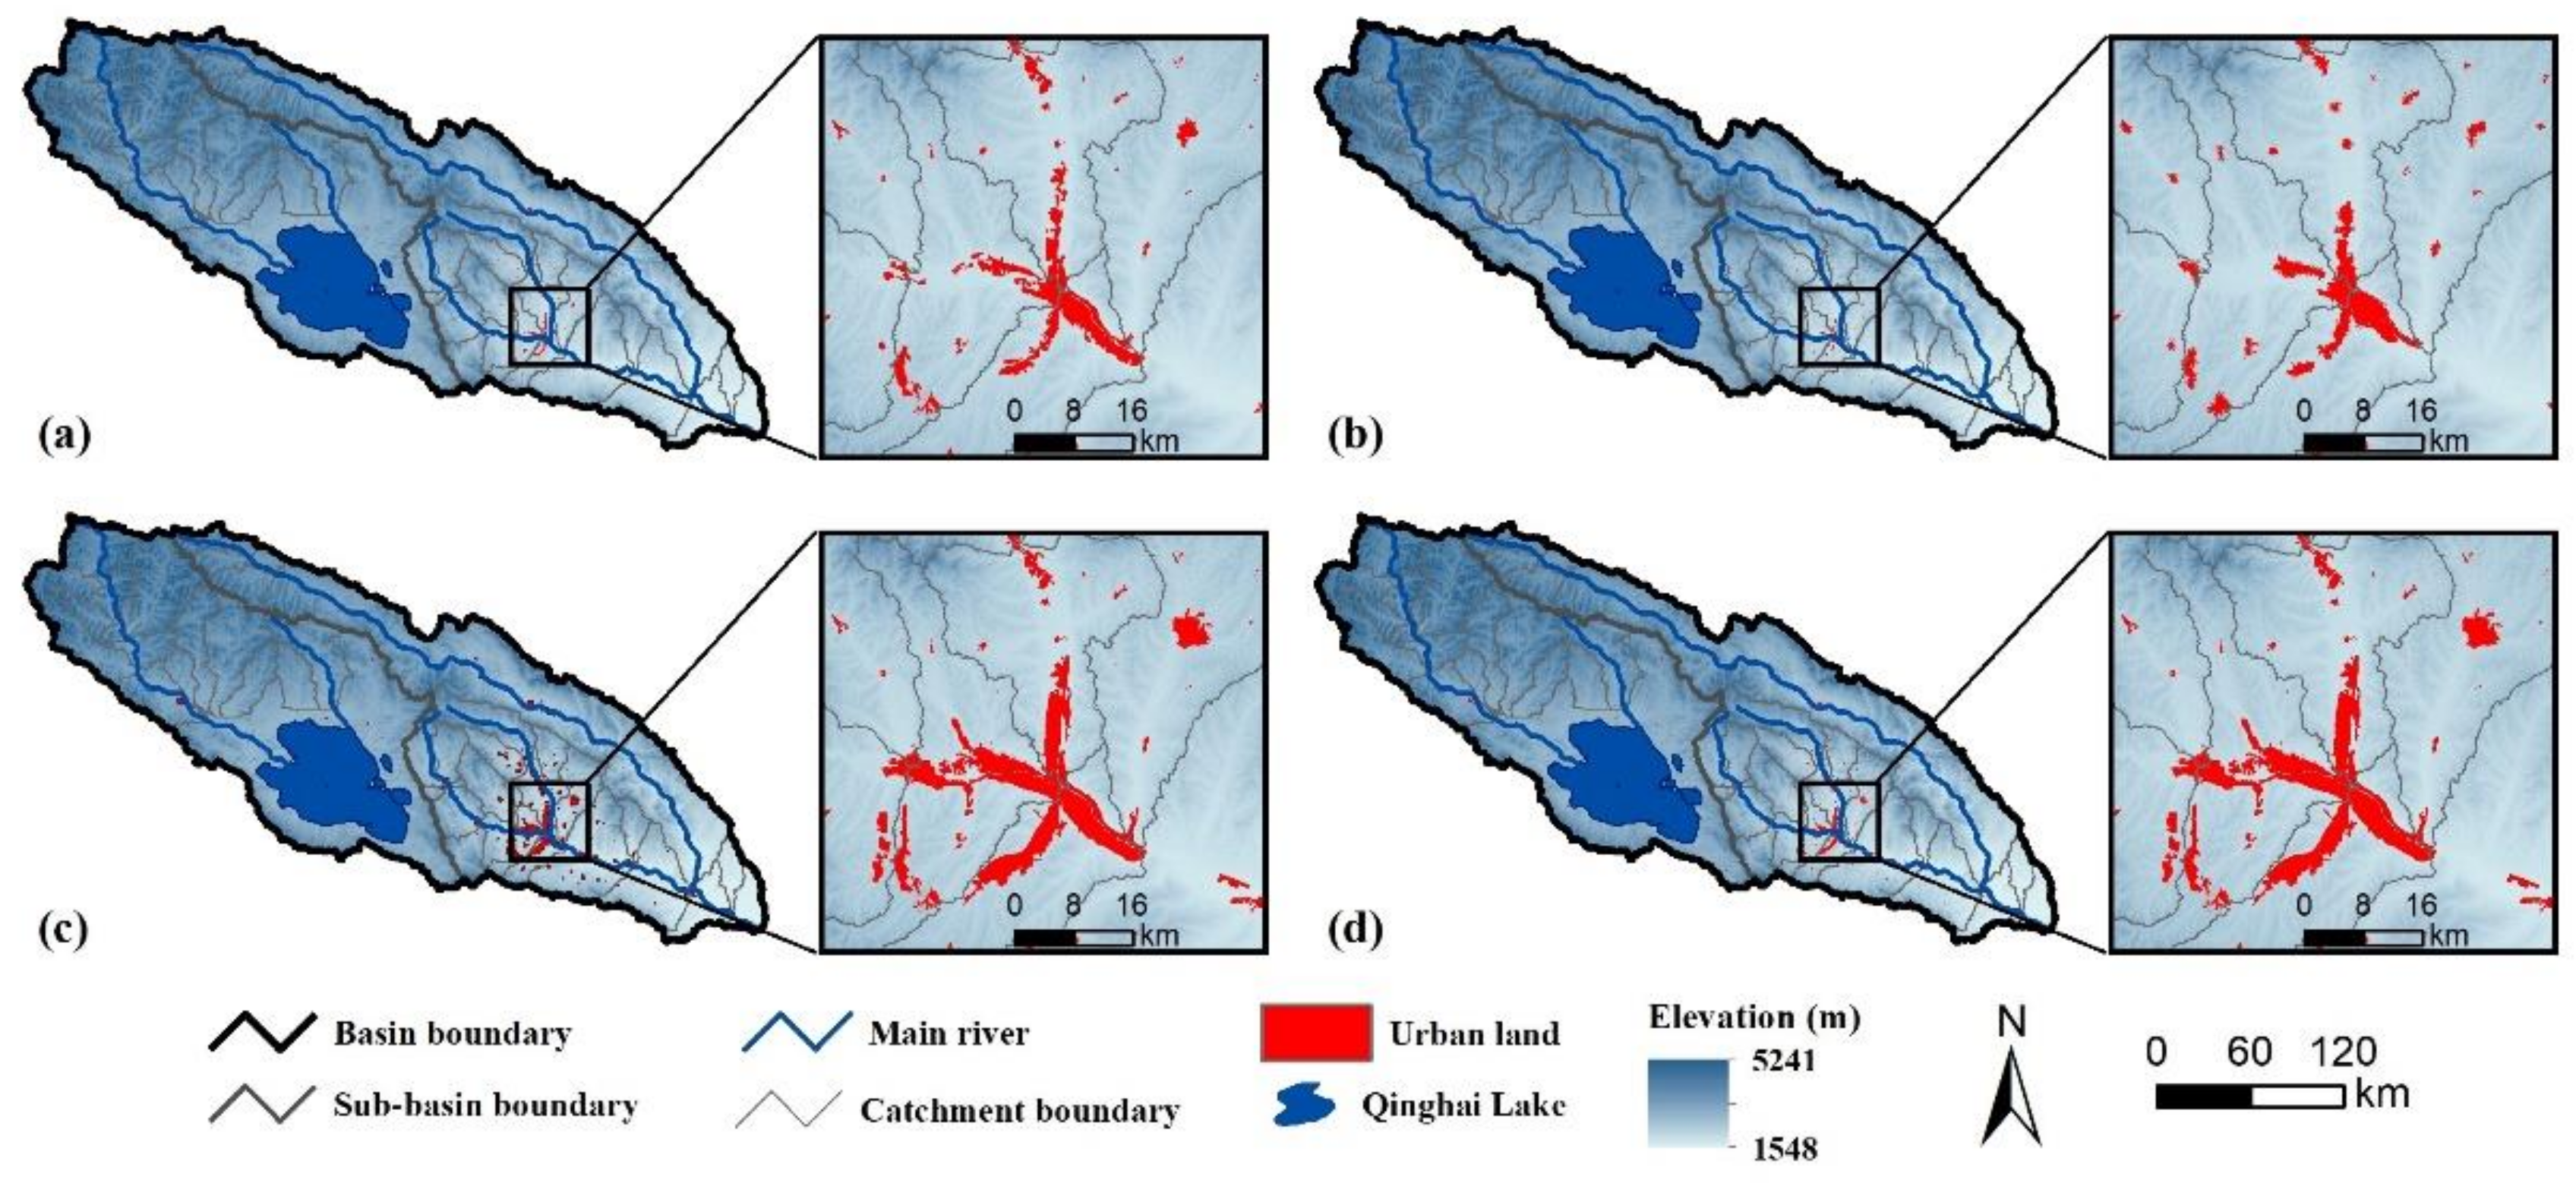
3.2. Urban Expansion from 2018 to 2050

The simulation results showed that the best Kappa coefficient were 0.65 and 0.71 for urban expansion during the periods of 2000–2010 and 2010–2018, respectively. These results suggest that the LUSD-model is reliable for simulating the spatial process of urban expansion (Figure 6).
Based on the model, the QHB will keep on experiencing rapid urban expansion from 2018 to 2050. Among the five localized SSPs, the area of urban land expansion under SSP3 will be the largest. Under localized SSP3, the urban land area will increase from 410.85 km2 to 1152.82 km2, with an average annual growth rate of 5.65%. Under localized SSP4, the expansion area will be the smallest. The area of urban land will increase by 418.62 km2, with a mean annual growth rate of 3.18% (Figure 7, Table 6).
The newly added urban land from 2018 to 2050 will still be primarily distributed in the Huangshui sub-basin. Under the five localized SSPs, the urban land in the Huangshui sub-basin will increase by 404.16–717.56 km2, accounting for 96.55–96.71% of the newly added urban land in the entire basin. In all catchments, the newly added urban land will still be mainly distributed in the Xining, Pingan, Datong, and Huangzhong catchments. The newly added area will be 69.05–118.65 km2, 46.81–77.65 km2, 41.61–68.96 km2, and 49.03–95.77 km2, occupying 16.00–16.49%, 11.71–12.91%, 10.47–11.18%, and 9.29–9.94% of the total expansion area, respectively (Table 6).

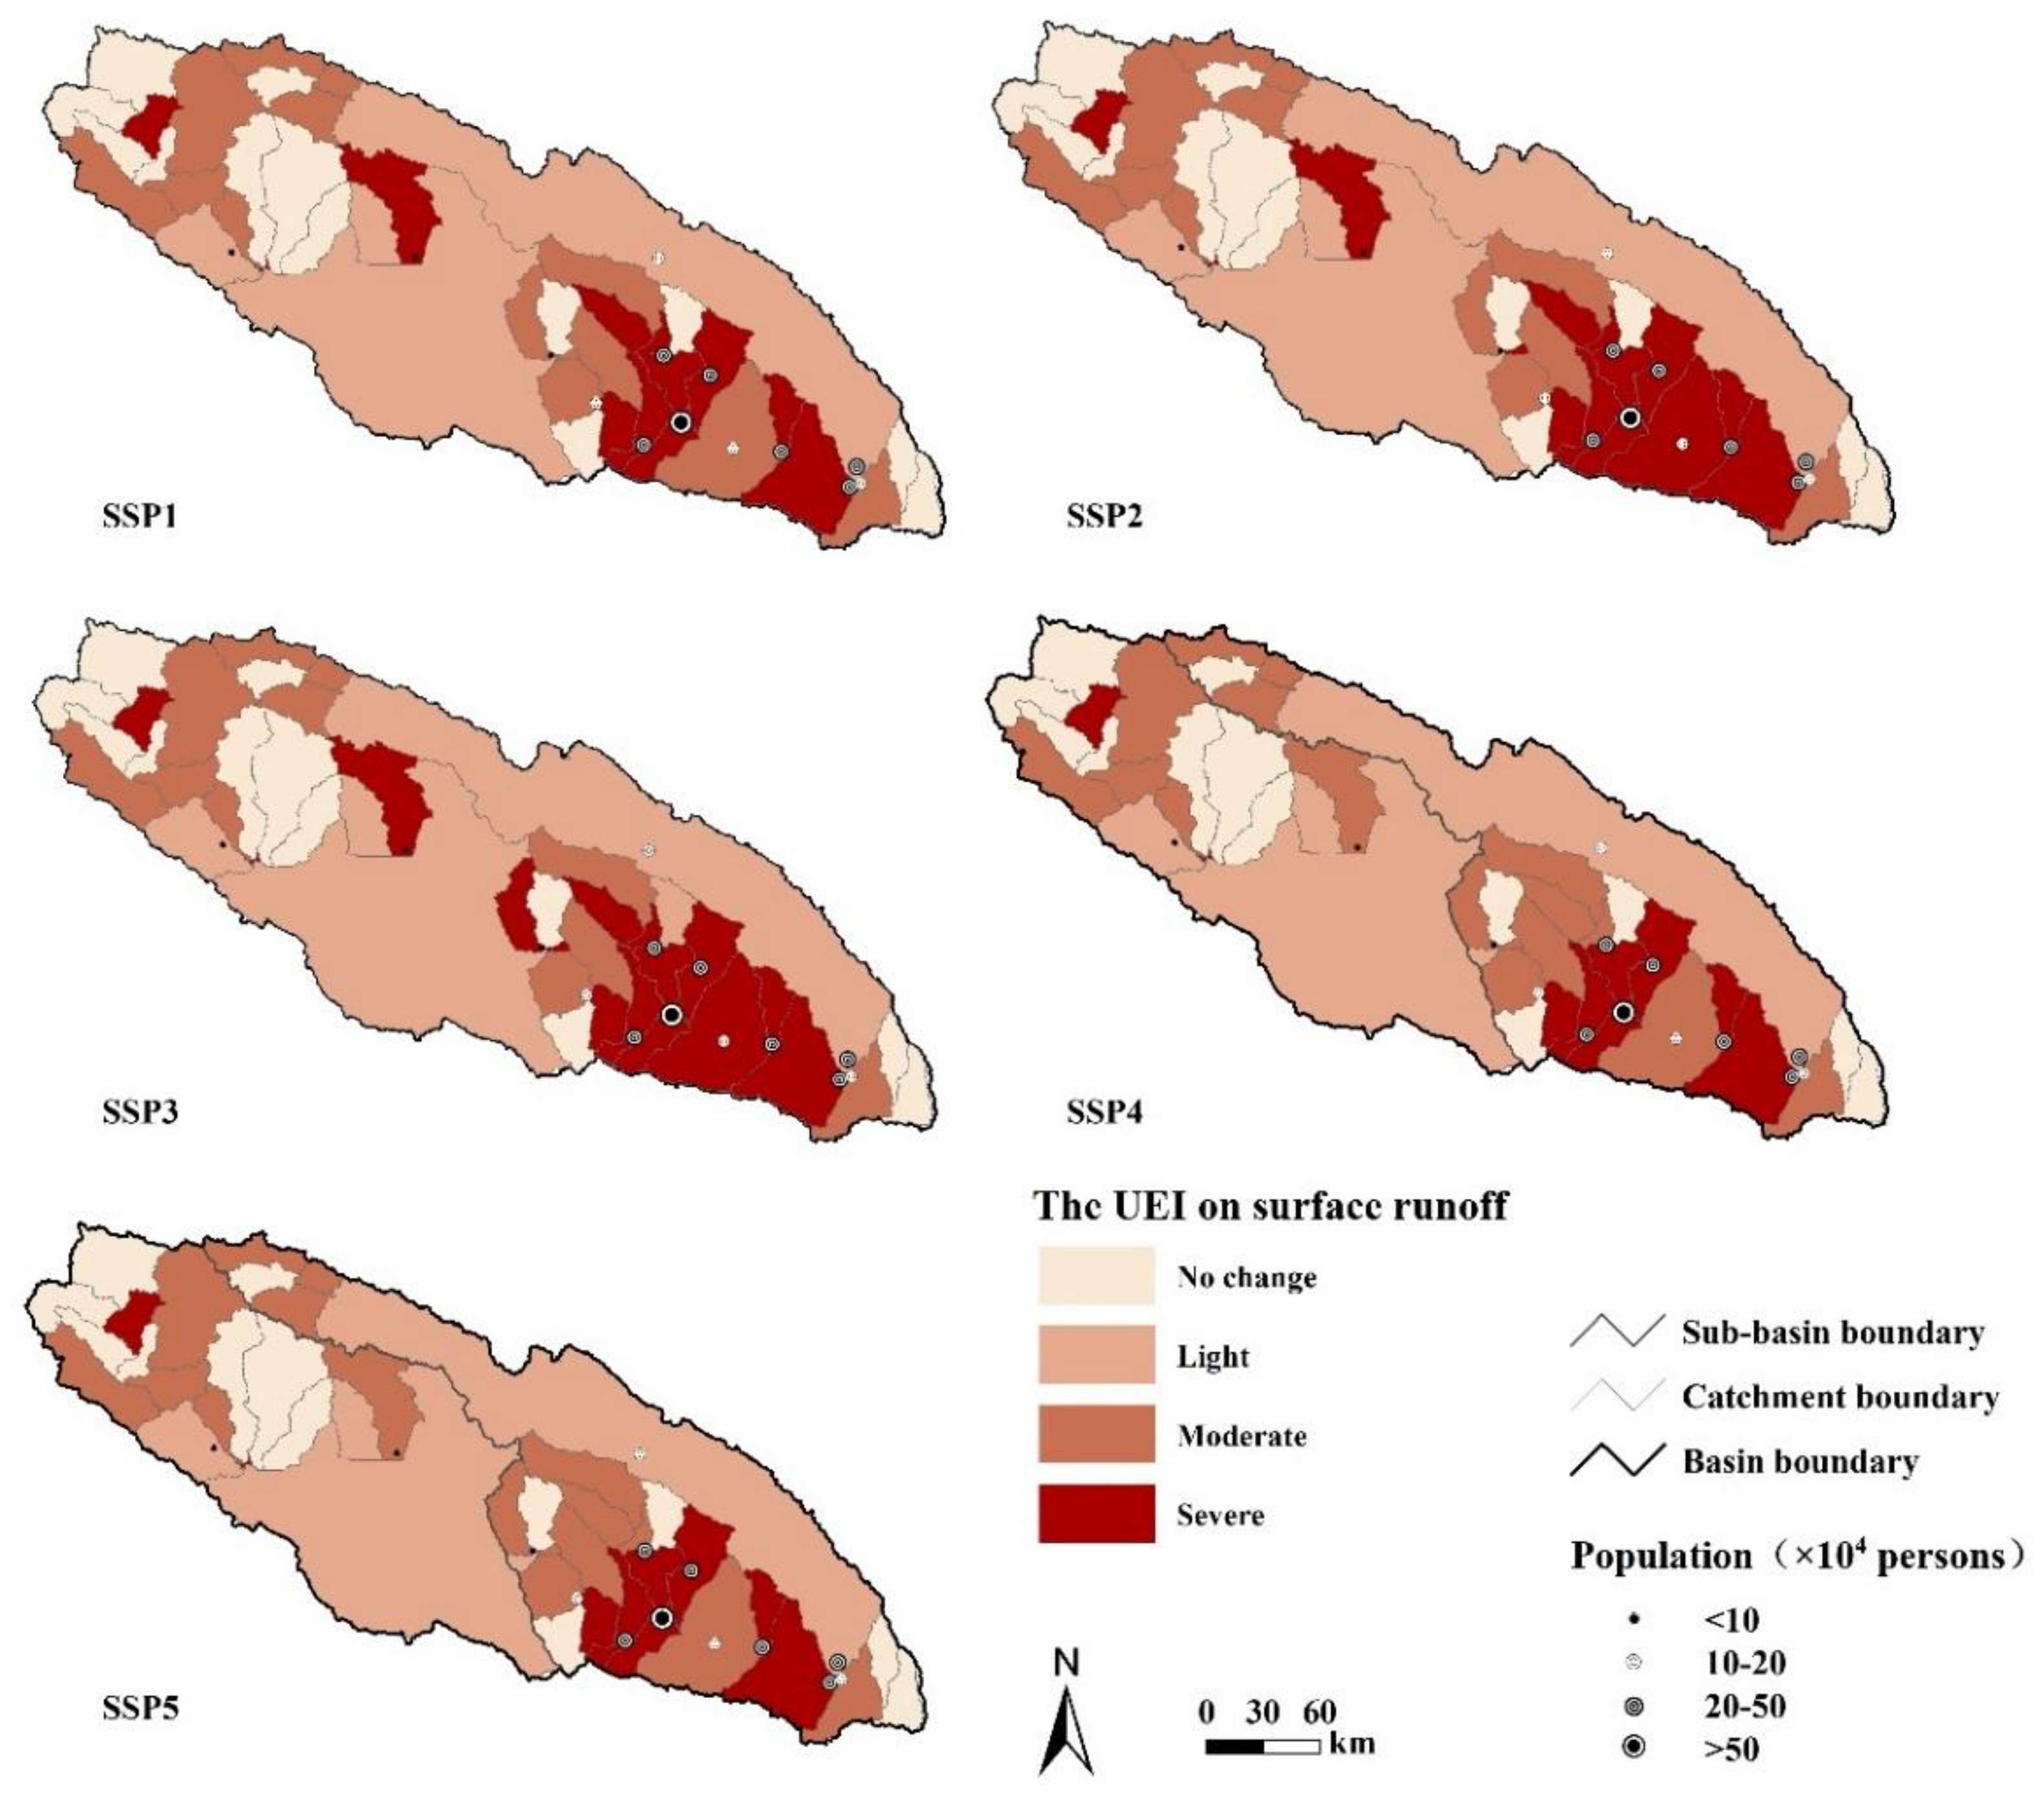
3.3. The UEI on Surface Runoff from 2018 to 2050

Based on the model, urban expansion will lead to little increase in surface runoff from 2018 to 2050. Throughout the basin, urban expansion will cause the average surface runoff to increase from 97.10 mm to 97.41–97.62 mm, with a growth rate of 0.33–0.54%. In the five localized SSPs, urban expansion under localized SSP3 will have the greatest impact, with a mean annual growth rate of 3.90 times that from 2000 to 2018. In the sub-basin, urban expansion will increase the surface runoff of the Qinghaihu and Huangshui sub-basins by 0.17–0.18% and 0.50–0.93%, respectively. Similarly, urban expansion under localized SSP3 will have the greatest impact. The average annual surface runoff growth of the Qinghaihu and Huangshui sub-basins will be 10.21 times and 3.45 times the historical impact, respectively (Figure 8 and Table 7).
Urban expansion from 2018 to 2050 will have severe impacts on the surface runoff of some catchments in the valley region. Specifically, the Huangzhong, Xining, and Datong catchments will be most severely affected by urban expansion, with surface runoff increasing by 4.90–9.01%, 4.25–7.36% and 2.33–3.95%, respectively. Under all scenarios, urban expansion under localized SSP3 will have the most severe impact on the catchments. Among them, the average annual increase in surface runoff caused by urban expansion in the Huangzhong catchment will be 2.51 times its historical impact. The annual increase in surface runoff in the Xining and Datong catchments will reach 2.13 and 2.99 times, respectively (Figure 8 and Table 7).

4. Discussion

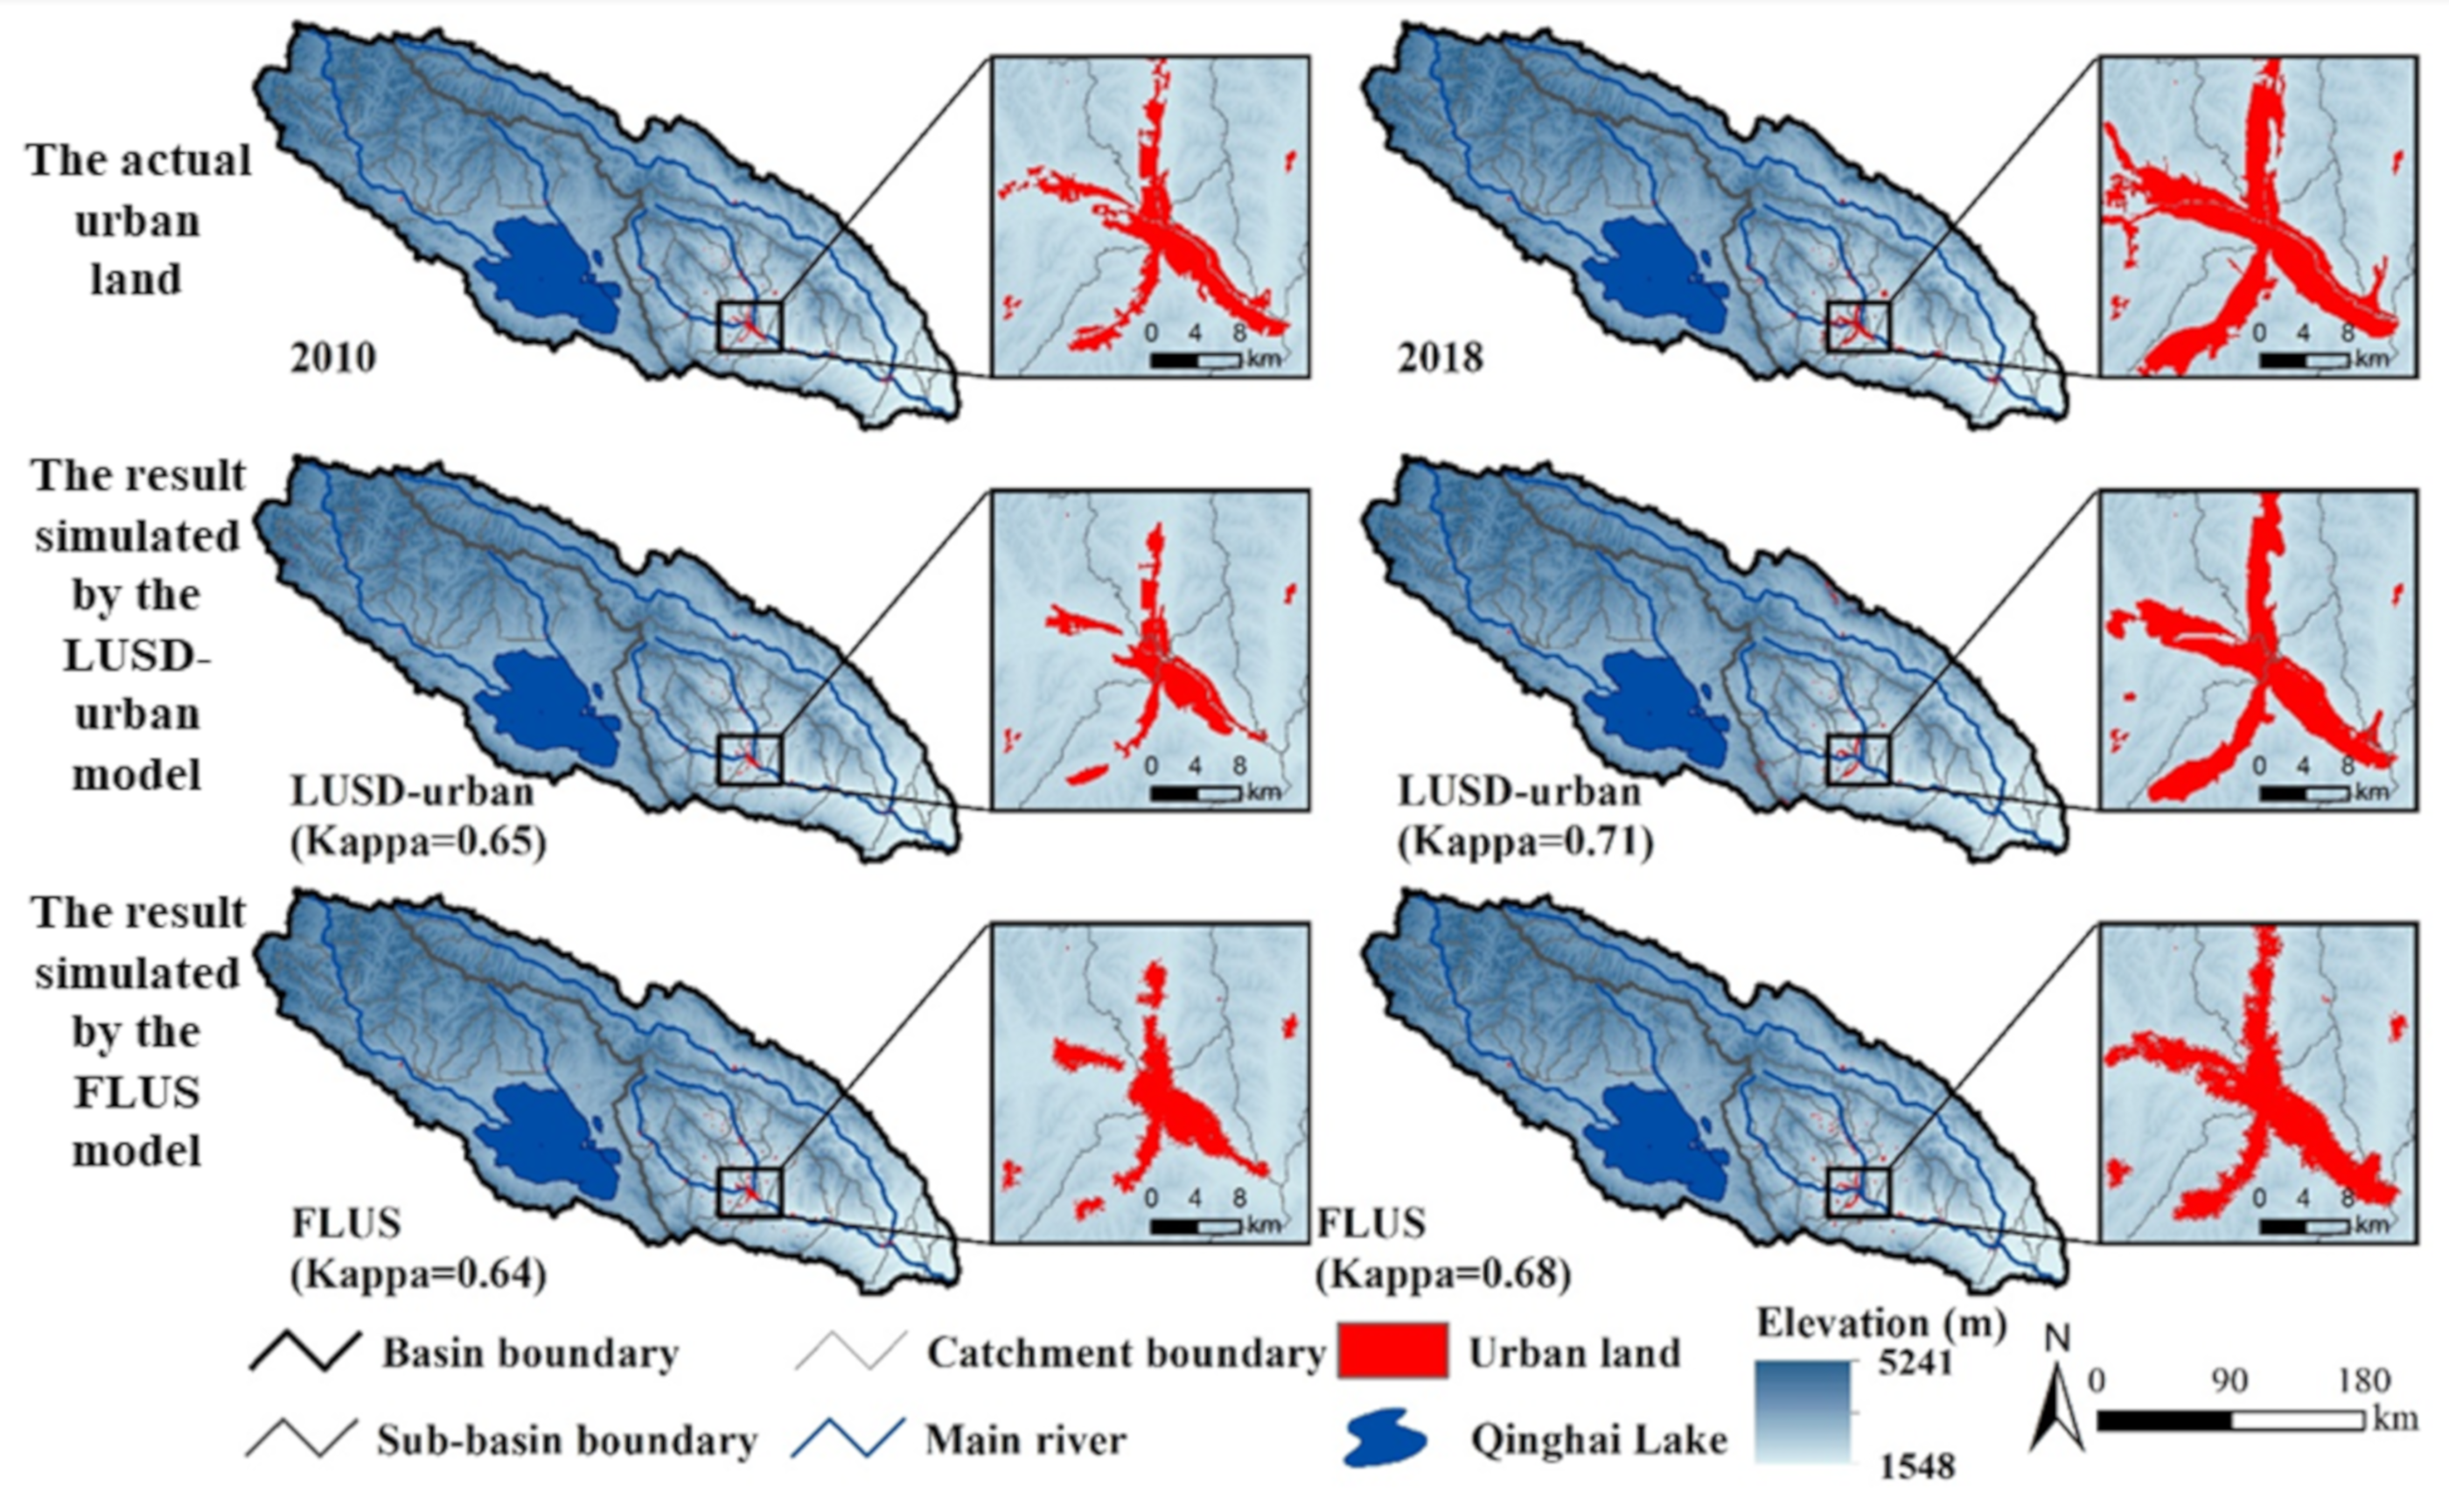
4.1. The Reliability Evaluation of Urban Land Data

The urban land data obtained by visual interpretation can precisely reflect the actual situation of urban land in the alpine basin. First, by referring to a relevant study [46], correlation analysis was conducted by using the average annual growth of the urban land, GDP, and urban population. The results showed that the urban land information extracted in this study was significantly correlated with the regional urban population and GDP data, with correlation coefficients of 0.90 and 0.88, respectively, both of which passed the significance test at the p < 0.001 level (Figure 9). Next, we used equalized stratified random sampling to select 500 sample points and calculated the error matrix with Google Earth high-resolution images (4 m). The results showed that the Kappa coefficients of urban land data in 2000, 2010, and 2018 were 0.82, 0.84, and 0.86, and the overall accuracy was 91.00%, 91.80%, and 93.00%, respectively. In addition, taking the data from 2000 to 2010 as an example, we compared the urban land data obtained in this study with the existing long-term series and the data at the same resolution [47,48]. The results revealed that the urban land data of this study significantly reduced the omissions and misclassifications, which was in line with the actual conditions of regional urban land (Figure 10).

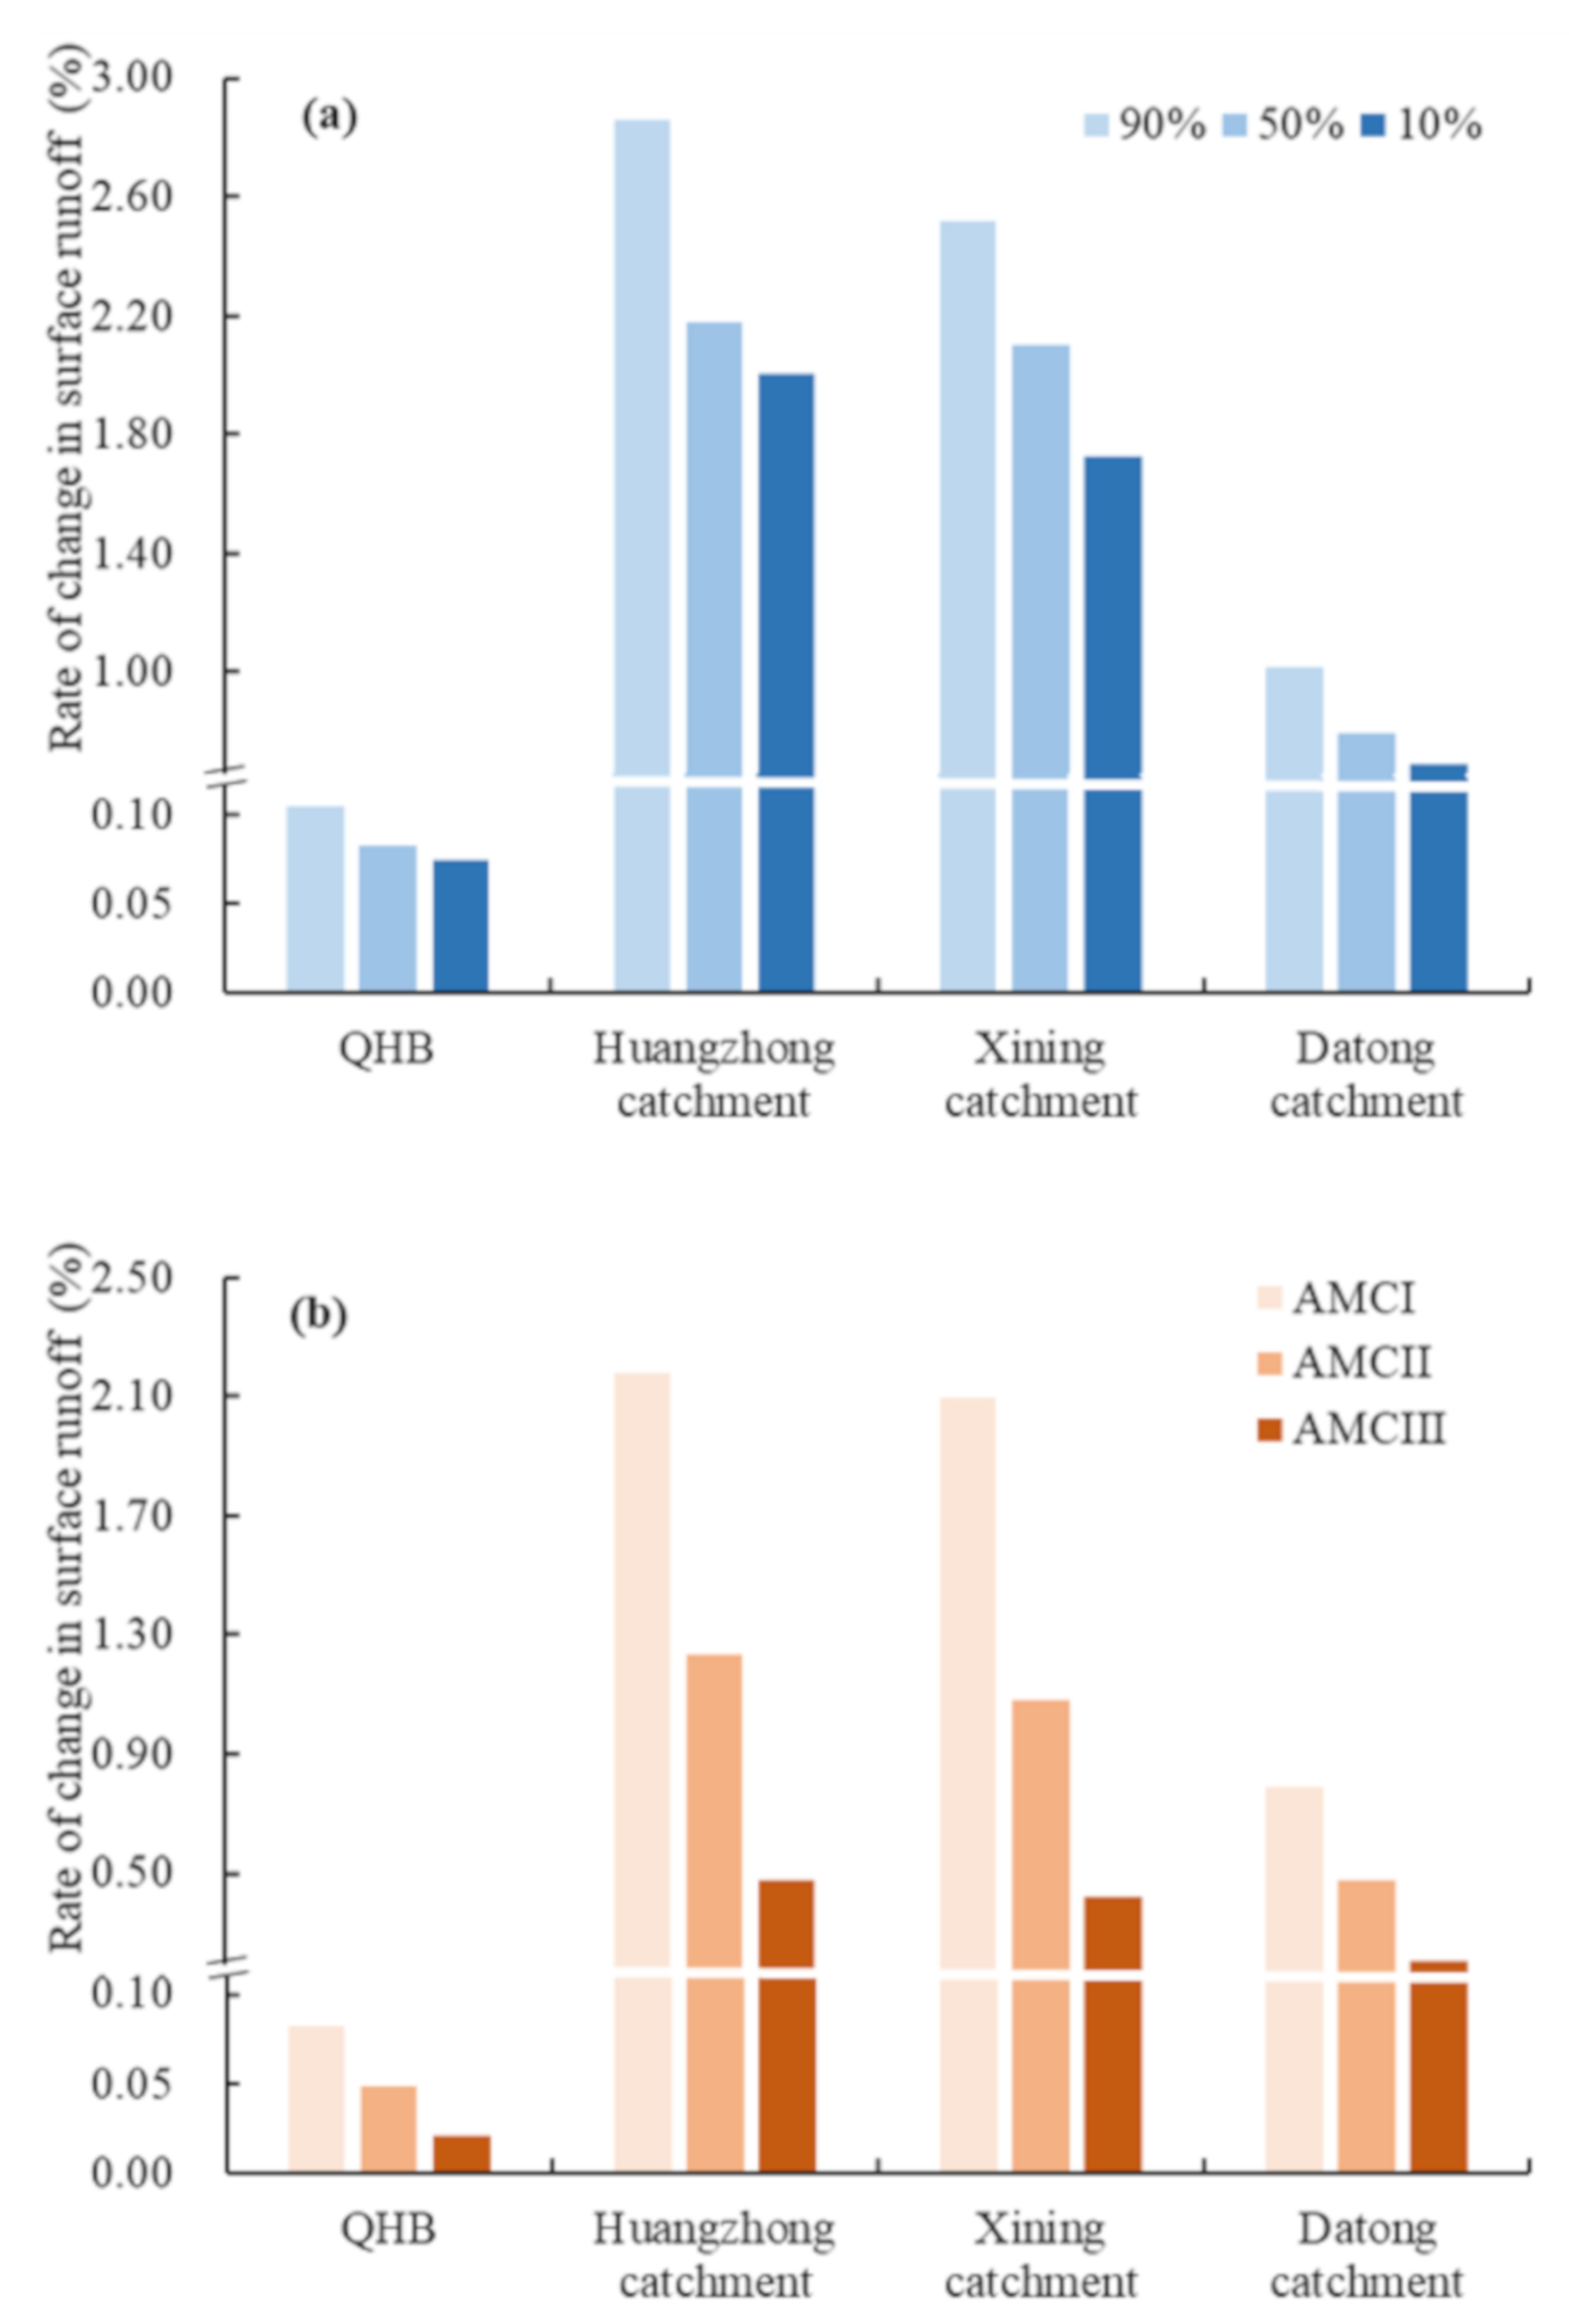
4.2. The Sensitivity Evaluation of the SCS-CN Model Parameters

Different precipitation frequencies and AMCs will affect the simulation of surface runoff [23]. As the increase in precipitation, both the surface runoff and the relevant coefficient will show an obvious growth trend [38,49]. In addition, the decrease in AMCs will weaken the soil water holding capacity, thus increasing the runoff coefficient and causing an increase in surface runoff [50]. Therefore, it is very important to analyze the validity of model parameters. In this regard, we discussed the UEI on surface runoff under different precipitation frequencies and AMCs.
Under different precipitation frequencies or AMCs, the trend of surface runoff caused by urban expansion was basically the same. Firstly, as the precipitation frequencies decreased from 90% to 10%, the rate of change in surface runoff in the basin decreased from 0.10% to 0.07%, but the growth trend of surface runoff remained consistent. Secondly, as the increase in AMCs from AMCⅠ to AMCⅢ, the rate of change in surface runoff in the basin decreased from 0.08% to 0.02%. Although the rate of change decreased, the surface runoff still maintained an increasing trend (Figure 11).
In addition, the catchments severely affected by urban expansion have not changed. The Huangzhong, Xining, and Datong catchments were still the regions with the most remarkable increase in surface runoff. Under different precipitation frequencies, the rates of change in surface runoff in the Huangzhong, Xining and Datong catchments were 2.00–2.86%, 1.73–2.52%, and 0.69–1.02%, respectively. Under different AMCs, the rates of change in surface runoff in the Huangzhong, Xining, and Datong catchments reached 0.48–2.18%, 0.42–2.10%, and 0.20–0.79%, respectively (Figure 11).
Therefore, the parameters selected in this study can reliably reflect the UEI on surface runoff. First, the variation trend of surface runoff caused by urban expansion remained basically the same under different precipitation frequencies and AMCs. Second, under different precipitation frequencies and AMCs, the hot spots affected by urban expansion did not change.

4.3. Coupling the LUSD-Urban and SCS-CN Models Can Effectively Assess the Future UEI on Surface Runoff in Alpine Basins

According to Shen et al. [51] and He et al. [44], we chose relative error as an indicator to assess the validity of the model. The results revealed that the coupled LUSD-urban and SCS-CN models can precisely simulate the future UEI on surface runoff. From 2000 to 2010, the urban expansion of the basin resulted in a decrease of 11.34‰ in the regional surface runoff. The absolute value of the relative error simulated by the coupled LUSD-urban and SCS-CN models was 0.18%, while the absolute value of the relative error simulated by the coupled Future Land Use Simulation (FLUS) and SCS-CN models was 4.23% (Table 8). The urban expansion of the basin from 2010 to 2017 led to a decrease in surface runoff of 6.11‰. The simulation result of the coupled LUSD-urban and SCS-CN models was 6.34‰, and the absolute value of the relative error was 3.40%. The simulation result of the coupled FLUS and SCS-CN models was 6.83‰, and the absolute value of the relative error was 11.78% (Table 8). The main cause of this difference is that the LUSD-urban model can simulate the spatial process of urban expansion more precisely than the FLUS model. From 2000 to 2010, the LUSD-urban model had a simulation accuracy of 0.65 for the urban expansion of the basin, while the simulation accuracy of the FLUS model was 0.64. From 2010 to 2018, the accuracy of the LUSD-urban model was 0.71, which was also higher than that of the FLUS model of 0.68 (Figure 12).

4.4. The Need to Focus on Flood Risk Prevention in the Valley Region

Urbanization is a significant cause of frequent flooding in urban areas [52]. On the one hand, the heat island effect and aerosols caused by urbanization will impact the condensation of water vapor in urban areas, making cities more prone to extreme precipitation and causing floods [52]. On the other hand, urban expansion can change the underlying surface conditions, enhancing the regional flow generation capacity, and increasing the risk of flooding [11].
According to the results of the UEI on surface runoff, we selected the Huangzhong, Xining, and Datong catchments in the valley region where the UEI on surface runoff was greatest from 2000 to 2050 as hot spots to discuss the local flood risks. According to the study of Shi et al. [23] and the data of local hydrological stations, we chose the 24-hour rainfall during the flood in July 2010 and the extreme case when the AMC was AMCⅢ to analyze the regional flood risk. Combined with local flood control planning [53], we found that the maximum 24-hour surface runoff that the region could prevent was 15.28 mm.
Due to the UEI, the existing flood control plan can no longer meet the future flood control needs in some valley regions. Under all SSPs, the surface runoff in the Xining catchment will increase from 14.28 mm in 2000 to 15.44–15.96 mm in 2050. During the same period, the surface runoff in the Datong catchment will increase from 16.06 mm to 16.57–16.84 mm. This result indicates that future urban expansion will cause surface runoff in the Xining catchment and Datong catchment to exceed the threshold that the region can prevent.
In conclusion, we suggest that the local government should comprehensively carry out flood risk prevention work in the valley region. Above all, considering that the per capita urban land area in Xining exceeds the national standard, and it is necessary to reasonably plan for future urban expansion according to the concept of compact city development. Moreover, due to the widespread development of folds and faults, low vegetation coverage, and other characteristics that are conducive to the formation of mountain torrents and debris flows, it is necessary to adopt soft adaptation measures such as returning farmland to forests and grasslands, setting flood retention areas and low elevation greenbelts to reduce the risk of mountain torrents. Finally, based on the current situation of poor flood discharge and aging dike engineering in Xining, Datong, and other areas [54], hard adaptation measures such as dredging rivers, strengthening flood control dams, and increasing rainwater storage facilities should be adopted to improve the flood control capacity [55].

4.5. Future Perspectives

There were some limitations to this research. First, in the simulation of future urban land demand, only a simple linear regression was adopted, which limited the prediction accuracy of future urban land demands. Second, when analyzing the future UEI on surface runoff, the precipitation data used were still the precipitation from June to September in the 30 years from 1990 to 2019 when the precipitation probability of the basin was 50%, without considering the influences of future climate change.
In the future, we could use the system dynamics model to estimate the urban land demand more accurately. Meanwhile, combined with the Coupled Model Intercomparison Project Phase 6 (CMIP6) and the Weather Research and Forecasting (WRF) model, the future precipitation at the catchment and urban scales could be accurately simulated to estimate the UEI on surface runoff in the context of future climate change.

5. Conclusions

By coupling the LUSD-urban and SCS-CN models, this paper developed a new method to evaluate the future UEI on surface runoff in alpine basins. Compared with the coupled FLUS and SCS-CN models, our method reduced the absolute value of the relative error of the simulation from 3.40% and 11.78% to 0.18% and 4.23%, respectively, indicating that the coupled LUSD-urban and SCS-CN models can reliably estimate the future UEI on surface runoff in alpine basins.
The urban expansion in alpine basins had severe impacts on surface runoff in the flat and low-lying valley region. From 2000 to 2018, urban expansion led to 2.18%, 2.10%, and 0.79% increases in surface runoff in the Huangzhong, Xining, and Datong catchments, respectively. From 2018 to 2050, urban expansion will cause surface runoff to increase by 4.90–9.01%, 4.25–7.36%, and 2.33–3.95%. In these catchments, the UEI under localized SSP3 will be the most severe.
Therefore, we recommend that the local government should attach importance to flood risk prevention, especially in the valley region. First, it is necessary to reasonably plan for future urban expansion. Second, soft adaptation measures such as returning farmland to forest and grassland, setting flood retention areas, and low elevation greenbelts can be used to reduce the risk of mountain torrents. Finally, hard adaptation measures such as dredging rivers, strengthening flood dams, and increasing stormwater regulation and storage should be adopted to improve flood control capacity.

Author Contributions

Z.F. and S.S. drafted the manuscript. C.H. conceived and guided this study. Z.L. gave important advice on methodology and provided suggestions on the revision of the manuscript. T.Q., J.Z., and J.L. offered advice on the revision of the manuscript. All authors have read and agreed to the published version of the manuscript.

Funding

This research was funded by the Second Tibetan Plateau Scientific Expedition and Research Program (Grant No. 2019QZKK0405) and the National Natural Science Foundation of China (Grant No. 41971270). It was also supported by the project from the State Key Laboratory of Earth Surface Processes and Resource Ecology, China.

Acknowledgments

We want to express our respect and gratitude to the anonymous reviewers and editors for their professional comments and suggestions.

Conflicts of Interest

The authors declare no conflict of interest.

References

  1. Williams, M.; Melack, J.M. Solute chemistry of snowmelt and runoff in an Alpine Basin, Sierra Nevada. Water Resour. Res. 1991, 27, 1575–1588. [Google Scholar] [CrossRef] [Green Version]
  2. Christopherson, R.W. Geosystems: An Introduction to Physical Geography; Pearson: London, UK, 2010; pp. 116–120. [Google Scholar]
  3. Cong, Z.; Shahid, M.; Zhang, D.; Lei, H.; Yang, D. Attribution of runoff change in the alpine basin: A case study of the Heihe Upstream Basin, China. Hydrol. Sci. J. J. Des Sci. Hydrol. 2017, 62, 1013–1028. [Google Scholar] [CrossRef]
  4. Zheng, D.; Zhao, D. Characteristics of natural environment of the Tibetan Plateau. Sci. Technol. Rev. 2017, 35, 13–22. (In Chinese) [Google Scholar]
  5. Paul, M.J.; Meyer, J.L. Streams in the Urban Landscape. Annu. Rev. Ecol. Evol. Syst. 2001, 32, 333–365. [Google Scholar] [CrossRef]
  6. Chen, Y.; Xu, Y.; Yin, Y. Impact of land use change scenarios on storm-runoff generation in Xitiaoxi basin, China. Quat. Int. 2009, 1, 1–8. [Google Scholar] [CrossRef]
  7. Poelmans, L.; Rompaey, A.V.; Ntegeka, V.; Willems, P. The relative impact of climate change and urban expansion on peak flows: A case study in central Belgium. Hydrol. Process. 2011, 25, 2846–2858. [Google Scholar] [CrossRef]
  8. Shi, P.; Yuan, Y.; Chen, J. The effect of land use on runoff in Shenzhen City of China. Acta Ecol. Sin. 2001, 7, 1041–1049, 1217. (In Chinese) [Google Scholar]
  9. Defries, R.; Eshleman, K.N. Impact of California’s climatic regimes and coastal land use change on streamflow characteristics. J. Am. Water Resour. Assoc. 2004, 39, 1419–1433. [Google Scholar]
  10. Riad, P.; Graefe, S.; Hussein, H.; Buerkert, A. Landscape transformation processes in two large and two small cities in Egypt and Jordan over the last five decades using remote sensing data. Landsc. Urban Plan. 2020, 197, 103766. [Google Scholar] [CrossRef]
  11. Zhang, J.; Wang, Y.; He, R.; Hu, Q.; Song, X. Discussion on the urban flood and waterlogging and causes analysis in China. Adv. Water Sci. 2016, 27, 485–491. (In Chinese) [Google Scholar]
  12. Poelmans, L.; Van Rompaey, A.; Batelaan, O. Coupling urban expansion models and hydrological models: How important are spatial patterns? Land Use Policy 2010, 27, 965–975. [Google Scholar] [CrossRef]
  13. He, L.; Wang, J. Analysis of “7·6” Storm Flood in Yaoshui River Basin of Huangshui. Water Conserv. Sci. Technol. Econ. 2011, 17, 46–47, 50. (In Chinese) [Google Scholar]
  14. He, L.; Li, G. Analysis of “2010·07” Storm Flood in Huangyuan County of Qinghai Province. J. China Hydrol. 2012, 32, 88–90, 94. (In Chinese) [Google Scholar]
  15. Bai, X.; Shi, P.; Liu, Y. Society: Realizing china’s urban dream. Nature 2014, 509, 158–160. [Google Scholar] [CrossRef] [Green Version]
  16. Wang, X.; Zhang, Y.; Wu, X.; Zheng, D.; Wang, Z.; Yan, J.; Liu, L.; Zhang, B.; Zhao, Z.; Bai, W.; et al. Spatial and temporal characteristics of land use and cover changes in the Tibetan Plateau. Chin. Sci. Bull. 2019, 64, 2865–2875. (In Chinese) [Google Scholar] [CrossRef] [Green Version]
  17. Aghakhani, M.; Nasrabadi, T.; Vafaeinejad, A. Assessment of the effects of land use scenarios on watershed surface runoff using hydrological modelling. Appl. Ecol. Environ. Res. 2018, 16, 2369–2389. [Google Scholar] [CrossRef]
  18. Li, Z.; Deng, X.; Wu, F.; Hasan, S.S. Scenario Analysis for Water Resources in Response to Land Use Change in the Middle and Upper Reaches of the Heihe River Basin. Sustainability 2015, 7, 3086–3108. [Google Scholar] [CrossRef] [Green Version]
  19. Wang, Y.; Zhang, L.; Wang, J. Response of the hydrological process to land-use/cover change in Taohe River basin. J. Glaciol. Geocryol. 2016, 38, 200–210. (In Chinese) [Google Scholar]
  20. He, C.; Okada, N.; Zhang, Q.; Shi, P.; Zhang, J. Modeling urban expansion scenarios by coupling cellular automata model and system dynamic model in Beijing, China. Appl. Geogr. 2006, 26, 323–345. [Google Scholar] [CrossRef]
  21. Zhang, D.; Huang, Q.; He, C.; Wu, J. Impacts of urban expansion on ecosystem services in the Beijing-Tianjin-Hebei urban agglomeration, China: A scenario analysis based on the Shared Socioeconomic Pathways. Resour. Conserv. Recycl. 2017, 125, 115–130. [Google Scholar] [CrossRef]
  22. Song, S.; Liu, Z.; He, C.; Lu, W. Evaluating the effects of urban expansion on natural habitat quality by coupling localized shared socioeconomic pathways and the land use scenario dynamics-urban model. Ecol. Indic. 2020, 112, 106071. [Google Scholar] [CrossRef]
  23. Shi, P.; Yuan, Y.; Zheng, J.; Wang, J.; Ge, Y.; Qiu, G. The effect of land use/cover change on surface runoff in Shenzhen region, China. Catena 2007, 69, 31–35. [Google Scholar] [CrossRef]
  24. Zheng, J.; Fang, W.; Shi, P.; Zhuo, L. Modeling the impacts of land use change on hydrological processes in fast urbanizing region—A case study of the Buji watershed in Shenzhen city, China. J. Nat. Resour. 2009, 24, 1560–1572. (In Chinese) [Google Scholar]
  25. Gregoretti, C.; Degetto, M.; Bernard, M.; Crucil, G.; Pimazzoni, A.; De Vido, G.; Berti, M.; Simoni, A.; Lanzoni, S. Runoff of small rocky headwater catchments: Field observations and hydrological modeling. Water Resour. Res. 2016, 52, 8138–8158. [Google Scholar] [CrossRef]
  26. Hu, S.; Fan, Y.; Zhang, T. Assessing the Effect of Land Use Change on Surface Runoff in a Rapidly Urbanized City: A Case Study of the Central Area of Beijing. Land 2020, 9, 17. [Google Scholar] [CrossRef] [Green Version]
  27. Monthly Data Set of Surface Climate Data in China; National Meteorological Information Center: Beijing, China, 2020.
  28. Ge, J.; Zhang, X. Spatio-temporal Variations of Temperature and Precipitation in Huangshui River Basin within Qinghai Province. J. Irrig. Drain. 2017, 36, 94–100. (In Chinese) [Google Scholar]
  29. Zhai, J.; Hou, P.; Zhao, Z.; Xiao, R.; Yan, C.; Nie, X. An analysis of landscape pattern spatial grain size effects in Qinghai Lake watershed. Remote Sens. Land Resour. 2018, 30, 159–166. (In Chinese) [Google Scholar]
  30. Li, X.; Xu, H.; Ma, Y.; Wang, J.; Sun, Y. Land use/cover change in the Qinghai lake watershed. J. Nat. Resour. 2008, 23, 285–296. (In Chinese) [Google Scholar]
  31. Shan, Z.; Zhao, X.; Cao, G. Analysis on the Evolution of Land Use and Landscape Pattern in Huangshui Basin in the Past 10 Years. Soil Water Conserv. China 2015, 6, 49–53. (In Chinese) [Google Scholar]
  32. National Bureau of Statistics of China. China Statistical Yearbook; China Statistics Press: Beijing, China, 2017.
  33. Liu, J.; Liu, M.; Zhuang, D.; Zhang, Z.; Deng, X. Study on spatial pattern of land-use change in China during 1995–2000. Sci. China Ser. D 2003, 46, 373–384. [Google Scholar]
  34. Shangguan, W.; Dai, Y.; Liu, B.; Ye, A.; Yuan, H. A soil particle-size distribution dataset for regional land and climate modelling in China. Geoderma 2012, 171–172, 85–91. [Google Scholar] [CrossRef]
  35. Fang, Z.; He, C.; Liu, Z.; Zhao, Y.; Yang, Y. Climate change and future trends in the Agro-Pastoral Transitional Zone in Northern China: The comprehensive analysis with the historical observation and the model simulation. J. Nat. Resour. 2020, 35, 358–370. (In Chinese) [Google Scholar]
  36. Jiang, T.; Zhao, J.; Jing, C.; Cao, L.; Wang, Y.; Hemin, S.; Anqian, W.; Jinlong, H.; Buda, S.; Run, W. National and Provincial Population Projected to 2100 Under the Shared Socioeconomic Pathways in China. Clim. Change Res. 2017, 13, 128–137. (In Chinese) [Google Scholar]
  37. Patil, J.P.; Sarangi, A.; Singh, A.K.; Ahmad, T. Evaluation of modified CN methods for watershed runoff estimation using a GIS-based interface. Biosyst. Eng. 2008, 100, 137–146. [Google Scholar] [CrossRef]
  38. Yuan, Y.; Shi, P. Effect of land use on the rainfall-runoff relationship in a basin—SCS model applied in Shenzhen city. J. Beijing Norm. Univ. (Nat. Sci.) 2001, 1, 131–136. (In Chinese) [Google Scholar]
  39. Cronshey, R. Urban Hydrology for Small Watersheds; United States Department of Agriculture, Natural Resources Conservation Service, Conservation Engineering Division: Washington, DC, USA, 1986.
  40. Yao, L.; Wei, W.; Yu, Y.; Xiao, J.; Chen, L. Research on potential runoff risk of urban functional zones in Beijing city based on GIS and RS. Acta Geogr. Sin. 2015, 70, 308–318. (In Chinese) [Google Scholar]
  41. Liu, Z.; He, C.; Zhou, Y.; Wu, J. How much of the world’s land has been urbanized, really? A hierarchical framework for avoiding confusion. Landsc. Ecol. 2014, 29, 763–771. [Google Scholar] [CrossRef]
  42. He, C.; Liu, Z.; Tian, J.; Ma, Q. Urban expansion dynamics and natural habitat loss in China: A multiscale landscape perspective. Glob. Chang. Biol. 2014, 20, 2886–2902. [Google Scholar] [CrossRef]
  43. O’Neill, B.C.; Carter, T.R.; Ebi, K.L.; Edmonds, J.; Hallegatte, S.; Kemp-Benedict, E.; Kriegler, E.; Mearns, L.O.; Moss, R.; Riahi, K.; et al. Meeting Report of the Workshop on the Nature and Use of New Socioeconomic Pathways for Climate Change Research; National Center for Atmospheric Research—NCAR: Boulder, CO, USA, 2012. [Google Scholar]
  44. He, C.; Zhang, D.; Huang, Q.; Zhao, Y. Assessing the potential impacts of urban expansion on regional carbon storage by linking the LUSD-urban and InVEST models. Environ. Model. Softw. 2016, 75, 44–58. [Google Scholar] [CrossRef]
  45. Sun, Z.; Li, X.; Fu, W.; Li, Y.; Tang, D. Long-term effects of land use/land cover change on surface runoff in urban areas of Beijing, China. J. Appl. Remote Sens. 2013, 8, 084596. [Google Scholar] [CrossRef] [Green Version]
  46. Xu, M.; He, C.; Liu, Z.; Dou, Y. How Did Urban Land Expand in China between 1992 and 2015? A Multi-Scale Landscape Analysis. PLoS ONE 2016, 11, e0154839. [Google Scholar] [CrossRef] [PubMed] [Green Version]
  47. Liu, X.; Hu, G.; Chen, Y.; Li, X.; Xu, X.; Li, S.; Pei, F.; Wang, S. High-resolution multi-temporal mapping of global urban land using Landsat images based on the Google Earth Engine Platform. Remote Sens. Environ. 2018, 209, 227–239. [Google Scholar] [CrossRef]
  48. Gong, P.; Li, X.; Zhang, W. 40-Year (1978–2017) human settlement changes in China reflected by impervious surfaces from satellite remote sensing. Sci. Bull. 2019, 64, 756–763. [Google Scholar] [CrossRef] [Green Version]
  49. Li, J.; Feng, P. Effects of precipitation on flood variations in the Daqinghe River basin. J. Hydraul. Eng. 2010, 41, 595–600, 607. (In Chinese) [Google Scholar]
  50. Yu, F.; Li, C.; Zhao, N.; Liu, J.; Mu, W.; Tian, J. Dynamic Change of Soil Moisture and Response Mechanism of Runoff; China Water & Power Press: Beijing, China, 2015. (In Chinese) [Google Scholar]
  51. Shen, Q.; Chen, Q.; Tang, B.; Yeung, S.; Hu, Y.; Cheung, G. A system dynamics model for the sustainable land use planning and development. Habitat Int. 2009, 33, 15–25. [Google Scholar] [CrossRef]
  52. Zhai, P.; Yuan, Y.; Yu, R.; Guo, J. Climate change and sustainable development for cities. Chin. Sci. Bull. 2019, 64, 1995–2001. (In Chinese) [Google Scholar] [CrossRef] [Green Version]
  53. Jing, Z.; Ma, X.; Wang, B.; Wang, H. Analysis of the main points of the compilation of “Xining City Drainage (Rainwater) Waterlogging Prevention Comprehensive Plan”. In Proceedings of the 2015 Annual Meeting of the National Drainage Commission, Hangzhou, China, 31 October 2015; China Civil Engineering Society: Beijing, China, 2015; pp. 76–82. (In Chinese). [Google Scholar]
  54. Bai, L. Study on the design scheme of flood control engineering in Xining section of Huangshui basin. Shaanxi Water Resour. 2020, 3, 210–212. (In Chinese) [Google Scholar]
  55. Du, S.; Scussolini, P.; Ward, P.J.; Zhang, M.; Wen, J.; Wang, L.; Koks, E.; Diaz-Loaiza, A.; Gao, J.; Ke, Q.; et al. Hard or soft flood adaptation? Advantages of a hybrid strategy for Shanghai. Glob. Environ. Chang. 2020, 61, 102037. [Google Scholar] [CrossRef]
Figure 1. Study area.
Water 12 03405 g001
Figure 2. Flow chart. GIS: geographic information system; SCS-CN: conservation service-curve number; LUSD: land use scenario dynamics; UEI: urban expansion impacts; QHB: Qinghaihu-Huangshui basin.
Water 12 03405 g002
Figure 3. The surface runoff in 2000.
Water 12 03405 g003
Figure 4. Urban expansion from 2000 to 2018.
Water 12 03405 g004
Figure 5. The UEI on surface runoff from 2000 to 2018.
Water 12 03405 g005
Figure 6. A simulation of urban expansion from 2000 to 2018. (a) Actual urban pattern in 2010, (b) simulated urban pattern in 2010 (Kappa = 0.65), (c) actual urban pattern in 2018, (d) simulated urban pattern in 2018 (Kappa = 0.71).
Water 12 03405 g006
Figure 7. Urban expansion from 2018 to 2050.
Water 12 03405 g007
Figure 8. The UEI on surface runoff from 2018 to 2050.
Water 12 03405 g008
Figure 9. The verification of the quantitative accuracy of urban land data from 2000 to 2010. (a) The correlation analysis of urban land and urban population; (b) the correlation analysis of urban land and gross domestic product (GDP).
Water 12 03405 g009
Figure 10. The comparison between urban land data obtained by visual interpretation and existing data from 2000 to 2010.
Water 12 03405 g010
Figure 11. The UEI on surface runoff under different scenarios. (a) Under different rainfall frequencies; (b) under different antecedent moisture conditions.
Water 12 03405 g011
Figure 12. The comparison between the LUSD-urban and FLUS models.
Water 12 03405 g012
Table 1. Population and urban land from 2000 to 2050.
YearPopulation (×104)Urban Land (km2)
2000363.36135.49
2010395.80228.68
2018425.66408.37
2050Local SSP1540.01896.52
Local SSP2564.231003.06
Local SSP3598.291152.82
Local SSP4524.77829.47
Local SSP5533.74868.94
SSP: shared socioeconomic pathway.
Table 2. The calibration and verification of the land use scenario dynamics (LUSD)-urban model.
FactorsWeight
2000–20102010–2018
Distance to urban centers27
Elevation141
Distance to railways206
Distance to highways1732
Distance to roads245
Slope66
Neighborhood effects1335
Inheritance attributes48
Table 3. The surface runoff in 2000.
Surface RunoffQHBQinghaihu Sub-BasinHuangshui Sub-Basin
Area
(×104 km2)
Proportion (%)Area
(×104 km2)
Proportion (%)Area
(×104 km2)
Proportion (%)
Low runoff1.9631.40 0.8528.651.1133.82
Low-medium runoff2.1534.430.8026.721.3541.38
Medium runoff1.1017.55 0.5618.970.5416.35
High-medium runoff0.518.12 0.289.570.236.88
High runoff0.538.45 0.4816.070.051.58
Table 4. Urban expansion from 2000 to 2018.
RegionUrban LandUrban Expansion
2000
(km2)
2018
(km2)
2000–2018
(km2)
Annual Growth Rate (%/Year)
QHB135.49410.85275.3611.29
Qinghaihu sub-basin6.8017.6010.798.81
Huangshui sub-basin128.69393.25264.5711.42
Xining catchment21.7990.0268.2317.40
Huangzhong catchment31.7284.4552.739.23
Datong catchment16.8951.4034.5111.35
Pingan catchment8.8533.4424.5915.43
Table 5. The UEI on surface runoff from 2000 to 2018.
RegionChange in Surface Runoff (mm)Change Rate (%)
QHB0.080.08
Qinghaihu sub-basin0.010.01
Huangshui sub-basin0.140.16
Xining catchment1.902.18
Huangzhong catchment1.842.10
Datong catchment0.800.79
Table 6. Urban expansion from 2018 to 2050.
RegionUrban LandUrban Expansion
2018
(km2)
2050
(km2)
2018–2050
(km2)
Annual Growth Rate (%/Year)
QHB410.85829.47–1152.82418.62–741.973.18–5.65
Qinghaihu sub-basin17.6032.06–42.0114.46–24.412.56–4.33
Huangshui sub-basin393.25797.41–1110.81404.16–717.563.21–5.70
Xining catchment90.02159.07–208.6869.05–118.652.40–4.11
Pingan catchment33.4482.47–129.2149.03–95.774.58–8.95
Datong catchment51.4098.21–129.0546.81–77.652.85–4.72
Huangzhong catchment84.45126.07–153.4141.61–68.961.53–2.55
Table 7. The UEI on surface runoff from 2018 to 2050.
RegionChange in Surface Runoff (mm)Change Rate (%)
QHB0.31–0.520.33–0.54
Qinghaihu sub-basin0.18–0.190.17–0.18
Huangshui sub-basin0.44–0.820.50–0.93
Xining catchment4.36–8.024.90–9.01
Huangzhong catchment3.81–6.584.25–7.36
Datong catchment2.37–4.022.33–3.95
Table 8. The comparison between the LUSD-urban and future land use simulation (FLUS) models.
2000–20102010–2018
UEI on Surface Runoff (‰)Relative Error (%)UEI on Surface Runoff (‰)Relative Error (%)
Actual value11.34 6.11
LUSD-urban + SCS-CN11.32−0.186.343.40
FLUS +
SCS-CN
11.824.236.8311.78
Publisher’s Note: MDPI stays neutral with regard to jurisdictional claims in published maps and institutional affiliations.

