Spatio-Temporal Variations of Hydrochemical and Microbial Characteristics in Karst Water in Samcheok, South Korea


Department of Geology, Kangwon National University, Chuncheon 24341, Korea
*
Author to whom correspondence should be addressed.
Water 2020, 12(12), 3407; https://doi.org/10.3390/w12123407
Submission received: 25 September 2020
/
Revised: 24 November 2020
/
Accepted: 1 December 2020
/
Published: 3 December 2020
(This article belongs to the Special Issue Application of Microbial Techniques in Hydrogeological Studies)
Abstract
:This study analyzed the hydrochemical characteristics and microbial communities of karst water in Samcheok, Korea, and compared water quality results to identify the seasonal characteristics and hydrogeological connectivity of the study areas of Hamaengbang-ri, Gyogok-ri, Yeosam-ri, and the downtown area of Samcheok. Field survey and water quality analysis were performed in July 2019, February 2020, and April 2020. Hydrochemical analysis of karst water (groundwater and surface water) showed that most samples were comprised of Ca-HCO3 and that water–rock interactions were a dominant factor compared to precipitation and evaporation (crystallization). For seasonal characteristics, water–rock interactions appeared more active in the dry season than in the rainy season. Calcite weathering was dominant in the dry season, whereas dolomite weathering dominated the rainy season. Moreover, the saturation indexes for the dry and rainy seasons were less than and greater than 0, respectively, corresponding to an unsaturation (oversaturation) state; thus, white precipitate distributed in the study areas was deposited in the rainy season. Finally, as a result of analyzing the hydraulic characteristics between regions, hydrogeological similarities were identified between Hamaengbang-ri and Yeosam-ri, and between Gyogok-ri and downtown Samcheok, which suggested hydrogeological connectivity between each of the pairs.
1. Introduction
Karst areas refer to regions where there are limestones or dolomites in large volumes on an exposed erosion reference surface allowing various karst terrains to form on the surface and underground because of the groundwater system developed by the corrosion of the rock body [1,2]. Carbonate rocks account for 20% of the Earth’s land, and the aquifers of karst areas provide 25% of drinking water worldwide. For this reason, research on karst water is extremely crucial [2,3,4,5,6]. The overuse of groundwater in karst areas may cause deformation to limestone topography as well as natural disasters that claim human lives and economic losses. Agricultural activities in typical karst features such as doline tend to cause overexploitation of groundwater, thereby accelerating the decline of water table and the formation of sinkholes. In this regard, the role of water is especially important in several studies on karst topography. Karst is a result of the dissolution of carbonate minerals and active water–rock interaction significantly affects karst water [7]. Limestone or dolomite in carbonate regions are easily weathered (dissolved) by groundwater or rainwater containing CO2 and thus form an epikarst zone, which is a peculiar atmosphere–hydrosphere–lithosphere–biosphere interface observed only in karst terrain [6,8,9]. Dissolved inorganic carbon (DIC) concentrations in karst areas depend mainly on the CO2 of soils (decomposition of organic compounds caused by biological activities of living organisms or root respiration) and the dissolution of carbonate rocks. Accordingly, karst areas play a substantial role in CO2 circulation and have a substantial impact on the global environment [8,9,10,11].
The hydrodynamic functioning of groundwater from which the karst system is made depends on whether an aquifer is confined or unconfined. In addition, the type of karst is determined at the surface; therefore, the karst spatial distribution, hydrogeology, topography, and conduit systems depend on the chemical and physical conditions and groundwater flow within the karst [12]. In karst terrains, groundwater flows through a system of complex channels, which can be classified into fast-flow channels (conduits) and slow-flow channels. When pollutants (turbid water, microbeads, mine wastewater, seawater seepage, etc.) meet a conduit, they may spread quickly to unpredictable places and water can move thousands of meters a day [13]. Thus, karst areas are vulnerable to pollution and pollutant origin is difficult to estimate [6]. As the water in karst areas does not flow through a usual water system, the origin of pollutants is difficult to estimate. For example, when pollution occurs, water quality and microbial characteristics can be comparatively analyzed among different zones and their connectivity can be identified. Many limestone mines are distributed in carbonate rock areas, so it is necessary to understand the water flow in these locations [14,15].
In South Korea, only a few hydrogeological studies have been conducted on karst areas and none have investigated karst as an aquifer source, as the geology of South Korea is dominated by granite and gneiss [11,16]. Accordingly, it is important to identify the characteristics of karst water flow and quality because management and research on groundwater must be performed with different criteria from those of usual geological areas (granite and gneiss) in South Korea [17,18].
To this end, the present study analyzes the hydrochemical characteristics and microbial communities in the water of karst areas and also compares water quality information to identify the seasonal characteristics and hydrogeological connectivity of the study areas.
2. Study Areas and Methods
2.1. Study Areas
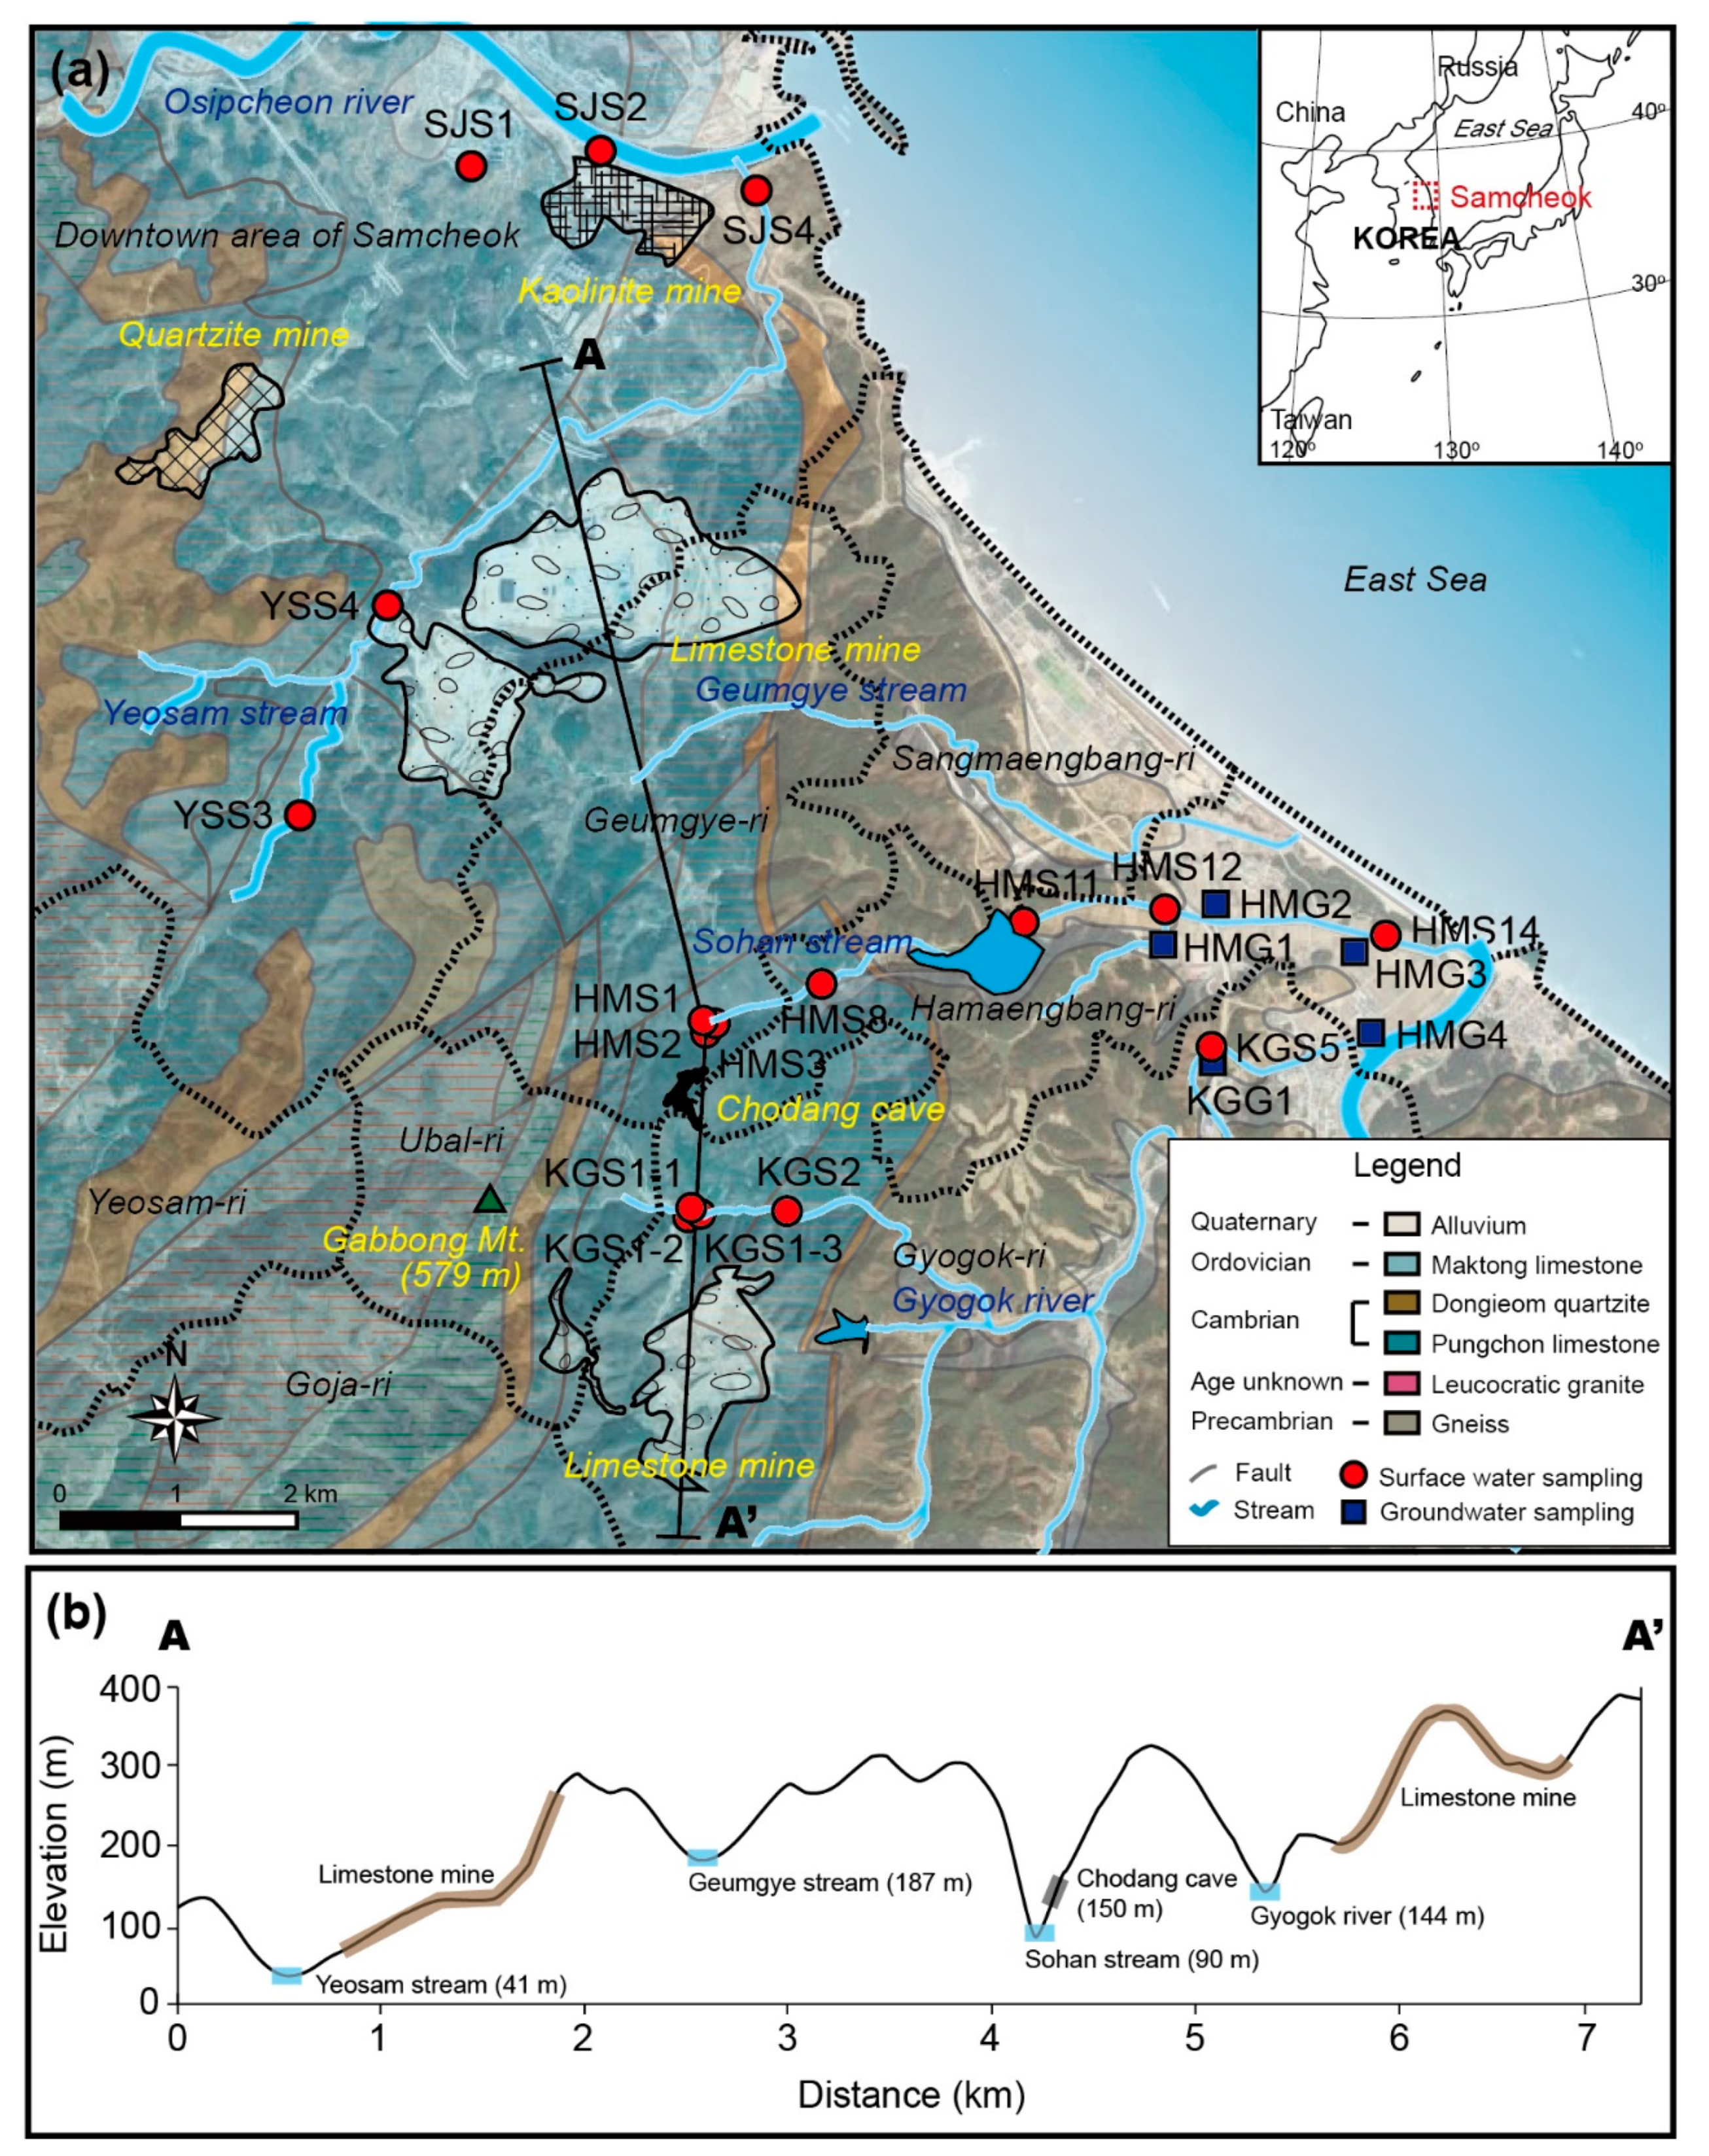
The study areas included Hamaengbang-ri, Gyogok-ri, Yeosam-ri, and the downtown area of Samcheok, South Korea. The topography of Samcheok City is composed of mountainous terrain (Taebaek Mountain range) on the west side and the East Sea on the east side; thus, the west and east sides have high and low elevations, respectively. The groundwater is recharged in the west, i.e., the highlands, and discharged to the east coast, the lowlands. The hydraulic gradient of groundwater at the ordinary water level in the Samcheok area ranges between 0.0 and 43.40°. As a result of analyzing the hydraulic gradient, flow direction, and recharge-discharge system in the study area, the respective functions of this zone are distributed as follows: The recharge area constitutes 61.2%, the intermediate area comprises 23.2%, and the discharge area totals 15.6% [19].
There are two rivers (Osip and Gyogok) and two streams (Sohan and Yeosam) in the study area. The length of Osip river is 9.30 km and that of Gyogok river is 3.50 km [19]. The area of the Osip river, which includes the study area, is 242.88 km2, the total amount of water resources is 304,007,700 m3/year, the groundwater recharge amount is 44,136,000 m3/year (recharge rate: 14.47%), and the development potential is 22,199,000 m3/year. In addition, the total number of groundwater facilities in the study area is 652, and the usage of groundwater is 2,600,890 m3/year (for living: 1,244,680, industrial use: 674,220, for agriculture and fishing: 681.99 m3/year) [19].
Chodang cave, located in Hamaengbang-ri, is a W-shaped underwater cave that has been designated as a natural monument. The entire cave, with a width of 3–5 m, is filled with water (3–9 m in depth). A considerable amount of water flows into the cave from the neighboring and active Suro cave [20]. The total length of Chodang cave is 543.5 m (main passage: 317.5 m, branches: 226 m), and that of Sohan cave is 135 m (main passage: 96.5 m, branches: 38.5 m) [20]. In addition, Chodang cave is a multi-layered vertical cave with a repeated series of vertical and horizontal passages. As the bottom groundwater passage is connected to Sohan cave, the water flowing into Chodang cave flows out through the entrance of Sohan cave, thereby forming Sohan stream. Thus, Sohan stream consists mostly of cave water (HMS2) flowing from the entrance of Sohan cave, which is joined by a small waterfall (HMS1). This stream passes through the Chodang reservoir and into the sea (Figure 1a). The upper part of the Sohan stream is an ecological and scenic reserve and constitutes the only habitat of freshwater laver in Korea. A freshwater laver research center is located at HMS8. The lower part of Sohan stream is an agricultural area that is mainly covered with rice paddies.
Gyogok river is mostly dry further up KGS1 and its main source is water discharged from the turbidity reduction facility of a limestone mine. In the case of KGS1-2, the water comes directly from the mine through conduits without being treated by the turbidity reduction facility (Figure 1a). Another limestone mine is located in the neighboring area of the Yeosam stream, which is largely covered by agricultural activities. Soils of rice paddies and fields are terra rossa formed by the weathering of lime stones. Osip river in downtown Samcheok is adjacent to a kaolinite mine and the East Sea coast.
Mt. Gabbong, with an elevation of 579 m, is located to the west of Gyogok-ri and Hamaengbang-ri and south of Yeosam-ri [21]. Water is believed to drain from this location into three different areas: Gyogok-ri, Hamaengbang-ri, and Yeosam-ri. The topographical profile from the limestone mine of Gyogok-ri to Yeosam stream shows a gradual decrease in elevation (Figure 1b). Two limestone mines are located in Gyogok-ri (approximately 210–310 m) and Yeosam-ri (approximately 75–270 m), respectively. Geumgye stream has the highest elevation (approximately 187 m), followed by the Gyogok river (144 m), Sohan stream (90 m), and Yeosam stream (41 m) (Figure 1b).
The geology of the study area constitutes deposited schist and gneiss in the Precambrian period, leucocratic granite, neutral and acid dykes intruded in the unknown period, and the Great Limestone Series deposited as an unconformity in Paleozoic Era [11,21] (Figure 1). In the Cretaceous period, a Rhyolite formation was infiltrated by granite porphyry and acid dykes and showed an unconformity with the Paleozoic formation; these formations were also deposited as unconformity in the Quaternary period. Among them, the Great Limestone Series in Paleozoic has a thick formation containing Jangsan Quartzite (thickness: 10–50 m, main composition rock: Quartzite), Myobong (thickness: 50–150 m, main composition rock: Shale), Pungchon Limestone (thickness: The lower part is approximately 60 m, the middle part is approximately 60 m, and the upper part is approximately 35 m; main composition rocks: Limestone, dolomitic argillaceous limestone, calcareous shale, and so on), Hwajeol (thickness: 10–100 m, main composition rocks: Shale, clay-slate stone and heterolithic limestone), Dongjeom Quartzite (main composition rocks: Quartzite and sandstone) and Dumudong (thickness: Approximately 150 m, main composition rocks: Calcareous shale and heterolithic limestone) [21] (Figure 1).
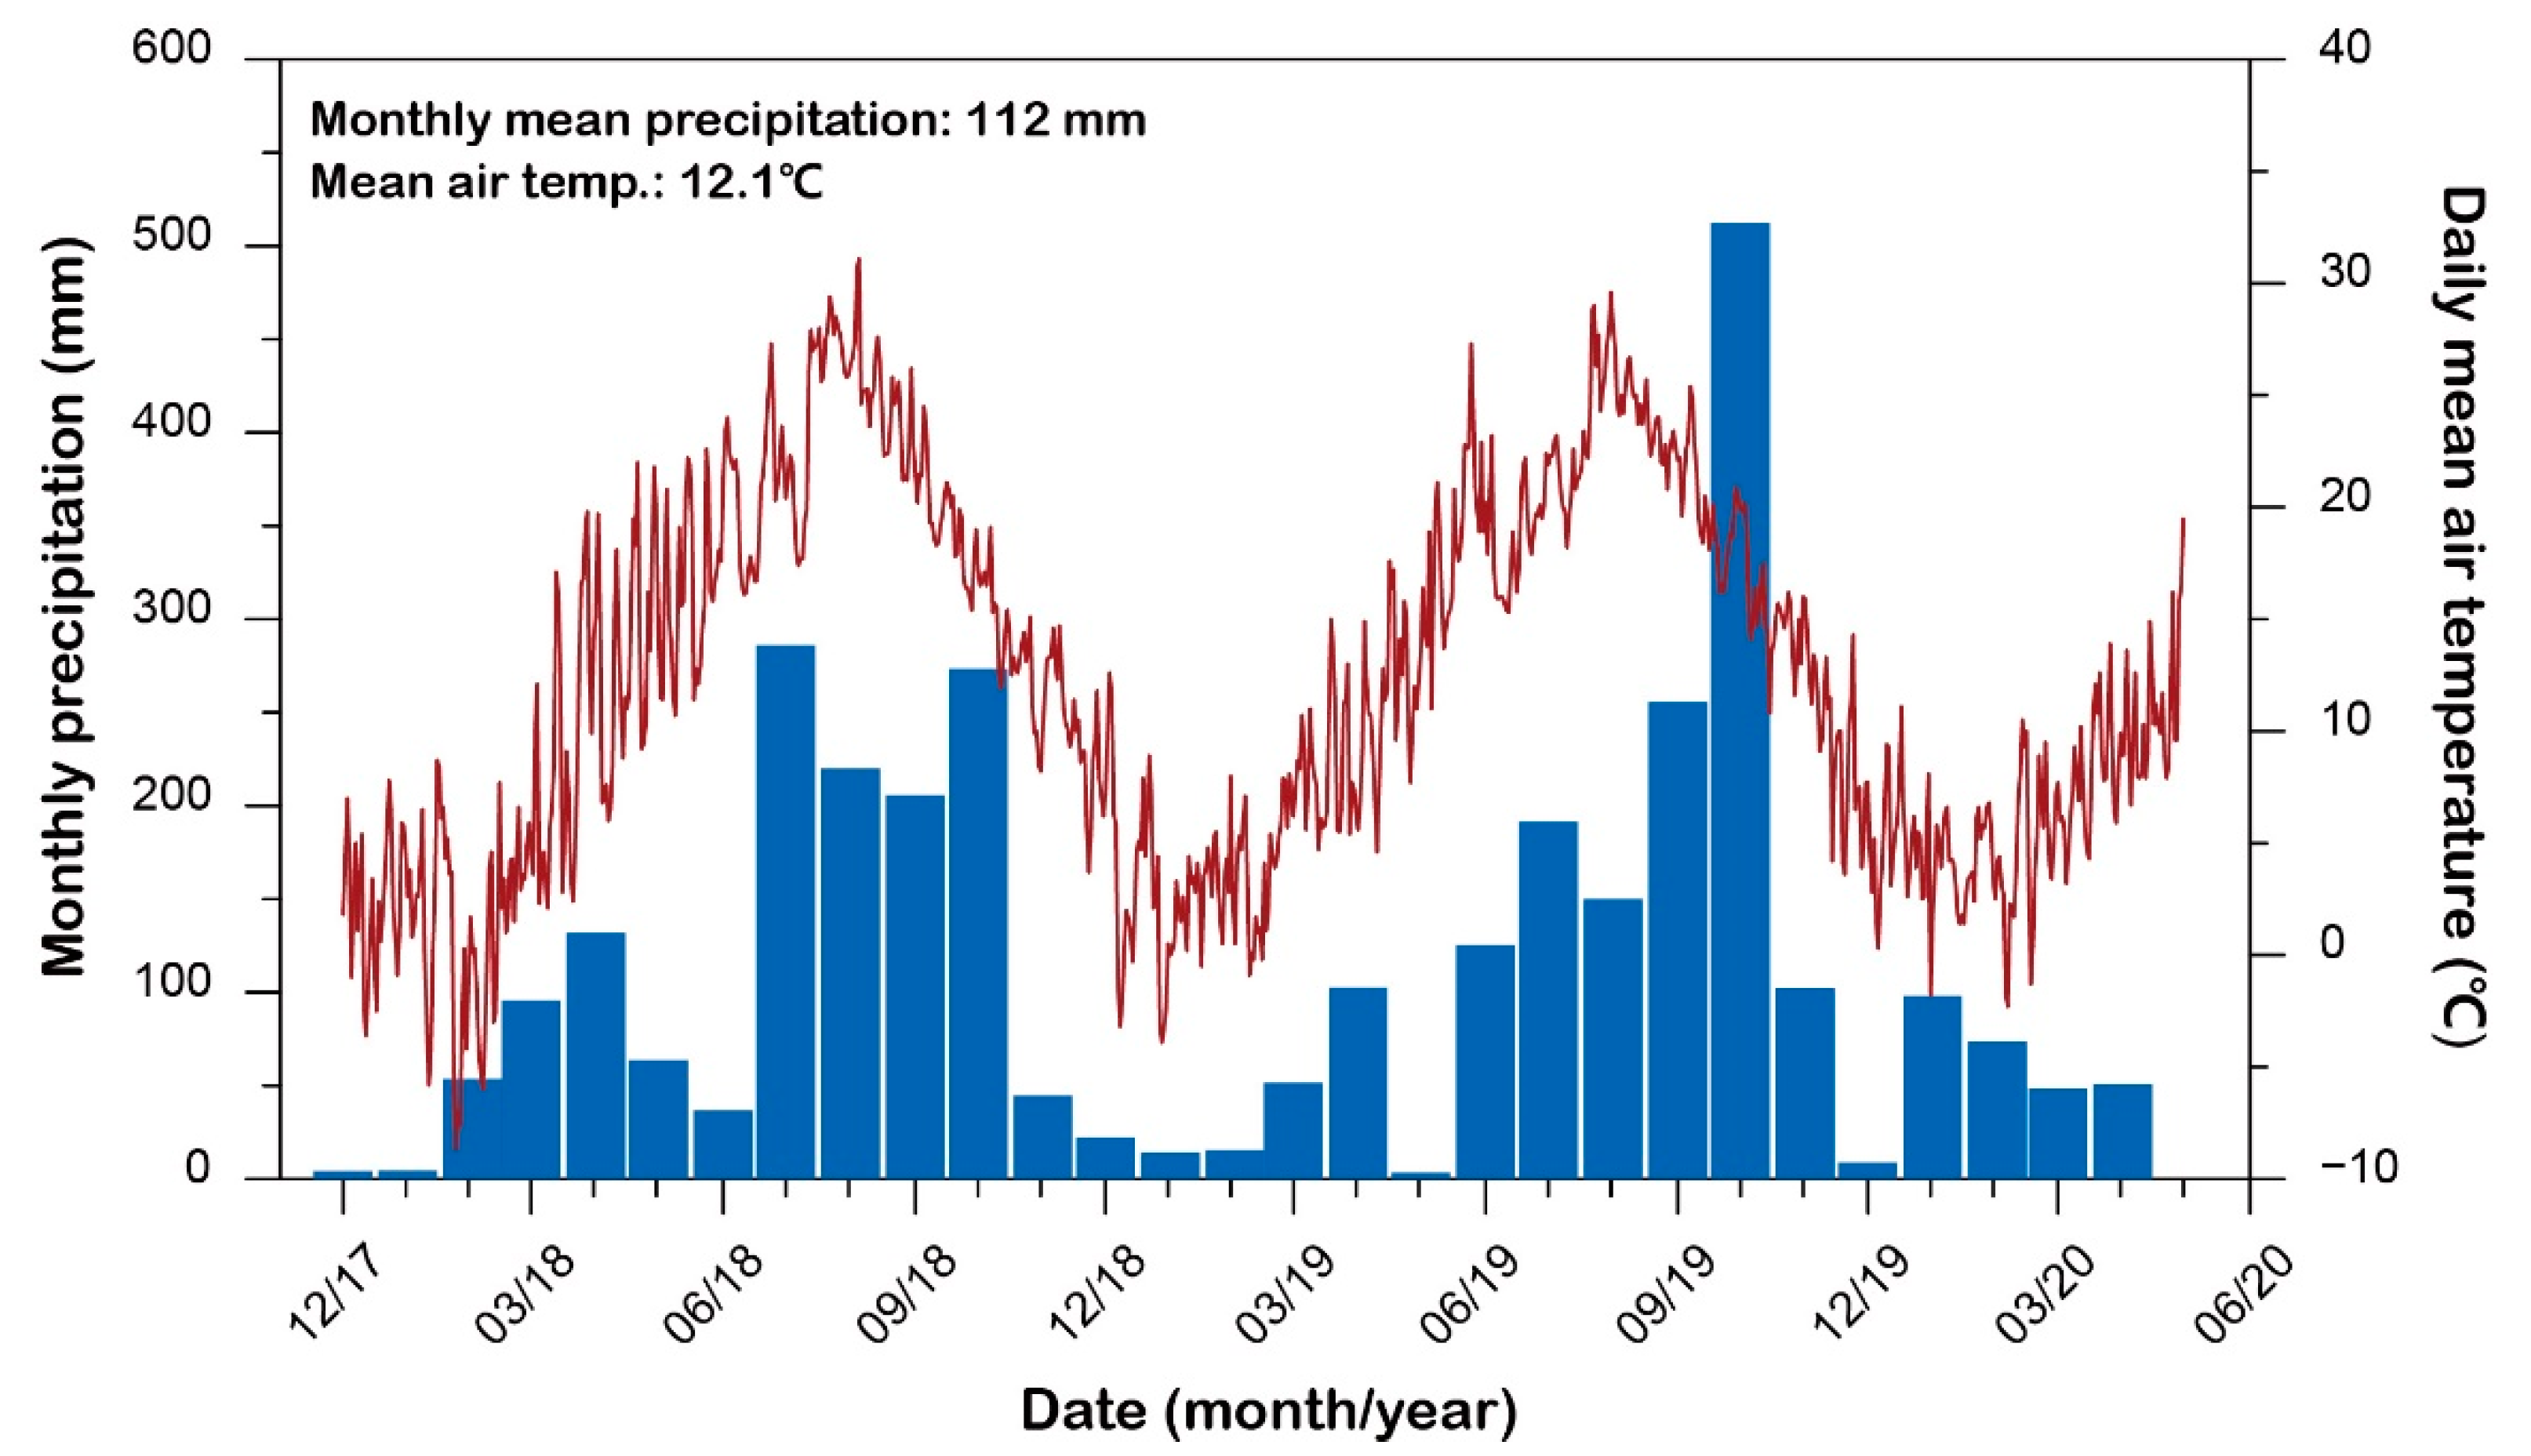
The monthly mean precipitation in the study area is 122 mm (from December 2017 to April 2020), ranging from 3.3 mm (May 2019) to 512.5 mm (October 2019) (Figure 2). Rainfall events of more than 200 mm per month are concentrated from July to October. The Daily mean temperature in this area is −8.7–31.1 °C, and the total mean air temperature is 12.1 °C. Both precipitation and temperature show distinct seasonal differences.
2.2. Methods
2.2.1. Field Survey
In this study, an on-site water quality survey was conducted three times (July 2019 as well as February and April 2020) in the Sohan stream of Hamaengbang-ri, the Gyogok river of Gyogok-ri, Yeosam stream of Yeosam-ri, and the Osip river in the downtown area of Samcheok. Water quality was examined at 13 points (1 groundwater point and 12 surface water points) in July 2019 and at 21 points (4 groundwater points and 17 surface water points) in February and April 2020. For the on-site water quality survey, on-site water quality meters (HORIBA D54 and 55) were used to measure water temperature (°C), hydrogen-ion concentration (pH), dissolved oxygen (DO), electrical conductivity (EC), oxidation-reduction potential (ORP) and turbidity. In addition, water samples of 4–8 L were collected for a cation/anion analysis (Ca2+, Mg2+, Na+, K+, SO42−, NO3−, Cl−), an alkalinity analysis (HCO3−, CO32−), a stable isotope analysis (2H, 13C, 18O), an X-ray diffraction (XRD) analysis, a scanning electron microscope (SEM) analysis, and a microbial cluster analysis.
2.2.2. Cation/Anion Analysis
For the cation/anion analysis, the water samples were filtered through a 0.45-μm polyethersulfone (PES) filter, and the cation was pretreated using 10% dilute hydrochloric acid. Ion concentrations were analyzed using inductively coupled plasma–optical emission spectrometry and ion chromatography in the Basic Science Analysis Service Center at the Sangji University, Korea. Alkalinity was analyzed using the automated colorimetric method with methyl orange (USEPA Method 310.2, 1974). This method employed a digital auto-titrator (Technicon Auto Analyzer, FIAlab, Seattle, WA, USA) with 0.05 N HCl and buffer methyl orange solution of pH 3.2.
2.2.3. Stable Isotope Analysis
The 13C and 18O stable isotope analysis was performed using an isotope ratio mass spectrometer (IRMS) and 2H stable isotope analysis was completed using a cavity ring-down spectrometer (CRDS) in the Beta Analytic Testing Laboratory (Miami, FL, USA). The equipment used for the analysis followed the ISO/IEC 17025:2017 standard [22].
2.2.4. Precipitated Matter Analysis (SEM, XRD)
The 2 L water samples (suspended solids) were collected and matter precipitated by evaporation of the water sample was obtained by drying the samples in an oven at 4–50 °C for 14 days followed by XRD and SEM analyses. The specimens thus obtained were transported to the Gangwon Fusion Imaging Specialization Center (ZEUS); there, the mineral composition of the precipitated matter was identified using an XRD analyzer (Miniflex 600, Rigaku Corporation, Tokyo, Japan) and the surface image was taken using an SEM (CX-200TM, COXEM, Deajeon, Korea).
2.2.5. Saturation Index (SI)
Saturation index is one of the methods for indicating the saturation state of a target mineral in a solution. A saturation index can be calculated based on hydrochemical characteristics such as water temperature, pH, and chemical composition [23].
The equation is as follows (IAP: Ionic activity product, Ksp: Solubility product).
If the saturation index is greater than 0, an oversaturated state occurs where the target mineral cannot be additionally dissolved but be deposited in the solution. Conversely, if the saturation index is less than 0, an undersaturated state is present where the target mineral can be additionally dissolved or an additional mineral can be dissolved in the solution. Finally, when the saturation index is zero, a state of equilibrium occurs. Saturation indexes are generally calculated through a hydrochemical modeling program. This study used Geochemist’s Workbench 14.0 (Aqueous Solutions LLC, Champaign, IL, USA) and Visual MINTEQ 3.1 (KTH, Stockholm, Sweden) to calculate saturation indexes.
2.2.6. Microbial Cluster Analysis
To identify microbial communities present in the water samples, 3 L water (stream water or groundwater) was filtered through a 0.2-μm membrane filter, and the membrane filter was stored at or below 0 °C in a cryo-sample box and transported to Chunlab Inc. (Seoul, Korea) within two days after the field survey was completed. In Chunlab Inc., the total DNA was extracted using an i–genomic soil DNA extraction Mini Kit (Intron, Korea), and whether DNA was successfully extracted or not was checked using a Qubit fluorometer (Invitrogen, Carlsbad, CA, USA). The bacterial 16S rRNA gene was amplified using 8–27F and 1492–1510R primer sets. An amplified PCR band with a size of roughly 1.5 KB was obtained. A GS junior sequencing system (Roche, Branford, CT, USA) was implemented for pyrosequencing in Chunlab Inc., and the EzTaxon-e database (http://eztaxon–e.ezbiocloud.net) was the platform and software used for analysis. Regarding microbial diversity, alpha-diversity was calculated using the Mothur package [24]. ACE, Chao1, Jackknife, Shannon, and Good’s Library coverage are useful indexes for identifying species abundance as well as directly comparing species diversity among samples [25].
2.2.7. Laboratory Analysis
In the laboratory, we used Geochemist’s workbench, Grapher 13, and Illustration CS6 to visualize the analyzed field measurement and chemical data (Piper diagram, Gibbs diagram, chemical analysis graphs), as well as PAST3 (Oyvind Hammer, Oslo, Norway) and Excel 2016 (Microsoft, Redmond, WA, USA) for statistical and mathematical analyses.
3. Results and Discussion
3.1. Hydrochemical Characteristics of Karst Water (Groundwater and Surface Water)
Table 1 presents the hydrochemical characteristics of groundwater and surface water in the study areas. The temperature of groundwater ranged from 10.5 °C to 16.3 °C, which showed a smaller variation according to season and weather than that of surface water (4.4–27.1 °C). Although carbonate rocks are dominant in the study areas, the pH mean values of groundwater were slightly acidic (6.5) and those of surface water were slightly alkaline (7.4–8.1). The electrical conductivity (ECs) range for the three study areas (Hamaengbang, Gyogok, Yeosam) was 183.7–541.0 μS/cm, and that of groundwater was 96.6–688.0 μS/cm. The downtown area near the East Sea showed an extremely high EC value (423.0–4960.0 μS/cm) because of the influence of seawater.
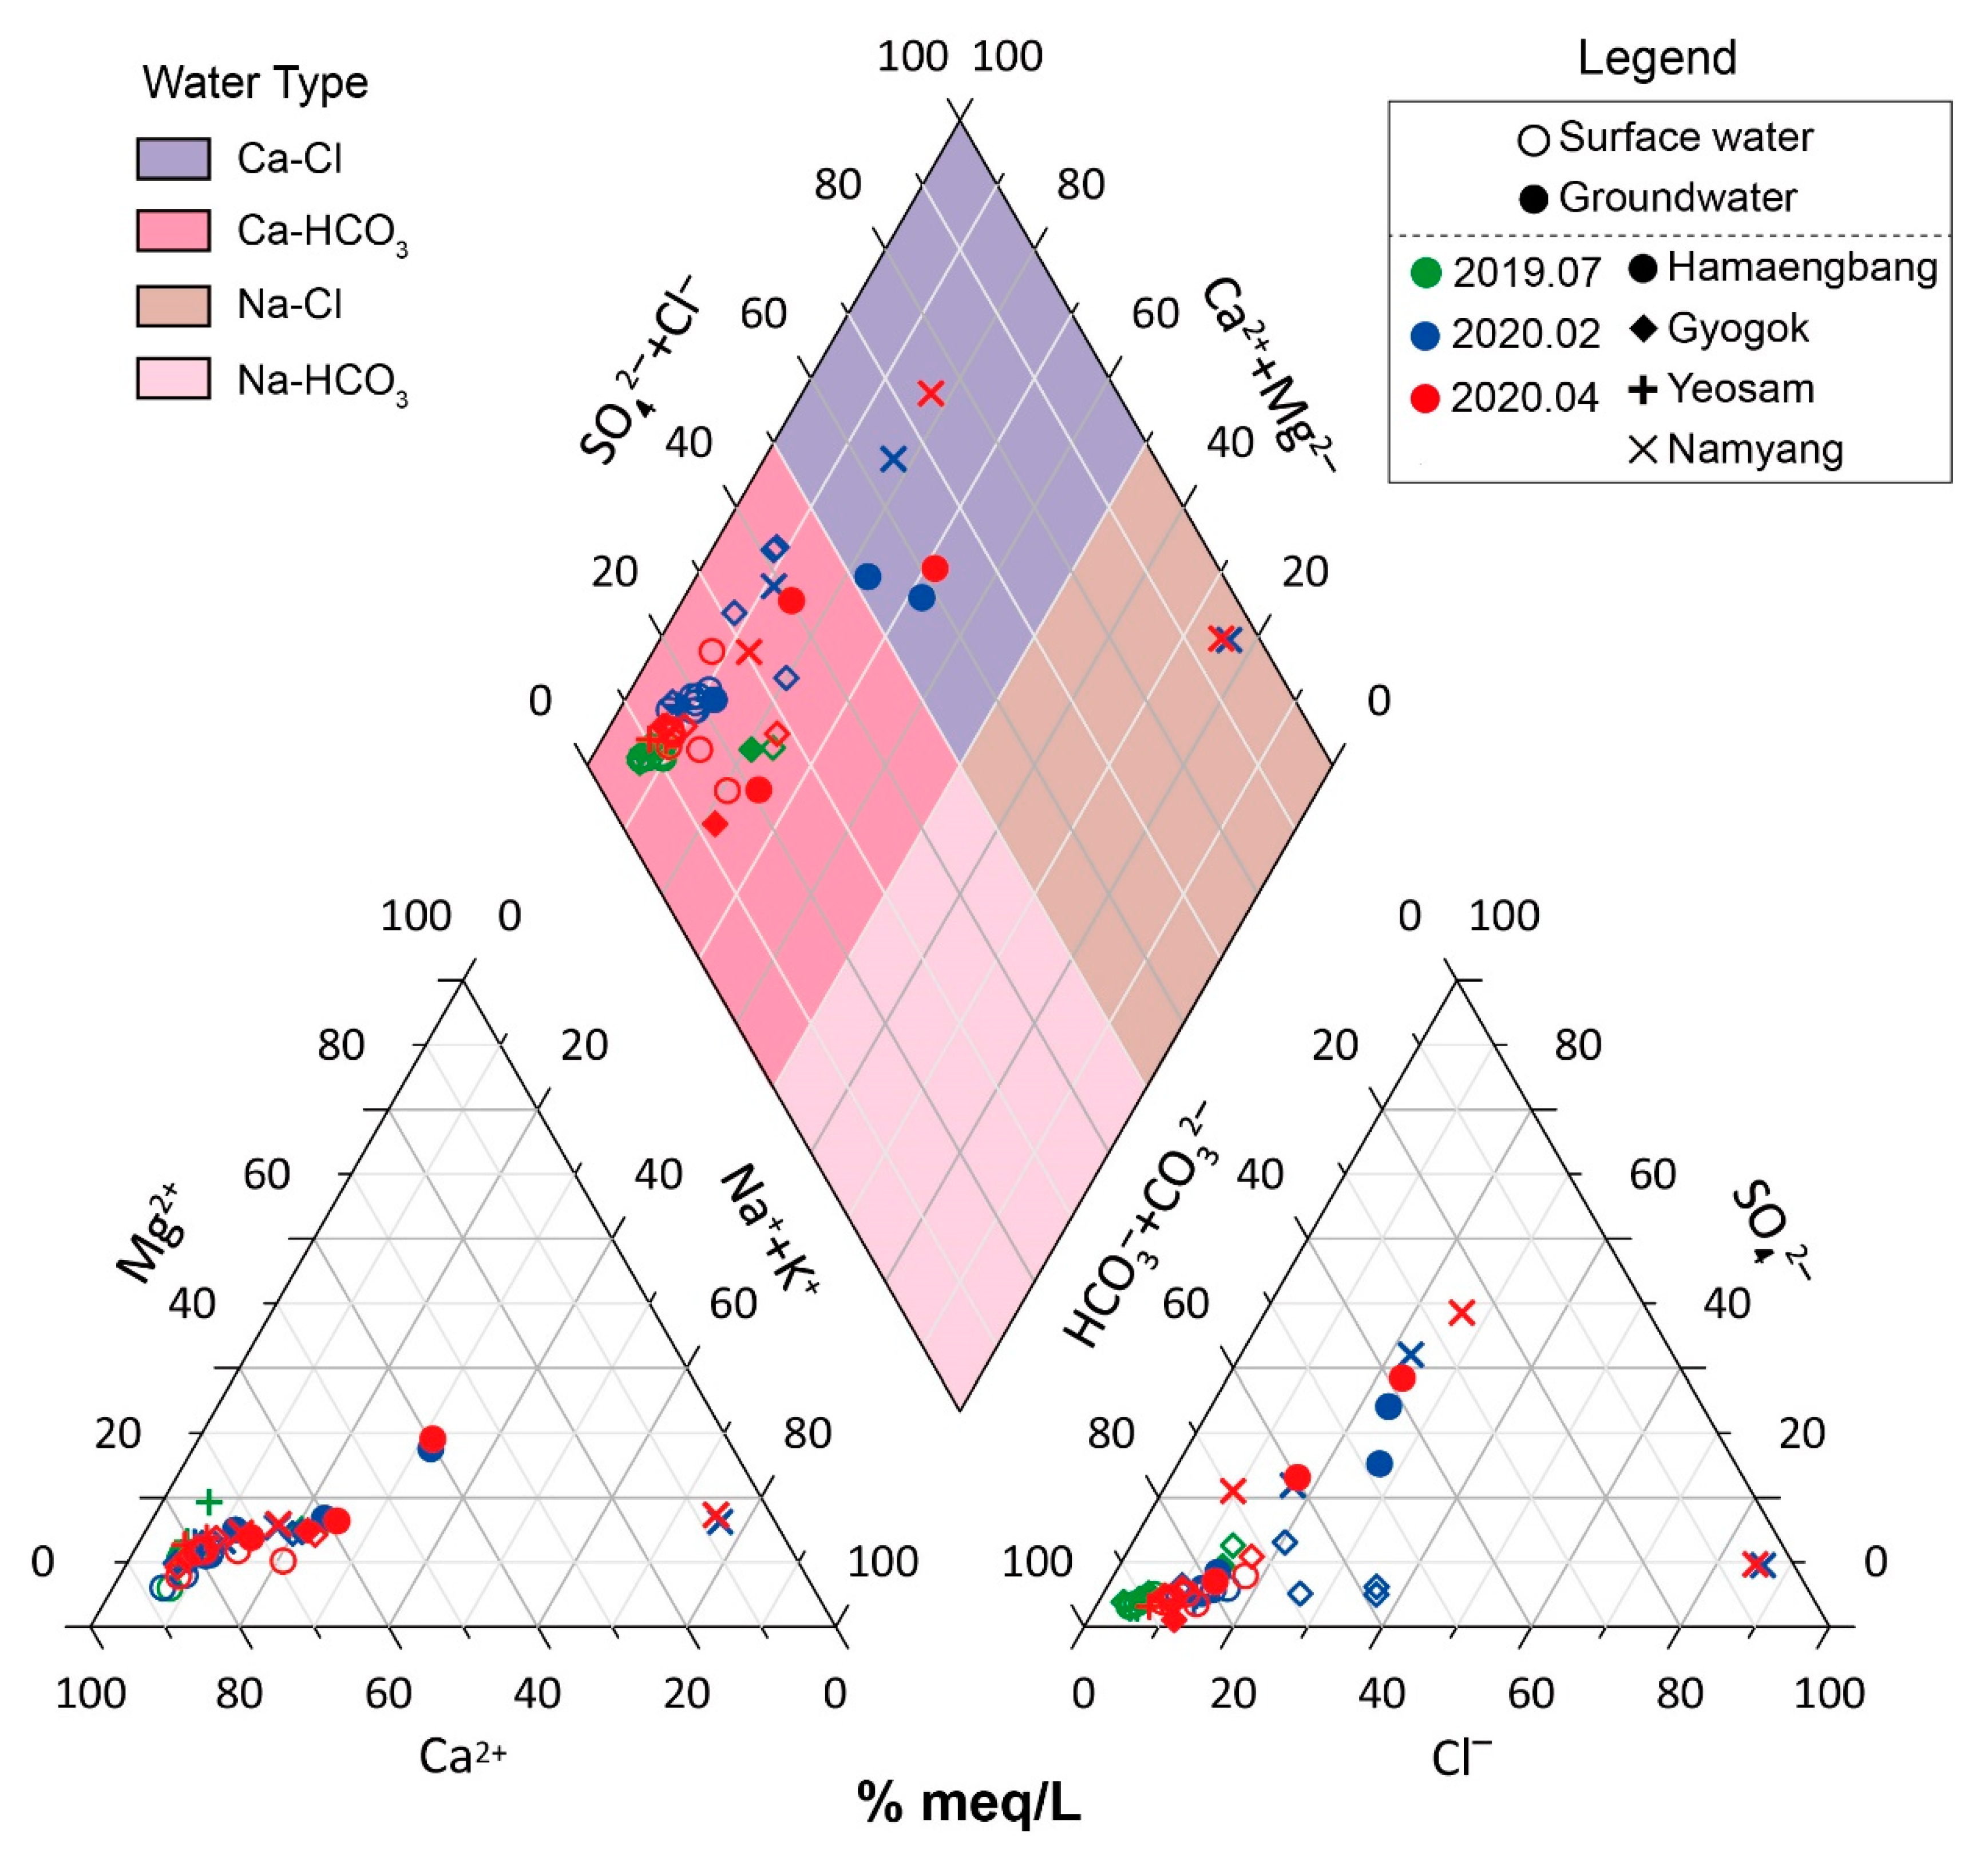
The most dominant cations and anions of the groundwater and surface water were calcium (Ca2+) and bicarbonate ions (HCO3-). Most of the samples were the Ca-HCO3, which represented typical shallow groundwater or clean streams (Figure 3) [26]. The next frequent type displayed in the Piper diagram is Ca-HCO3-Cl. Most samples within this category were groundwater (Figure 3). All the sampling points for groundwater are located in rural areas where agricultural activities are dominant. In those areas, groundwater is used for irrigation to grow crops. Accordingly, the samples of those points were of the Ca-HCO3-Cl type. Other samples appearing in Ca-Cl and Na-Cl types corresponded to the stream flowing through the downtown area of Samcheok. As the stream is adjacent to the East Sea, seawater exerts a heavy influence (Figure 3).
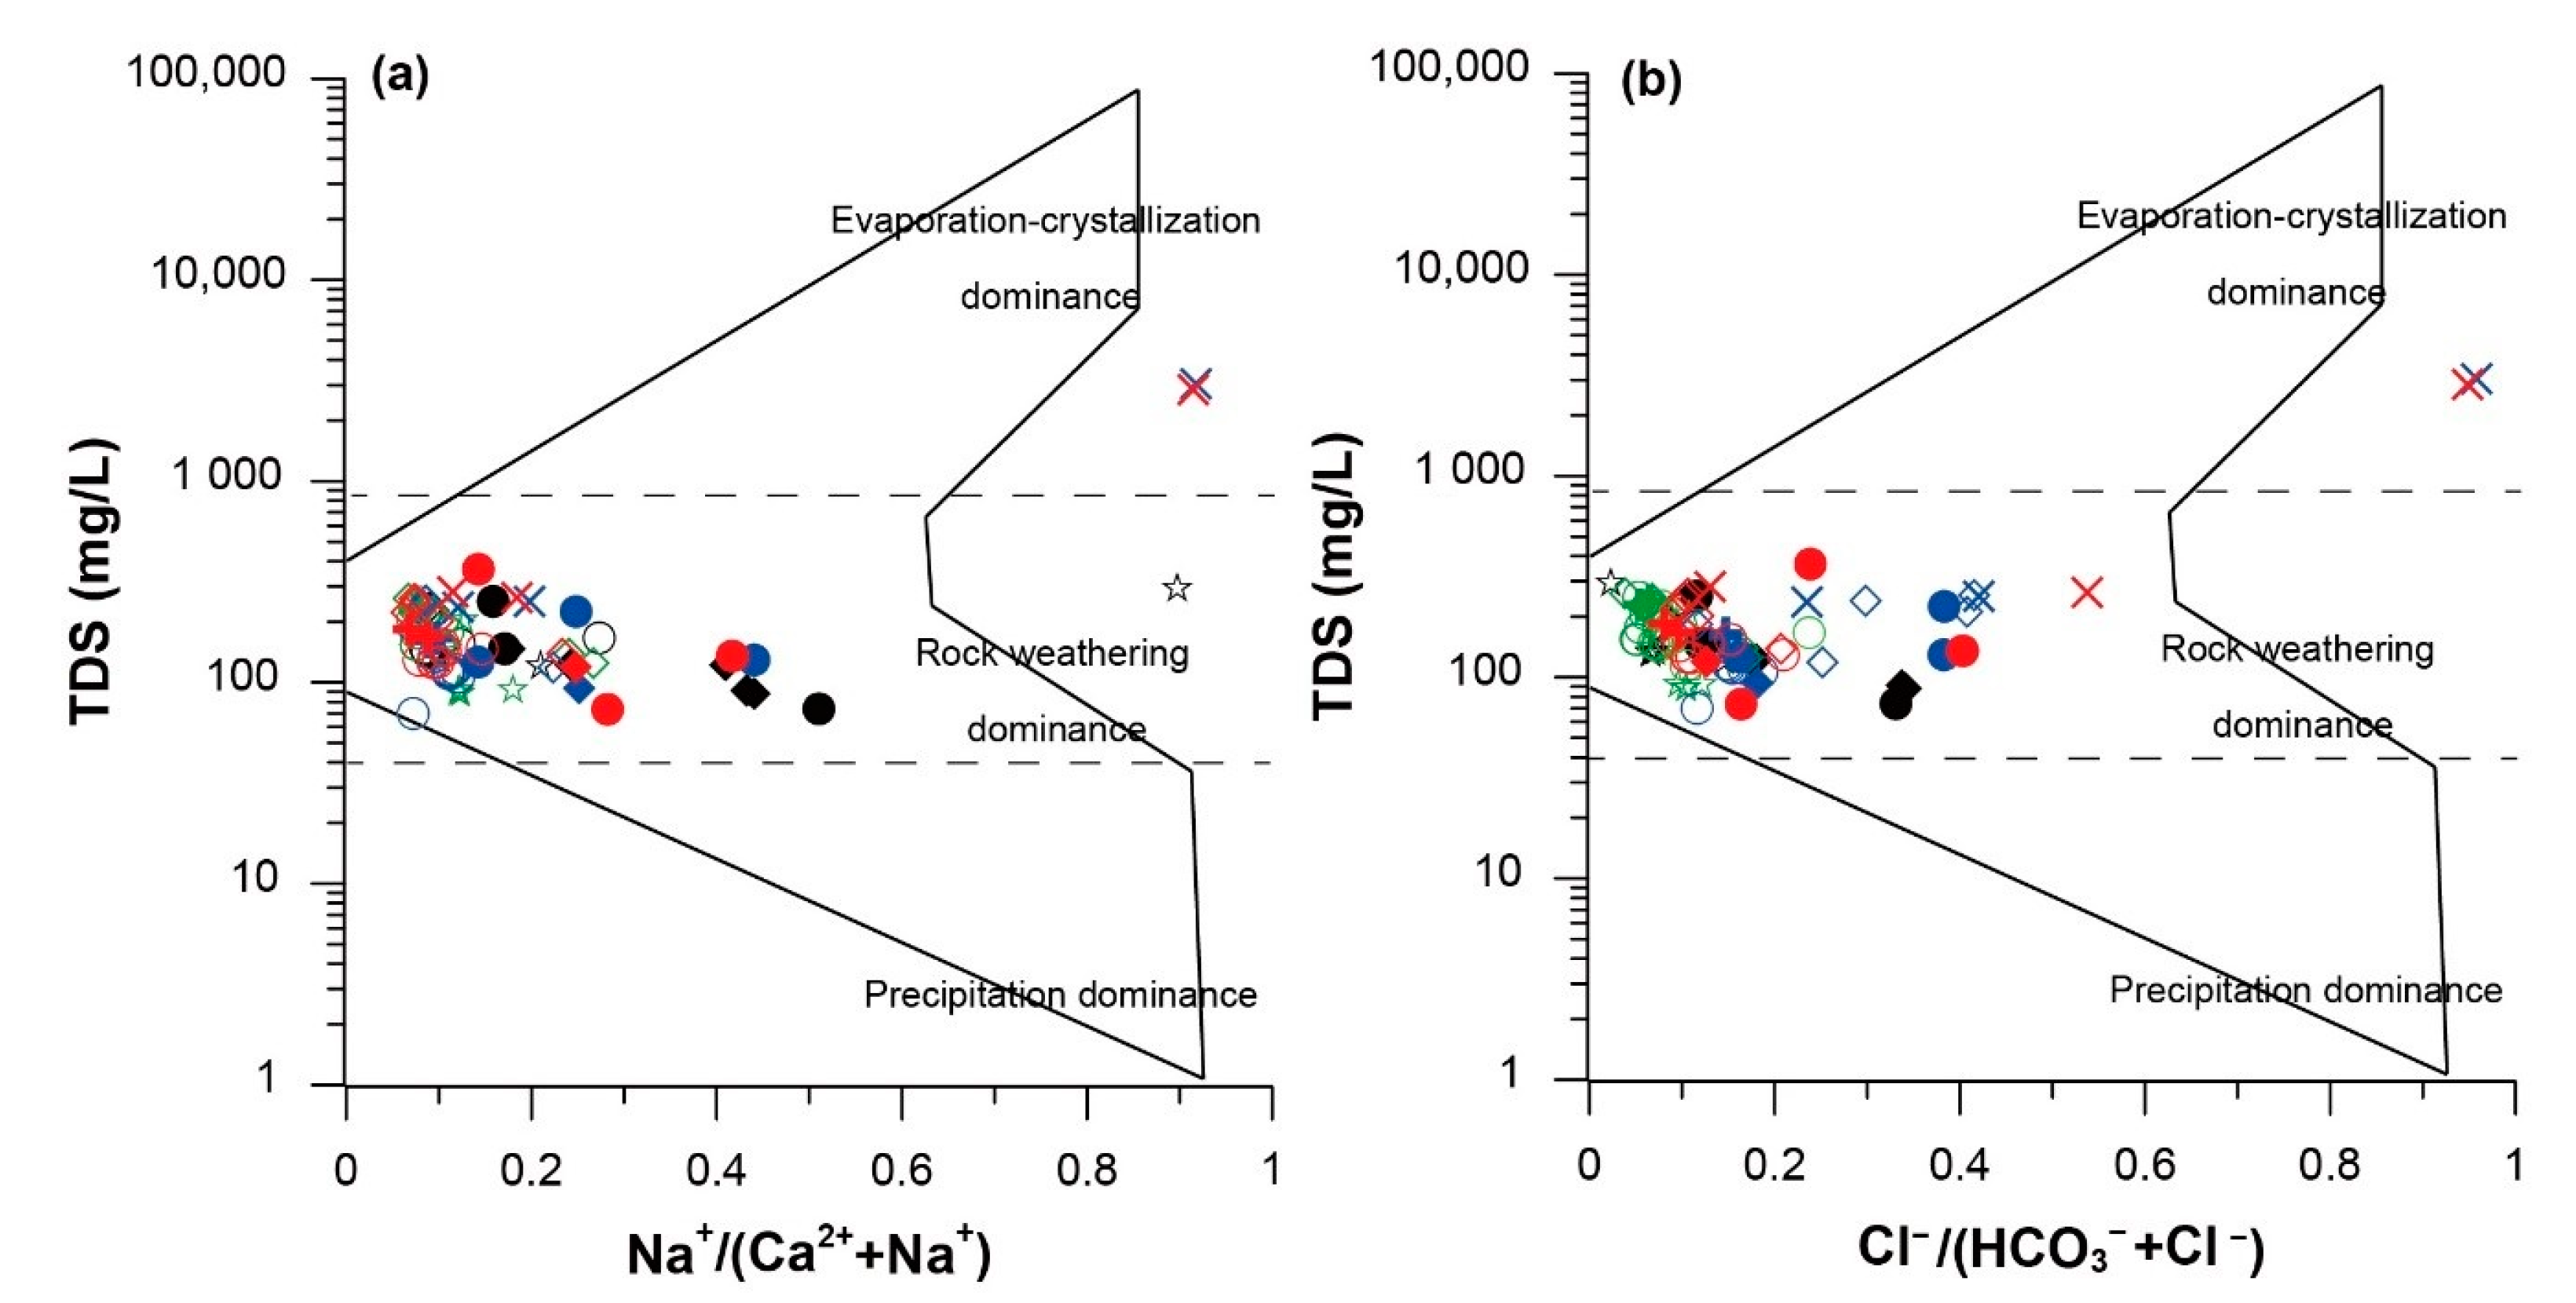
As shown in Figure 4, groundwater had a larger proportion of Na+/(Ca2++Na+) than surface water. However, there was no significant difference in the proportion of Ca−/(HCO3−+Cl−) between groundwater and surface water. Gibbs diagrams revealed that both groundwater and surface water in the study areas were mostly affected by water–rock interactions. Evaporation was dominant only at SJS4, which was greatly influenced by seawater and comprised the Na-Cl type, as illustrated in Figure 3. This is because the sampling point had exceedingly high concentrations of Na+ and Cl− [27,28].
3.2. Seasonal Hydrochemical Characteristics
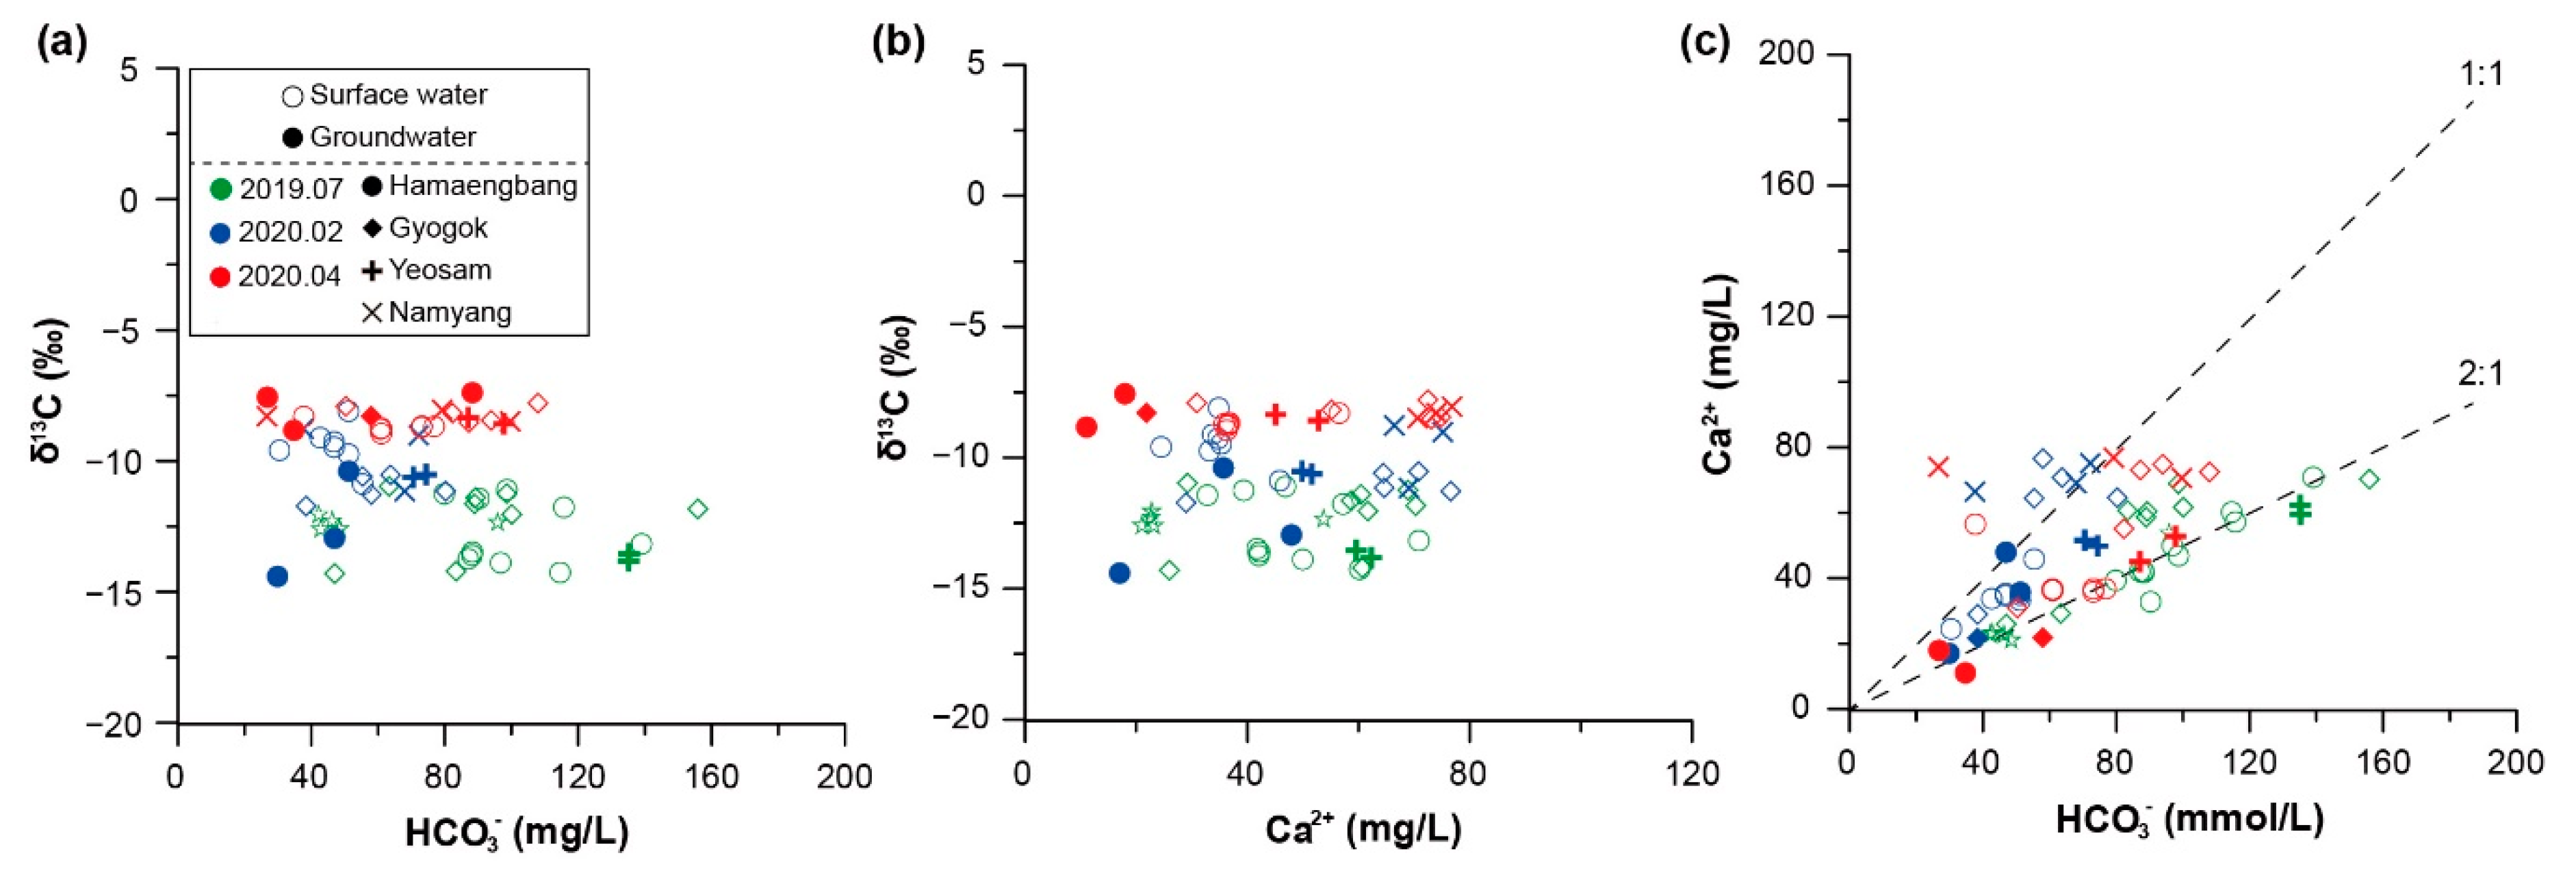
When δC increases along with an increase of HCO3 or Ca concentrations in a carbonate area, water–carbonate rock interactions (dissolution of bedrock) can occur more actively [29]. According to the δC-HCO3 and δC-Ca graph, the groundwater and stream water in the study area of Samcheok had more active water–rock interactions in the winter dry season (February and April 2020) than in the summer rainy season (July 2019). During the dry season, the water–rock interactions was more active in February than in April (Figure 5a,b).
Figure 5c shows different slopes according to season. As HCO3 increases, Ca tends to increase as well, thereby suggesting that the water quality of the study areas is affected by carbonate minerals (Figure 5c). HCO3-Ca graphs are mainly used for studies on the origin of carbonates. When a HCO3/Ca ratio is between 1:1 and 2:1, silicate weathering is the dominant process. On the other hand, when the ratio is between 2:1 and 4:1, carbonate weathering is the dominant process [27,30,31]. In the dry season (February and April 2020), most samples were plotted between HCO3/Ca ratios of 1:1 and 2:1, which indicated the dominance of silicate weathering. In the rainy season (July 2019), the majority of samples were plotted between HCO3/Ca ratios of 2:1 and 4:1, which indicated the dominance of carbonate weathering (Figure 5c).
In the saturation index (SI) graph, calcite has a higher saturation index than dolomite in the dry season, whereas dolomite has a higher saturation index than calcite in the rainy season (Figure 6). An enormous amount of white precipitate was observed across the study areas. The precipitate is the result of the oversaturation of carbonate minerals. In the saturation index graph, all the sites except downtown Samcheok showed an unsaturation state, where SI is less than 0, in the dry season (Figure 6). However, all the target sites exhibited an oversaturation state, where SI is greater than 0, during summer (Figure 6). Accordingly, the white precipitate in the study areas is estimated to have occurred in the rainy season, and it seems to have been affected by carbonate rocks.
3.3. Regional Characteristics
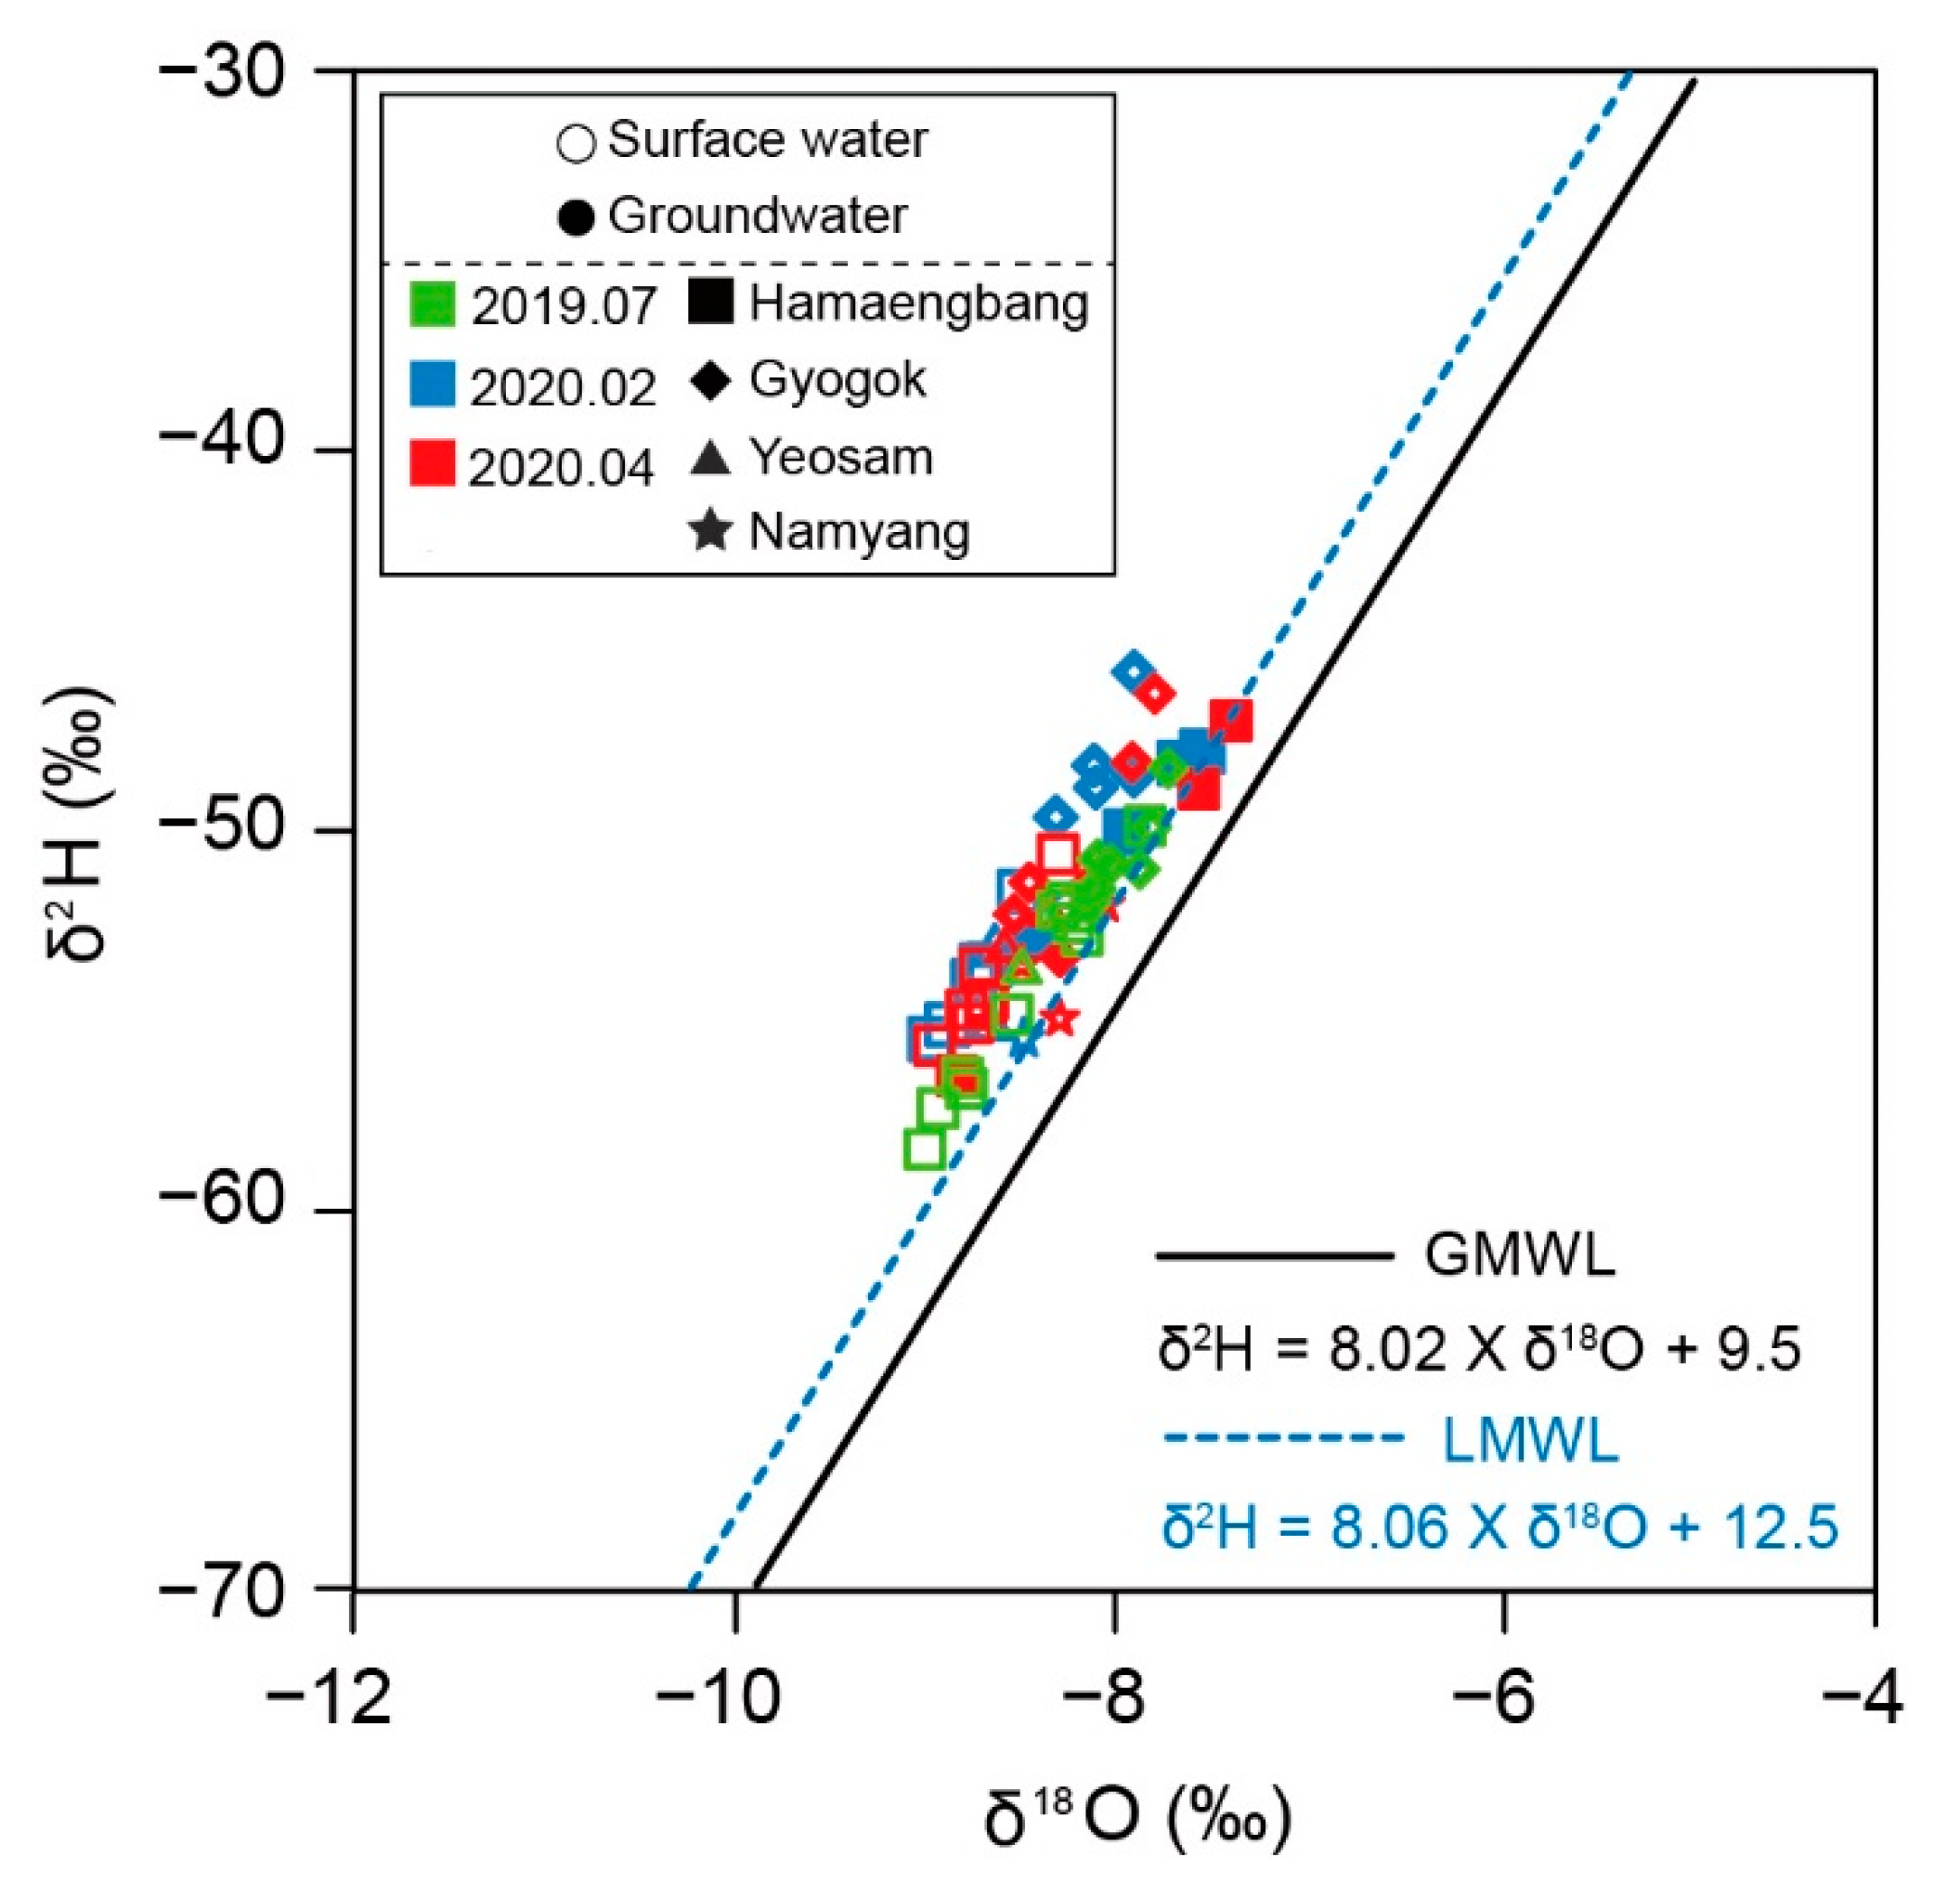
It is important to estimate the origin of water through oxygen-hydrogen isotopes [32,33]. The oxygen-hydrogen stable isotope values range from −45.82 to −57.29‰ of δ2H and from −7.39 to −8.97‰ of δ18O, and a local meteoric water line (LMWL) was used for Chuncheon on a graph (Figure 7) [34]. In addition, most of the data are shown on the same line slightly above LMWL, all of which seem to originate from the same source. According to Ryu et al. [11], the water in the study area is illustrated in the ratio of 1.16:1 (Cl−:Na+), so the groundwater and surface water of the study areas come from seawater evaporation occurring through a short pathway from the East Sea.
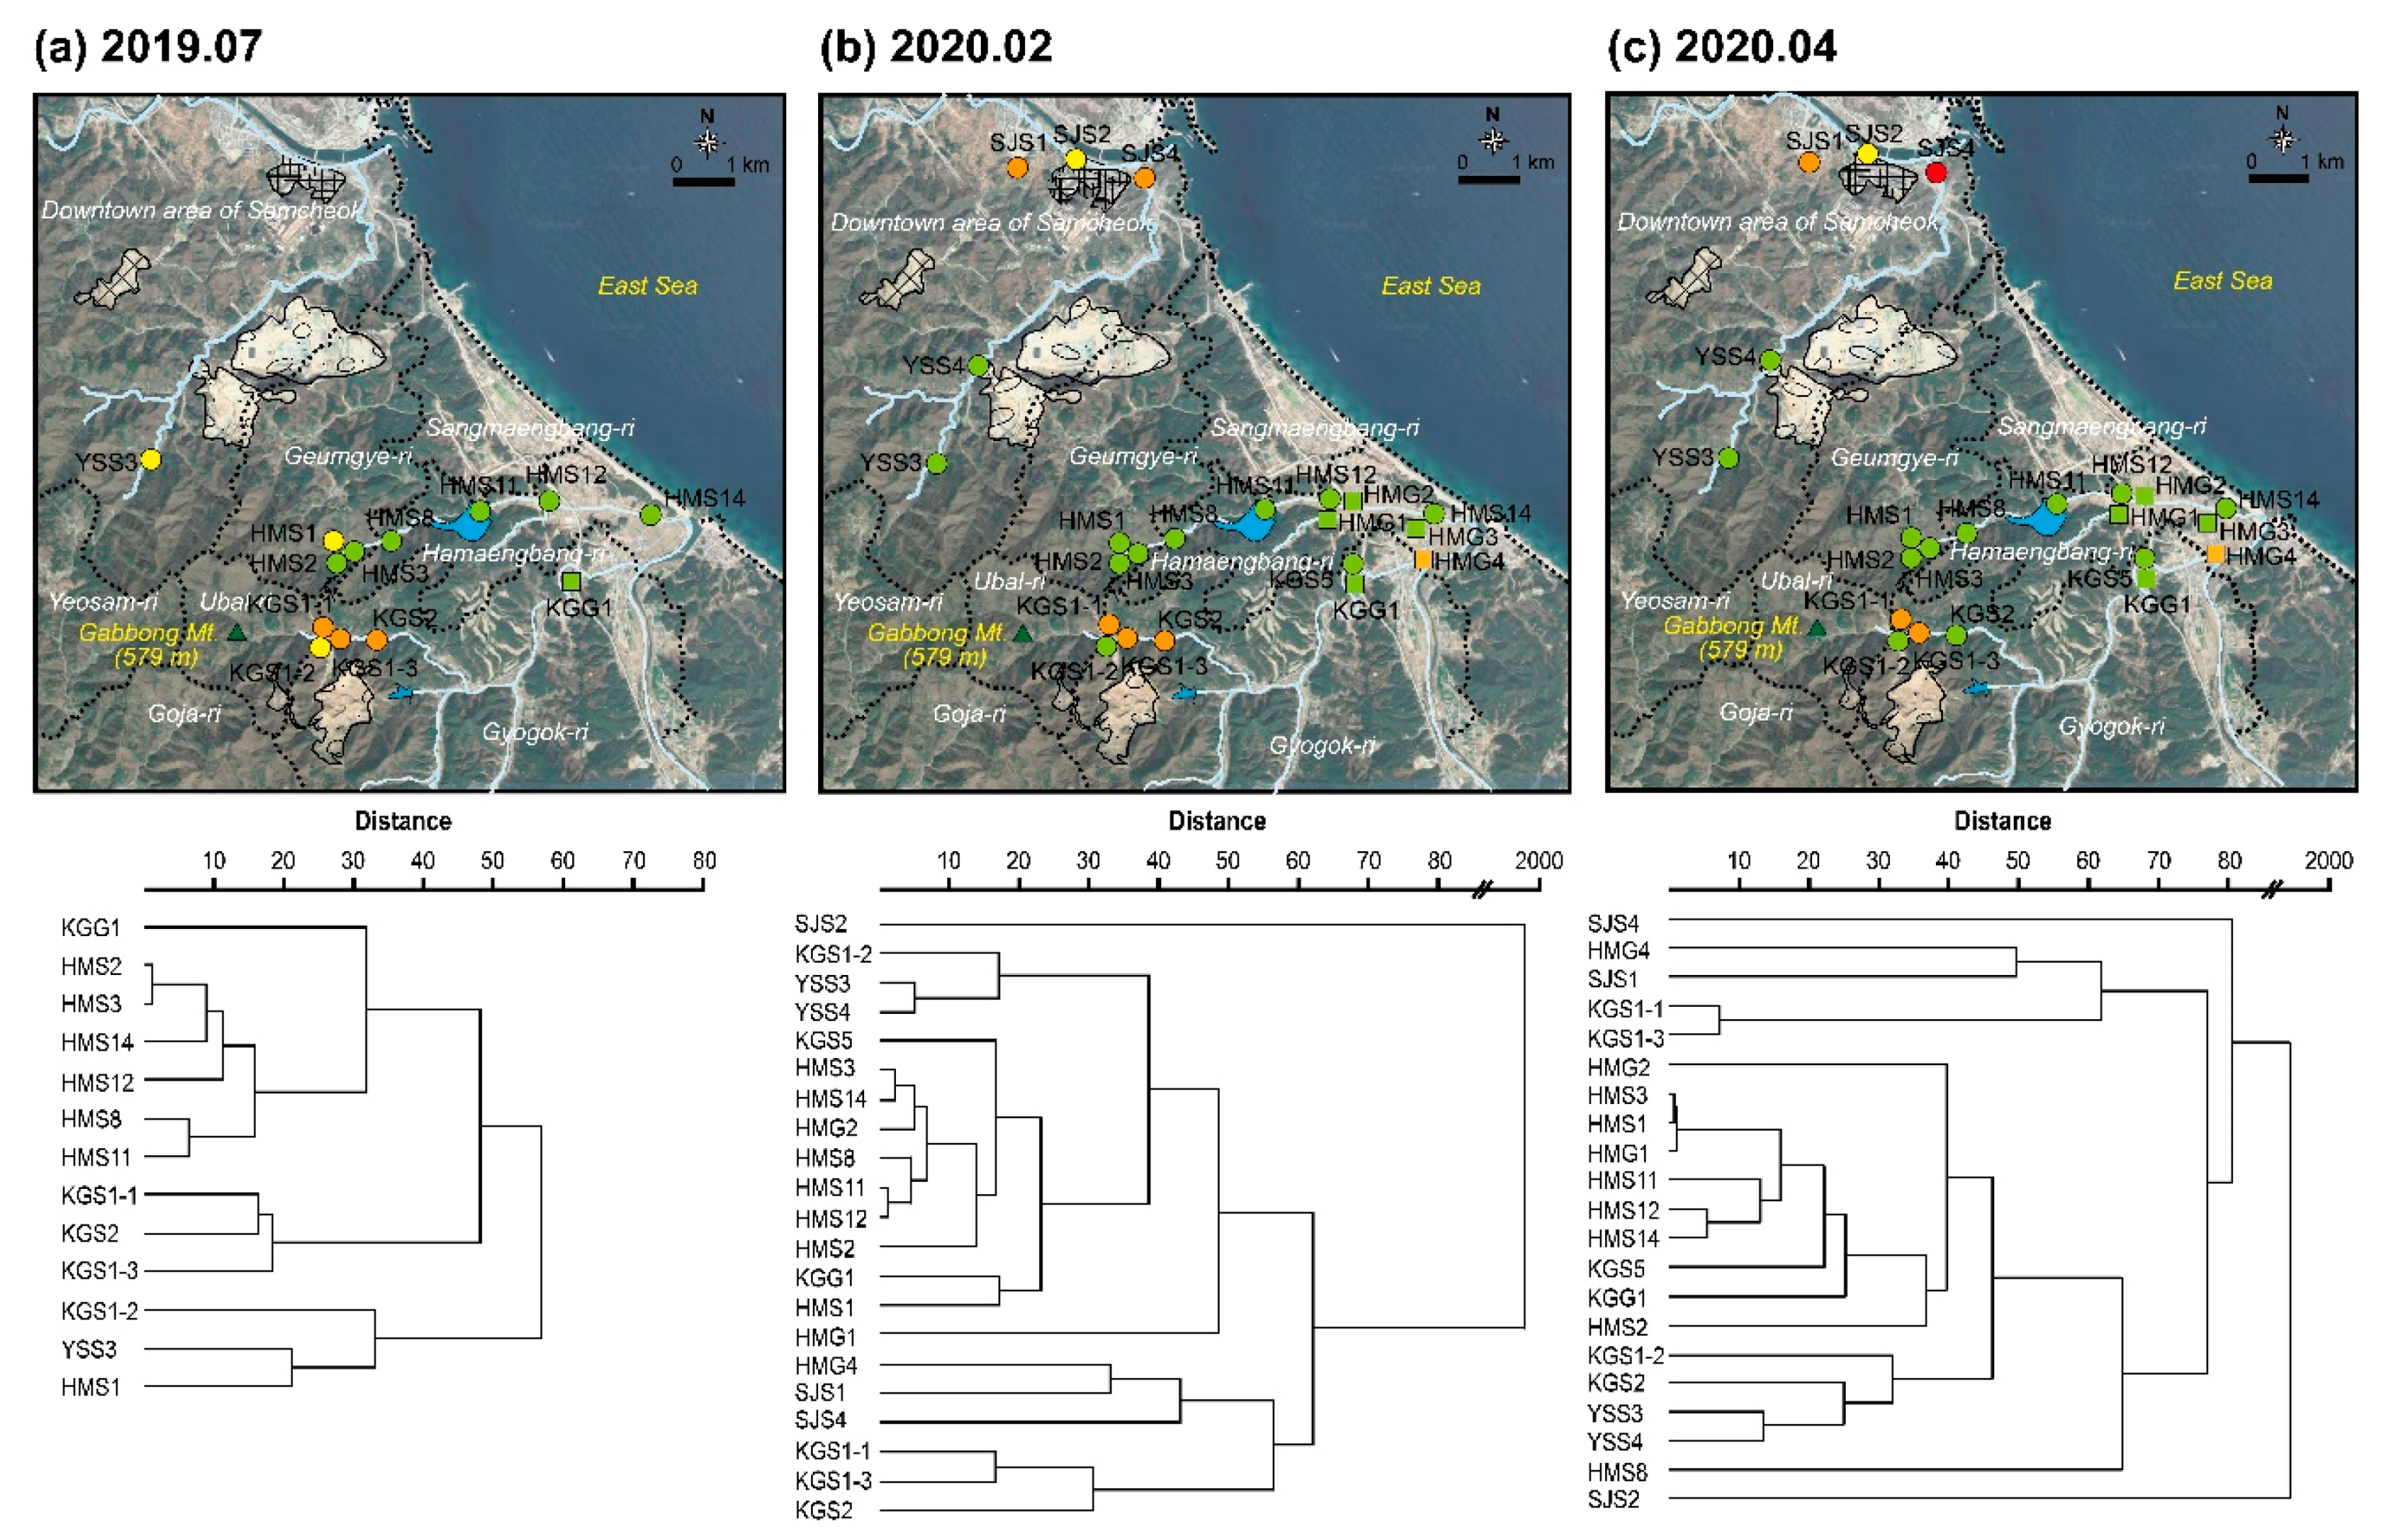
A cluster analysis was performed based on the cation/anion analysis results obtained in July 2019 and February and April 2020. Generally, the water quality results of Hamaengbang-ri and Yeosam-ri showed similar microbial communities, and Gyogok-ri and the downtown area of Samcheok had similar water quality (Figure 8). Although the groundwater and surface water of the study areas were generated through the aforementioned short pathway, different water quality characteristics were observed. This may mean that the study area does not have remarkable hydraulic connectivity. As an exceptional case, however, KGS1-2, located in Gyogok-ri, is not stream water; instead, it flows out from between rocks near a limestone mine. KGS1-2 has similar water quality characteristics to the small waterfall (HMS1) flowing from somewhere near Cheonwang temple in Yeosam-ri (YSS3 and YSS4) and Hamaengbang-ri. Mt. Gabbong, with an elevation of 579 m, is located in Ubal-ri, but is also surrounded by Gyogok-ri, Hamaengbang-ri, and Yeosam-ri. Thus, these points (KGS1-2, HMS1, YSS3, YSS4) show similar microbial communities based on common influence of the water system originating from Mt. Gabbong.
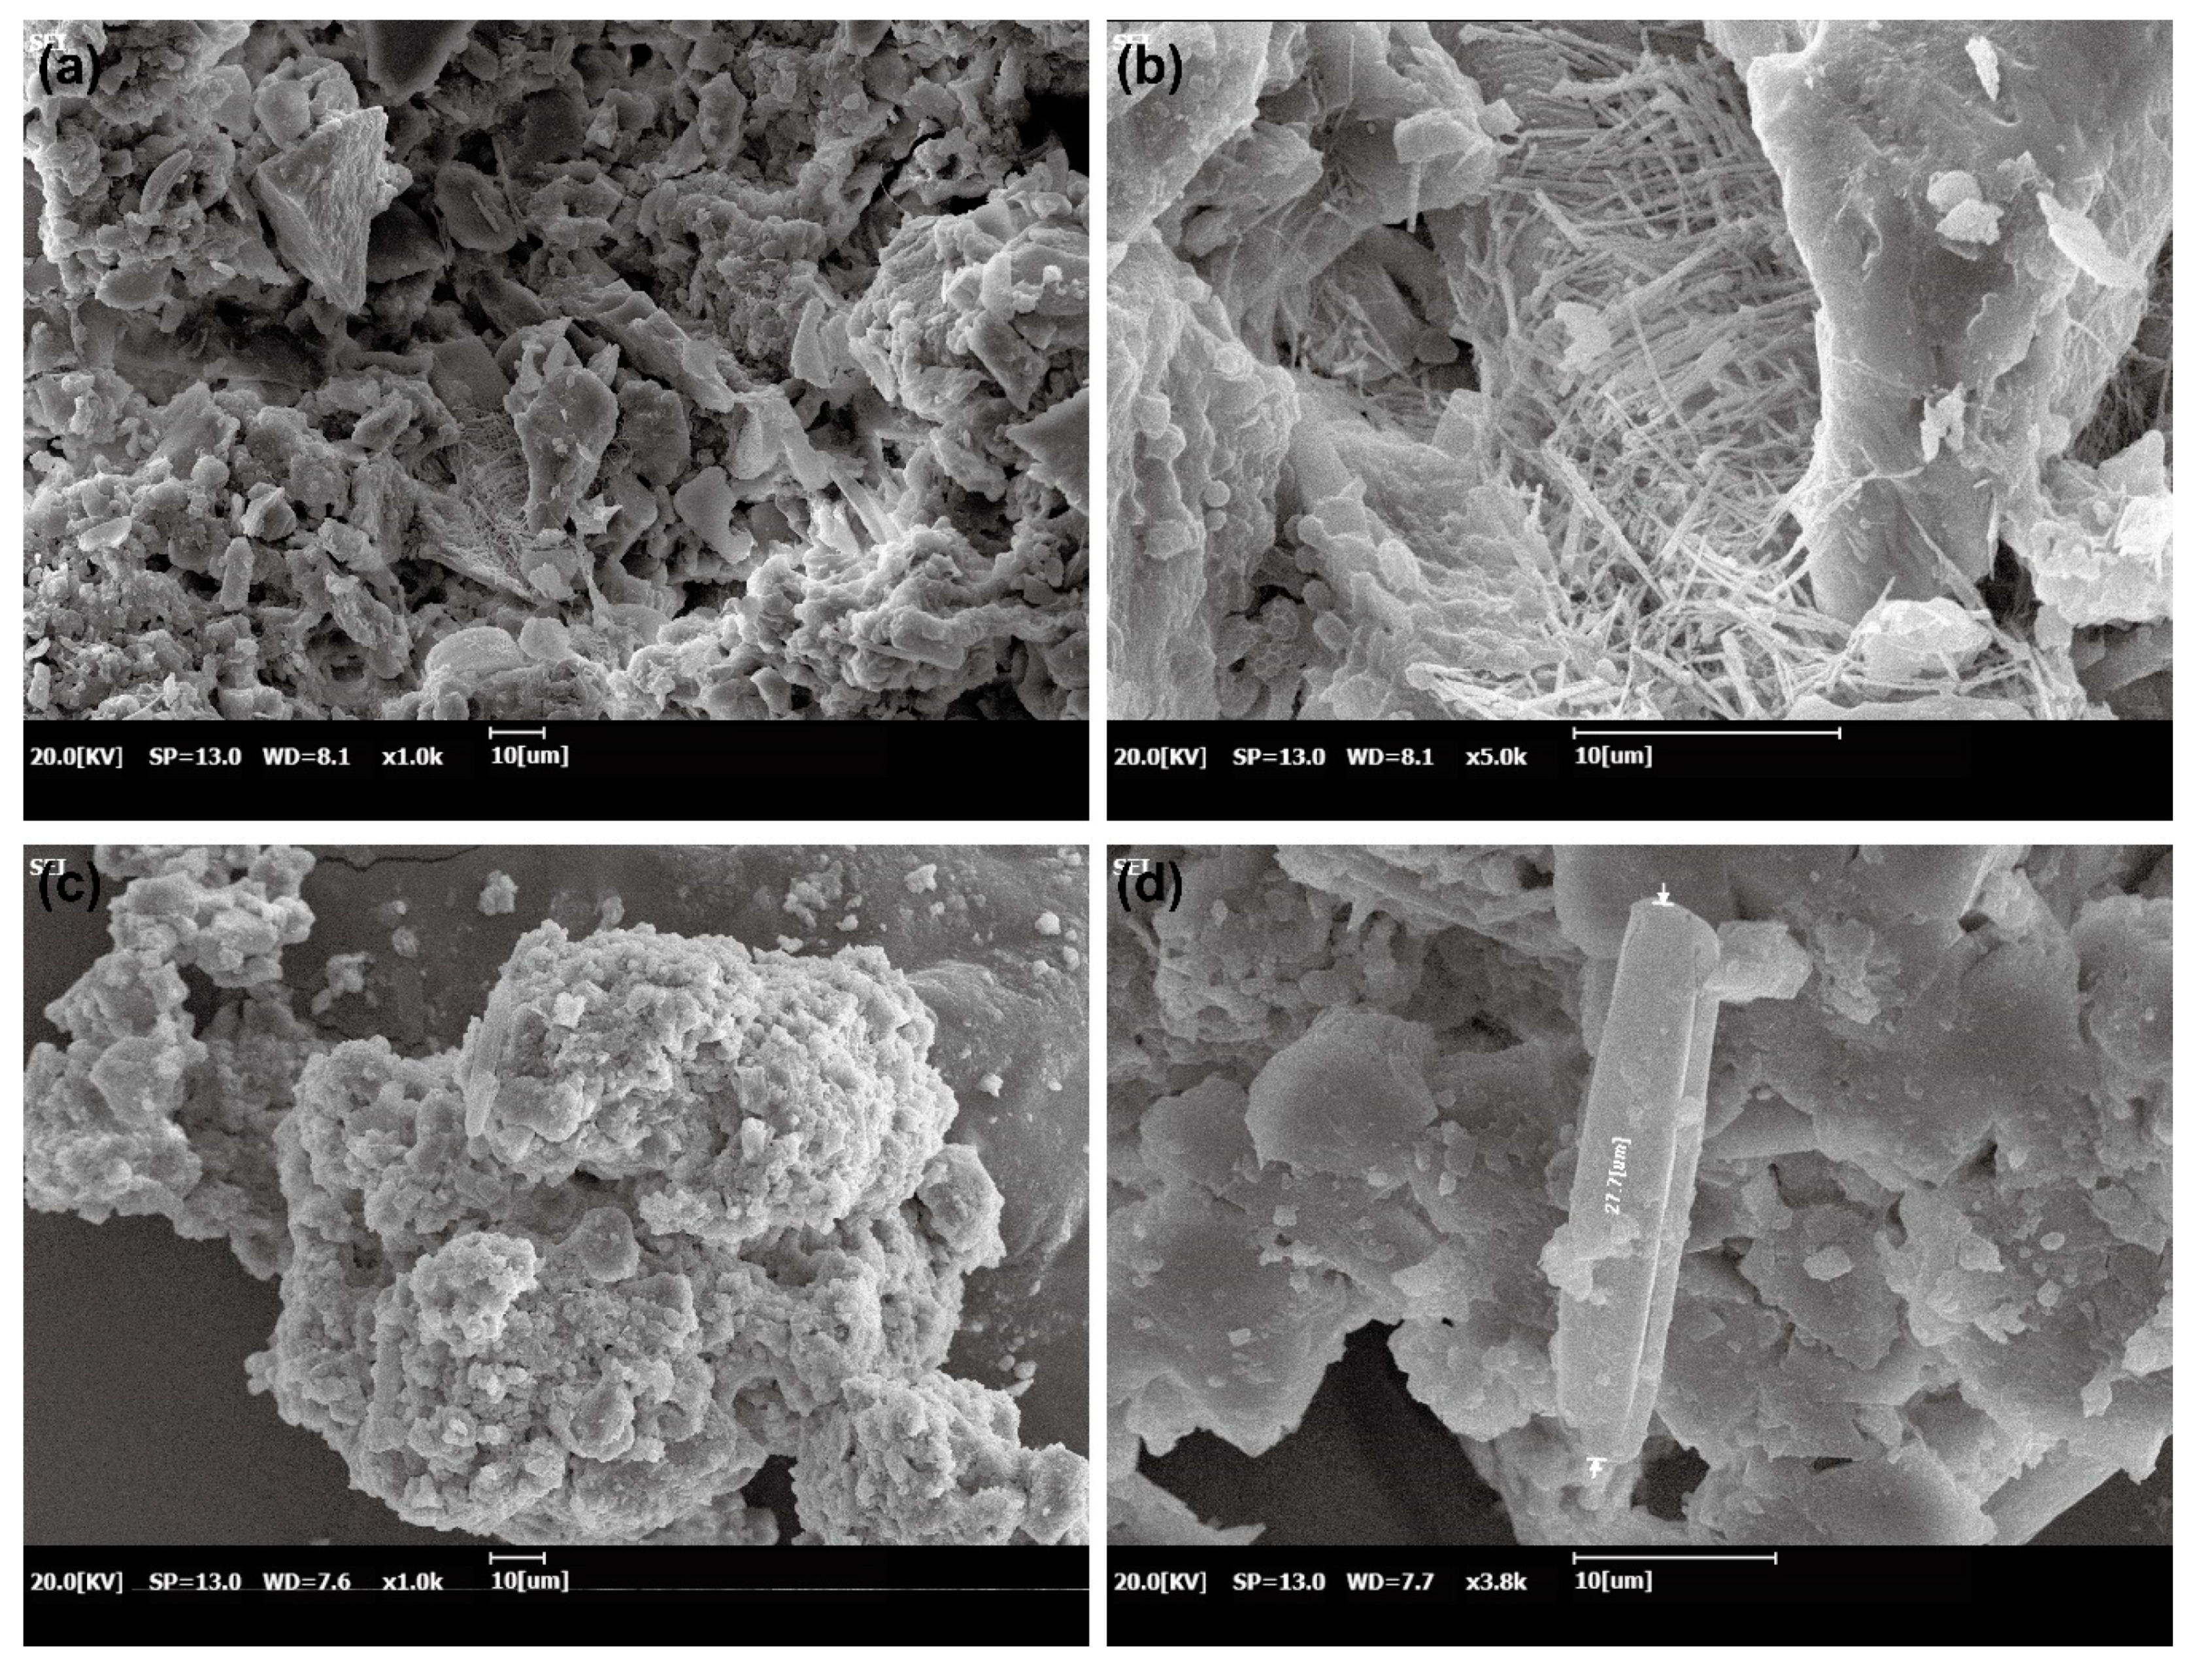
The SEM analysis for the matter precipitated by water sample evaporation revealed clearly different characteristics between the two points of HMS2 and KGS1-3 (Figure 9). In HMS2, diatoms were abundant, and minerals had an exceedingly low crystallinity. Furthermore, most of the minerals were not crystalline. In addition, the crystal shapes of minerals were difficult to observe, and even if observed, they were fragmentary or needle-shaped (Figure 9a,b). In KGS1-3, by contrast, the majority of precipitated material comprised crystalline clay minerals. Some crystals were pyramid-shaped, and others were sheet-shaped (Figure 9c,d).
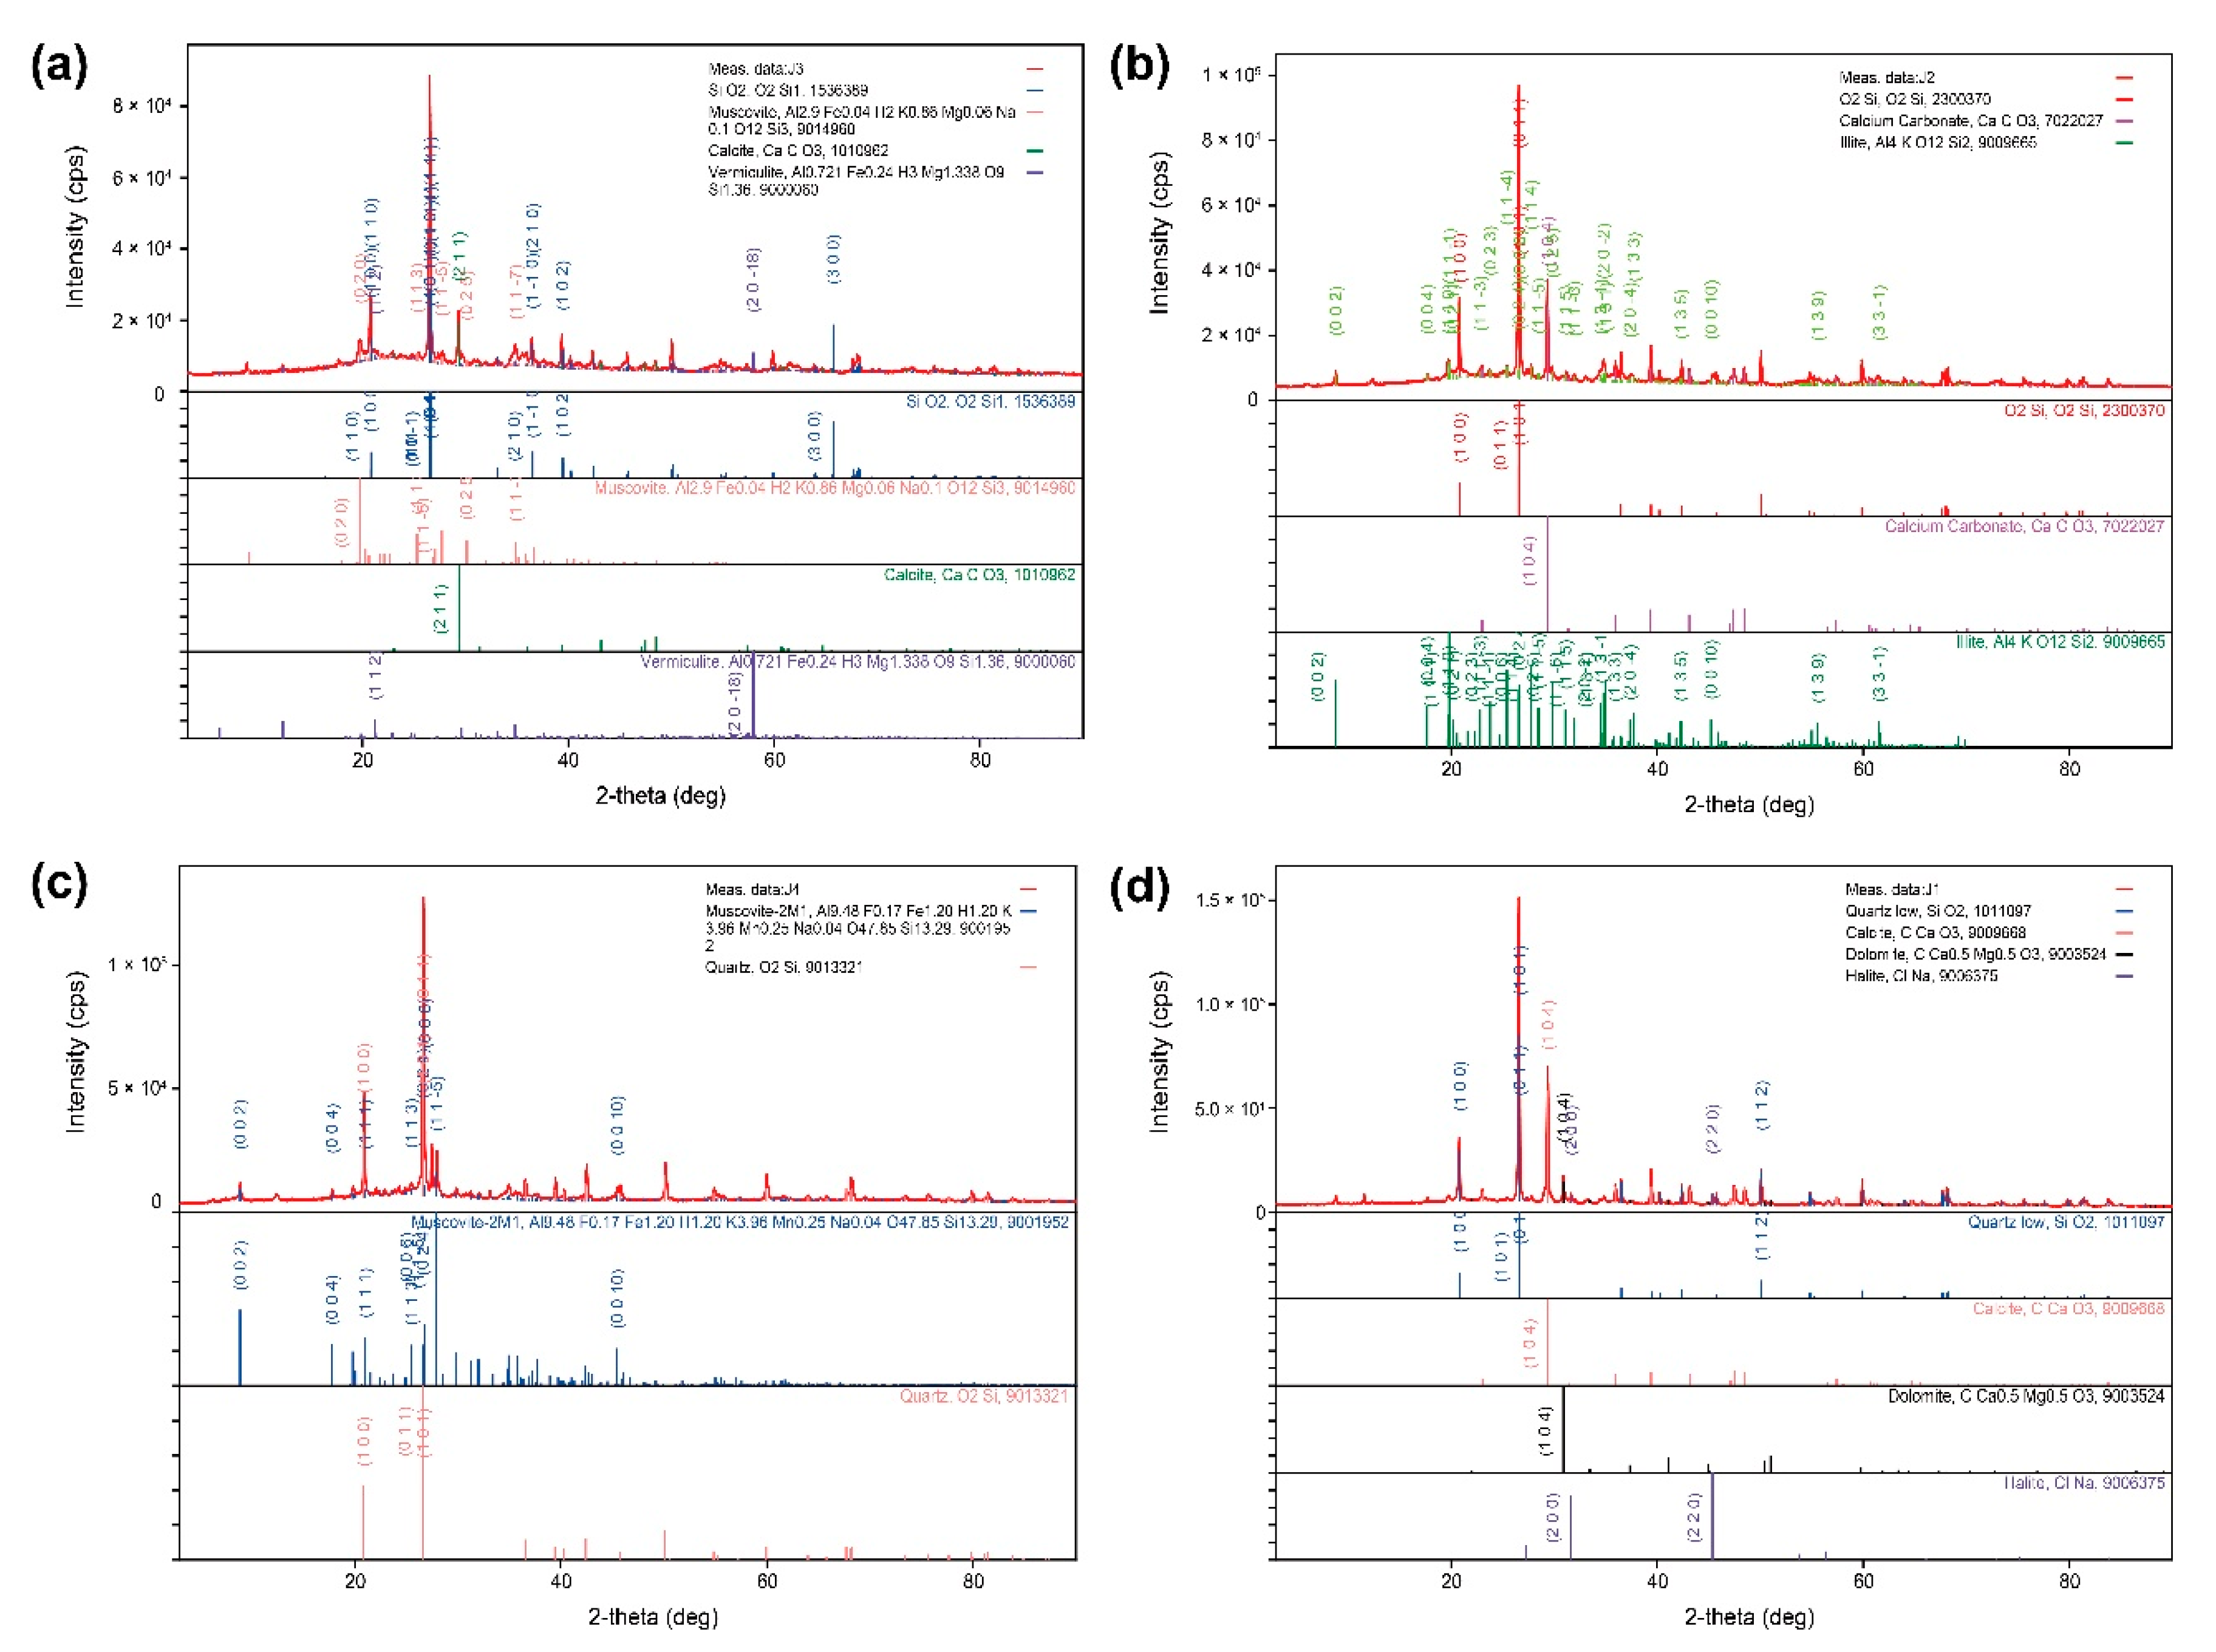
The XRD analysis for the precipitated material obtained from HMS1, KGS1-1, KGS5, and SJS1 revealed that samples of HMS1 were composed of minerals such as quartz, muscovite, calcite, and vermiculite. Accordingly, we estimate that HMS1 is affected by silicate minerals as well as carbonate rocks and originates from Hwajeol and Dongjeom formations (Figure 10a) [35]. KGS1-1 comprises quartz, calcite, and illite and is estimated to have originated from hydrothermally altered limestones of the Pungchon formation (atmospheric formation) (Figure 10b) [35]. KGS5 has muscovite and quartz as constituent minerals and appears to be affected by the same formation as HMS1 (Figure 10c). The constituent minerals of SJS1 are quartz, calcite, dolomite, and halite. As in KGS1-1, these minerals have originated from the Pungchon formation. Halite appears to reflect the influence of seawater seepage (Figure 10d).
As shown in Figure 11, the phylum-level analysis disclosed that the Proteobacteria phylum was the most dominant, with a high percentage of 73.18%, and the Bacteroidetes phylum was second most dominant, with a percentage of 24.25% in sample KGS1-1 near the limestone mine. A dendrogram was used to identify microbial groups, which were generated by clustering microbial community structures and evaluating the similarity among those groups. The sample KGS1-1 collected near mine lot 49 was relatively similar to the sample SJS4 collected from the downtown area of Samcheok. HMS11 and HMS14 showed the lowest similarity to KGS1-1.
Regarding microbial diversity, alpha-diversity was calculated using the Mothur package. Operational taxonomic units (OTUs) were analyzed with a 97.0% cut-off. The KGS1-1 sample had 992 OTUs, and the HMS2 sample included 5,392 OTUs. The Good’s Library coverage listed in Table 2 indicates the amount of sequence information that appears per analyzed sample; this coverage is calculated using the following formula: [1 − (n/N)] × 100. n and N represent the number of OTUs and the total number of reads, respectively.
Indexes such as ACE, CHAO, Jackknife, Shannon, and Good’s Library coverage are useful for directly comparing species abundance as well as species diversity among samples [16,25,36]. The species abundance indexes (Shannon indexes) were 3.55 in KGS1-1 and 7.55 in HMS2. Specifically, the species abundance of the HMS2 sample was much higher than the 2.41–2.99 range for bacteria in normally-polluted groundwater and the 2.93 value for sediment samples collected from eutrophic lakes. The KGS1-1 sample showed a relatively low level of microbial diversity. The samples HMS2 and HMS8 were collected from the cave water discharged from Sohan cave and from the stream, respectively, and had the highest diversity of microbial community structures; recall that the stream was also the habitat of freshwater laver. The two samples also exhibited high similarity to each other. In addition, the sample HMS1 collected near Sohan cave showed the most similar microbial community structure to the sample YSS3 collected in Yeosam-ri. These samples also had high similarity to each other (Table 2).
4. Conclusions
This study evaluated the hydrochemical characteristics of groundwater and surface water recharging in the karst areas of Samcheok. The hydrochemical characteristics were comparatively analyzed according to seasons and sampling points. In the study areas, the pH mean values of groundwater were slightly acidic and those of surface water were slightly alkaline. Unlike typical water quality, surface water had higher EC values than underground water. Probably because groundwater can be equilibrated with the bedrock by dissolution/precipitation during the residence time, while surface water can be subject to surface discharge, tributaries, or anthropogenic contamination. Most of the samples were comprised of Ca-HCO3, and the second most frequent type was Ca-HCO3-Cl. Many samples belonging to this types were groundwater flowing in agricultural areas. Like other typical carbonate areas, the influence of water–rock interactions was the most dominant. Water–rock interactions more active in the dry season (February and April 2020) than in the rainy season (July 2019). In the dry season, calcite weathering was dominant, and calcite had the highest SI. In the rainy season, conversely dolomite weathering was dominant, and dolomite had the highest SI. In the dry season, the SI values of aragonite, calcite, and dolomite were less than 0 (undersaturation). However, in the rainy season, those minerals showed SI values over 0 (oversaturation). Accordingly, the white precipitate mainly distributed in the study areas was likely generated in the summer season. Regional characteristics were compared through a series of analyses, including cluster analysis, precipitate analysis (SEM and XRD) and microbial analysis. The comparative analyses revealed similar water quality characteristics between Hamaengbang-ri and Yeosam-ri and also between Gyogok-ri and the downtown area of Samcheok. In karst areas, the water flow is different from what is observed in superficial drainage systems. For this reason, neighboring areas did not have close hydraulic connectivity, and areas far from each other showed similar hydraulic results. Thus, karst areas have an extremely complicated water system, which should be further investigated in the future. In the study results, the karst water flow suggested the possibility of flows in unexpected places. Therefore, our findings will be important to management and research on karst water, and because there are few studies of hydrochemical and microbial characteristics in the karst area in Korea, this study will can provide useful basic data.
Author Contributions
Conceptualization, methodology: H.-S.R., H.K., J.-Y.L., and J.J.; software: H.-S.R., J.J. and S.P.; validation: H.-S.R., H.K. and J.-Y.L.; investigation, resources: J.J., H.K., S.P., J.-Y.L. and H.S.R.; data curation: H.-S.R., H.K. and J.J.; writing—original draft preparation: H.-S.R., H.K. and J.J.; writing—review and editing: H.-S.R. and H.K.; visualization: H.-S.R., H.K., J.J. and J.-Y.L.; supervision: H.K. and J.-Y.L.; project administration: H.-S.R. and H.K.; funding acquisition: H.K. and J.-Y.L. All authors have read and agreed to the published version of the manuscript.
Funding
This research was funded by the Korea Environment Industry and Technology Institute (KEITI) through the Measurement and Risk Assessment Program for the Management of Microplastics Program, funded by the Korea Ministry of Environment (MOE), grant number 2020003110010; and the Basic Science Research Program through the National Research Foundation of Korea (NRF) funded by the Ministry of Education, grant Number 2019R1I1A2A01057002 and 2019R1A61A03033167; and 2020 Research Grant from Kangwon National University.
Conflicts of Interest
The authors declare no conflict of interest.
References
- Kim, H. Comparison of PCR primers for analyzing denitrifying microorganisms in the hyporheic zone. Appl. Sci. 2020, 10, 4172. [Google Scholar] [CrossRef]
- Panno, S.V.; Kelly, W.R.; Scott, J.; Zheng, W.; McNeish, R.E.; Holm, N.; Hoellein, T.J.; Baranski, E. Microplastic contamination in karst groundwater systems. Groundwater 2009, 57, 189–196. [Google Scholar] [CrossRef] [PubMed]
- Ford, D.C.; Williams, P.W. Karst Geomorphology and Hydrology; DCFordSpringer: London, UK, 1989; p. 601. [Google Scholar]
- Michel, B. Karst groundwater: A challenge for new resources. Hydrogeol. J. 2005, 13, 148–160. [Google Scholar]
- Stevanovic, Z. Karst waters in potable water supply: A global scale overview. Environ. Earth Sci. 2019, 78, 662. [Google Scholar] [CrossRef]
- Goldscheider, N.; Drew, D. Methods in Karst Hydrogeology; Taylor & Francis: London, UK, 2007; pp. 1–9. [Google Scholar]
- Langer, W.H. Potential Environmental Impacts of Quarrying Stone in Karst—A Literature Review; USGS: Reston, VA, USA, 2001; pp. 1–35.
- Liu, Z.; Li, Q.; Sun, H.; Wang, J. Seasonal, diurnal and storm-scale hydrochemical variations of typical epikarst springs in subtropical karst areas of SW China: Soil CO2 and dilution effects. J. Hydrol. 2007, 337, 207–223. [Google Scholar] [CrossRef]
- Liu, Z.; Zhao, J. Contribution of carbonate rock weathering to the atmospheric CO2 sink. Environ. Geol. 2000, 39, 1053–1058. [Google Scholar] [CrossRef]
- Yoshimura, K.; Nakao, S.; Noto, M.; Inokura, Y.; Urata, K.; Chen, M.; Lin, P.W. Geochemical and stable isotope studies on natural water in the Taroko Gorge karst area, Taiwan-chemical weathering of carbonate rocks by deep source CO2 and sulfuric acid. Chem. Geol. 2001, 177, 415–430. [Google Scholar] [CrossRef]
- Ryu, H.S.; Lee, J.Y.; Lim, C.W.; Kim, K. Hydrochemical characteristics of groundwater and stream water in a karst area of Samcheok. Korea. J. Geol. Soc. Korea 2019, 55, 117–129. [Google Scholar] [CrossRef]
- Klimchouk, A. Hypogene Karst Regions and Caves of the World; Springer: Berlin, Germany, 2017; pp. 1–40. [Google Scholar]
- Assaad, F.A.; Jordan, H. Karst terranes and environmental aspects. Environ. Geol. 1994, 23, 228–237. [Google Scholar] [CrossRef]
- Zhang, C.; Li, Z.; Cu, M.; Deng, C.; Liu, M.; Li, L. Spatial and vertical distribution and pollution assessment of soil fluorine in a lead-zinc mining area in the Karst region of Guangxi, China. Plant Soil Environ. 2010, 56, 282–287. [Google Scholar] [CrossRef] [Green Version]
- Xu, K.; Dai, G.; Duan, Z.; Xue, X. Hydrogeochemical evolution of an Ordovician limestone aquifer influenced by coal mining: A case study in the Hancheng mining area, China. Mine Water Environ. 2018, 37, 238–248. [Google Scholar] [CrossRef]
- Kim, H.; Jang, J.; Park, S.; Kim, C.S.; Ryu, H.S.; Lee, J.Y. Spatial variations in microbial compositions in a karst critical zone in Samcheok, Republic of Korea. Appl. Sci. 2020, 10, 4714. [Google Scholar] [CrossRef]
- Park, Y.; Lee, J.Y.; Lim, H.G.; Park, Y.C. Characteristics of hydraulic conductivity of carbonate aquifers in Gangwon Province. J. Eng. Geol. 2011, 21, 79–85. [Google Scholar] [CrossRef]
- Lee, J.Y.; Raza, M.; Park, Y.C. Current status and management for the sustainable groundwater resources in Korea. Episodes 2018, 41, 179–191. [Google Scholar] [CrossRef] [Green Version]
- ME (Ministry of Environment). K-Water Report of Groundwater Basic Survey in Donghae and Samcheok Area; K-Water: Gwacheon, Korea, 2018; pp. 6–80. [Google Scholar]
- Woo, K.S.; Won, C.K.; Lee, K.C.; Choi, Y.K. Comprehensive Investigation Report of Chodang Cave; Samcheok City: Samcheok, Korea, 2000; pp. 11–85. [Google Scholar]
- Won, J.K.; Park, B.K.; Lee, S.H. Geologic Report on Samcheock-Gosari Sheet; KIGAM: Daejeon, Korea, 1994; pp. 1–36. [Google Scholar]
- Beta Analytic. Available online: https://www.radiocarbon.com/ (accessed on 21 October 2020).
- Park, Y.; Kwon, K.S.; Kim, N.; Lee, J.Y.; Yoon, J.G. Change of geochemical properties of groundwater by use of open loop geothermal cooling and heating system. J. Geol. Soc. Korea 2013, 49, 289–296. [Google Scholar]
- Mothur. Available online: https://mothur.org/ (accessed on 25 October 2020).
- Kim, H.; Lee, K.K. Effect of vertical flow exchange on microbial community distributions in hyporheic zones. Episodes 2019, 42, 1–19. [Google Scholar] [CrossRef]
- Guseva, N. The origin of the natural water chemical composition in the permafrost region of the eastern slope of the Polar Urals. Water 2016, 8, 594. [Google Scholar] [CrossRef]
- Das, N.; Patel, A.K.; Deka, G.; Das, A.; Sarma, K.P.; Kumar, M. Geochemical controls and future perspective of arsenic mobilization for sustainable groundwater management: A study from Northeast India. Groundw. Sustain. Dev. 2015, 1, 92–104. [Google Scholar] [CrossRef]
- Barzegar, R.; Moghaddam, A.A.; Nazemi, A.H.; Adamowski, J. Evidence for the occurrence of hydrogeochemical processes in the groundwater of Khoy plain, northwestern Iran, using ionic ratios and geochemical modeling. Environ. Earth Sci. 2018, 77, 597. [Google Scholar] [CrossRef]
- Sampyo, K.N.U. Groundwater Impact Investigation Report (1st Stage) on High Quality Limestone Development of Dongyang 2nd Mine; Sampyo: Samcheok, Korea, 2017; pp. 42–47. [Google Scholar]
- Xu, P.; Feng, W.; Qian, H.; Zhang, Q. Hydrogeochemical characterization and irrigation quality assessment of shallow groundwater in the central-western Guanzhong basin, China. J. Environ. Res. Public Health 2019, 16, 1492. [Google Scholar] [CrossRef] [Green Version]
- Gao, X.; Li, X.; Wang, W.; Li, C. Human activity and hydrogeochemical processes relating to groundwater quality degradation in the Yuncheng basin, northern China. J. Environ. Res. Public Health 2020, 17, 867. [Google Scholar] [CrossRef] [PubMed] [Green Version]
- Grobe, M.; Machel, H.G.; Heuser, H. Origin and evolution of saline groundwater in the Munsterland Cretaceous basin, Germany: Oxygen, hydrogen, and strontium isotope evidence. J. Geochem. Explor. 2000, 69–70, 5–9. [Google Scholar] [CrossRef]
- Brian, H. Geochemistry and origin of formation waters in the western Canada sedimentary basin-I. Stable isotopes of hydrogen and oxygen. Geochim. Cosmochim. Acta 1969, 33, 1321–1349. [Google Scholar]
- Park, Y.; Lee, K.S.; Yu, J.Y. Seasonal variations of dissolved ions and oxygen and hydrogen isotopic compositions of precipitation in Chuncheon, Korea. J. Geol. Soc. Korea 2006, 42, 283–292. [Google Scholar]
- Noh, J.H.; Oh, S.J. Hydrothermal Alteration of the Pungchon Limestone and the Formation of High Ca Limestone. J. Geol. Soc. Korea 2005, 41, 175–197. [Google Scholar]
- Kim, H.; Kaown, D.; Mayer, B.; Lee, J.Y.; Lee, K.K. Combining pyrosequencing and isotopic approaches to assess denitrification in a hyporheic zone. Sci. Total Environ. 2018, 631–632, 755–764. [Google Scholar] [CrossRef] [PubMed]
Figure 1.
(a) Location and simplified map of the study area with water sampling locations; (b) cross-sectional view showing the elevation of the study area.
Figure 1.
(a) Location and simplified map of the study area with water sampling locations; (b) cross-sectional view showing the elevation of the study area.

Figure 2.
Monthly precipitation and daily mean air temperature measured at the automatic weather station, approximately 10 km northwest of the study area.
Figure 2.
Monthly precipitation and daily mean air temperature measured at the automatic weather station, approximately 10 km northwest of the study area.

Figure 3.
Water types of karst water (groundwater and surface water) samples in the study area. The Yeosam and Namyang areas contained only stream water sampling data [26].
Figure 3.
Water types of karst water (groundwater and surface water) samples in the study area. The Yeosam and Namyang areas contained only stream water sampling data [26].

Figure 4.
Gibbs diagrams of the water samples in the karst area (a) total dissolved solids (TDS) vs. Na+/(Ca2++Na+); (b) TDS vs. Cl−/(HCO3−+Cl−) [27,28].

Figure 5.
Scatter plots representing the hydrochemical trends (a) δ13C vs. HCO3−; (b) δ13C vs. Ca2+; and (c) Ca2+ vs. HCO3−.
Figure 5.
Scatter plots representing the hydrochemical trends (a) δ13C vs. HCO3−; (b) δ13C vs. Ca2+; and (c) Ca2+ vs. HCO3−.

Figure 6.
Saturation index (SI) for relative carbonate minerals (aragonite, calcite, and dolomite) by seasonal variations.
Figure 6.
Saturation index (SI) for relative carbonate minerals (aragonite, calcite, and dolomite) by seasonal variations.

Figure 7.
Relationship between the δ18O and δ2H values in surface water and groundwater.

Figure 8.
Cluster analysis accounting to water chemistry data (cation/anion and alkalinity) at the sampling point of the study area by research period: (a) July 2019, (b) February 2020, and (c) April 2020. Identical colors of points on the map denote the same cluster. The software used this chemistry data cluster analysis (algorithm: Paired group (UPGMA), similarity index: Euclidean) is PAST3.

Figure 9.
Scanning electron microscopy (SEM) analysis showing the matter precipitated by water sample evaporation (a,b) Hamaengbang area; (c,d) Gyogok area.
Figure 9.
Scanning electron microscopy (SEM) analysis showing the matter precipitated by water sample evaporation (a,b) Hamaengbang area; (c,d) Gyogok area.

Figure 10.
Results of X-ray diffraction (XRD) analysis of matter precipitated by water sample evaporation at (a) HMS1, (b) KGS1-1, (c) KGS5, and (d) SJS1.
Figure 10.
Results of X-ray diffraction (XRD) analysis of matter precipitated by water sample evaporation at (a) HMS1, (b) KGS1-1, (c) KGS5, and (d) SJS1.

Figure 11.
Taxonomic classification of bacteria samples at phylum and class level, and UniFrac UPGMA clustering (used software: PAST3, algorithm: Paired group (UPGMA), similarity index: Euclidean) of the bacteria communities.
Figure 11.
Taxonomic classification of bacteria samples at phylum and class level, and UniFrac UPGMA clustering (used software: PAST3, algorithm: Paired group (UPGMA), similarity index: Euclidean) of the bacteria communities.


Table 1.
Statistics of field parameters and ionic compositions of karst water for July 2019–April 2020.
Table 1.
Statistics of field parameters and ionic compositions of karst water for July 2019–April 2020.
| Parameter | Hamaengbang-ri | Gyogok-ri | Yeosam-ri | Downtown Area | Groundwater | ||||||||||||||||||||
|---|---|---|---|---|---|---|---|---|---|---|---|---|---|---|---|---|---|---|---|---|---|---|---|---|---|
| Max. | Min. | Mean | SD * | CV. ** | Max. | Min. | Mean | SD* | CV. ** | Max. | Min. | Mean | SD * | CV. ** | Max. | Min. | Mean | SD * | CV. ** | Max. | Min. | Mean | SD * | CV. ** | |
| Temperature (°C) | 20.0 | 4.4 | 12.1 | 5.0 | 41.5 | 21.0 | 5.0 | 13.9 | 5.1 | 36.9 | 16.0 | 7.7 | 12.3 | 3.4 | 27.8 | 15.4 | 8.9 | 12.3 | 2.3 | 19.1 | 17.1 | 9.5 | 12.9 | 2.6 | 20.1 |
| pH | 8.4 | 6.5 | 7.5 | 0.7 | 9.2 | 8.6 | 5.9 | 7.4 | 1.0 | 13.7 | 8.5 | 7.2 | 8.1 | 0.6 | 7.2 | 8.3 | 6.9 | 7.7 | 0.4 | 5.8 | 7.3 | 5.5 | 6.5 | 0.6 | 9.1 |
| EC (μS/cm) | 541.0 | 183.7 | 235.2 | 76.2 | 32.4 | 504.0 | 213.0 | 340.8 | 68.5 | 20.1 | 305.0 | 255.0 | 283.8 | 18.6 | 6.5 | 4960.0 | 423.0 | 1534.8 | 1832.6 | 119.4 | 688.0 | 96.6 | 298.7 | 165.4 | 55.4 |
| Ca2+ (mg/L) | 60.2 | 24.5 | 39.6 | 8.4 | 21.1 | 76.6 | 29.0 | 62.2 | 15.0 | 24.2 | 59.6 | 45.1 | 51.8 | 5.2 | 10.1 | 76.8 | 66.4 | 72.0 | 4.0 | 5.5 | 113.2 | 11.1 | 35.1 | 31.3 | 89.3 |
| Mg2+ (mg/L) | 4.6 | 1.0 | 3.1 | 0.7 | 21.1 | 6.4 | 3.8 | 5.1 | 0.8 | 15.2 | 5.9 | 4.8 | 5.1 | 0.4 | 8.2 | 107.7 | 7.3 | 40.5 | 49.0 | 147.9 | 13.1 | 1.9 | 5.8 | 3.5 | 60.7 |
| Na+ (mg/L) | 6.3 | 1.9 | 4.3 | 0.9 | 20.5 | 9.4 | 4.8 | 6.2 | 1.3 | 21.6 | 5.4 | 3.8 | 4.7 | 0.6 | 12.8 | 837.0 | 9.2 | 285.3 | 421.9 | 147.9 | 18.9 | 4.4 | 10.5 | 4.9 | 46.6 |
| K+ (mg/L) | 13.2 | 0.3 | 1.5 | 2.7 | 181.0 | 5.3 | 0.8 | 2.3 | 1.1 | 49.0 | 2.1 | 0.7 | 1.2 | 0.6 | 48.1 | 60.5 | 3.0 | 20.1 | 236 | 117.2 | 11.5 | 0.9 | 3.7 | 3.6 | 98.3 |
| HCO3− (mg/L) | 114.6 | 30.5 | 67.8 | 22.6 | 33.3 | 155.9 | 38.4 | 81.7 | 293 | 35.8 | 135.3 | 70.5 | 93.0 | 25.9 | 27.9 | 99.6 | 26.7 | 63.9 | 27.1 | 42.4 | 88.3 | 26.8 | 48.6 | 19.4 | 39.9 |
| SO42− (mg/L) | 8.0 | 2.8 | 5.6 | 1.2 | 20.7 | 11.8 | 6.2 | 8.7 | 1.7 | 19.9 | 7.0 | 5.4 | 6.1 | 0.7 | 12.0 | 257.0 | 37.9 | 121.1 | 97.6 | 80.6 | 52.9 | 0.0 | 21.9 | 20.5 | 93.6 |
| Cl− (mg/L) | 13.2 | 4.0 | 8.0 | 2.2 | 27.6 | 41.2 | 5.5 | 15.2 | 11.6 | 76.7 | 12.9 | 7.7 | 10.1 | 2.3 | 22.3 | 1652.1 | 14.9 | 533.8 | 793.0 | 148.5 | 29.2 | 6.8 | 15.5 | 8.4 | 54.2 |
| NO3− (mg/L) | 9.5 | 3.4 | 5.4 | 1.5 | 26.8 | 55.4 | 4.8 | 31.9 | 21.6 | 67.9 | 8.2 | 5.9 | 6.9 | 1.0 | 14.6 | 19.9 | 7.4 | 14.4 | 5.2 | 36.2 | 33.4 | 0.0 | 8.2 | 12.2 | 148.7 |
| CO32− (mg/L) | 1.8 | 0.0 | 0.5 | 0.5 | 114.6 | 2.2 | 0.0 | 0.6 | 0.7 | 118.3 | 2.3 | 0.1 | 1.3 | 1.0 | 73.0 | 0.7 | 0.1 | 0.3 | 0.2 | 70.8 | 0.2 | 0.0 | 0.0 | 0.0 | 152.1 |
| δ13C (‰) | −8.1 | −14.3 | −10.3 | 2.0 | −19.6 | −7.8 | −14.2 | −10.4 | 1.9 | −18.4 | −8.4 | −13.5 | −10.3 | 2.1 | −20.2 | −8.1 | −11.2 | −9.0 | 1.1 | −12.6 | 4.0 | −14.4 | −8.5 | 5.3 | −61.7 |
| δ18O (‰) | −7.8 | −9.0 | −8.6 | 0.3 | −3.4 | −7.8 | −8.5 | −8.1 | 0.2 | −2.8 | −8.4 | −8.7 | −8.5 | 0.1 | −1.4 | −8.1 | −8.5 | −8.3 | 0.2 | −2.2 | −7.4 | −8.8 | −8.0 | 0.5 | −6.1 |
| δD (‰) | −49.9 | −57.3 | −57.3 | 1.9 | −3.5 | −45.8 | −52.2 | −49.6 | 2.0 | −4.0 | −52.0 | −55.0 | −53.3 | 1.1 | −2.0 | −51.5 | −55.5 | −53.2 | 1.7 | −3.2 | −47.1 | −56.4 | −50.7 | 3.1 | −6.1 |
| CBE *** | −3.00 | 1.29 | −4.05 | −0.11 | 3.70 | ||||||||||||||||||||
* SD: Standard deviation, ** CV: Coefficient of variation, *** CBE: Charge balance error.
Table 2.
Microbial diversity index.
| Sampling Point | Target Reads | OTUs | ACE | CHAO | Jackknife | NPShannon | Shannon | Phylogenetic Diversity | Good’s Library Coverage (%) |
|---|---|---|---|---|---|---|---|---|---|
| SJS4 | 63,288 | 1990 | 2072.5 | 2031.7 | 2180.0 | 5.1 | 5.1 | 2617 | 99.70 |
| HMS1 | 35,085 | 3054 | 3591.9 | 3362.2 | 3786.0 | 6.4 | 6.3 | 3776 | 97.91 |
| YSS3 | 47,840 | 4082 | 4558.3 | 4299.3 | 4830.0 | 6.8 | 6.6 | 4576 | 98.44 |
| HMS14 | 17,577 | 1167 | 1486.4 | 1350.8 | 1520.0 | 4.7 | 4.6 | 1842 | 97.99 |
| SJS1 | 34,284 | 4001 | 4594.5 | 4299.8 | 4871.0 | 7.0 | 6.8 | 4969 | 97.46 |
| HMS2 | 37,307 | 5392 | 6100.3 | 5744.5 | 6487.0 | 7.6 | 7.4 | 6222 | 97.06 |
| HMS11 | 20,099 | 1359 | 1774.7 | 1583.0 | 1808.0 | 4.7 | 4.6 | 2285 | 97.77 |
| HMS8 | 33,959 | 4184 | 4918.9 | 4582.0 | 5201.0 | 6.7 | 6.5 | 5195 | 97.01 |
| KGS1–1 | 38,534 | 992 | 1117.7 | 1041.9 | 1185.0 | 3.6 | 3.6 | 1309 | 99.50 |
Publisher’s Note: MDPI stays neutral with regard to jurisdictional claims in published maps and institutional affiliations. |
© 2020 by the authors. Licensee MDPI, Basel, Switzerland. This article is an open access article distributed under the terms and conditions of the Creative Commons Attribution (CC BY) license (http://creativecommons.org/licenses/by/4.0/).
Share and Cite
MDPI and ACS Style
Ryu, H.-S.; Kim, H.; Lee, J.-Y.; Jang, J.; Park, S. Spatio-Temporal Variations of Hydrochemical and Microbial Characteristics in Karst Water in Samcheok, South Korea. Water 2020, 12, 3407. https://doi.org/10.3390/w12123407
AMA Style
Ryu H-S, Kim H, Lee J-Y, Jang J, Park S. Spatio-Temporal Variations of Hydrochemical and Microbial Characteristics in Karst Water in Samcheok, South Korea. Water. 2020; 12(12):3407. https://doi.org/10.3390/w12123407
Chicago/Turabian StyleRyu, Han-Sun, Heejung Kim, Jin-Yong Lee, Jiwook Jang, and Sangwook Park. 2020. "Spatio-Temporal Variations of Hydrochemical and Microbial Characteristics in Karst Water in Samcheok, South Korea" Water 12, no. 12: 3407. https://doi.org/10.3390/w12123407
Note that from the first issue of 2016, this journal uses article numbers instead of page numbers. See further details here.