Using Budyko-Type Equations for Separating the Impacts of Climate and Vegetation Change on Runoff in the Source Area of the Yellow River


1
Center for Energy, Environment & Economy Research, Zhengzhou University, No. 100 Science Avenue, Gaoxin District, Zhengzhou 450001, China
2
Tourism Management School, Zhengzhou University, No. 100 Science Avenue, Gaoxin District, Zhengzhou 450001, China
3
Key Laboratory of Geographic Information Science, Ministry of Education, East China Normal University, Shanghai 200241, China
*
Author to whom correspondence should be addressed.
Water 2020, 12(12), 3418; https://doi.org/10.3390/w12123418
Submission received: 26 October 2020
/
Revised: 28 November 2020
/
Accepted: 1 December 2020
/
Published: 4 December 2020
(This article belongs to the Section Hydrology)
Abstract
:Assessing the contribution rates of climate change and human activities to the runoff change in the source area of the Yellow River can provide support for water management in the Yellow River Basin. This paper firstly uses a multiple linear regression method to evaluate the contribution rates of climate change and human activities to the vegetation change in the source area of the Yellow River. Next, the paper uses the Budyko hypothesis method to calculate the contribution rates of climatic factors (including precipitation, potential evaporation, and subsequent vegetation changes) and vegetation changes caused by human activities to the runoff change of the Tangnaihai Hydrometric Station. The results showed that: (1) the annual runoff and precipitation in the source area of the Yellow River have a downward trend, while the annual potential evaporation and NDVI (Normalized Difference Vegetation Index) show an increasing trend; (2) The contribution rates of climate change and human activities to the vegetation change in the source area of the Yellow River is 62.79% and 37.21%, respectively; (3) The runoff change became more and more sensitive to changes in climate and underlying surface characteristic parameters; (4) The contribution rates of climatic factors (including precipitation, potential evaporation, and subsequent vegetation changes) and vegetation changes caused by human activities to the runoff change at Tangnaihai Hydrological Station are 75.33% and 24.67%, respectively; (5) The impact of precipitation on runoff reduction is more substantial than that of potential evaporation.
1. Introduction
In recent years, research on the mechanism of the hydrological cycle and water resources evolution under the changing environment has gradually become a hotspot [1]. Climate change and human activities are two important factors that lead to environmental change. Climate change directly affects the hydrological and thermal conditions of rivers and has a direct impact on water resources [2,3] and human activities have an indirect impact on the hydrological process of major basins, resulting in a series of water resources problems [4]. In recent decades, almost all river basins in the world have been affected by human activities and climate change at the same time. Vórósmarty [5] has shown that water resources have declined globally due to climate change and population growth and that this decline will continue.
The source area of the Yellow River provides more than 42% of the runoff of the entire basin [6] and is its main water production area and water conservation area. In recent decades, the runoff in the source area of the Yellow River has shown a gradual decrease, which has caused serious harm to the ecological security and economic development of the Yellow River basin. Therefore, discussing the characteristics of runoff change in the source area of the Yellow River and quantitatively assessing the impact mechanisms of climate change and human activities on the runoff change in the source area of the Yellow River can provide scientific insights and supports for the utilization of water resources in the Yellow River basin.
The Budyko hypothesis method is an effective method for statistically decomposing the changes in river runoff caused by climate change and human activities and has been widely used [7,8,9,10,11,12,13,14,15,16]. In recent years, some researchers have begun to use the Budyko hypothesis method to estimate the impact of climate change and human activities on the changes in runoff in the source area of the Yellow River. Zhou et al. [17] used the Budyko formula to quantify the impact of climate change and human activities on runoff change in the source area of the Yellow River during 1960–2010 and found that 1989 was the abrupt change year of runoff in the source area of the Yellow River basin and human activities are the main factor leading to runoff change, with a contribution rate of 67.62%. Zheng et al. [18] used the Budyko formula to determine the contributions of climate and catchment changes to runoff variation for every five years during 1961–2010 and found that climate change is the main factor leading to the runoff variation in the source area of the Yellow River, accounting for 60–70%. Wang et al. [19] used the Budyko formula to quantify the impact of climate change and human activities on runoff change in the source area of the Yellow River during 1960–2015 and found that the contribution of runoff reduction was 24.0% for precipitation change and 18.0% for potential evaporation. Further, for the Yellow River source region, the contribution of climate change scenarios and human activity factors to runoff change is close to 4:6. Shang et al. [20] used the Budyko hypothesis to quantify the impact of climate change and underlying surface change on runoff for every five years during 1956–2012 and found that the contribution rate of climate change to the runoff change of the Yellow River source was 52.47–68.50%.
In the Budyko hypothesis, runoff is mainly affected by precipitation (P), evaporation (ET), and underlying surface parameters (ω). The value of the underlying surface characteristic parameters (ω) depends on the soil type, topographical factors, and land types. Soil types and topographic factors generally do not change, so the values of underlying surface parameters are mainly affected by land type changes. However, previous studies often attributed land type changes to human activities. As a matter of fact, land type changes are affected by both climatic change and human activities. Therefore, existing researches often underestimated the impact of climate change on runoff change.
The grassland and forestland area in the source area of the Yellow River accounts for more than 80%, with building land and farmland area accounting for less than 1% [21]. Assuming that the soil type and topographical factors do not change in the source area of the Yellow River, we can use vegetation changes instead of land cover changes. NDVI (Normalized Difference Vegetation Index) data can effectively represent vegetation changes, so we used the NDVI data to characterize land type changes. To accurately assess the contribution rates of climate change and human activities to runoff change in the source area of the Yellow River basin, it is necessary to distinguish the impact of natural and human factors on land type changes, which is characterized by NDVI data.
Based on the above analysis, this paper first uses both the Mann-Kendall method and the cumulative anomaly method to determine the abrupt change year of river runoff over the source area of the Yellow River from 1961 to 2015 and next, uses a multiple linear regression method to calculate the contribution rates of climate change and human activities to the NDVI in the source area of the Yellow River. Finally, this paper uses the Budyko hypothesis method to calculate the contribution rates of climatic factors (including precipitation, potential evaporation, and subsequent vegetation changes) and vegetation changes caused by human activities to the runoff change in the source area of the Yellow River.
2. Study Area and Data
2.1. Study Area
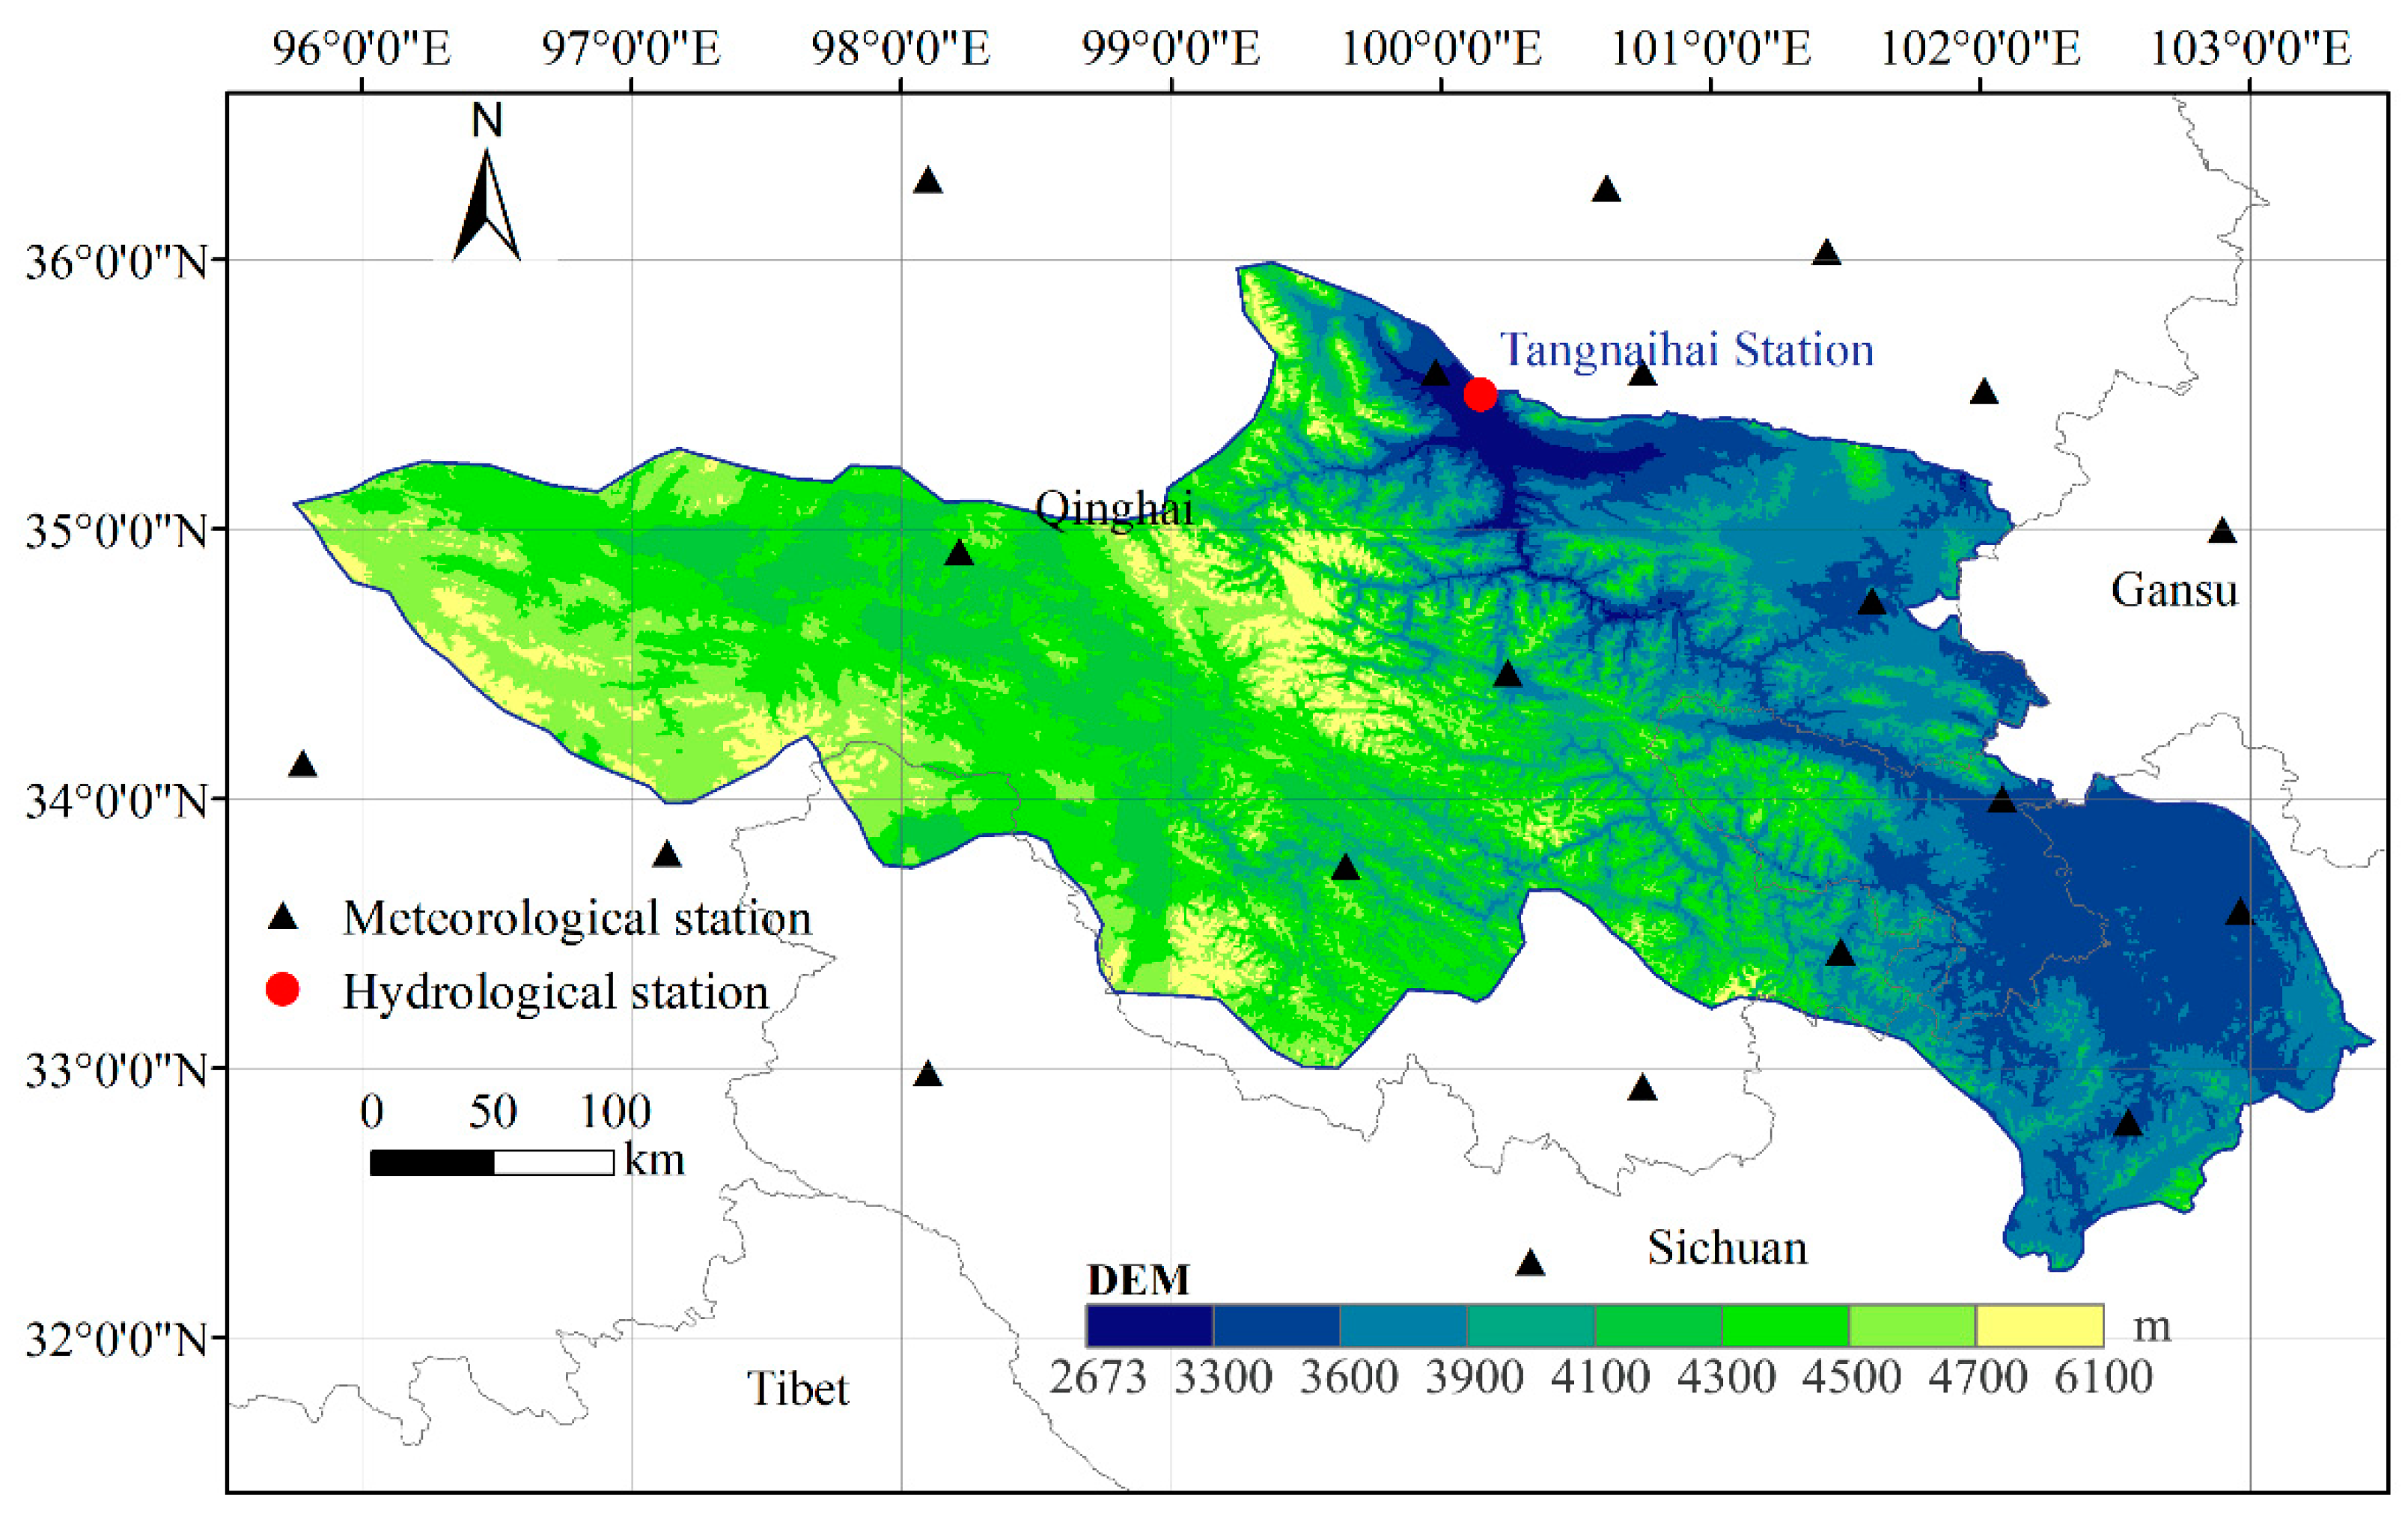
The study area is the source area of the Yellow River, which is located in the upstream of the Tangnaihai hydrological station, between 95°50′–103°30′ E longitude and 32°10′–36°05′ N latitude. The elevation of the study area is higher in the west and lower in the east. The area with an elevation above 3000 m is 12.2 × 10⁴ km2, accounting for about 17% of the total area of the whole Yellow River Basin. The reach is the main water production area and water conservation area of the whole basin. The annual average runoff of the study area is 232 × 108 m3 and provides more than 42% of the total water resources in the Yellow River basin [6]. The study area is in the central Qinghai-Tibet Plateau. The daily temperature range is large, while the annual range is narrow. The annual average temperature ranges from −3.3 to 2.5 °C and the annual precipitation is between 332.4 and 743.2 mm. The geographic location of the source area of the Yellow River and the spatial distribution of meteorological stations are shown in Figure 1.
2.2. Data Sources
The data used in this study consist of three parts: (1) the observed annual runoff data of the Tangnaihai station from 1961 to 2015 are from the Yellow River Water Conservancy Commission (http://www.yrcc.gov.cn/); (2) The 20 meteorological station data in the source area of the Yellow River are obtained from China Meteorological Administration (http://www.cma.gov.cn). The dataset contains daily meteorological data of 20 stations in and around the study area from 1961 to 2015; (3) The NDVI data used in this study were obtained from the latest GIMMS NDVI3g version1 dataset released by the National Oceanic and Atmospheric Administration in 2016 (https://ecocast.arc.nasa.gov/data/pub/gimms/3g.v1/). Its time range is from July 1981 to December 2015 and its spatial resolution is 0.0833° × 0.0833°.
3. Research Methods
3.1. Trend Analysis (Slope)
3.2. Mutation Analysis
A Mann-Kendall mutation analysis method and cumulative anomaly mutation analysis method are two widely used mutation test methods [26,27,28,29,30,31,32,33]. In order to identify the abrupt change year of runoff in the source area of the Yellow River as accurately and comprehensively as possible, these two methods were used to analyze the mutation year of runoff in this paper.
Mann-Kendall mutation test: A rank sequence is constructed for the time series matrix X containing n samples and the formulas are as follows:
where UF1 = 0, E(sk) and Var(Sk) represent the mean and variance of Sk, respectively. Their calculation formulas are as follows:
Then, use the reverse order of X to perform the operation again according to the above formula (2)–(6). At the same time, make UBk = UFk (k = n, n − 1, …, 1), UB1 = 0 to obtain the UB statistical curve. If the UF curve intersects with the UB curve and the intersection point is in the range of the 0.05 significance level, it can be considered that the year represented by the intersection point is the abrupt change year.
Cumulative anomaly method: for the time series matrix X containing n samples, the calculation formulas of cumulative anomaly values at time t are as follows:
where is the average value.
Then, the extreme point on the curve between the value of cumulative anomaly value St and the time t is the mutation year.
3.3. Budyko Hypothesis
The water balance equation is expressed as [34]:
where R represents runoff, P is precipitation, ET is evaporation, and ΔS represents the change of catchment storage water, which is considered 0 for a long period of time [35,36,37,38]. ET can be calculated based on the Budyko hypothesis. The formula is as follows [39,40]:
where ET0 represents the annual average potential evaporation (mm) and ω is the underlying surface characteristic parameters. ET0 can be calculated using the Penman-Monteith equation.
where Δ is the slope of the saturation vapor pressure versus temperature curve (kPa·°C−1), Rn is the net radiation flux density at the surface (MJ/m2·d), G is the sensible heat flux density from the surface to the soil (MJ/m2·d), γ is the psychrometric constant (kPa·°C−1), U2 is the wind speed at 2 m (m/s), T is the average temperature (°C), ea is the saturation vapor pressure at air temperature (kPa), and ed is the actual vapor pressure of the air (kPa).
Combining formulas (9) and (10), the water balance equation can be transformed into formula (12):
The elastic coefficients of precipitation, potential evaporation, and underlying surface characteristic parameter to runoff can be calculated by formula (13)–(15) [15,34]:
where is the elastic coefficient of precipitation, is the elastic coefficient of potential evaporation, and is the elastic coefficient of the underlying surface characteristic parameters.
The runoff data are divided into two periods: the base period (T1) and the change period (T2) based on the abrupt year of runoff at Tangnaihai hydrological Station in the Yellow River Basin. The annual average precipitation in the base period (T1) is P1. The average annual precipitation in the changing period (T2) is P2. The change in annual precipitation can be expressed as:
The changes of potential evaporation () and underlying surface characteristic parameter () can be calculated from the T1 period to the T2 period using formulas (17) and (18):
where is the runoff variation value caused by annual average precipitation change from the T1 period to the T2 period, is the runoff variation value caused by annual average potential evaporation change from the T1 period to the T2 period, and is the runoff variation value caused by underlying surface characteristic parameter change from the T1 period to the T2 period.
The value of the underlying surface characteristic parameters (ω) depends on the soil type, topographical factors, and vegetation coverage. Assuming that the soil type and topographical factors do not change in the source area of the Yellow River, we can use vegetation changes instead of land cover changes. This paper uses the NDVI data to characterize vegetation changes and uses a multiple linear regression method to estimate the contribution rates of climatic change and human activities to vegetation changes [41]. First, the NDVI time series data are also divided into two parts based on the abrupt year of runoff data at Tangnaihai hydrological station: the base period (T1) and the change period (T2). Next, the average NDVI change in the two periods can be calculated as:
where is the average NDVI change in the two periods and and are the average NDVI values of the two periods, respectively. The change of NDVI can be attributed to the influence of natural factors (climate change) and human activities:
where is the change of NDVI caused by climate change and represents the change of NDVI caused by human activities, such as afforestation, returning farmland to forest, etc.
Several previous studies found that NDVI is closely related to precipitation and potential evaporation [41,42,43]. The multiple linear regression relationship between NDVI, the precipitation, and potential evaporation in the base period (T1) can be estimated as follow:
where a and b are regression coefficients and c is the intercept.
By extending the formula (24), the NDVI value under climate change in the T2 period can be calculated as follows:
The contribution of human activities and climate change to NDVI changes can be calculated separately:
where is the average NDVI under climate change in the T2 period. and are the contribution rates of human activities and climate change to vegetation changes, respectively.
The relative contribution rates of climate change () and human activities () to runoff change can be estimated using the following formulas:
4. Results and Discussion
4.1. Trends of Runoff, NDVI, and Climate Change
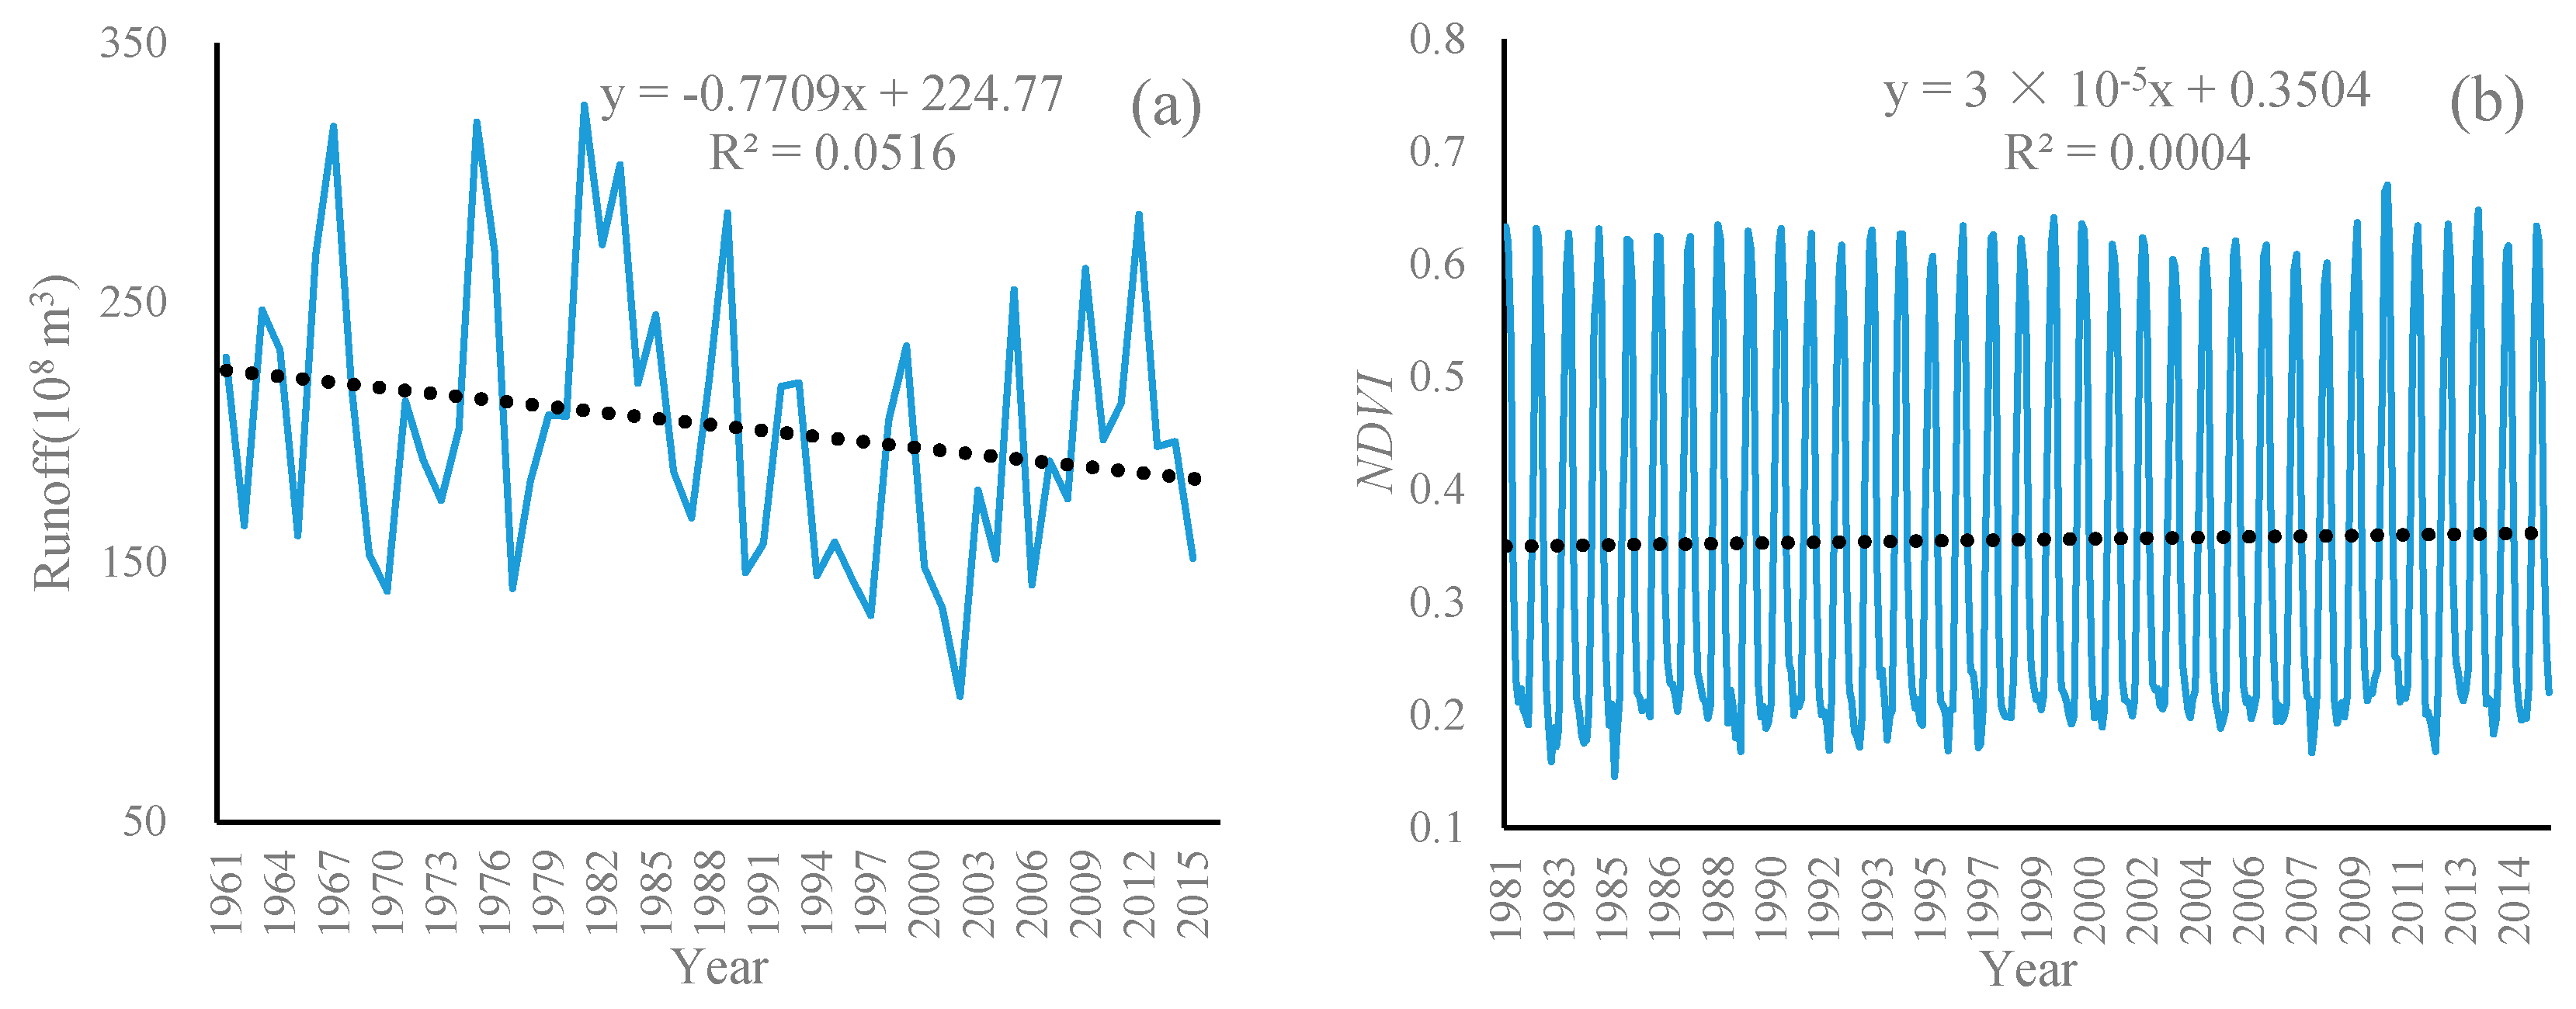
Figure 2 shows the fluctuations in annual average runoff at the Tangnaihai hydrological station and NDVI in the source area of the Yellow River basin. According to Figure 2a, there is a decreasing trend in annual average runoff at the Tangnaihai station for the period of 1961–2015, with an average decrease of 0.77 × 10⁸ m3 per year. The values of NDVI show a slight increasing trend in the source area of the Yellow River basin from 1981 to 2015. The monthly average increase of NDVI in the source area of the Yellow River basin from 1981 to 2015 is 3 × 10⁻⁵.
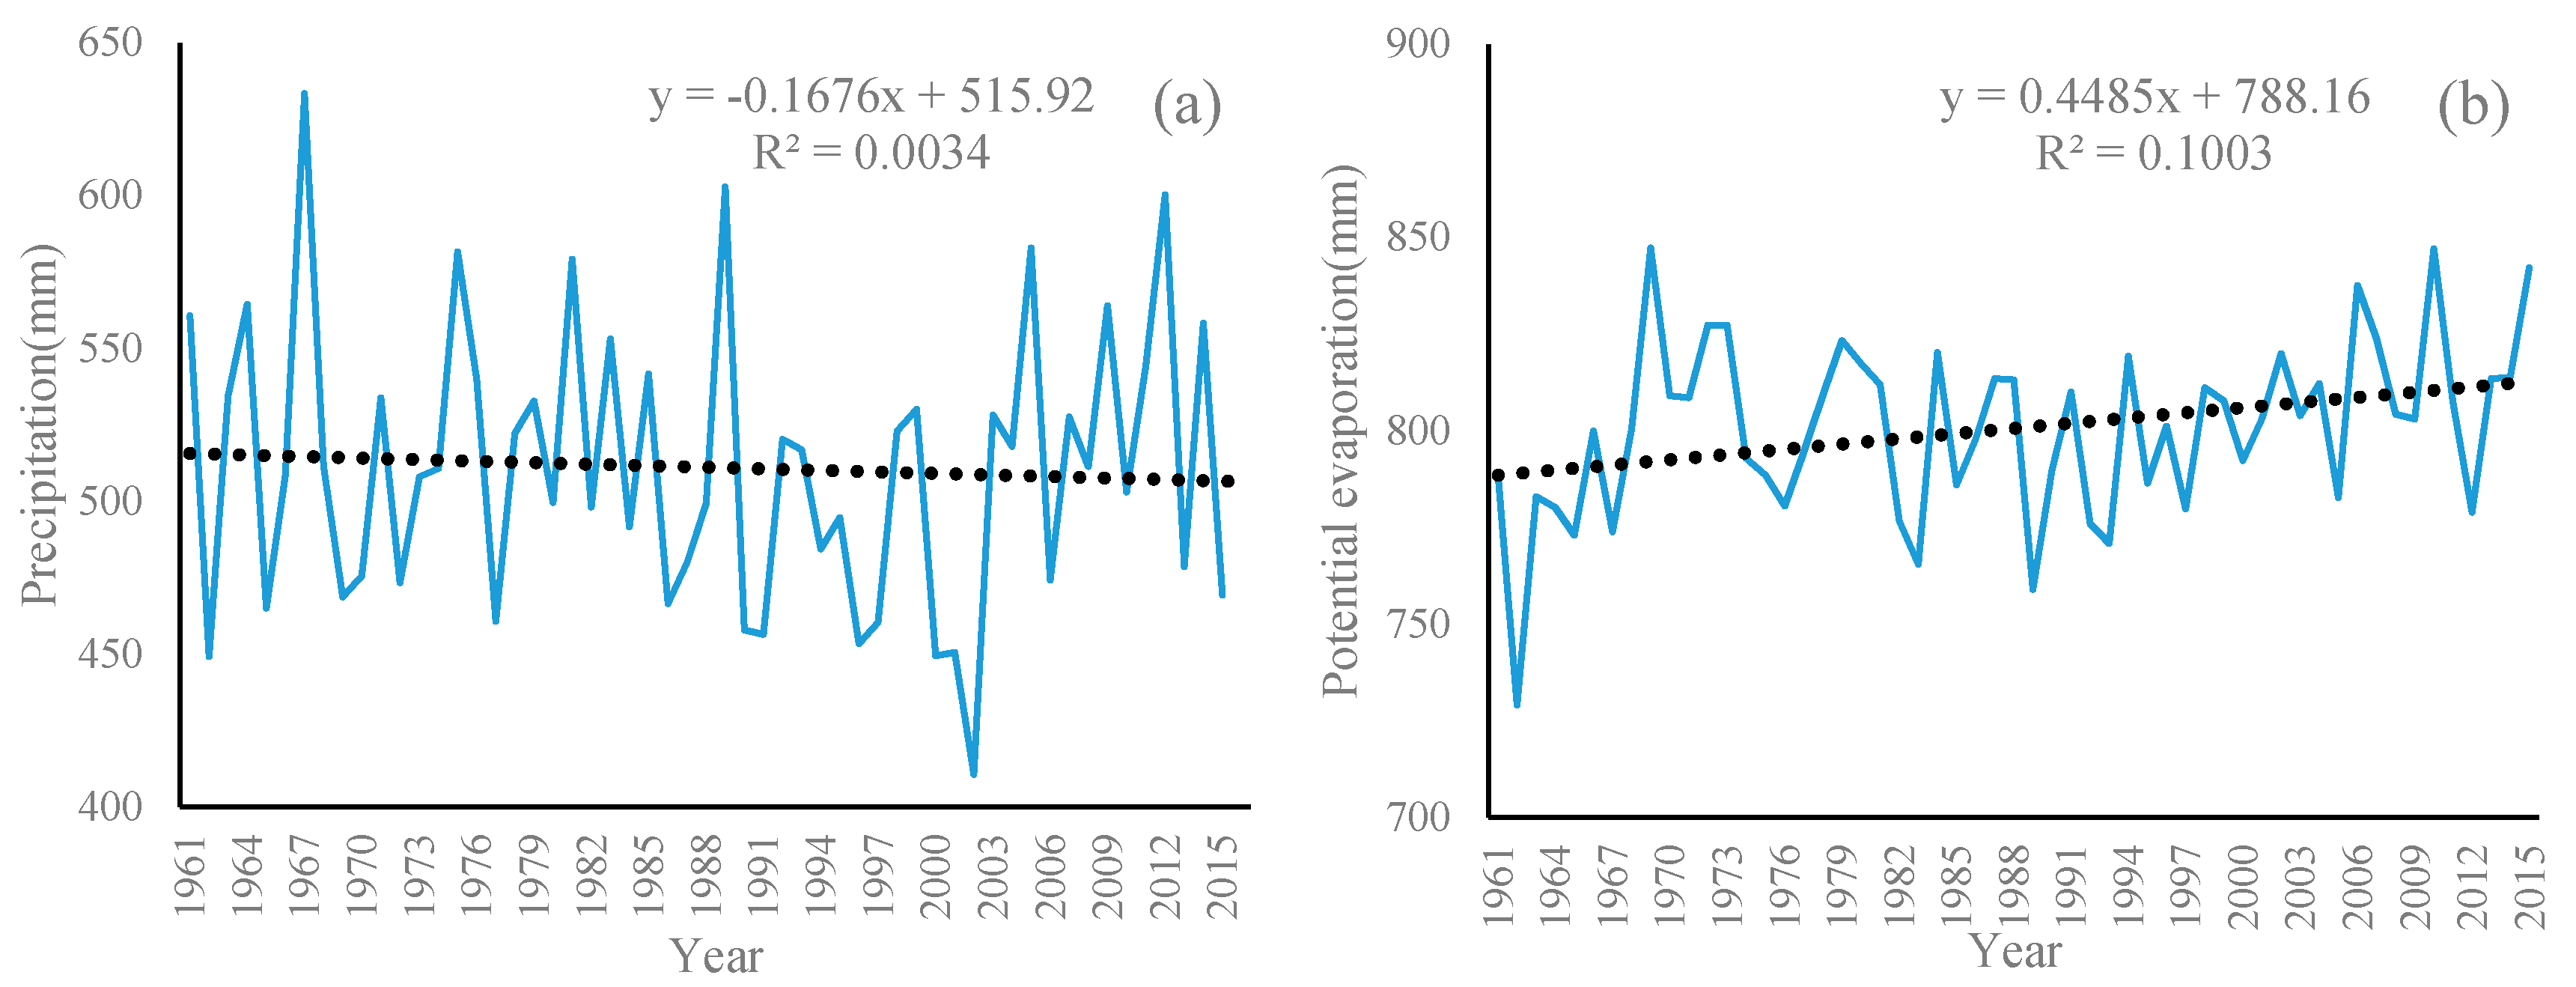
From Figure 3a, the annual average precipitation in the source area of the Yellow River basin from 1961 to 2015 shows a slightly decreasing trend. The average decrease per year is 0.17 mm. As Figure 3b shows, there is an insignificant increasing trend of the annual average potential evaporation for the period 1961–2015, with an average increase of 0.45 mm per year.
4.2. Abrupt Changes of Runoff
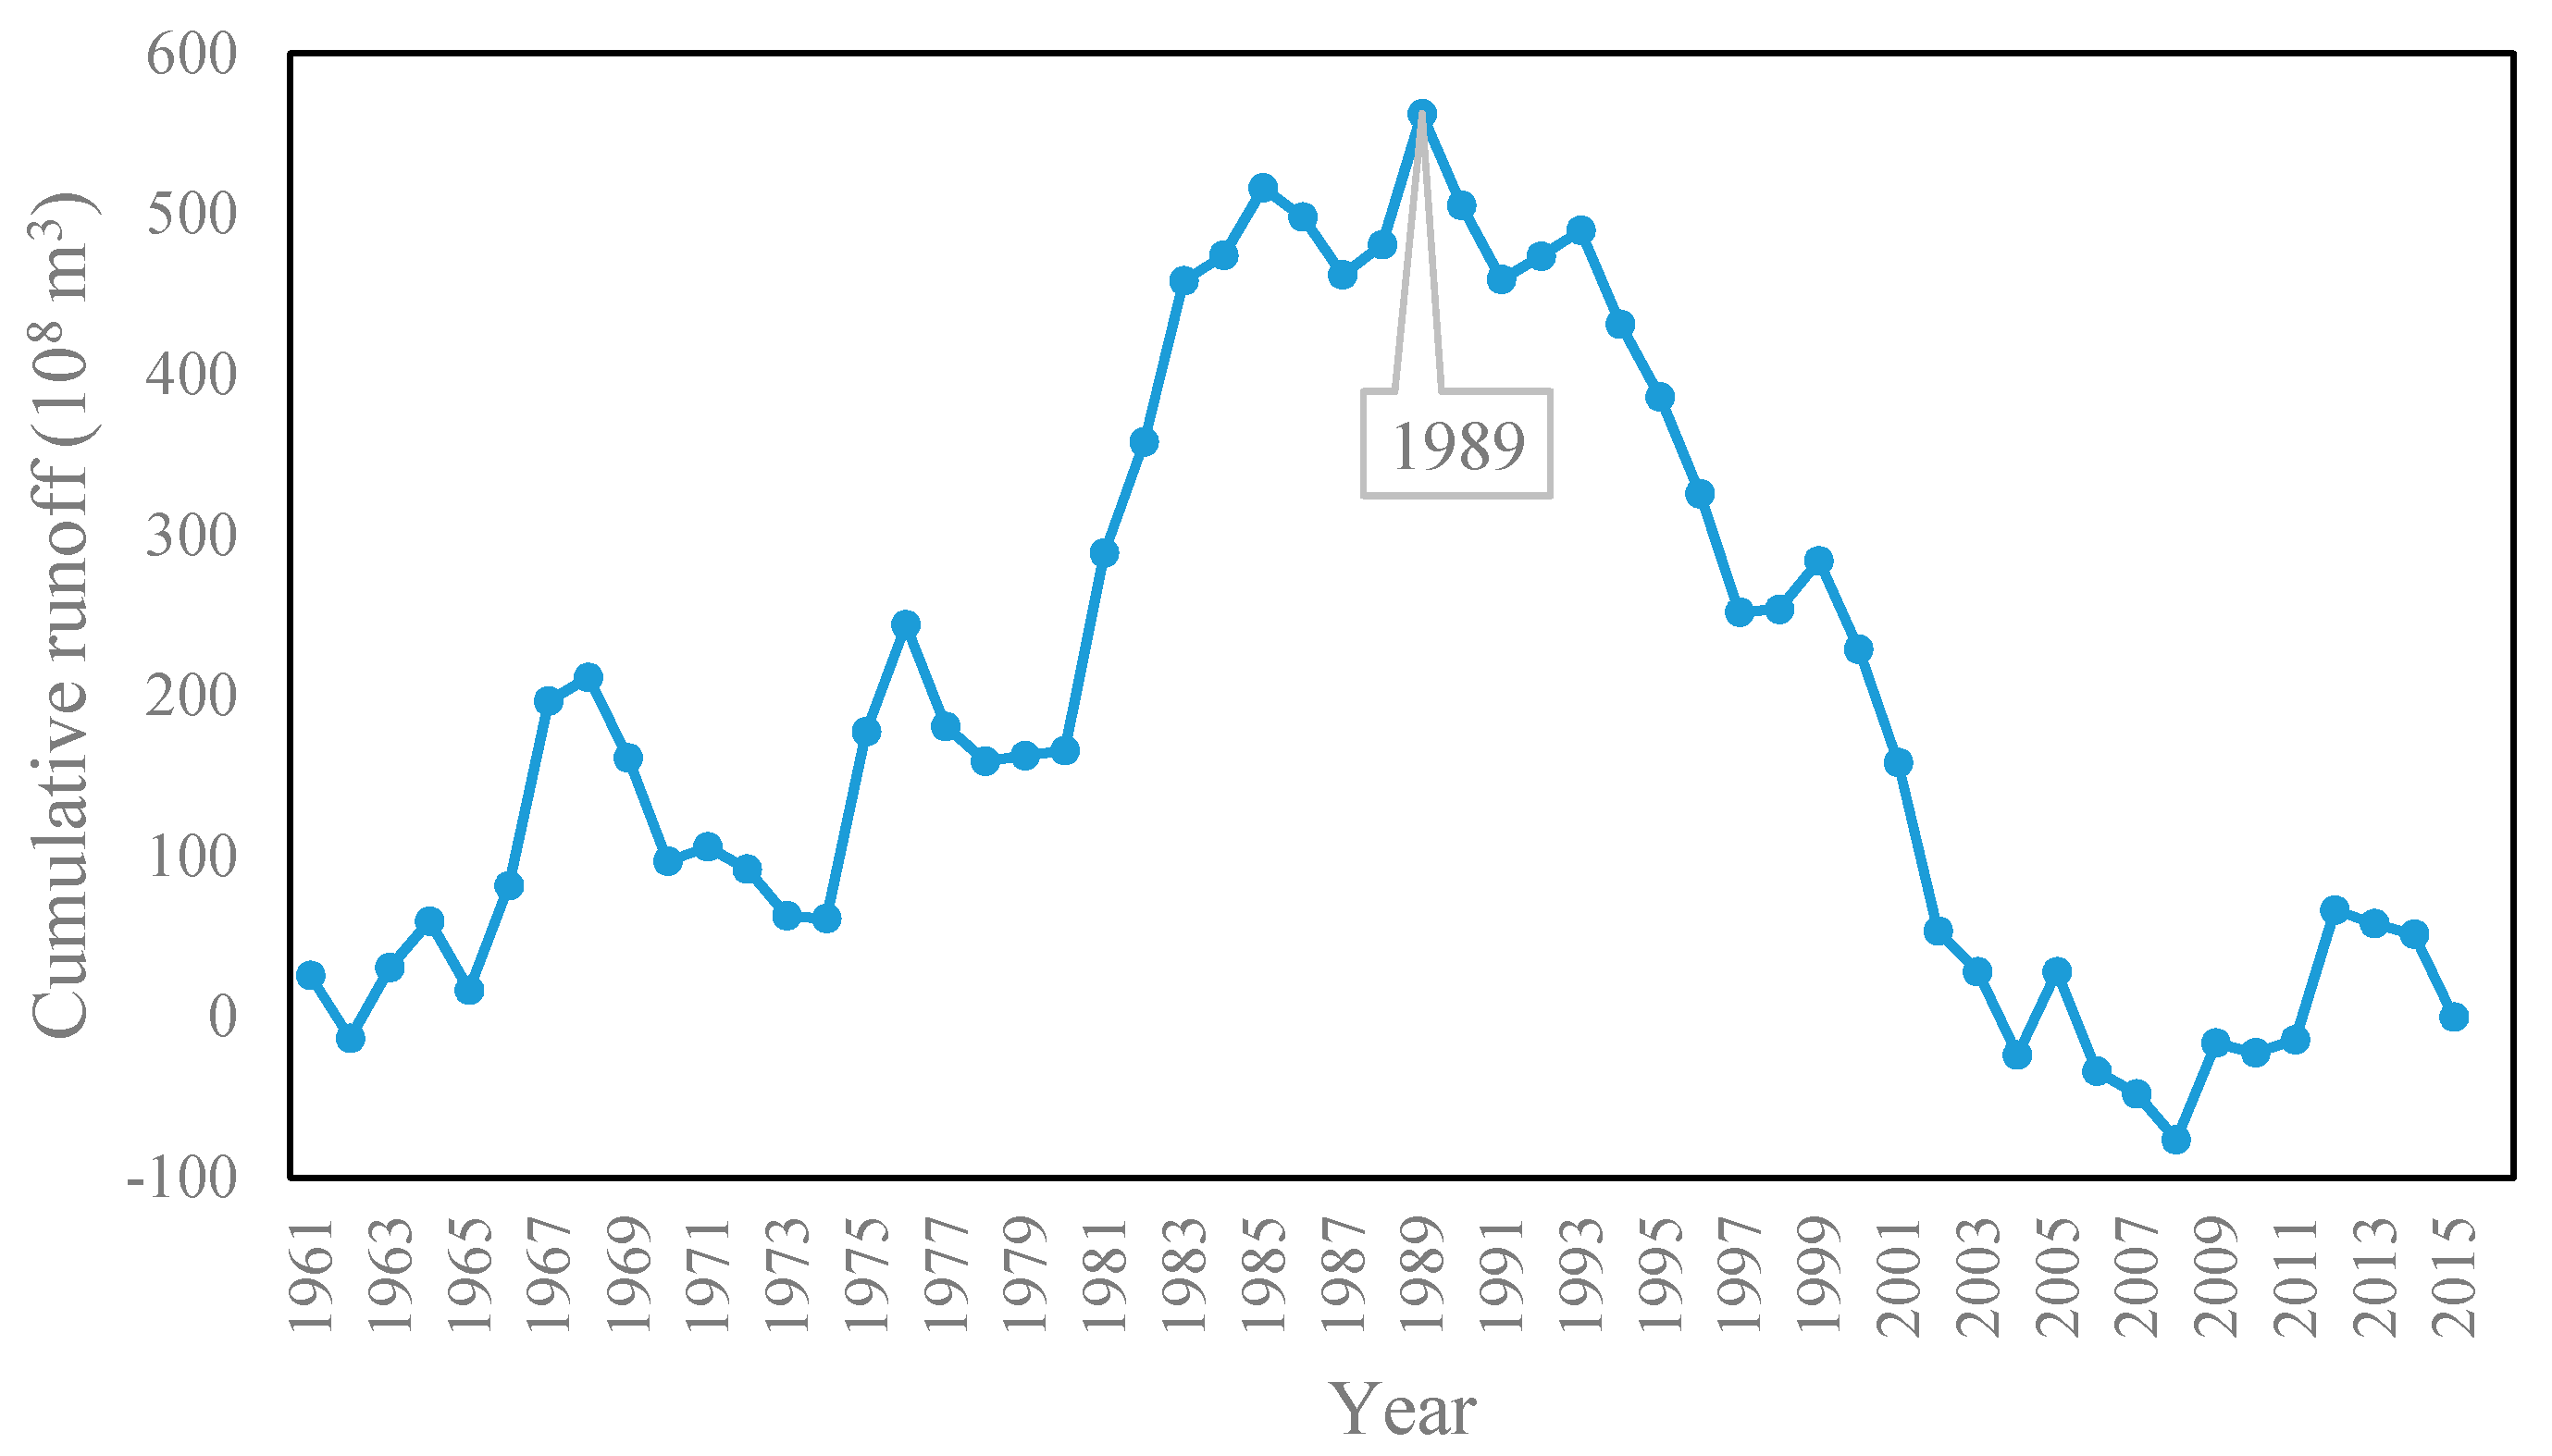
In order to accurately identify the years with an abrupt change of runoff in the source area of the Yellow River basin, this study used both the Mann-Kendall mutation test and cumulative anomaly method to do an abrupt change analysis (Figure 4 and Figure 5).
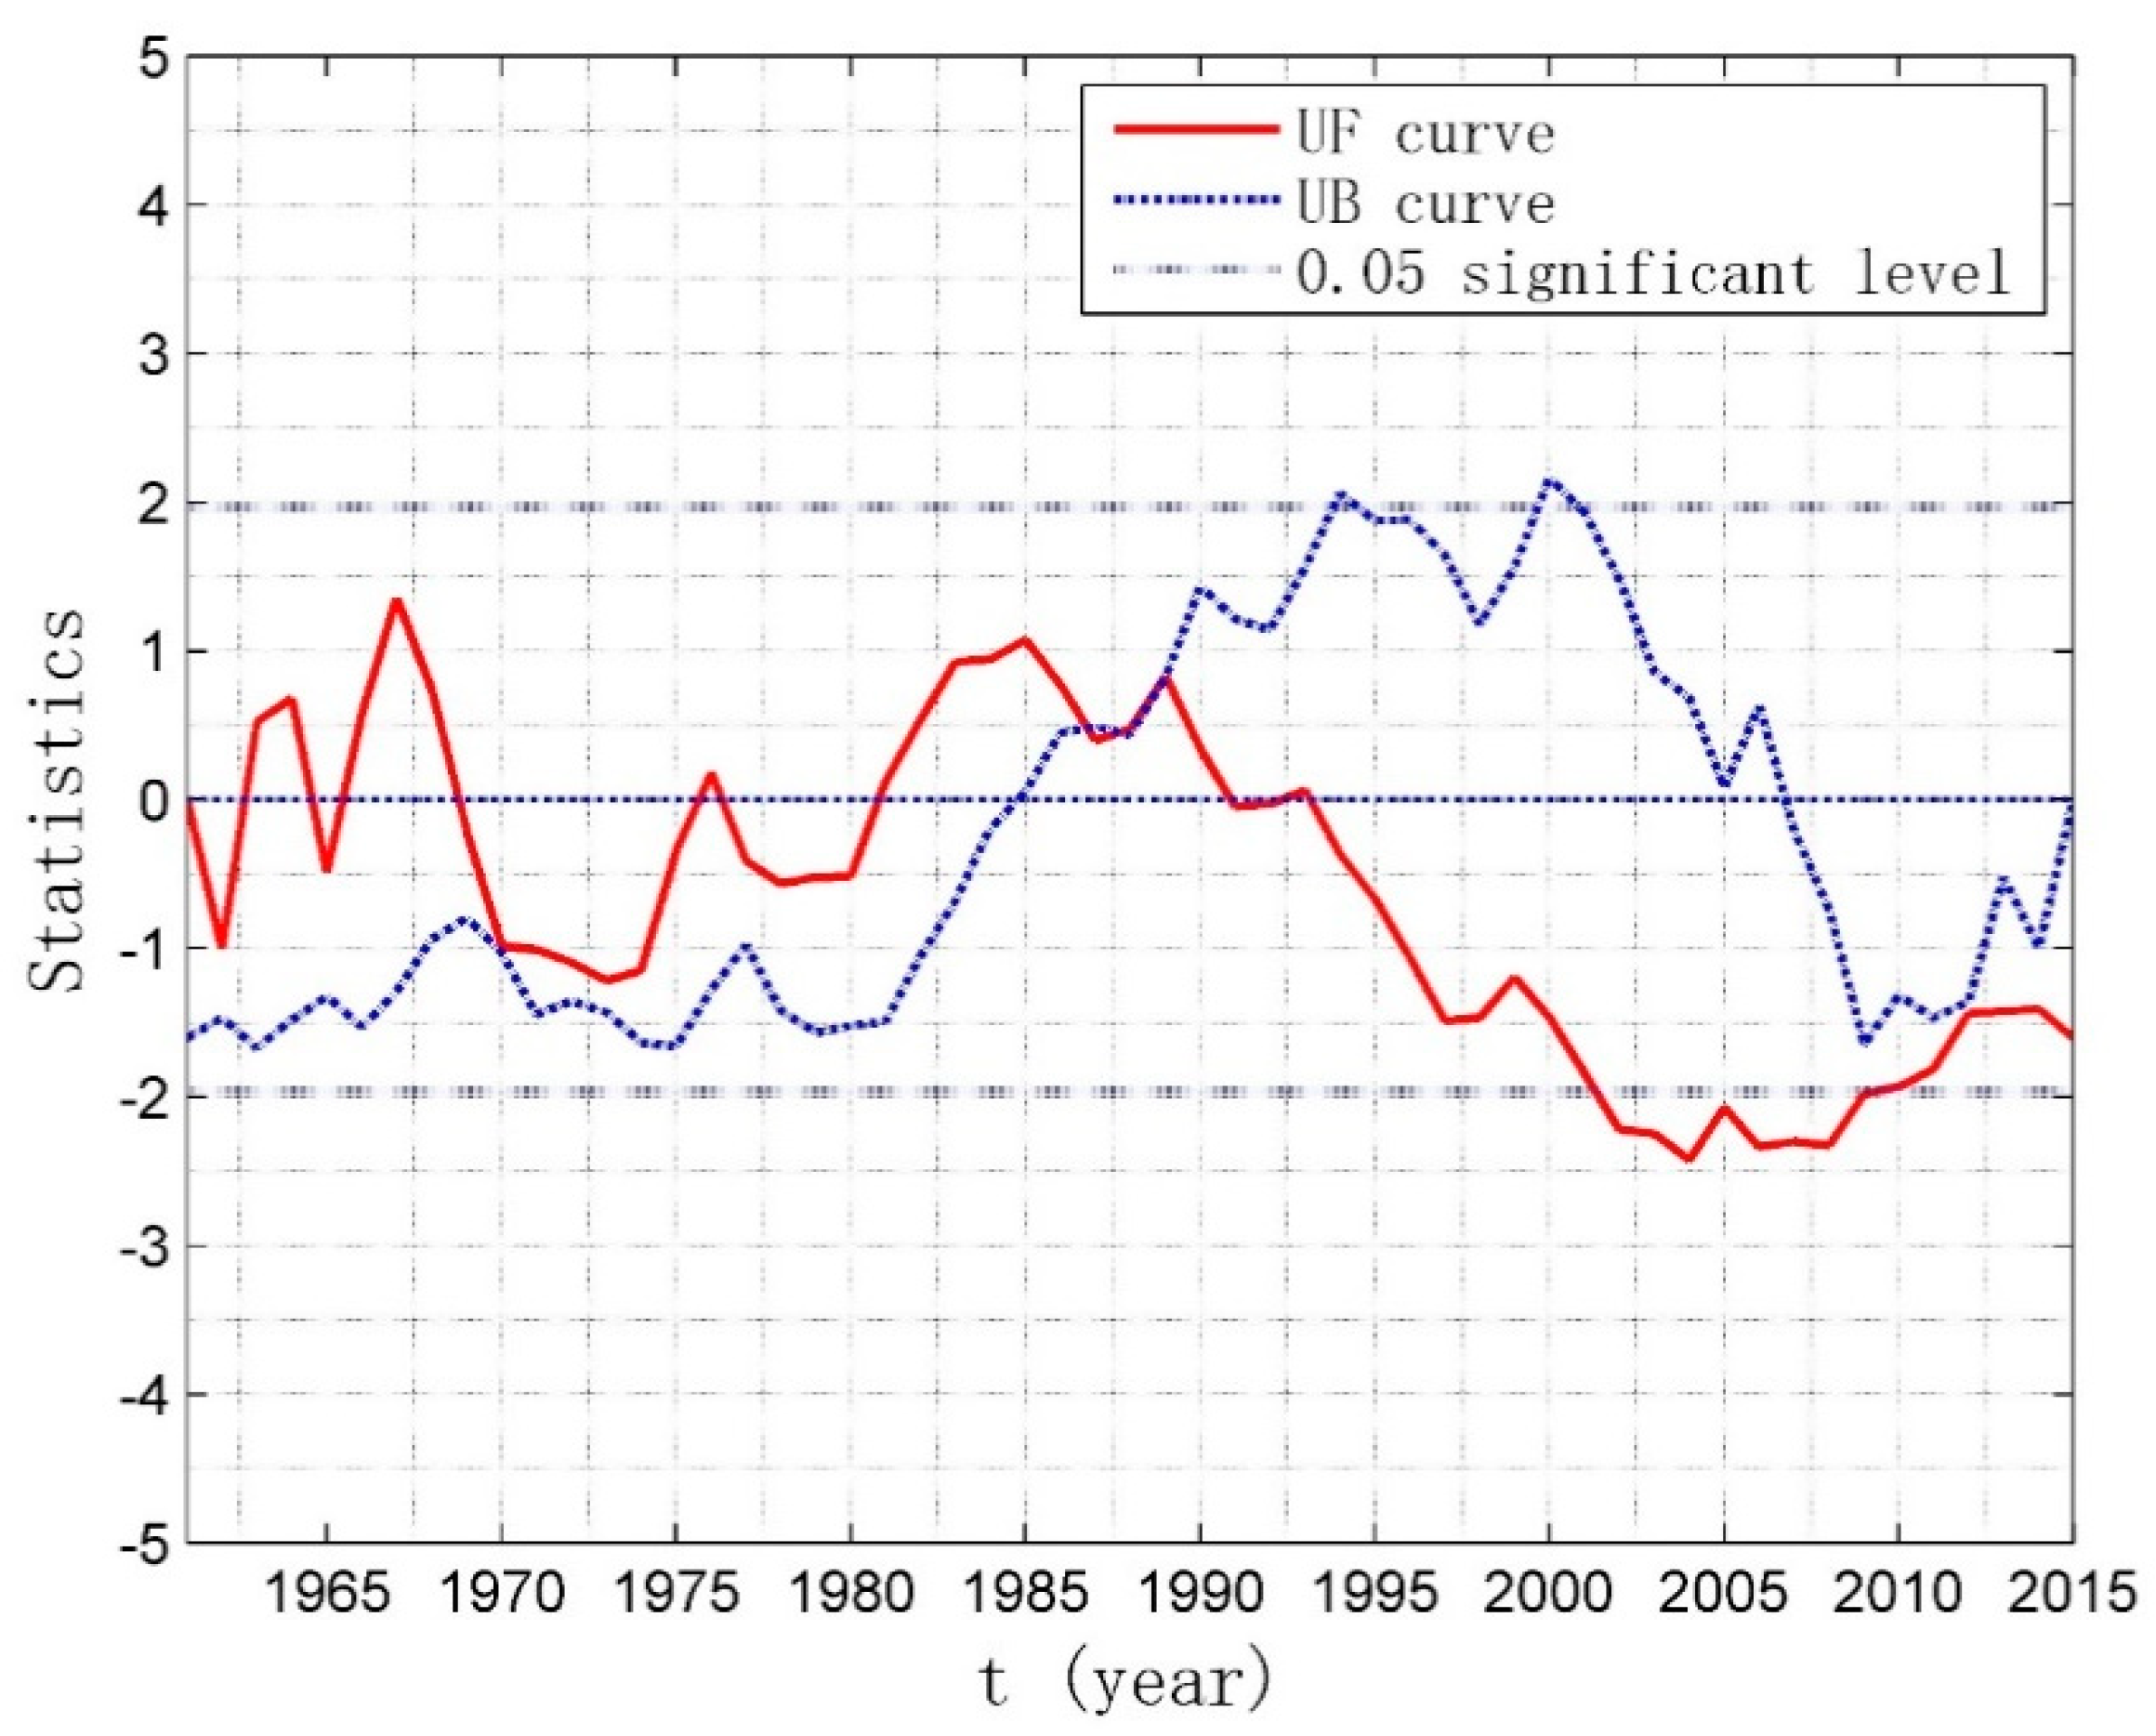
Figure 4 shows that the UF and UB curve intersected in 1988 and 1989 and the intersections are within the confidence interval of ±1.96 (confidence level, 0.05), which indicates that 1988 and 1989 are the abrupt change years of runoff at the Tangnaihai station. Figure 5 shows that the cumulative anomaly values of runoff in the source area of the Yellow River basin from 1961 to 2015 first increased and then decreased, of which the turning point is 1989. Based on the results of the two different methods, this study believes that 1989 was the abrupt change year of runoff in the source area of the Yellow River basin.
4.3. Assessment of the Contribution Rates of Climate Change and Human Activities to Runoff Change
This study used precipitation (P), potential evaporation (ET0), and the underlying surface characteristic parameters (ω) to estimate the elastic coefficient of climate and land cover to runoff change. The underlying surface characteristic parameter (ω) depends on soil type, topographic factors, and vegetation coverage, assuming that the soil types and topographical factors in the source area of the Yellow River basin have not changed since 1961, and used vegetation change instead of land cover change. Previous studies often attributed LUCC (land use/cover change) to human activities. However, LUCC, particularly vegetation change, are impacted by both climate change and human activities. Therefore, previous studies are likely to underestimate the effect of climate change on runoff [11,15]. To accurately assess the contribution rates of climate change and LUCC to runoff change in the source area of the Yellow River basin, it is necessary to distinguish the impact of natural and human factors on LUCC.
Based on the results of abrupt analysis in Section 4.2, we dividend the period of 1961–2015 into two sub periods: the T1 period (1961–1989) and the T2 period (1990–2015). Several previous studies found that NDVI is closely related to precipitation and potential evaporation and can be an indicator to assess the impact of natural and human factors on LUCC [41,42,43]. The specific steps are as follows:
- (1)
- There were NDVI remote sensing image data from June 1981 to December 1989 in T1 period (1961–1989), so we established the multiple linear regression relationship between NDVI and climatic factors (precipitation and potential evaporation) from July 1981 to December 1989.
- (2)
- Due to a lack of NDVI values in the period from January 1961 to June 1981, we further assumed that the multiple linear regression relationship in the period from June 1981 to December 1989 was the same as the period from January 1961 to June 1981. NDVI values for the period from January 1961 to June 1981 were calculated based on precipitation and potential evaporation in the corresponding periods.
- (3)
- We calculated the mean value of measured NDVI () in T1 period (1961–1989), the mean value of measured NDVI () in T2 period (1990–2015), and the mean value of NDVI under climate change () in the T2 period (1990–2015) according to the multiple linear regression function.
- (4)
- We calculated the contribution rates of climate change and human activities to NDVI changes using formula (26)–(29) (Table 1).
Results showed that climate change plays a major role in increasing vegetation coverage and its contribution rate can reach up to 62.79%.
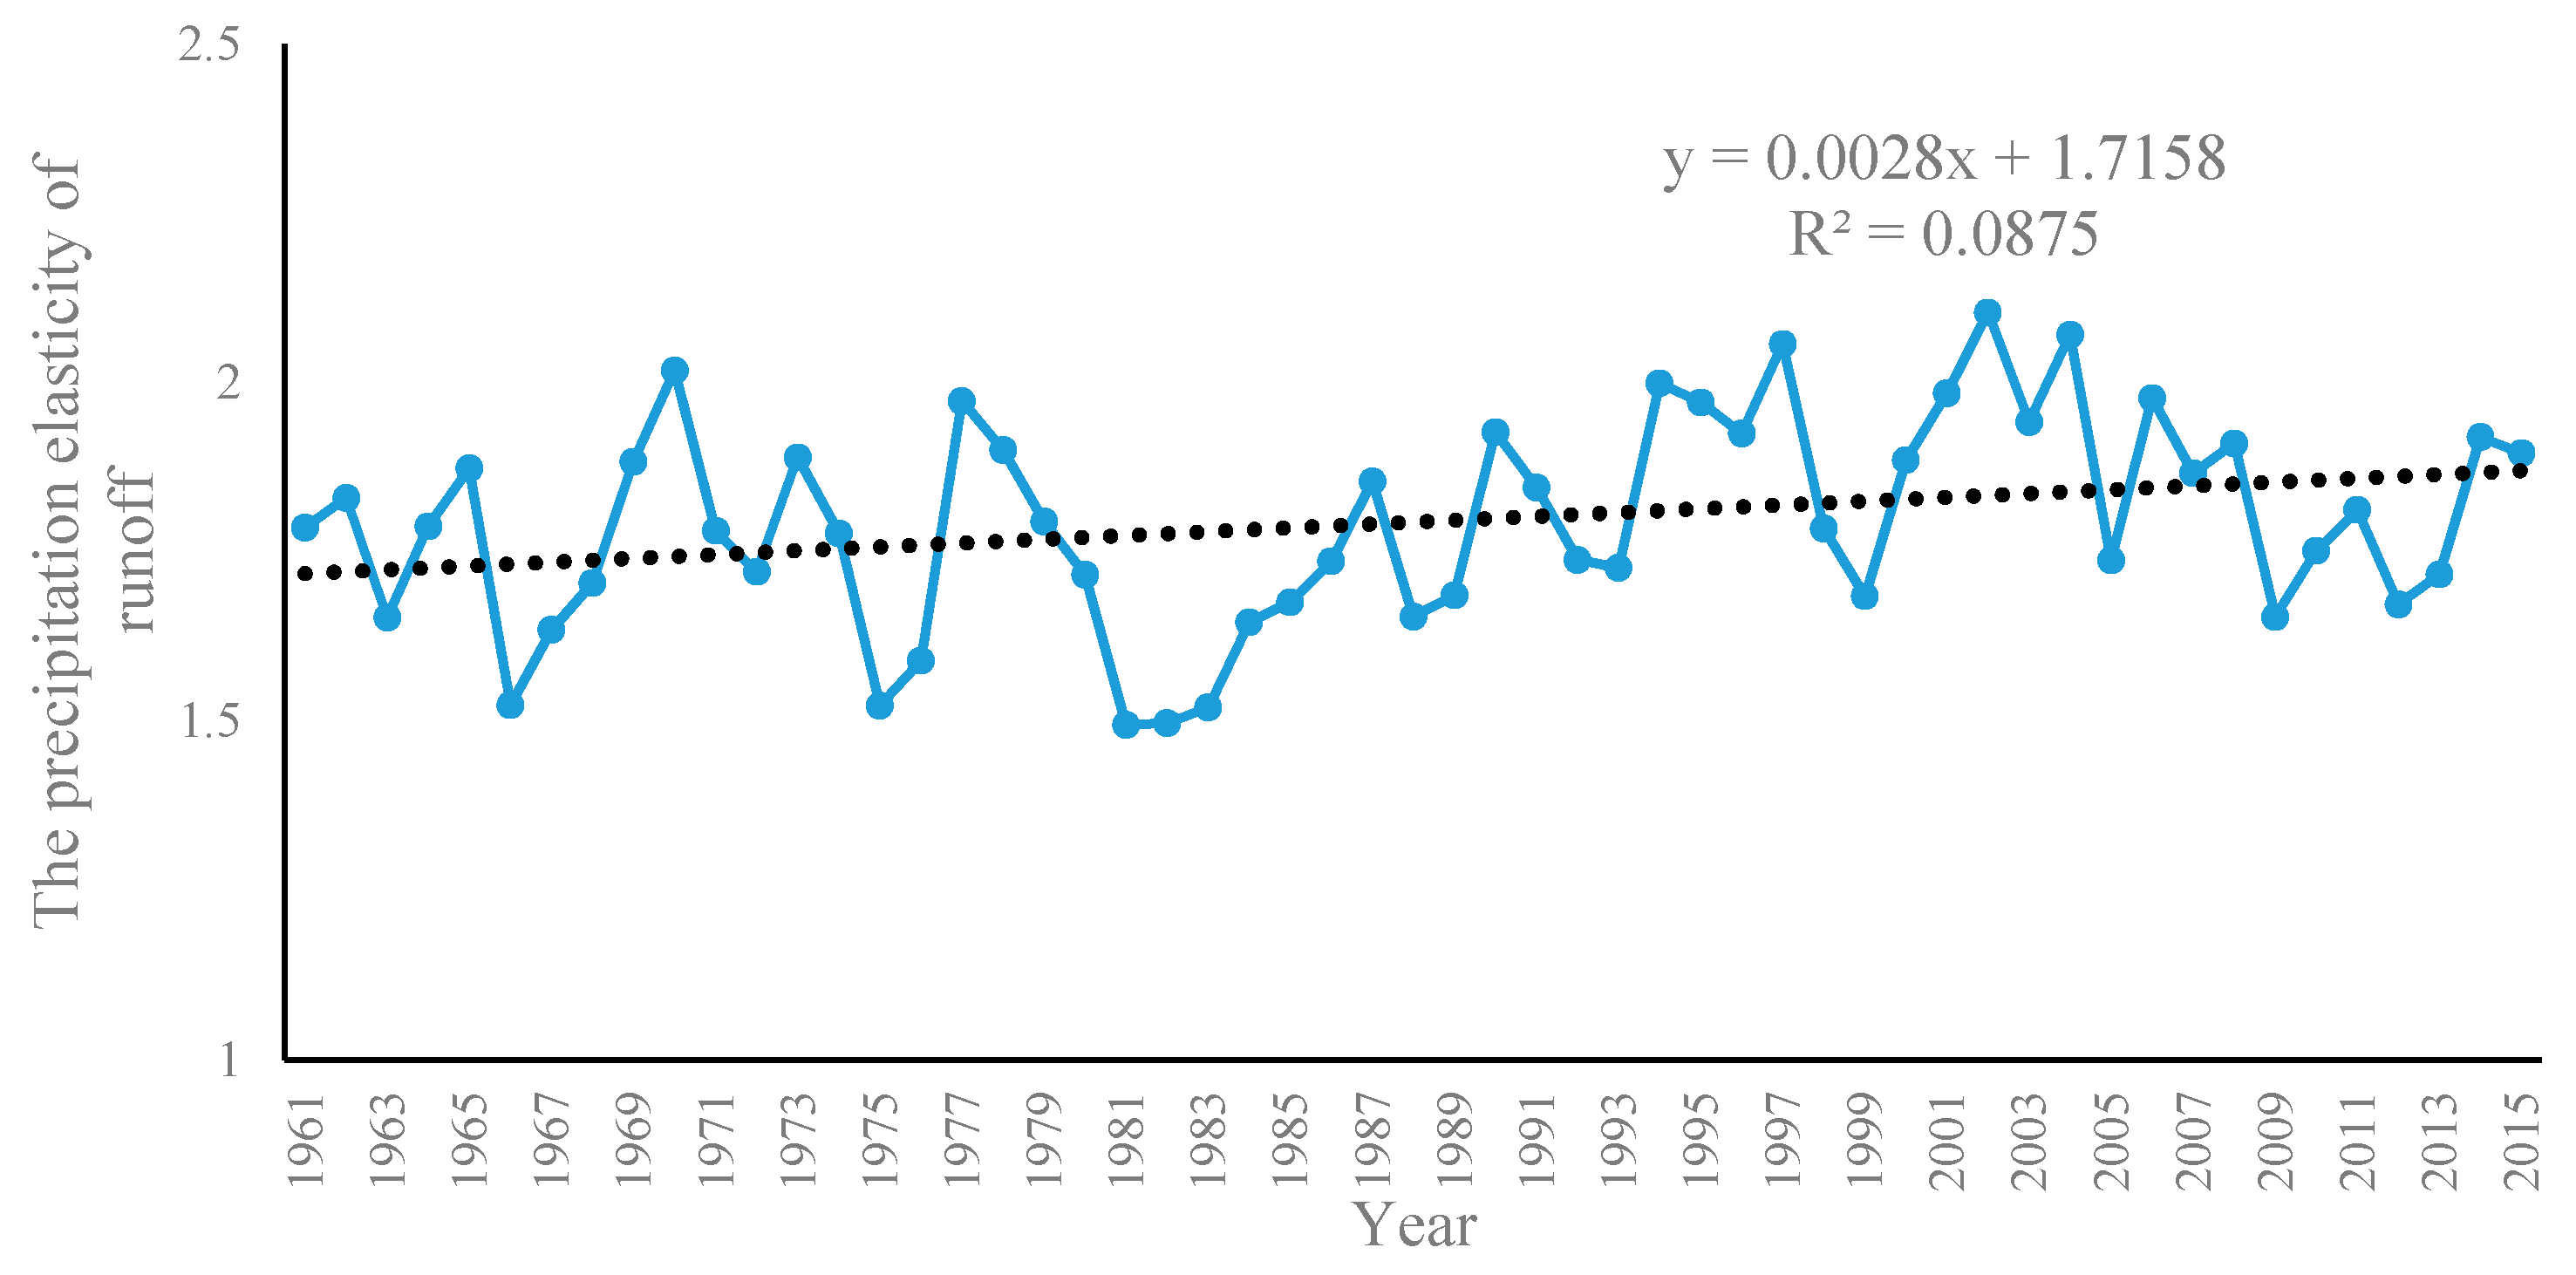
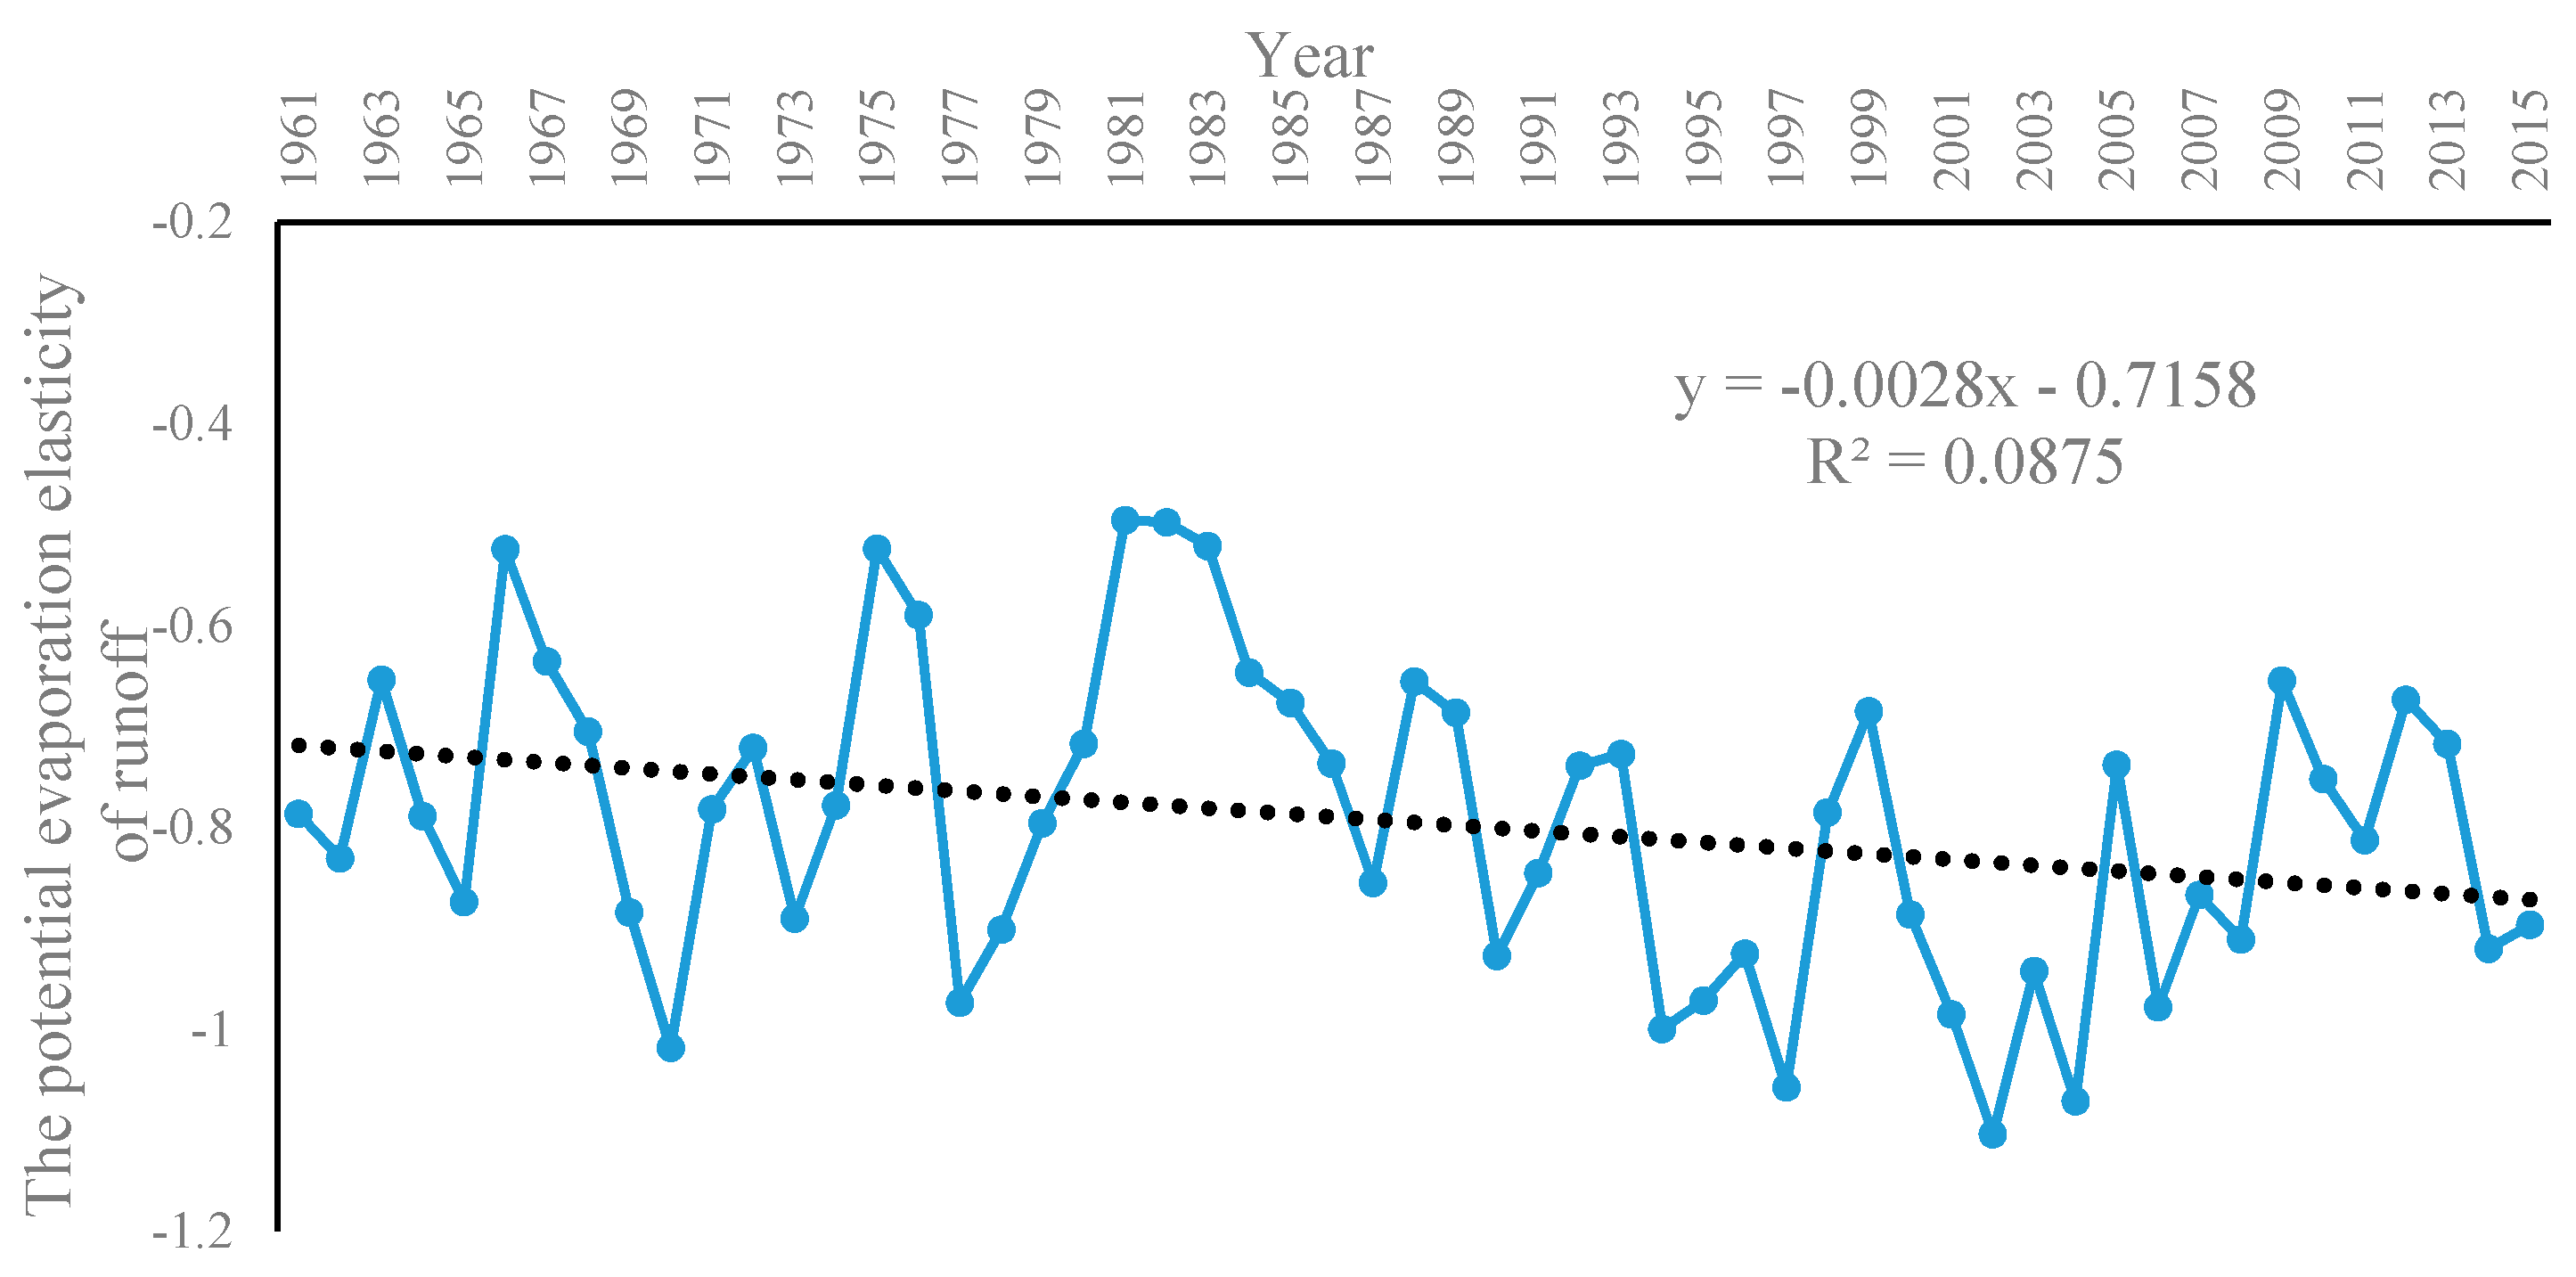
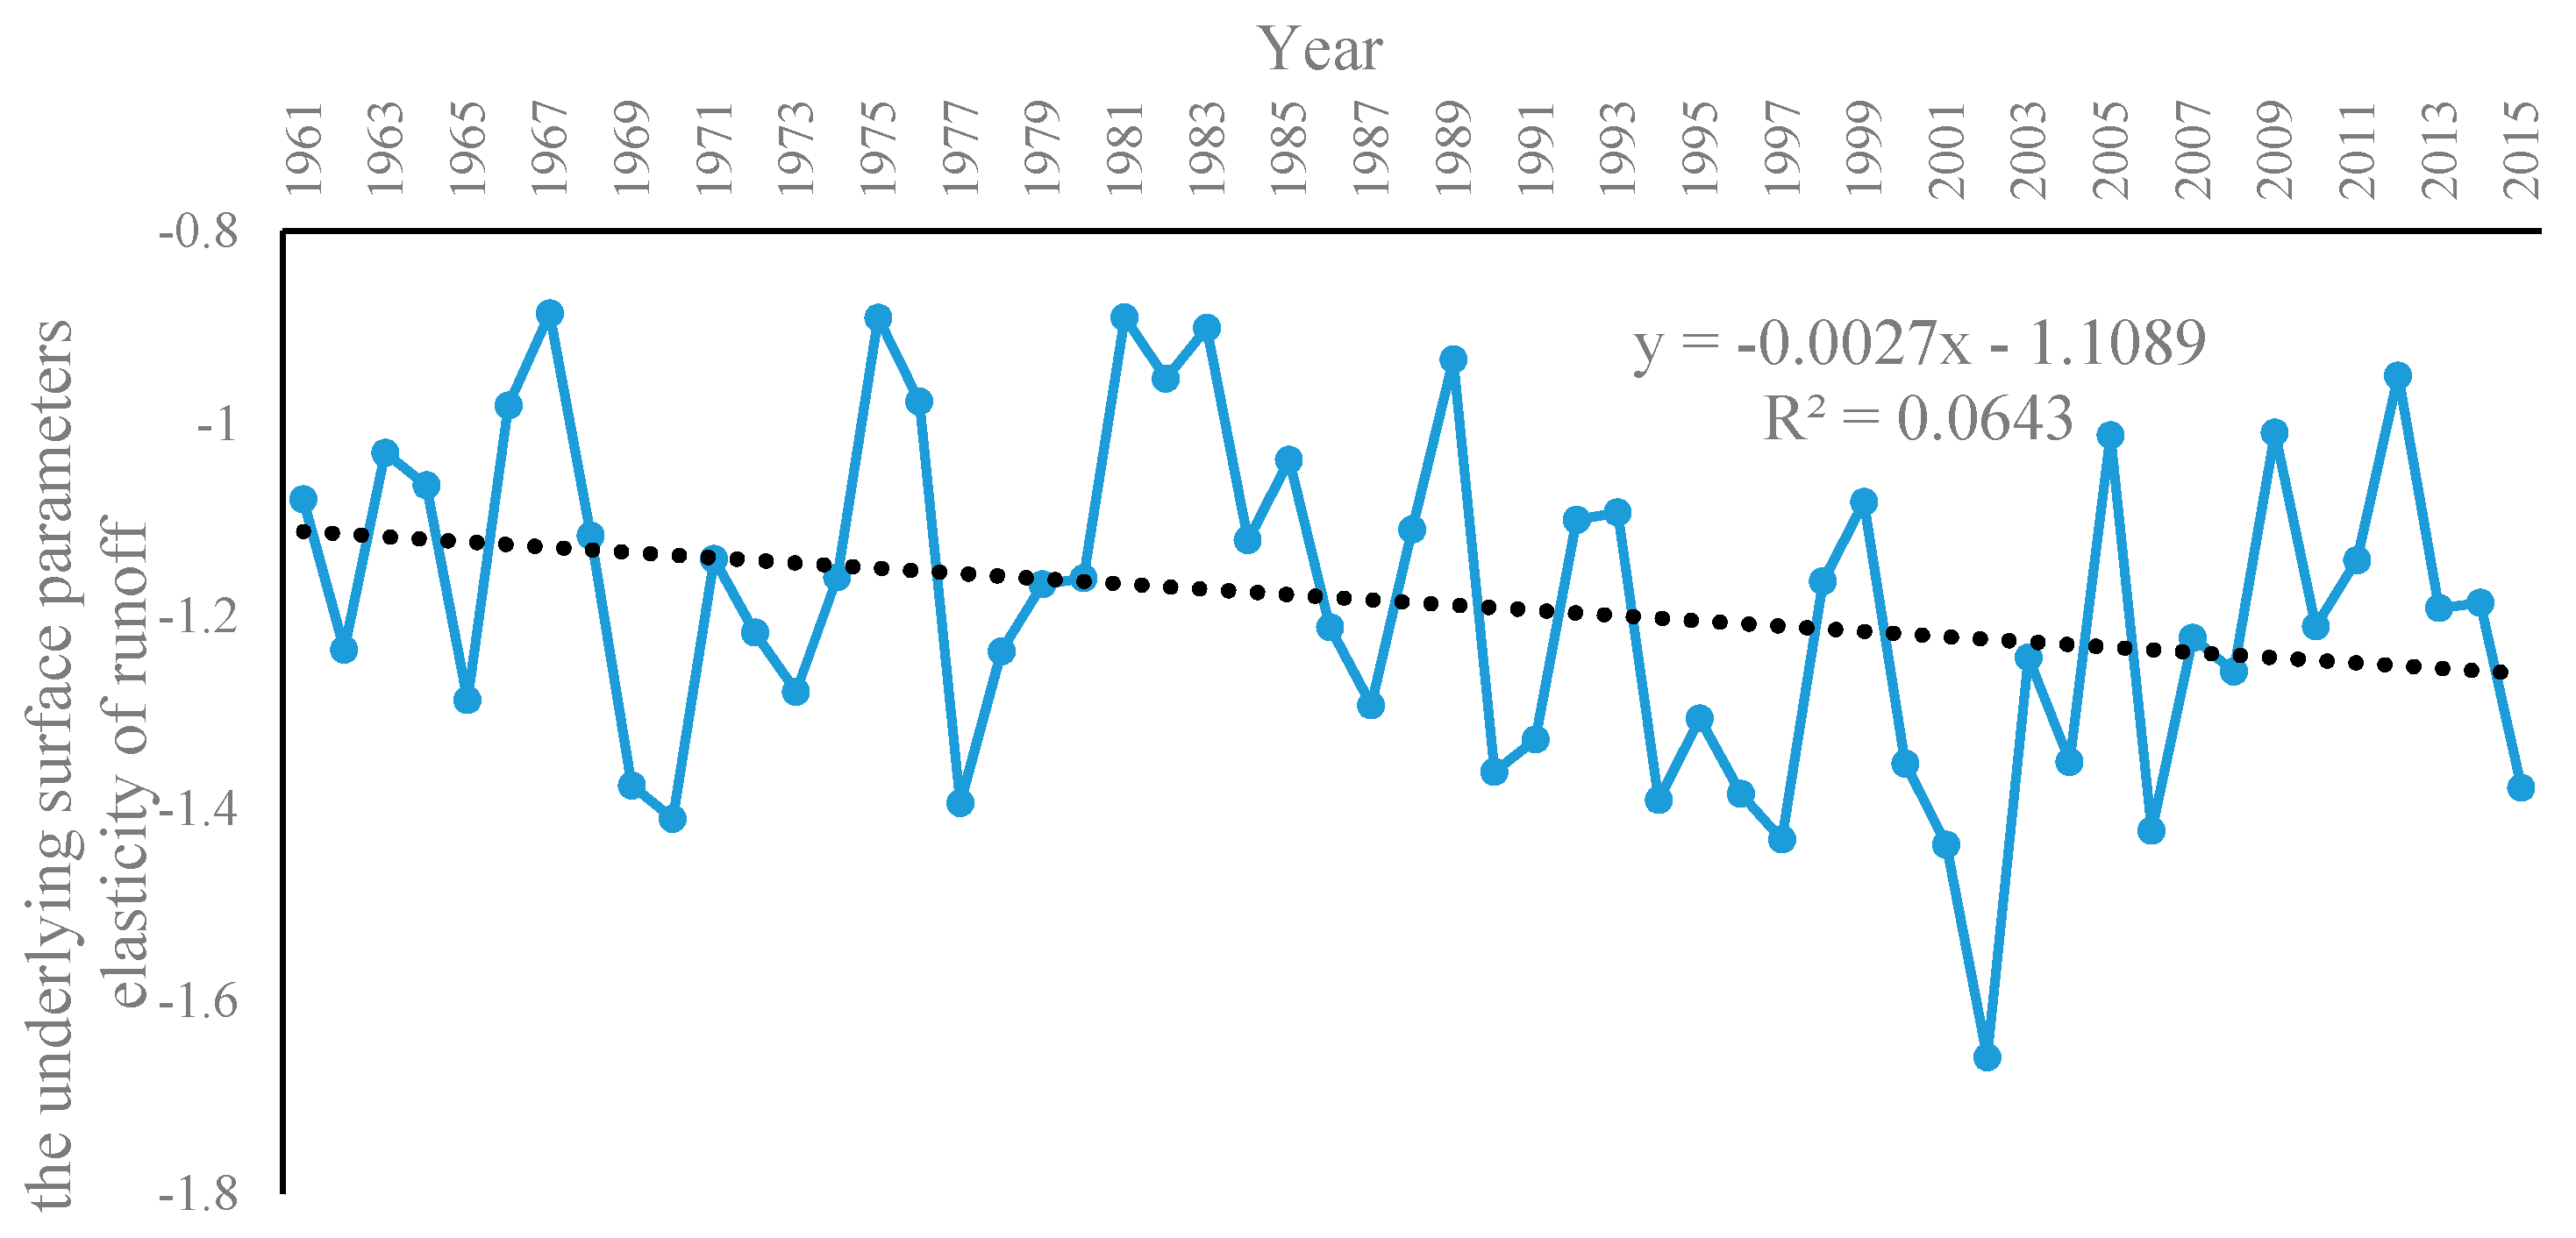
To further evaluate the long-term impact of climate change and the underlying surface characteristic parameter on runoff in the source area of the Yellow River, we used formulas (13)–(15) to calculate the elastic coefficients of precipitation, potential evaporation, and the underlying surface characteristic parameter in different years (Figure 6, Figure 7 and Figure 8). As shown in Figure 6, Figure 7 and Figure 8, the absolute values of , , and increased during the period 1961–2015, which means the runoff change became more and more sensitive to changes in climate change and the underlying surface characteristic parameter.
Table 2 showed the eigenvalues of different climatic and hydrologic variables in different periods: T1 and T2. Next, we calculated the differences in annual average precipitation, potential evaporation, and the underlying surface characteristic parameters between the two different periods. Then, the runoff variation value of Tangnaihai station caused by precipitation, potential evaporation, and LUCC were calculated by formula (19)–(21). Runoff variation caused by LUCC can be separated into two parts: natural and human factors; their contribution ratios can be obtained from Table 1. Based on the above method, the relative contribution rates of climate change (including precipitation, potential evaporation, and subsequent vegetation changes) and vegetation changes caused by human activities to runoff at Tangnaihai station were calculated (Table 3).
The contribution rates of climate change (including precipitation, potential evaporation, and subsequent vegetation changes) and vegetation changes caused by human activities to the runoff change of Tangnaihai Hydrometric Station were 75.33% and 24.67%, respectively. In general, climate change has played a major role in reducing runoff and the impact of precipitation on runoff reduction is more significant than that of potential evaporation.
4.4. Discussions
In the Budyko hypothesis, runoff is mainly affected by precipitation (P), evaporation (ET), and underlying surface parameters (ω). The value of the underlying surface characteristic parameters (ω) depends on soil type, topographical factors, and land types. Soil types and topographic factors generally do not change, so the values of underlying surface parameters are mainly affected by land type changes. The grassland and forestland area in the source area of the Yellow River accounts for more than 70%, while building land and farmland area account for less than 1% [21], so we can use vegetation changes instead of land cover changes.
NDVI data can effectively represent vegetation changes, so we used the NDVI data to characterize land type changes. To accurately assess the contribution rates of climate change and human activities to runoff change in the source area of the Yellow River basin, it is necessary to distinguish the impact of natural and human factors on land type changes, which is characterized by NDVI data.
Compared with previous studies, we first used NDVI data to characterize the land type change based on the actual situation of the study area in this paper and then distinguished the impact of natural and human factors on land type changes. In order to isolate climate impact on vegetation growth from human activities, a multiple linear regression method was introduced. Finally, the contribution rates of climatic factors (including precipitation, potential evaporation, and subsequent vegetation changes) and vegetation changes caused by human activities to the runoff change at Tangnaihai Hydrological Station were calculated. Results showed that previous studies underestimated the contribution rate of climate change on runoff change.
Although the contribution rate of climate change and human activities to runoff change is calculated, there are still some uncertainties:
- (1)
- Uncertainties of meteorological station observation data
The observation data of meteorological stations are missing in some observation times. In addition, the precipitation and potential evaporation data of the study area are interpolated, but the results obtained by the interpolation still have some deviations from the actual distribution of precipitation and potential evaporation.
- (2)
- Uncertainties in the division of base period and change period
In order to identify the abrupt change year of runoff in the source area of the Yellow River as accurately and comprehensively as possible, Mann-Kendall and cumulative anomaly mutation analysis methods were used to analyze the mutation year of runoff in this paper, but we cannot guarantee that all mutation years were detected.
- (3)
- Uncertainties caused by using NDVI to characterize land type change
Building land in the source area of the Yellow River, which is attributed to human activities, accounts for less than 1%, but there are some uncertainties in using NDVI to characterize land type change.
5. Conclusions
This study first used the Mann-Kendall mutation test and accumulated anomaly method to identify the abrupt change year of runoff in the source area of the Yellow River. Next, a multiple linear regression method was applied to evaluate the contribution rates of climate change and human activities to the vegetation change in the source area of the Yellow River. Finally, we used the Budyko hypothesis to calculate the impact of climatic factors (including precipitation, potential evaporation, and subsequent vegetation changes) and human activities (mainly refers to vegetation changes caused by human activities) to the runoff change in the source area of the Yellow River.
Results showed that: (1) The contribution rates of climate change and human activities to the vegetation change in the source area of the Yellow River is 62.79% and 37.21%, respectively; (2) The runoff change became more and more sensitive to changes in climate and underlying surface characteristic parameters; (3) The contribution rates of climatic factors (including precipitation, potential evaporation, and subsequent vegetation changes) and vegetation changes caused by human activities to the runoff change at Tangnaihai Hydrological Station are 75.33% and 24.67%, respectively; (4) The impact of precipitation on runoff reduction is more substantial than that of potential evaporation.
Author Contributions
Data curation, G.J.; Formal analysis, D.Y.; Funding acquisition, D.Y.; Methodology, Z.L. and G.J.; Resources, Z.L.; Software, D.Y. and Z.L.; Validation, G.J.; Visualization, Z.L. and G.J.; Writing—original draft, D.Y.; Writing—review & editing, G.J. All authors have read and agreed to the published version of the manuscript.
Funding
This research was funded by [National Social Science Fund of China] grant number [20BJL034] and [Ministry of Education of Humanities and Social Science Project] grant number [18YJC790216].
Conflicts of Interest
The authors declare no conflict of interest.
References
- Jia, Y.; Wang, H.; Peng, H. A review on international development trend in the fileld of hydrology and water resources. J. China Inst. Resour. Hydropower Res. 2009, 7, 241–248. (In Chinese) [Google Scholar]
- Arnell, N.W.; Gosling, S.N. The impacts of climate change on river flow regimes at the global scale. J. Hydrol. 2013, 486, 351–364. [Google Scholar] [CrossRef]
- Van Vliet, M.T.H.; Franssen, W.H.P.; Yearsley, J.R.; Ludwig, F.; Haddeland, I.; Lettenmaier, D.P.; Kabat, P. Global river runoff and water temperature under climate change. Glob. Environ. Chang. 2013, 23, 450–464. [Google Scholar] [CrossRef]
- Zhang, L.; Dawes, W.R.; Walker, G.R. Response of mean annual evapotranspiration to vegetation changes at catchment scale. Water Resour. Res. 2001, 37, 701–708. [Google Scholar] [CrossRef]
- Vörösmarty, C.J. Global water resources: Vulnerability from climate change and population growth. Science 2000, 289, 284–288. [Google Scholar] [CrossRef] [Green Version]
- Li, L.; Shen, H.; Dai, S.; Xiao, J.; Shi, X. Response of runoff to climate change and its future tendency in the source region of Yellow River. J. Geogr. Sci. 2012, 22, 431–440. [Google Scholar] [CrossRef]
- Li, H.; Shi, C.; Zhang, Y.; Ning, T.; Sun, P.; Liu, X.; Ma, X.; Liu, W.; Collins, A.L. Using the Budyko hypothesis for detecting and attributing changes in runoff to climate and vegetation change in the soft sandstone area of the middle Yellow River basin, China. Sci. Total Environ. 2020, 703, 135588. [Google Scholar] [CrossRef]
- Caracciolo, D.; Pumo, D.; Viola, F. Budyko’s Based Method for Annual Runoff Characterization across Different Climatic Areas: An Application to United States. Water Resour. Manag. 2018, 32, 3189–3202. [Google Scholar] [CrossRef]
- Zhang, X.; Dong, Q.; Cheng, L.; Xia, J. A Budyko-based framework for quantifying the impacts of aridity index and other factors on annual runoff. J. Hydrol. 2019, 579, 124224. [Google Scholar] [CrossRef]
- Huang, S.; Chang, J.; Huang, Q.; Chen, Y.; Leng, G. Quantifying the Relative Contribution of Climate and Human Impacts on Runoff Change Based on the Budyko Hypothesis and SVM Model. Water Resour. Manag. 2016, 30, 2377–2390. [Google Scholar] [CrossRef]
- Liang, W.; Bai, D.; Wang, F.; Wang, F.; Fu, B.; Yan, J.; Wang, S.; Yang, Y.; Long, D.; Feng, M. Quantifying the impacts of climate change and ecological restoration on streamflow changes based on a Budyko hydrological model in China’s Loess Plateau. Water Resour. Res. 2015, 51, 6500–6519. [Google Scholar] [CrossRef]
- Shen, Q.; Cong, Z.; Lei, H. Evaluating the impact of climate and underlying surface change on runoff within the Budyko framework: A study across 224 catchments in China. J. Hydrol. 2017, 554, 251–262. [Google Scholar] [CrossRef]
- Wang, T.; Yang, H.; Yang, D.; Qin, Y.; Wang, Y. Quantifying the streamflow response to frozen ground degradation in the source region of the Yellow River within the Budyko framework. J. Hydrol. 2018, 558, 301–313. [Google Scholar] [CrossRef]
- Zhang, D.; Cong, Z.; Ni, G.; Yang, D.; Hu, S. Effects of snow ratio on annual runoff within the Budyko framework. Hydrol. Earth Syst. Sci. 2015, 12, 939–973. [Google Scholar] [CrossRef]
- Xu, X.; Yang, D.; Yang, H.; Lei, H. Attribution analysis based on the Budyko hypothesis for detecting the dominant cause of runoff decline in Haihe basin. J. Hydrol. 2014, 510, 530–540. [Google Scholar] [CrossRef]
- Liu, J.; Zhang, Q.; Singh, V.P.; Shi, P. Contribution of multiple climatic variables and human activities to streamflow changes across China. J. Hydrol. 2017, 545, 145–162. [Google Scholar] [CrossRef] [Green Version]
- Zhou, S.; Wang, Y.; Guo, A.; Li, Z.; Li, Y.; Guo, Z. Assessment on impacts of climate change and human activities on runoff in source region of the Yellow River. J. Xi’an Univ. Technol. 2018, 34, 205–210. (In Chinese) [Google Scholar]
- Zheng, Y.; Huang, Y.; Zhou, S.; Wang, K.; Wang, G. Effect partition of climate and catchment changes on runoff variation at the headwater region of the Yellow River based on the Budyko complementary relationship. Sci. Total Environ. 2018, 643, 1166–1177. [Google Scholar] [CrossRef]
- Wang, Y.; Yuan, Z.; Xu, J.; Yan, B.; Hong, X. Research on the attribution identification of source runoff variation in the Yellow River Source Region based on water and energy balance model. IOP. Conf. Ser. Earth Environ. Sci. 2019, 344, 012122. [Google Scholar] [CrossRef]
- Shang, F.; Wang, K.; Huang, Y.; Wei, J. Variation Characteristics of Runoff and the Quantitative Separation Based on Budyko Hypothesis in the Three-River Headwaters Region. J. Tongji Univ. (Nat. Sci.) 2020, 48, 305–316. (In Chinese) [Google Scholar]
- Yang, Y.; Guo, L.; Huang, Q.; Li, D. Temporal and spatial variation of land cover change in the source regions of the Yangtze and Yellow Rivers. Ecol. Sci. 2013, 32, 098–103. (In Chinese) [Google Scholar]
- Lu, H.; Shi, J. Reconstruction and analysis of temporal and spatial variations in surface soil moisture in China using remote sensing. Chin. Sci. Bull. 2012, 57, 1412–1422. (In Chinese) [Google Scholar] [CrossRef] [Green Version]
- Su, Y.; Chen, X.; Li, Y.; Liao, J.; Ye, Y.; Zhang, H.; Huang, N.; Kuang, Y. China’s 19-year city-level carbon emissions of energy consumptions, driving forces and regionalized mitigation guidelines. Renew. Sustain. Energy Rev. 2014, 35, 231–243. [Google Scholar] [CrossRef]
- Wang, H.; Ji, G.; Xia, J. Analysis of Regional Differences in Energy-Related PM2.5 Emissions in China: Influencing Factors and Mitigation Countermeasures. Sustainability 2019, 11, 1409. [Google Scholar] [CrossRef] [Green Version]
- Xia, H.; Wang, H.; Ji, G. Regional Inequality and Influencing Factors of Primary PM Emissions in the Yangtze River Delta, China. Sustainability 2019, 11, 2269. [Google Scholar] [CrossRef] [Green Version]
- He, B.; Miao, C.; Shi, W. Trend, abrupt change, and periodicity of streamflow in the mainstream of Yellow River. Environ. Monit. Assess. 2013, 185, 6187–6199. [Google Scholar] [CrossRef]
- Jia, F.; Li, X.; Sun, C.; Sun, H. Characteristics of runoff variation in the Huangyang River basin from 1951 to 2016. J. Liaoning Norm. Univ. (Nat. Sci. Ed.) 2019, 42, 262–267. (In Chinese) [Google Scholar]
- Song, X.; Mu, X.; Gao, P.; Wang, S.; Wang, F. Trends of Runoff Variation from 1900 to 2005 at Harbin Station of Songhua River. J. Nat. Resour. 2009, 24, 1803–1809. (In Chinese) [Google Scholar]
- Wang, S.; Yan, M.; Yan, Y.; Shi, C.; He, L. Contributions of climate change and human activities to the changes in runoff increment in different sections of the Yellow River. Quat. Int. 2012, 282, 66–77. [Google Scholar] [CrossRef]
- Wang, S.; Yan, Y.; Yan, M.; Zhao, X. Quantitative estimation of the impact of precipitation and human activities on runoff change of the Huangfuchuan River basin. J. Geogr. Sci. 2012, 22, 906–918. [Google Scholar] [CrossRef]
- Wang, S.; Wang, Y.; Ran, L.; Su, T. Climatic and anthropogenic impacts on runoff change in the Songhua River basin over the last 56 years (1955–2010), Northeastern China. Catena 2015, 127, 258–269. [Google Scholar] [CrossRef]
- Yan, X.; Bao, Z.; Zhang, J.; Wang, G.; He, R.; Liu, C. Quantifying contributions of climate change and local human activities to runoff decline in the upper reaches of the Luanhe River basin. J. Hydro. Environ. Res. 2020, 28, 67–74. [Google Scholar] [CrossRef]
- Yang, M.; Sang, Y.; Wang, Z.; Liu, C. Variation of rainfall-runoff relationship and the driving factors identification in the Chaohe River. Geogr. Res. 2014, 33, 1658–1667. (In Chinese) [Google Scholar]
- Zhang, L.; Zhao, G.; Mu, X.; Gaol, P.; Sun, W. Attribution of runoff variation in the Wei River basin based on the Budyko hypothesis. Acta Ecol. Sin. 2018, 38, 7607–7617. (In Chinese) [Google Scholar]
- Al-Safi, H.I.J.; Kazemi, H.; Sarukkalige, P.R. Comparative study of conceptual versus distributed hydrologic modelling to evaluate the impact of climate change on future runoff in unregulated catchments. J. Water Clim. Chang. 2020, 11, 341–366. [Google Scholar] [CrossRef]
- Liu, J.; Chen, J.; Xu, J.; Lin, Y.; Zhou, M. Attribution of Runoff Variation in the Headwaters of the Yangtze River Based on the Budyko Hypothesis. Int. J. Environ. Res. Public Health 2019, 16, 2506. [Google Scholar] [CrossRef] [Green Version]
- Wu, J.; Miao, C.; Wang, Y.; Duan, Q.; Zhang, X. Contribution analysis of the long-term changes in seasonal runoff on the Loess Plateau, China, using eight Budyko-based methods. J. Hydrol. 2017, 545, 263–275. [Google Scholar] [CrossRef]
- Jiang, C.; Xiong, L.; Wang, D.; Liu, P.; Guo, S.; Xu, C. Separating the impacts of climate change and human activities on runoff using the Budyko-type equations with time-varying parameters. J. Hydrol. 2015, 522, 326–338. [Google Scholar] [CrossRef]
- Choudhury, B.J. Evaluation of an empirical equation for annual evaporation using field observations and results from a biophysical model. J. Hydrol. 1999, 216, 99–110. [Google Scholar] [CrossRef]
- Yang, H.; Yang, D.; Lei, Z.; Sun, F. New analytical derivation of the mean annual water- energy balance equation. Water Resour. Res. 2008, 44, W03410. [Google Scholar] [CrossRef]
- Li, J.; Peng, S.; Li, Z. Detecting and attributing vegetation changes on China’s Loess Plateau. Agric. For. Meteorol. 2017, 247, 260–270. [Google Scholar] [CrossRef]
- Gao, J.; Jiao, K.; Wu, S. Investigating the spatially heterogeneous relationships between climate factors and NDVI in China during 1982 to 2013. J. Geogr. Sci. 2019, 29, 1597–1609. [Google Scholar] [CrossRef] [Green Version]
- Guo, L.; Zuo, L.; Gao, J.; Jiang, Y.; Zhang, Y.; Ma, S.; Zou, Y.; Wu, S. Revealing the Fingerprint of Climate Change in Interannual NDVI Variability among Biomes in Inner Mongolia, China. Remote Sens. 2020, 12, 1332. [Google Scholar] [CrossRef] [Green Version]
Figure 1.
The location of hydrological and meteorological stations in the source area of the Yellow River Basin.
Figure 1.
The location of hydrological and meteorological stations in the source area of the Yellow River Basin.

Figure 2.
Change trend of annual average runoff from 1961 to 2015 (a) and NDVI (b) from 1981 to 2015 in the source area of the Yellow River basin.
Figure 2.
Change trend of annual average runoff from 1961 to 2015 (a) and NDVI (b) from 1981 to 2015 in the source area of the Yellow River basin.

Figure 3.
Changing trend of annual average precipitation (a) and potential evaporation (b) from 1961 to 2015 in the source area of the Yellow River basin.
Figure 3.
Changing trend of annual average precipitation (a) and potential evaporation (b) from 1961 to 2015 in the source area of the Yellow River basin.

Figure 4.
Result of the Mann-Kendall mutation test of the source area of the Yellow River from 1961 to 2015.
Figure 4.
Result of the Mann-Kendall mutation test of the source area of the Yellow River from 1961 to 2015.

Figure 5.
Result of the accumulative runoff anomaly of the source area of the Yellow River from 1961 to 2015.
Figure 5.
Result of the accumulative runoff anomaly of the source area of the Yellow River from 1961 to 2015.

Figure 6.
Changing trend of the precipitation elasticity of runoff.

Figure 7.
Changing trend of the potential evaporation elasticity of runoff.

Figure 8.
Changing trend of the underlying surface characteristic parameters elasticity of runoff.


Table 1.
Attribution analysis of vegetation changes in the source area of the Yellow River.
| T1 | T2 | Fitting Equation | ||||||
|---|---|---|---|---|---|---|---|---|
| 1961–1989 | 1990–2015 | NDVI = 3.069 × 10⁻³ P + 8.875× 10⁻⁴ ET0 + 0.1588 (R2 = 0.79) | 0.0282 | 0.3289 | 0.3466 | 0.3571 | 62.79 | 37.21 |
Table 2.
The methodological hydrological variable eigenvalues.
| Hydrological Station | Period | ET0/mm | R/mm | P/mm | R/P | ET0/P | |
|---|---|---|---|---|---|---|---|
| Tangnaihai | T1 | 796.54 | 180.39 | 518.92 | 1.13 | 0.35 | 1.54 |
| T2 | 805.38 | 148.85 | 502.66 | 1.26 | 0.30 | 1.60 |
Table 3.
The attribute analysis of runoff change in the source area of the Yellow River.
| εP | εET0 | εω | ||||||||||
|---|---|---|---|---|---|---|---|---|---|---|---|---|
| 1.77 | −0.77 | −1.16 | −31.54 | −16.26 | 8.84 | 0.13 | −9.36 | −1.41 | −13.32 | −7.89 | 75.33 | 24.67 |
Publisher’s Note: MDPI stays neutral with regard to jurisdictional claims in published maps and institutional affiliations. |
© 2020 by the authors. Licensee MDPI, Basel, Switzerland. This article is an open access article distributed under the terms and conditions of the Creative Commons Attribution (CC BY) license (http://creativecommons.org/licenses/by/4.0/).
Share and Cite
MDPI and ACS Style
Yan, D.; Lai, Z.; Ji, G. Using Budyko-Type Equations for Separating the Impacts of Climate and Vegetation Change on Runoff in the Source Area of the Yellow River. Water 2020, 12, 3418. https://doi.org/10.3390/w12123418
AMA Style
Yan D, Lai Z, Ji G. Using Budyko-Type Equations for Separating the Impacts of Climate and Vegetation Change on Runoff in the Source Area of the Yellow River. Water. 2020; 12(12):3418. https://doi.org/10.3390/w12123418
Chicago/Turabian StyleYan, Dan, Zhizhu Lai, and Guangxing Ji. 2020. "Using Budyko-Type Equations for Separating the Impacts of Climate and Vegetation Change on Runoff in the Source Area of the Yellow River" Water 12, no. 12: 3418. https://doi.org/10.3390/w12123418
Note that from the first issue of 2016, this journal uses article numbers instead of page numbers. See further details here.