Hydrochemical Parameters to Assess the Evolutionary Process of CO2-Rich Spring Water: A Suggestion for Evaluating CO2 Leakage Stages in Silicate Rocks


Department of Earth and Environmental Sciences and Korea CO2 Storage Environmental Management (K-COSEM) Research Center, Korea University, Seoul 02841, Korea
*
Author to whom correspondence should be addressed.
Water 2020, 12(12), 3421; https://doi.org/10.3390/w12123421
Submission received: 29 September 2020
/
Revised: 4 November 2020
/
Accepted: 1 December 2020
/
Published: 4 December 2020
(This article belongs to the Section Hydrology)
Abstract
:Eighteen water samples collected from eight CO2-rich springs in the northern part of the Gyeongsang sedimentary basin (GSB), South Korea showed distinct hydrochemistry, in particular, pH, total dissolved solids (TDS), and Na contents, and they were classified into four groups: (1) Group I with low pH (average of 5.14) and TDS (269.8 mg/L), (2) Group II with high TDS (2681.0 mg/L) and Na-enriched (202.9 mg/L), (3) Group III with intermediate Na content (97.5 mg/L), and (4) Group IV with Na-depleted (42.3 mg/L). However, they showed the similar partial pressure of CO2 (0.47 to 2.19 atm) and stable carbon isotope ratios of dissolved inorganic carbon (−6.3 to −0.6‰), indicating the inflow of deep-seated CO2 into aquifers along faults. In order to elucidate the evolutionary process for each group of CO2-rich springs, a multidisciplinary approach was used combining stable hydrogen (δD), oxygen (δ18O) and carbon (δ13C), and radioactive carbon (14C) isotopic, geophysical, and hydrochemical data. The highest δD and δ18O ratios of water and the relatively young 14C ages in Group I and the lowest δD and δ18O in Group II indicated the short and long residence time in Group I and II, respectively. The electrical resistivity tomography (ERT) survey results also supported the fast rising through open fractures in Group I, while a relatively deep CO2-rich aquifer for Group III. Group II had high contents of Mg, K, F, Cl, SO4, HCO3, Li, and As, while Group I showed low contents for all elements analyzed in this study except for Al, which exceeded the World Health Organization (WHO) guideline for drinking-water quality probably due to the low pH. Meanwhile Group IV showed the highest Ca/Na as well as Ca, Fe, Mn, Sr, Zn, U, and Ba, probably due to the low-temperature dissolution of plagioclase based on the geology and the ERT result. The levels of Fe, Mn, and U exceeded the WHO guidelines in Group IV, while As in Group II. The different hydrochemistry suggests a distinct evolutionary process for each group. Group I seems to represent a fast discharge from the CO2-rich aquifer to a discharge point, experiencing a low degree of water-rock interaction, while Group II seems to represent a slow discharge with a high degree of water-rock interaction. GSB is a potential site for geological carbon storage (GCS), and injected CO2 may leak through various evolutionary processes given heterogenous geology as CO2-rich springs. The study result suggests that the combined use of pH, Na, K, Li, and Ca/Na are effective hydrochemical monitoring parameters to assess the leakage stage in silicate rocks in GCS projects. Besides, aluminum (Al) can be risky at the early stage of CO2 leakage, while Fe, Mn, U, and As at the later stage of CO2 leakage.
1. Introduction
Various efforts, including economic incentives and technology development, have been made to mitigate climate change by anthropogenic greenhouse gases (GHGs). Among technologies to reduce the global emissions of GHGs, the geological carbon storage (GCS) is accepted as one of the most promising technologies [1,2,3,4]. The global warming potential is estimated to be reduced by 63~82% by GCS based on a life cycle assessment study [5]. However, the geological complexity of GCS sites causes environmental risks, including environmental damages due to CO2 leakage [5,6], although there has been no harmful leakage at GCS sites until now. The public concern about potential risks of CO2 leakage from storage sites should be properly addressed for successful demonstration and commercialization of GCS.
Therefore, monitoring and verification (M&V) operations are a key process to gain public acceptance and to sequester CO2 safely into deep geologic formations. M&V techniques have been proposed to evaluate the response of soil, water, and living resources to injected CO2 in the shallow subsurface environment at different scales (e.g., laboratory, pilot, or full) and formations (e.g., sedimentary or crystalline) [7,8,9,10,11,12]. However, the artificial CO2 injection tests provide limited information about the long-term CO2-water-rock interaction and the related changes in the subsurface environment (e.g., groundwater quality, porosity, permeability). Besides, the short history of GCS does not provide enough data to assure the possibility of CO2 leakage and its causes in GCS projects.
To overcome such limited knowledge from the injected CO2 tests or GCS projects, natural CO2 emissions from geologic reservoirs such as CO2-rich springs have been studied as natural analogues of CO2 leakage. The natural CO2 emission has evolved over geological timescales [13,14,15] and thus provides opportunities to evaluate the potential impacts of a slow and gradual CO2 leakage and the long-term safety of GCS [14,15,16,17] and moreover to suggest effective M&V techniques and parameters [18,19,20,21,22]. In particular, the hydrochemistry of CO2-rich springs helps to understand the ascending process of injected CO2 (e.g., rapid leakage through faults, fractures, or abandoned well versus slow leakage along rock discontinuities [15]) and accompanying CO2-water-rock interactions [23,24,25]. Specifically, hydrochemical compositions suggest evolutionary processes from deep subsurface to a discharge point [23,26]. Trace elements provide the information on health effects of enhanced water-rock interactions with the CO2 inflow [23,24]. Besides, stable and radioactive carbon isotopic compositions in CO2-rich springs have been used to estimate the residence time of CO2-rich groundwater [23,27] as well as the source of CO2 [15,28,29,30,31].
Recently, electrical resistivity tomography (ERT) has been combined with the hydrochemical and environmental isotopic study to provide an image of near-surface structures and to assess the migration pathway of CO2-rich fluids in the sites of both natural emission and artificial injection tests [16,22,32,33]. ERT is a noninvasive technique to image the electrical resistivity pattern of the subsurface [34]. The distribution of the resistivity is related to the geologic, hydrogeologic, and hydrochemical properties, and thus useful to estimate the pathways of fluids with contrast resistivity, including CO2-rich water that has relatively low pH and high electrical conductivity (EC) [16,32].
The aim of this study was to characterize the hydrochemistry of CO2-rich springs and to elucidate their evolutionary process in a natural analogue site in South Korea based on a multidisciplinary approach combining hydrochemical, geophysical, and stable and radioactive carbon isotopic data. Environmental impacts of CO2-rich water were assessed and useful M&V parameters to evaluate leakage stages were suggested for GCS sites in silicate rocks.
2. Study Area
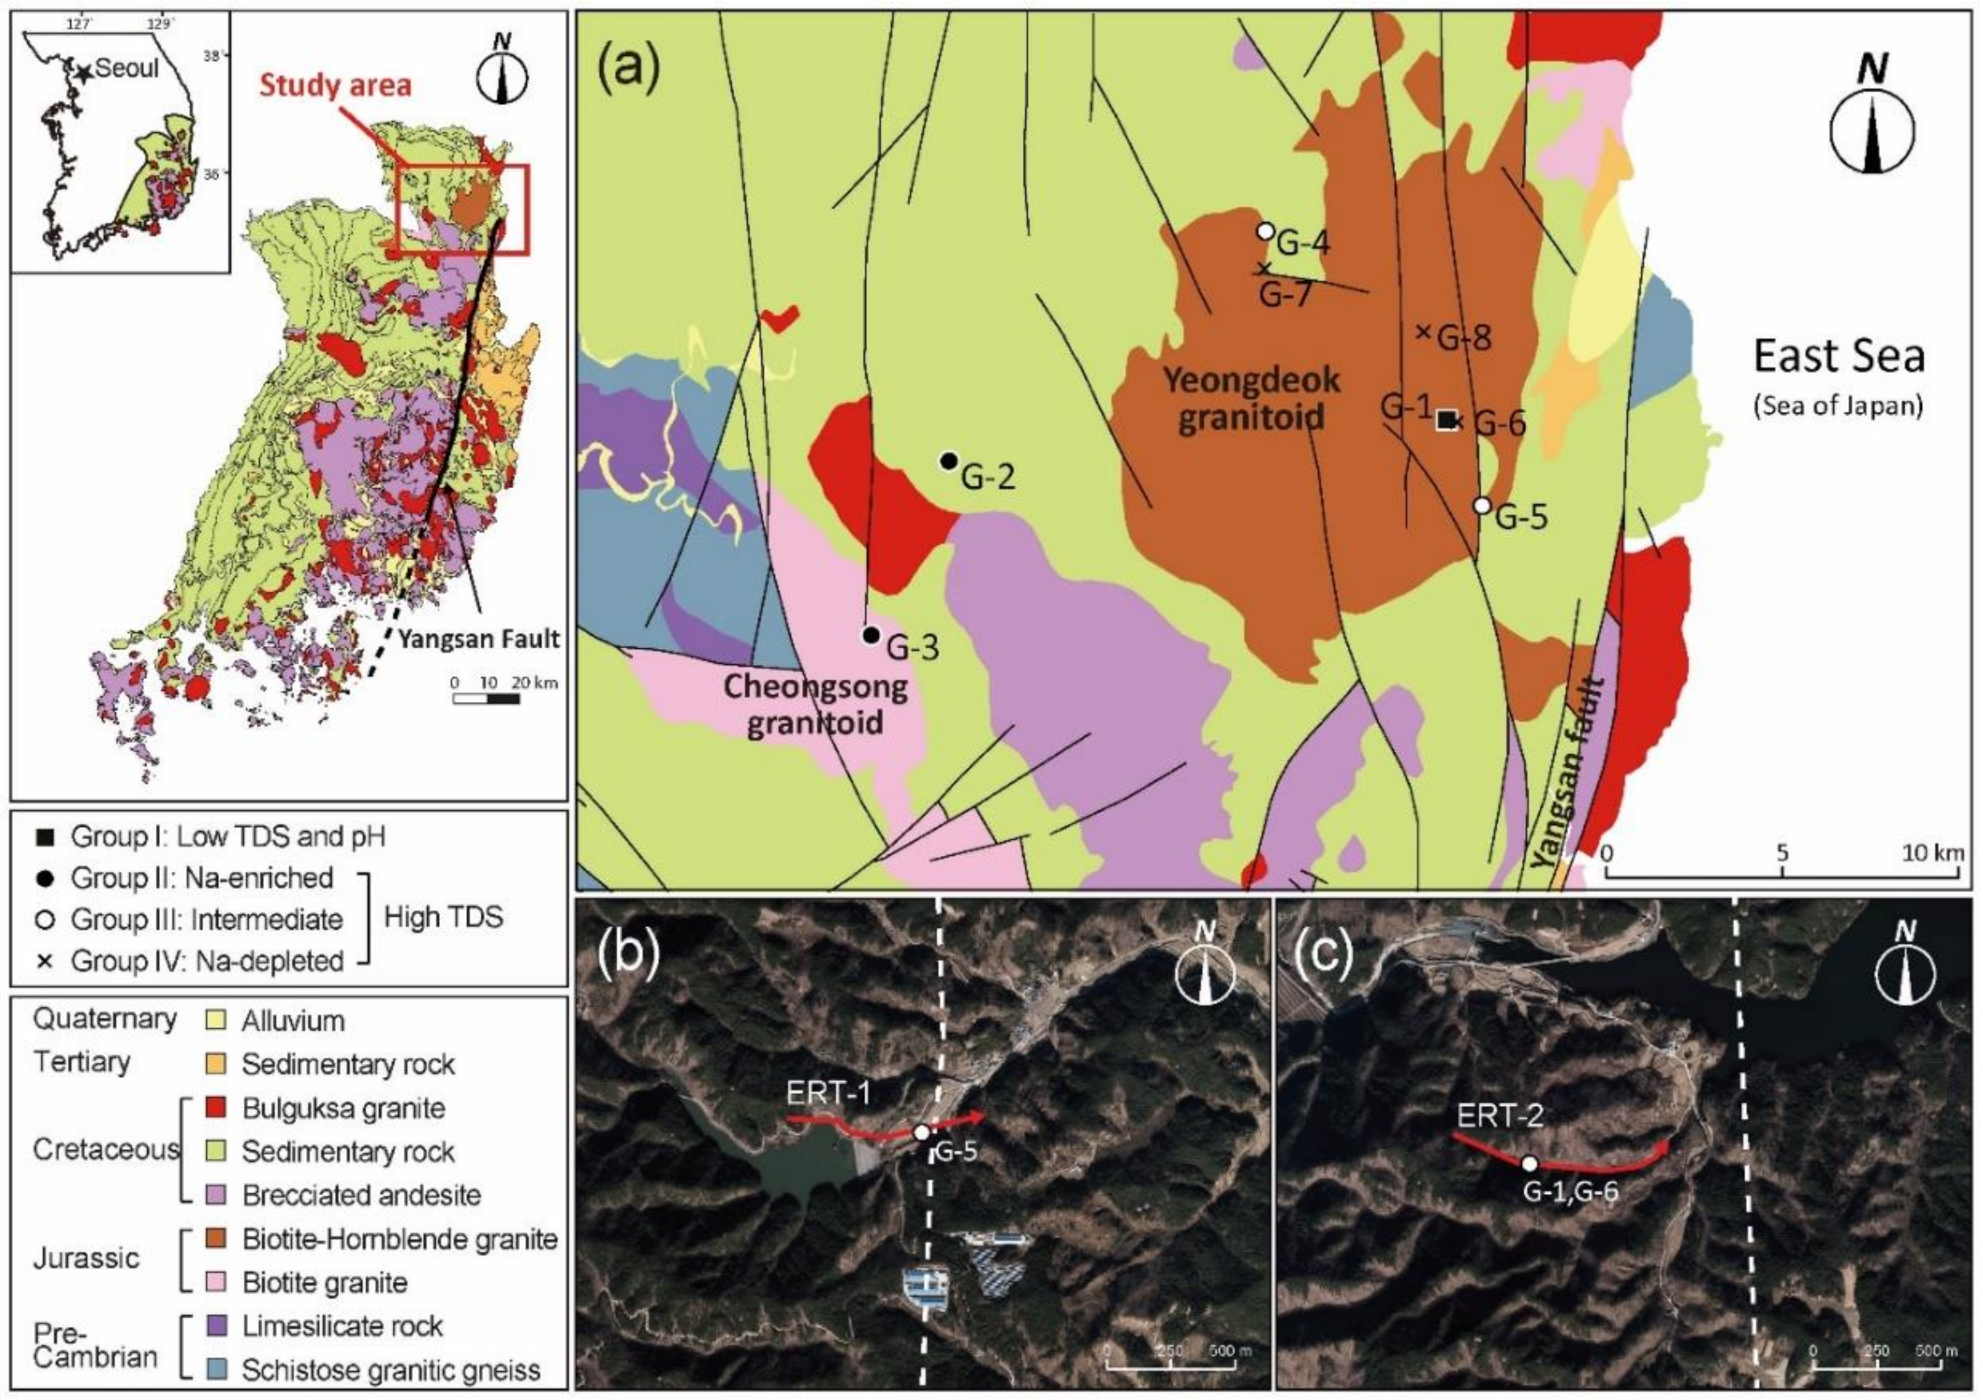
The study area is located at the northern part of the Gyeongsang sedimentary basin (GSB), South Korea (Figure 1). The GSB is mainly composed of Cretaceous fluvial and lacustrine sedimentary rocks deposited in rivers and temporary lakes and marshes that experienced seasonal drying and repeated wetting events [35]. The sedimentary rocks consist of plagioclase, quartz, K-feldspar, micas and pore-filling minerals such as calcite, dolomite, and chlorite [36]. Cretaceous to early Tertiary Bulguksa granites ubiquitously intruded the sedimentary rocks.
In the northern part of the GSB, two Mesozoic granitoids (Yeongdeok and Cheongsong granitoids) occur and are surrounded by Precambrian gneiss and Cretaceous sedimentary rocks (Figure 1a). Both Yeongdeok and Cheongsong granitoids were originated from continental magmatic arcs, while the mixing proportion of crustal components is different: from ca. 20 to 40% in the Yeongdeok granitoid and from ca. 40 to 60% in the Cheongsong granitoid [37]. The Yeongdeok granitoid is biotite-hornblende granite containing K-feldspar megacrysts and mainly consists of quartz, K-feldspar and plagioclase with a minor amount of biotite, hornblende, sphene, zircon, and apatite [38]. The Cheongsong granitoid represents biotite granite with megacrysts of pinkish K-feldspar; includes K-feldspar, plagioclase, quartz, and biotite, with a minor amount of sphene, zircon, and epidote [37]. These two granitoids have older (i.e., Triassic to Jurassic) ages and are emplaced at deeper depths than the Cretaceous Bulguksa granite that is ubiquitously distributed in the GSB [37,38,39].
Tecto-lineaments appear in several directions within the study area, while the NS-trending faults are the most pronounced, which are thought to have been formed under the influence of the Yangsan fault [38]. Naturally seeping CO2-rich springs are located along faults mainly in and around the two Mesozoic granitoids in the GSB (Figure 1a). We examined eight springs for this study, of which six springs (G-1, G-4, G-5, G-6, G-7, and G-8) are located in the Yeongdeok granitoid. The spring G-3 is located in the Cheongsong granitoid, while the spring G-2 occurs along the geologic boundary between the Bulguksa granite and the Cretaceous sandstone and red shale. The Bulguksa granite and brecciated andesite intruded the sedimentary rocks in G-2 [40]. Gas bubbles were observed in all eight springs. The origin of CO2 in the CO2-rich springs has been reported to be deep-seated such as mantle in the study area [40,41,42,43], whereas the hydrochemical evolutionary processes related to the CO2-water-rock interaction have not yet been fully understood, which motivated this study.
3. Methods
3.1. Sampling and Analytical Methods
A total of 18 water samples were collected from eight CO2-rich springs through three sampling campaigns in February 2013 (n = 5), February 2014 (n = 7), and March 2015 (n = 6) for hydrochemical and isotopic analyses (Figure 1a). Water samples at G-3, G-4, and G-7 were collected since 2014, while the spring G-7 was closed and could not be sampled during the 2015 sampling campaign. Meanwhile, the access to G-8 was not possible after 2013, since the spring G-8 is located on a private estate.
Temperature, pH, redox potential (Eh), EC, and dissolved oxygen (DO) of water samples were measured on-site with a portable multiparameter meter (Orion 1230) within a flow-through cell to minimize the contact with atmospheric oxygen. Alkalinity was also determined on-site by titration with HNO3 solution (0.5 N or 0.05 N) as soon as the water was collected to minimize CO2 degassing from the CO2-rich water. All water samples for laboratory analyses were filtered with 0.45-μm cellulose nitrate membrane filters and stored in high-density polyethylene bottles. Then the samples for major cation and trace element analyses were acidified. Dissolved inorganic carbon (DIC) of water samples was precipitated by adding NaOH and BaCl2 for the measurement of stable carbon isotopic composition (δ13C) and the radiocarbon dating (14C). All water samples were maintained at a low temperature (<4 °C) using a cooler or refrigerator until analyses.
Water samples with high EC (>1000 µS/cm) were diluted with a 1:10, 1:30, and 1:100 dilution ratio for cations, anions, and trace elements, respectively before analysis. Then major cations (Na, K, Mg, Ca) and SiO2 were determined using ICP-AES (Ultima 2, HORIBA Jobin Yvon) at the Korea Basic Science Institute (KBSI), while anions (Cl, SO4, NO3, F) were analyzed using IC (Dionex ICS-1100, Thermo Fisher Scientific, Waltham, MA, USA) at the Center for Mineral Resources Research (CMR) of Korea University. Trace elements (Fe, Mn, Al, Sr, Li, Zn, As, U, Ba) were analyzed by ICP-MS (Elan DRC II, PerkinElmer, Waltham, MA, USA) at KBSI. The detection limits were 0.01 ppb for all trace elements analyzed for this study. The alkalinity was converted to HCO3 (mg/L) because of the pH range (Table 1). Then charge balance errors were within an acceptable range of ±5% for all water samples. The oxygen (δ18O) and hydrogen (δD) isotopic compositions of water were determined using a stable isotope ratio mass spectrometer (S-IRMS, IsoPrime, GV Instruments Ltd., Wythenshave, Manchester, UK) at KBSI. The δ18O and δD values were measured relative to the internal standards that were calibrated with the Standard Mean Ocean Water (SMOW) and showed the analytical error of ±0.1‰ and ±1‰, respectively. The δ13C of DIC was determined using an IRMS (Delta V Plus, Thermo Scientific) with ±0.1‰ precision relative to the Pee Dee Belemnite (PDB) at KBSI. The radiocarbon dating (14C) was performed using accelerator mass spectrometer (AMS, National Electrostatics Corp., Middleton, WI, USA) at Beta Analytic (Miami, FL, USA). In addition, the partial pressures of CO2 (PCO2) were calculated based on the physicochemical data measured for this study using PHREEQC software [44].
3.2. Geophysical Exploration
Electrical resistivity was investigated in March 2016 along two 800-m survey lines, i.e., ERT-1 around G-5 (Figure 1b) and ERT-2 around G-1 and G-6 (Figure 1c) to identify the hydrogeological setting (e.g., fault or fracture) around three CO2-rich springs and its relationship with hydrochemistry. In Figure 1a, the three CO2-rich springs (G-1, G-5, and G-6) occur near the NS-trending faults, which may act as pathways to discharge CO2-rich water. Therefore, the survey lines were arranged in the WE-direction perpendicular to the fault direction to detect the pathways of fluids.
The resistivity data acquisition system used for this survey was a Lund Imaging System (ABEM Instrument AB, Sundbyberg, Sweden) equipped with SAS4000 terrameter and ES-10-64c multiplexer, which automatically recorded data using a 41-channel cable (10 m) and 80 electrodes (I type and T type steel sticks). A dipole-dipole array was used because of its high resolution. The length of the survey line and the electrode array used in this study allowed the maximum depth measured by the ERT to be 100 m below the surface. The apparent resistivity data were processed with Res2DInv (Geotomo Software, Gelugor, Penang, Malaysia) electrical resistivity analysis software and the active constraint balancing approach for inversion.
4. Results
4.1. Hydrochemcial and Isotopic Compositions
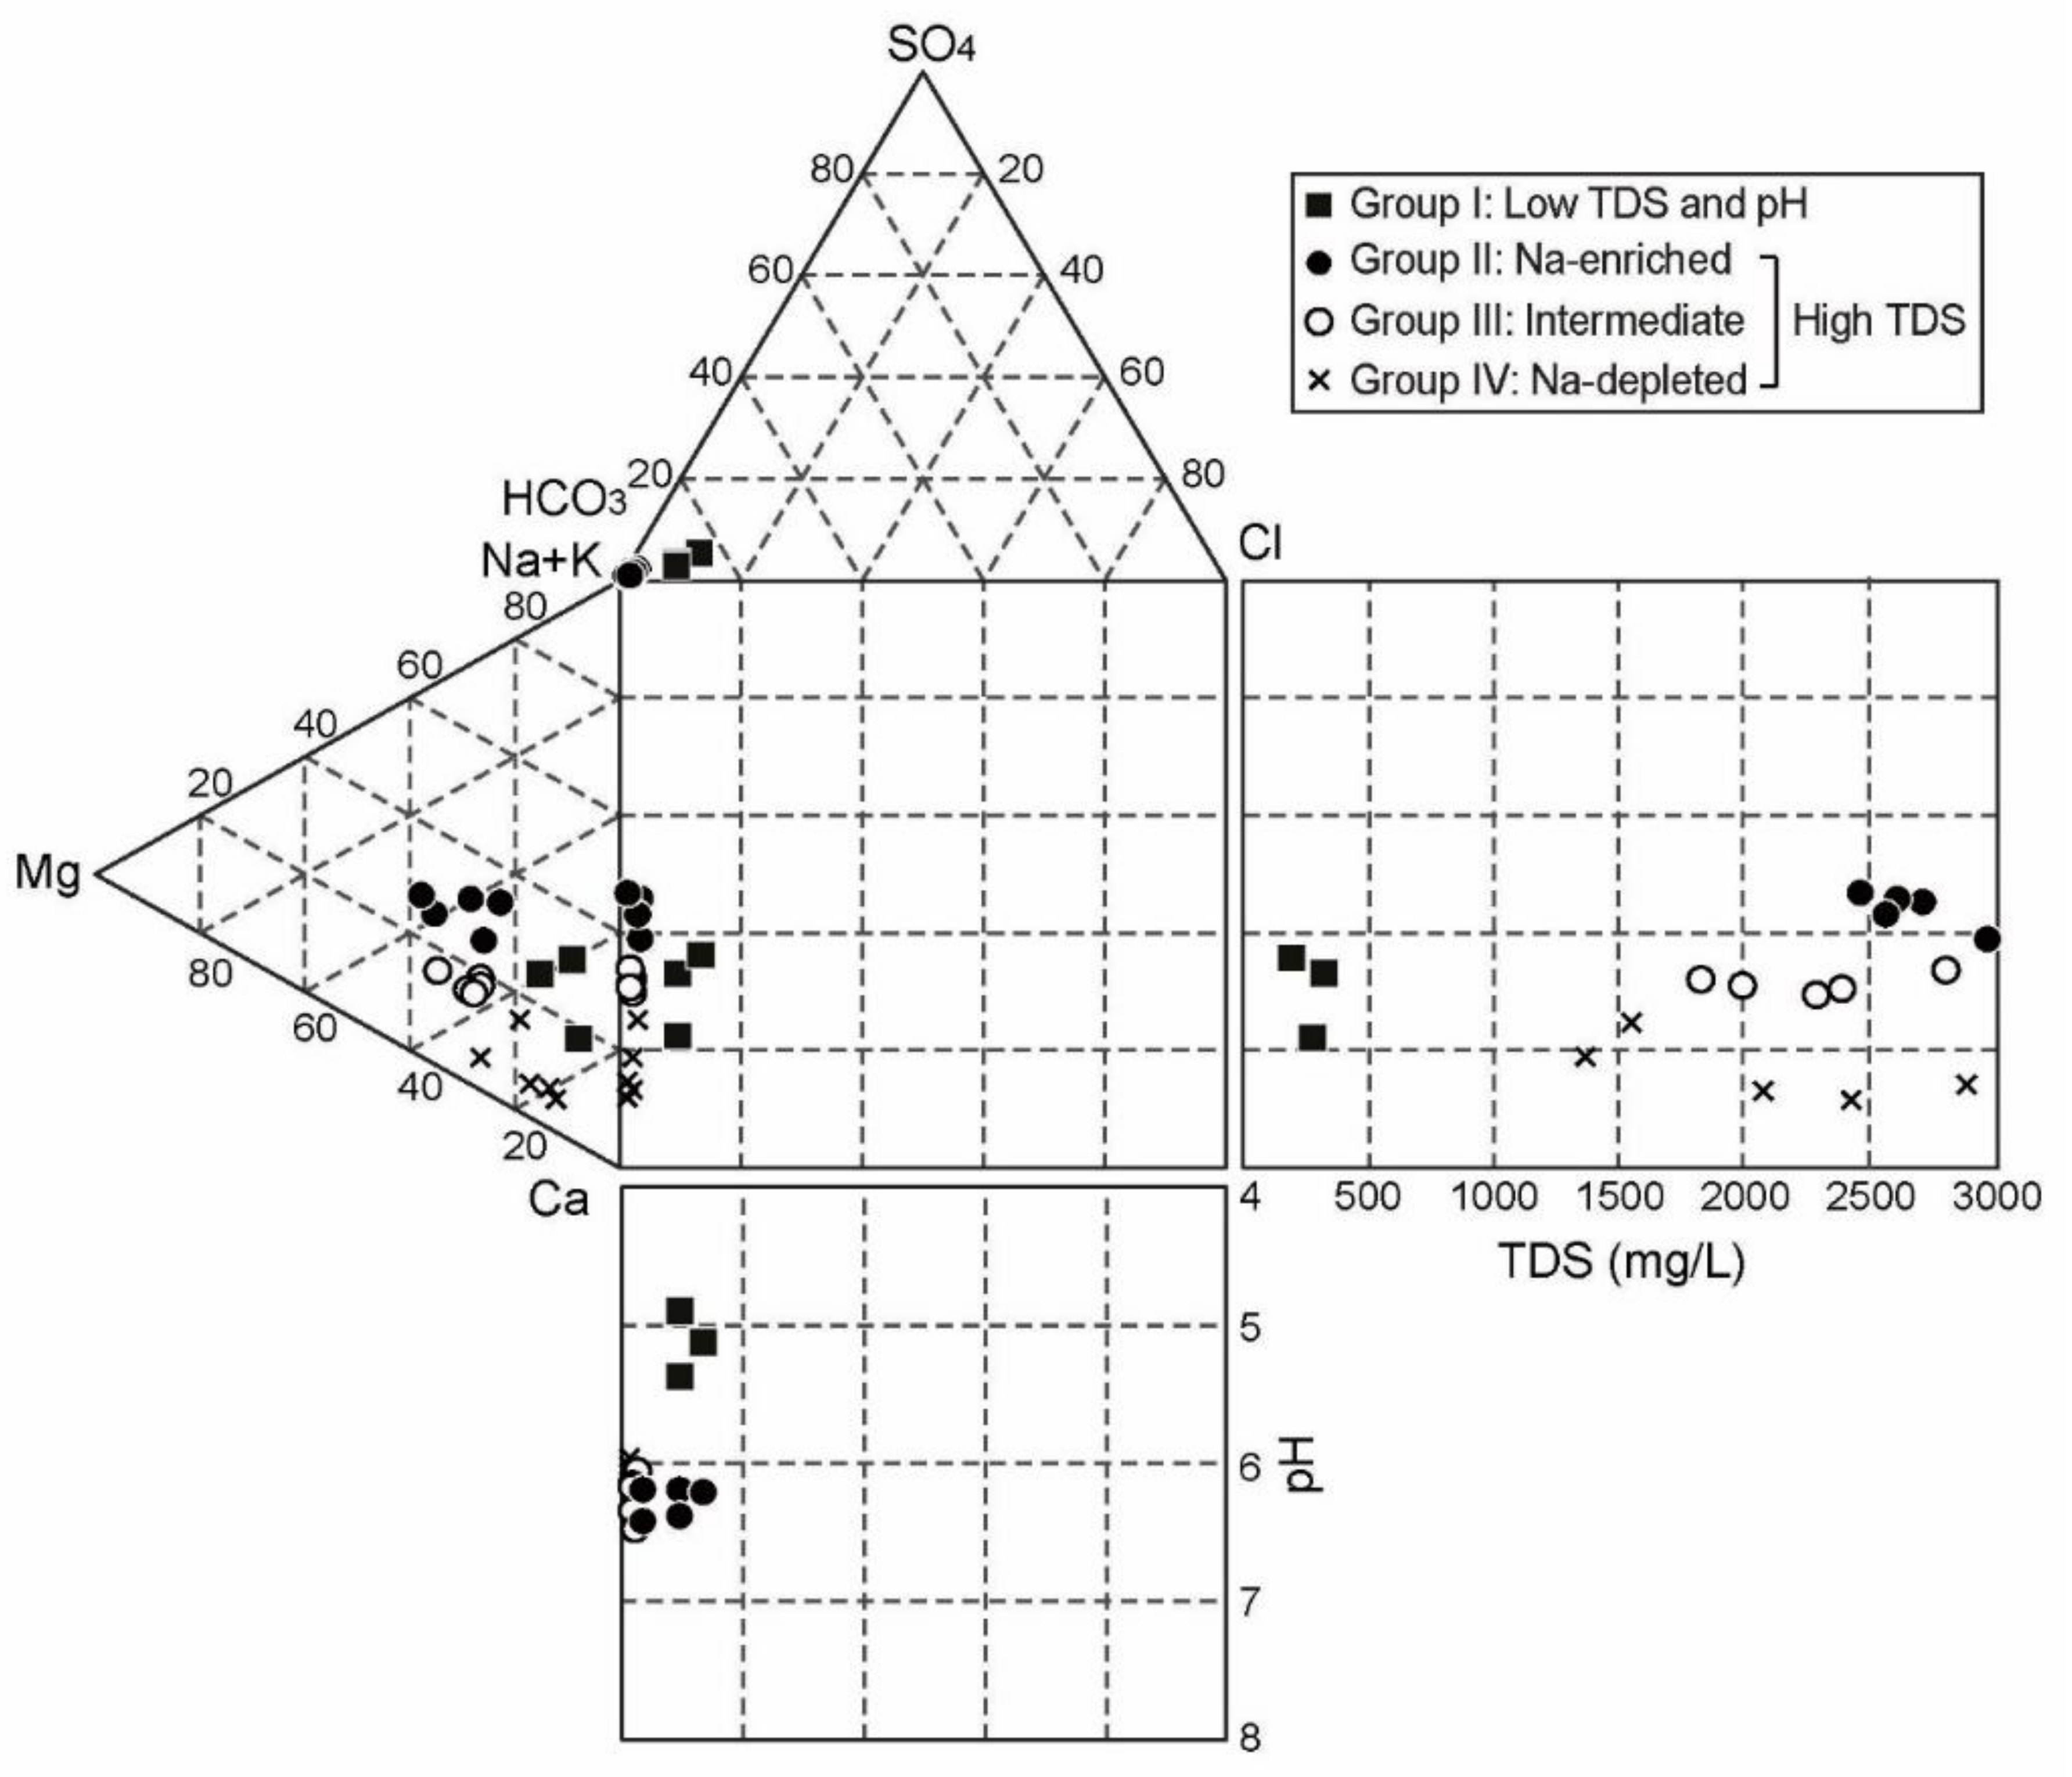
The hydrochemical compositions of CO2-rich spring water samples were plotted on a Durov diagram to classify water groups and to understand the hydrochemical characteristics of each water group (Figure 2). The temporal variation was ignored because each spring showed similar hydrochemical compositions through the three sampling campaigns (Table 1). All CO2-rich springs were shown as the Ca-HCO3 type as in the previous studies [41,43,45,46] and showed relatively low pH values down to 4.92 at G-1 and high EC values up to 3240 μS/cm at G-5 (Table 1). Among them, three water samples from the spring G-1 were much lower in pH, TDS, and HCO3 (Figure 2; Table 1), and thus classified into a separate group of dilute and acidic (i.e., low TDS and pH) CO2-rich water (Group I in Figure 2). The other CO2-rich water samples were further classified into three groups according to the Na content in Figure 2 because of its distinct difference (Table 1; Figure 3c): Na-enriched (Group II; n = 5 from G-2 and G-3) with the highest average Na content (202.9 mg/L), intermediate (Group III; n = 5 from G-4 and G-5) with the moderate average (97.5 mg/L), and Na-depleted (Group IV; n = 5 from G-6, G-7 and G-8) with the lowest average (42.3 mg/L). Group II showed higher TDS than the other groups in the range of 2485.2 to 2983.8 mg/L, while Group III and Group IV had a wide range of TDS from 1838.1 to 2817.5 mg/L and from 1381.1 to 2893.9 mg/L, respectively, whereas pH was similar in the three groups and higher than that in Group I.
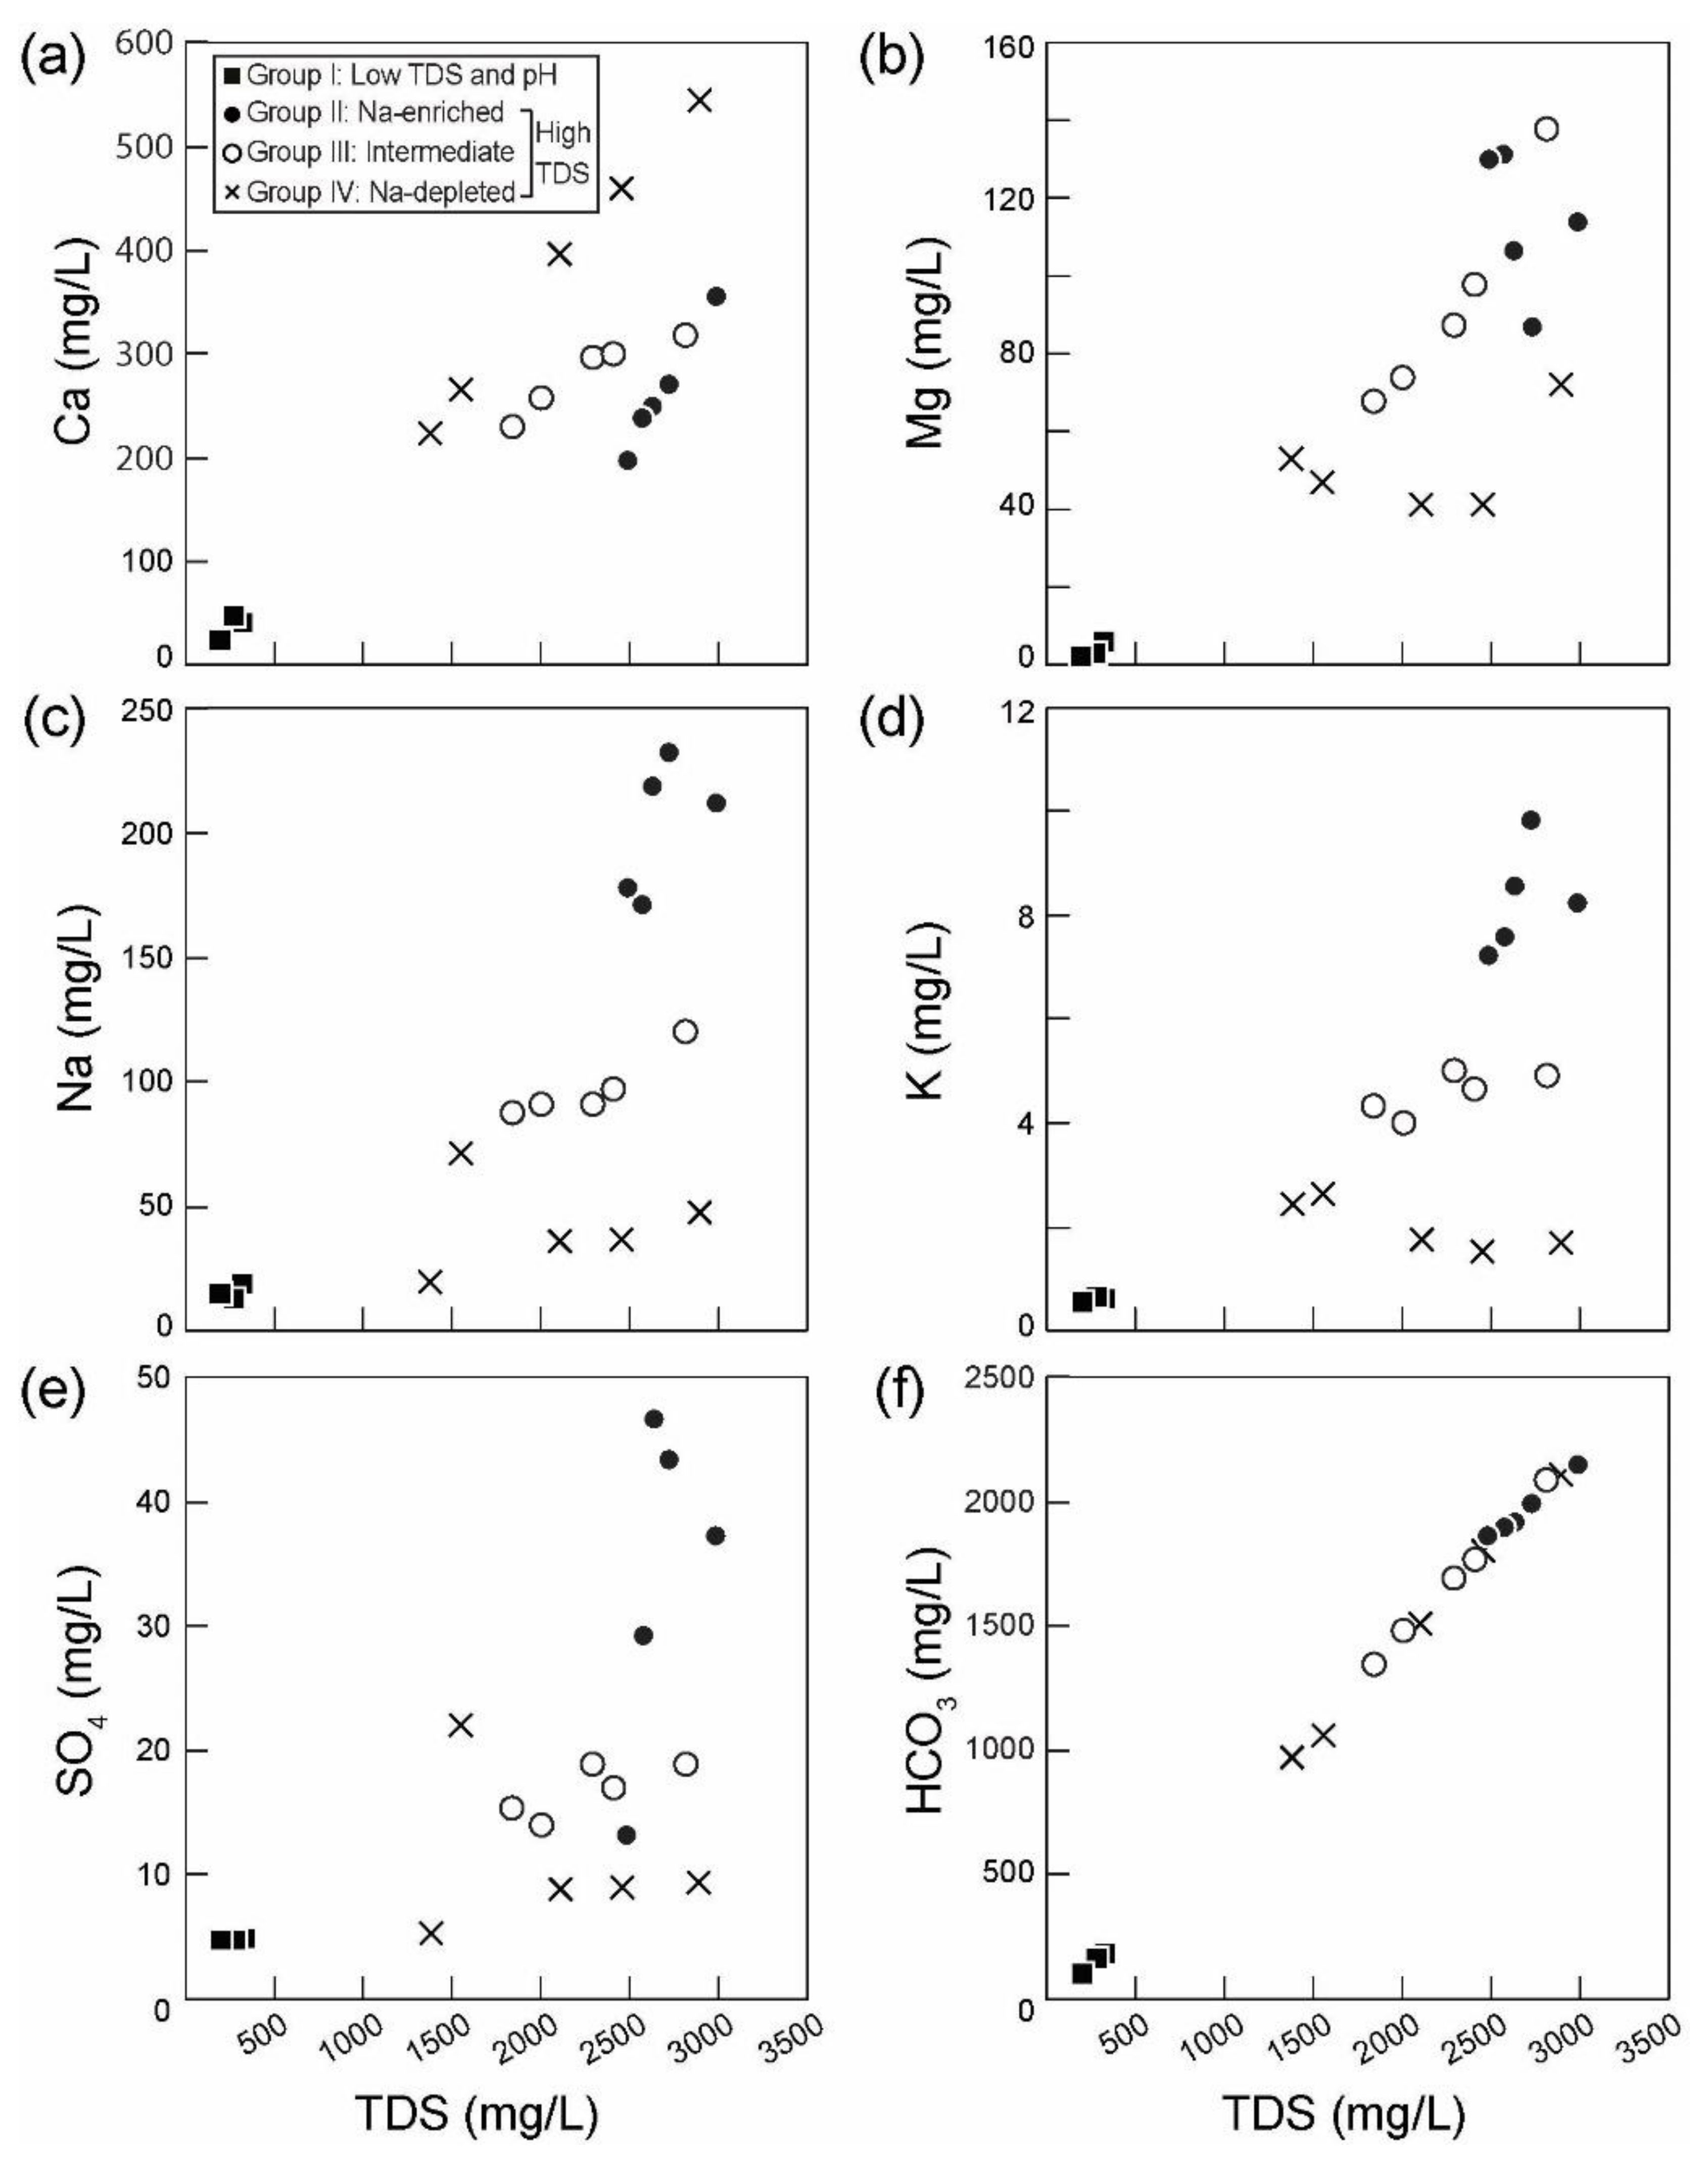
The hydrochemical difference between each group is more noticeable in the relationship between TDS and major ions (Figure 3). Group II had significantly higher concentrations of Na, K, SO4, and HCO3 than the other groups, while lower Ca concentrations than the water samples with the similar range of TDS in the other groups. Group III had higher Na, K, Mg, and SO4 concentrations than Group IV. Group I showed the lowest concentrations for all major compositions.
The concentrations of trace elements analyzed for this study also varied by groups (Table 2), although they were relatively high in the CO2-rich springs compared to those in shallow groundwater and surface water in the study area [43,46]. Group I had the lowest concentrations for all trace elements excluding Al. Group II had higher Li and As concentrations than the other groups. Group III usually showed concentrations in the middle of Group II and IV for all trace elements except Sr and U, which showed the lower average in Group III than in Group II and IV. In Group IV, the concentrations of Fe and Mn were significantly higher than those in the other groups, and the concentrations of Sr, Zn, U, and Ba were also higher than the corresponding concentrations in Group II and III.
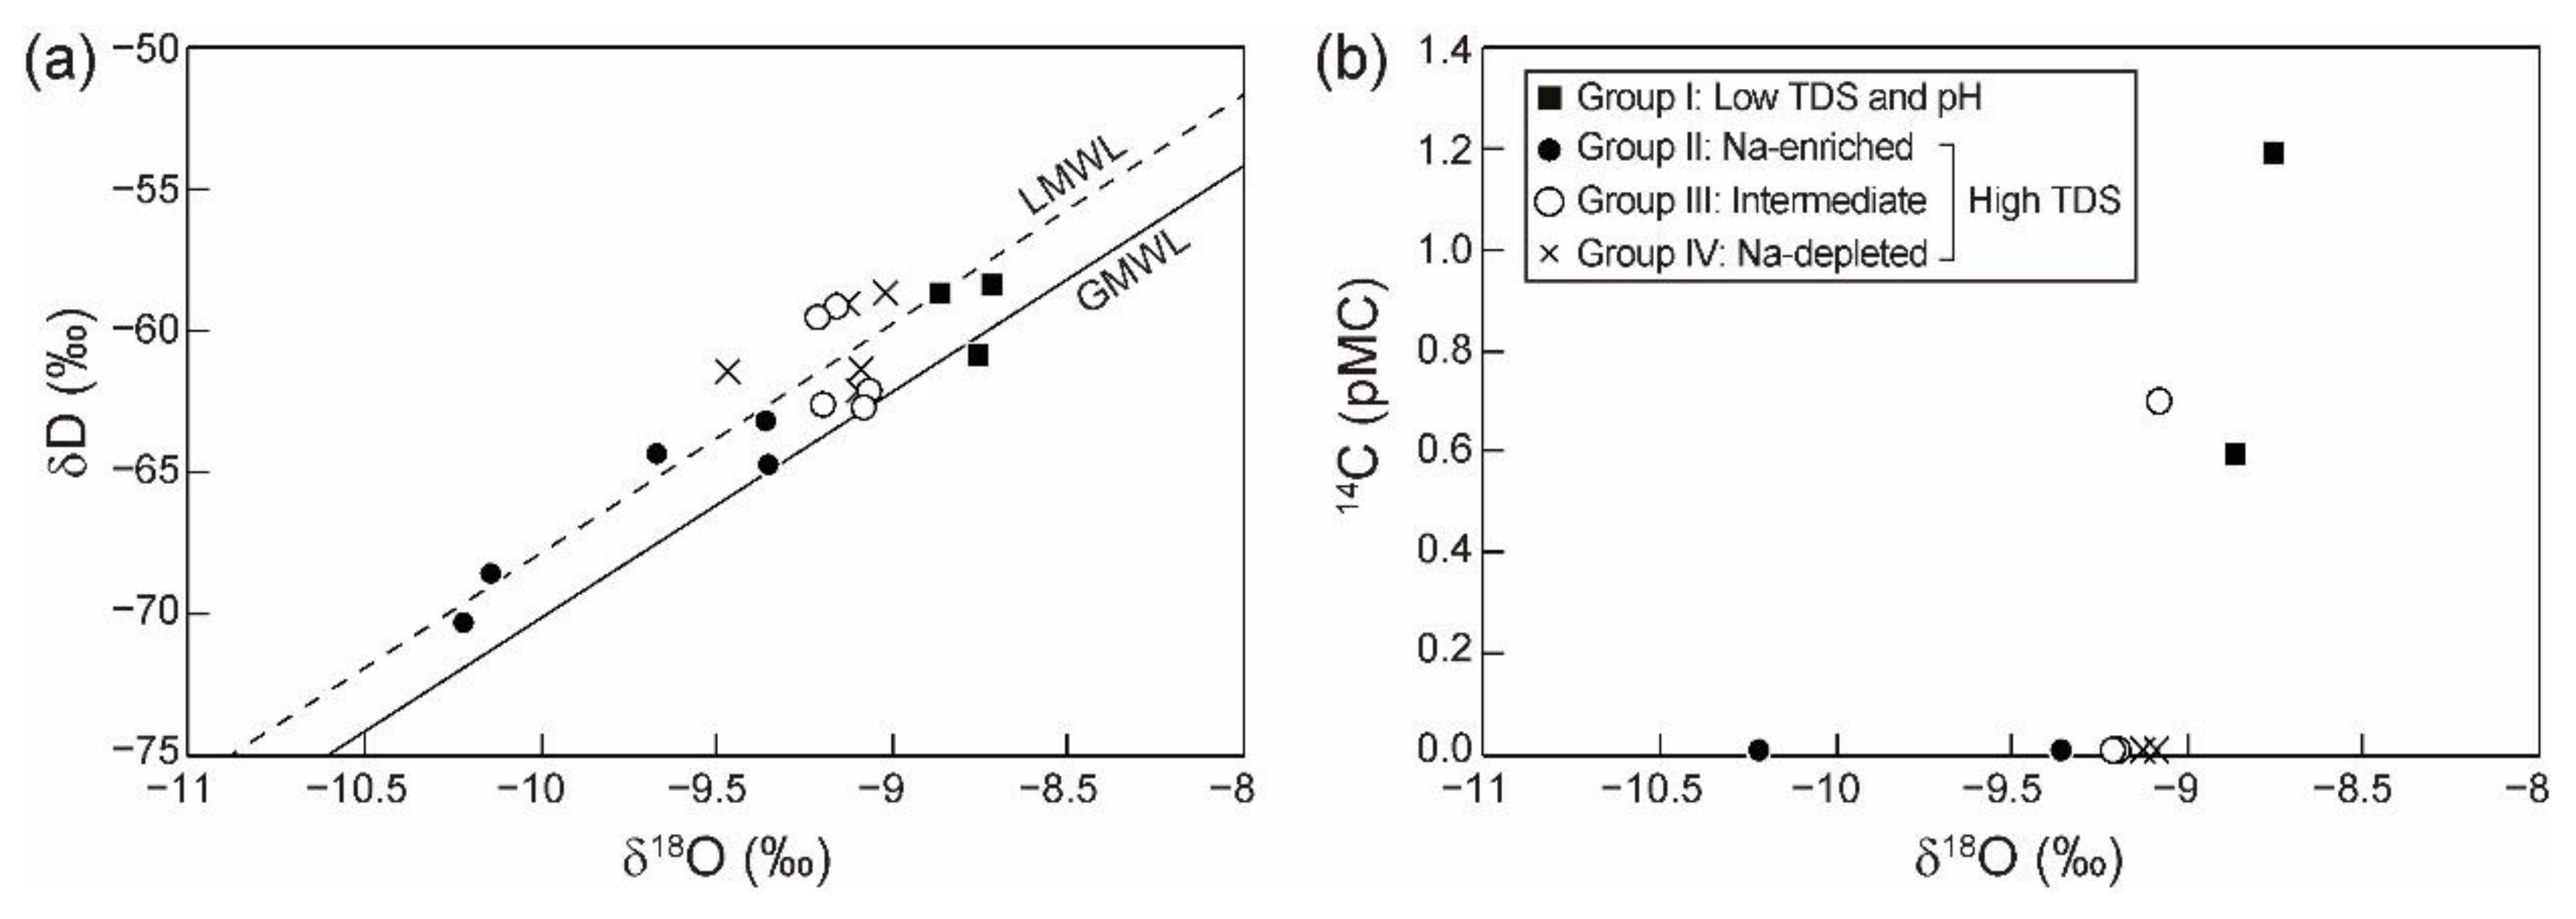
The δD and δ18O of CO2-rich spring water samples were plotted along the global meteoric water line [48] or local meteoric water line (LMWL; δD = 8.06 × δ18O + 12.87 [49]) in Figure 4a, indicating that all the spring water samples had been recharged from the meteoric water. However, Group I showed the higher values (average δ18O = −8.8‰), while Group II had the lower values (average δ18O = −9.8‰) than the other groups. Group III (average δ18O = −9.2‰) and IV (average δ18O = −9.2‰) showed the similar δD and δ18O (Figure 4a). The 14C activities of the CO2-rich springs were considerably low (average 0.2 pMC; Table 3 and Figure 4b) compared to those of soil CO2 (more than 100 pMC [48]), while Group I showed relatively high 14C (0.6 and 1.2 pMC).
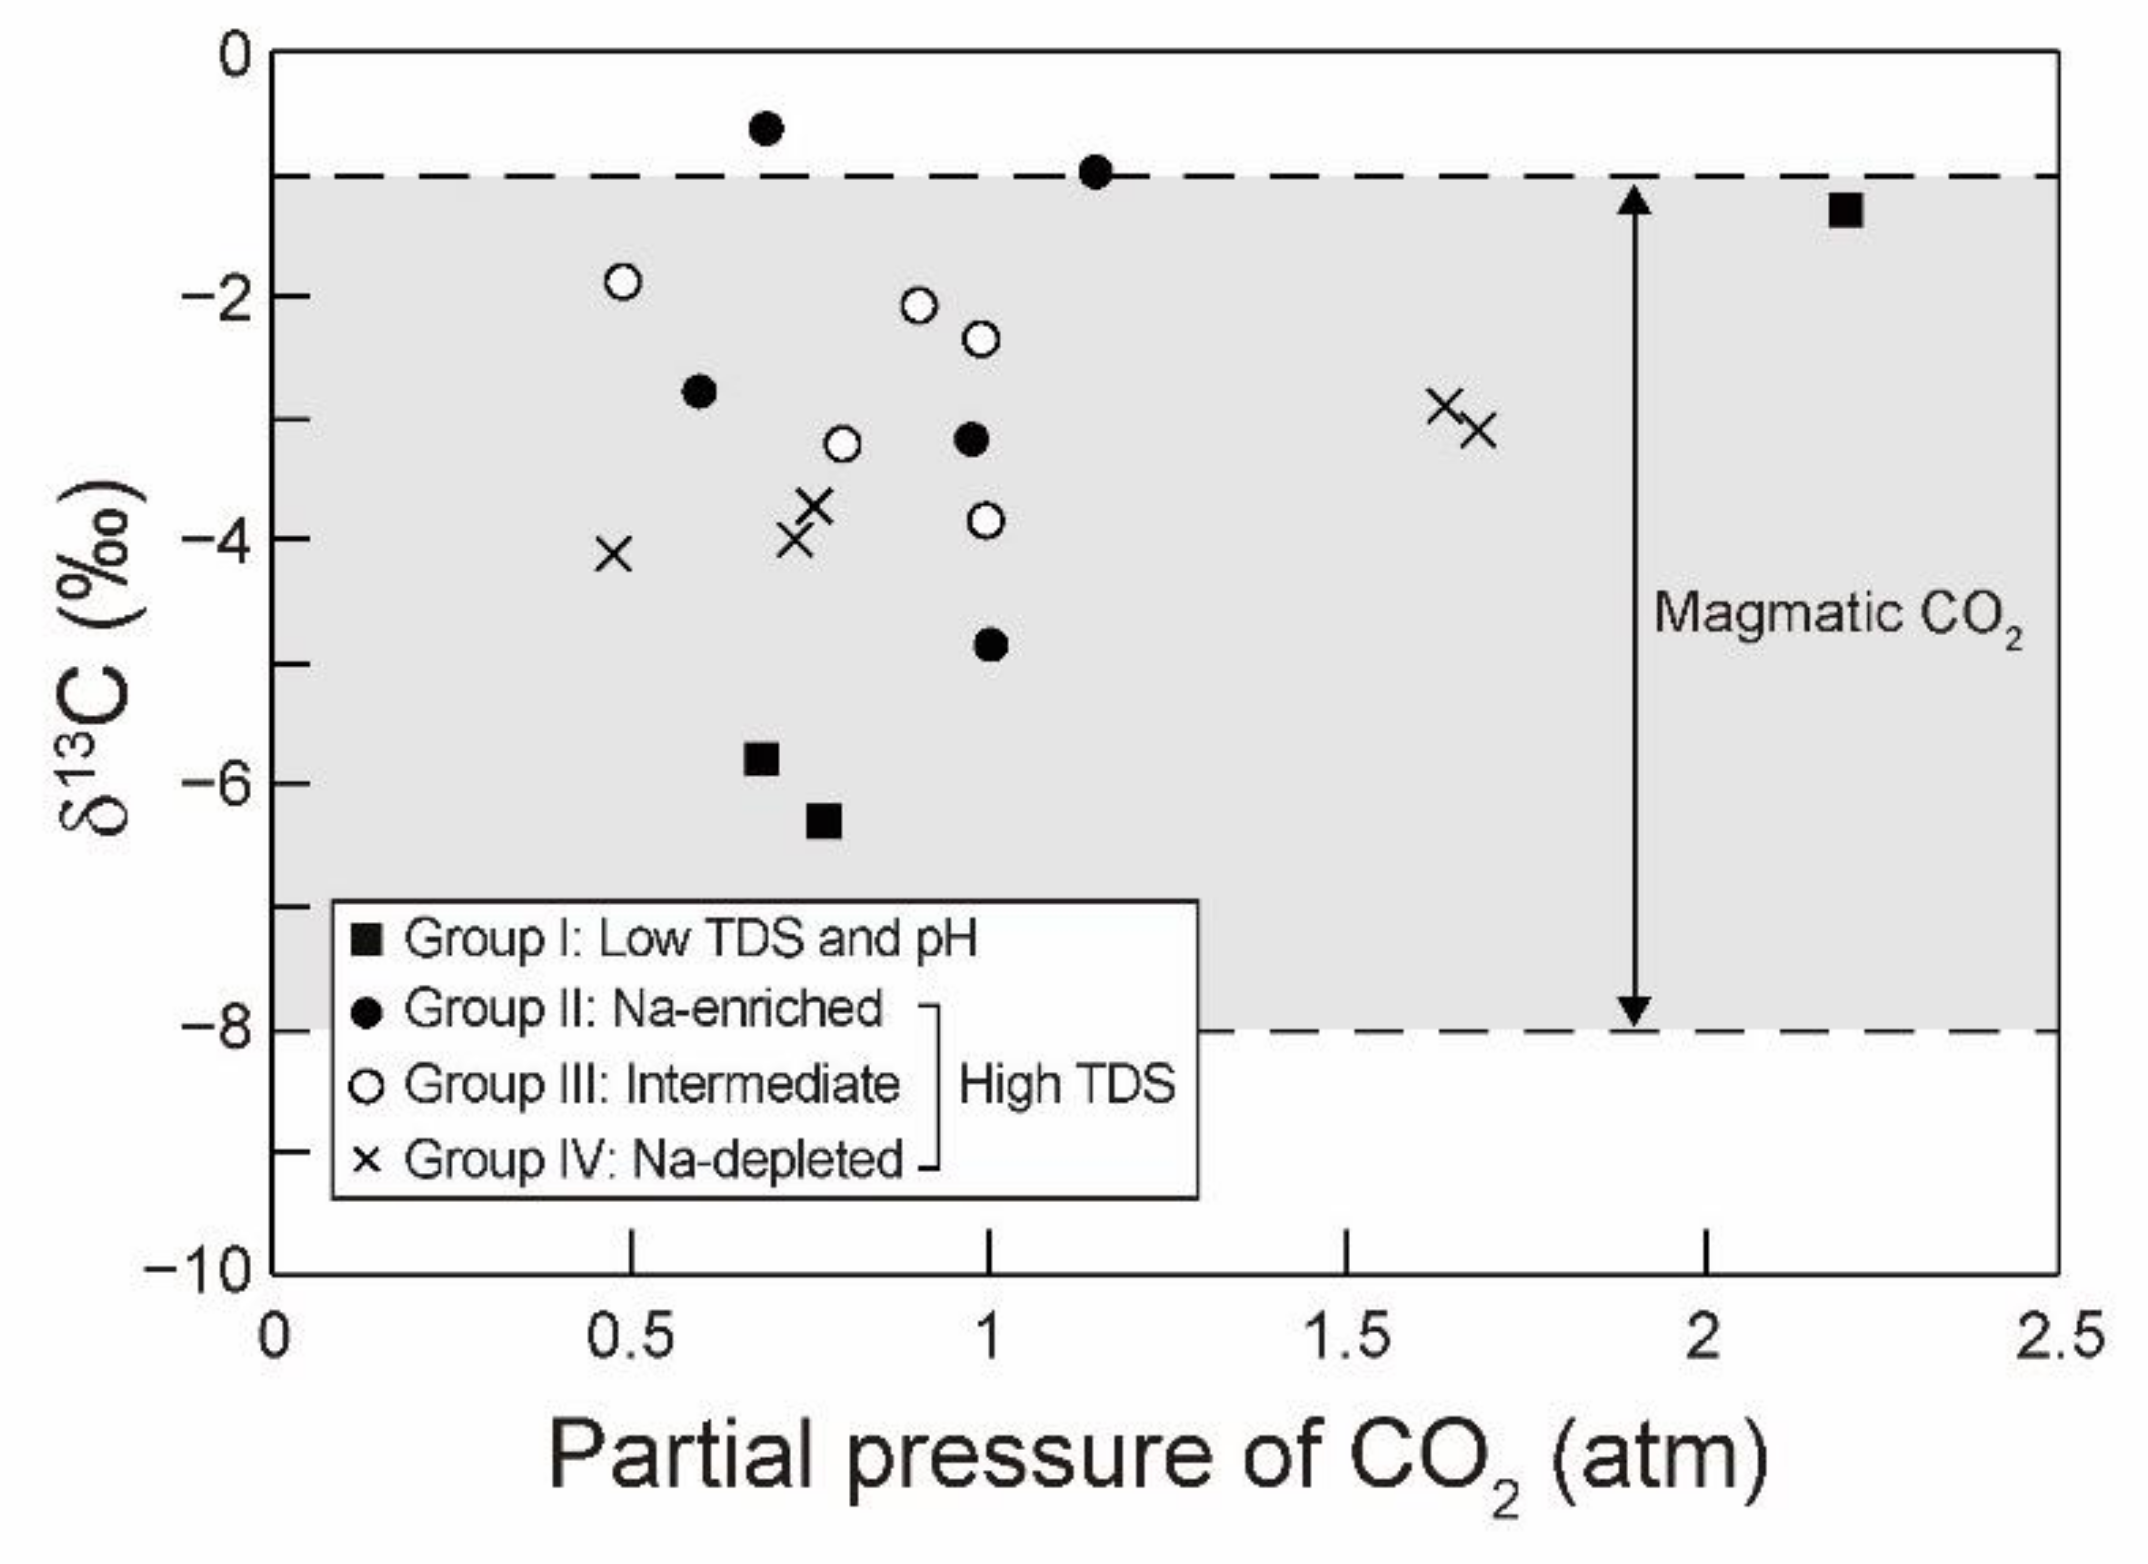
However, the PCO2 and the carbon stable isotope ratios of DIC were not different regardless of groups (Figure 5). The PCO2 was in the range of 0.47 to 2.19 atm (average PCO2 = 0.97 atm), which is relatively high compared to the general PCO2 in the air (0.0003 atm) and soil (0.003 to 0.01 atm) and similar to PCO2 (0.32 to 2.83 atm) reported in the CO2-rih groundwater in the GSB [41,46]. The carbon stable isotope ratios of DIC were in the range between −6.3 and −0.6‰ (average δ13C = −3.1‰), which are corresponding to the range of magmatic sources (−8 to −1‰; [48,50,51]).
4.2. Geophysical Survey
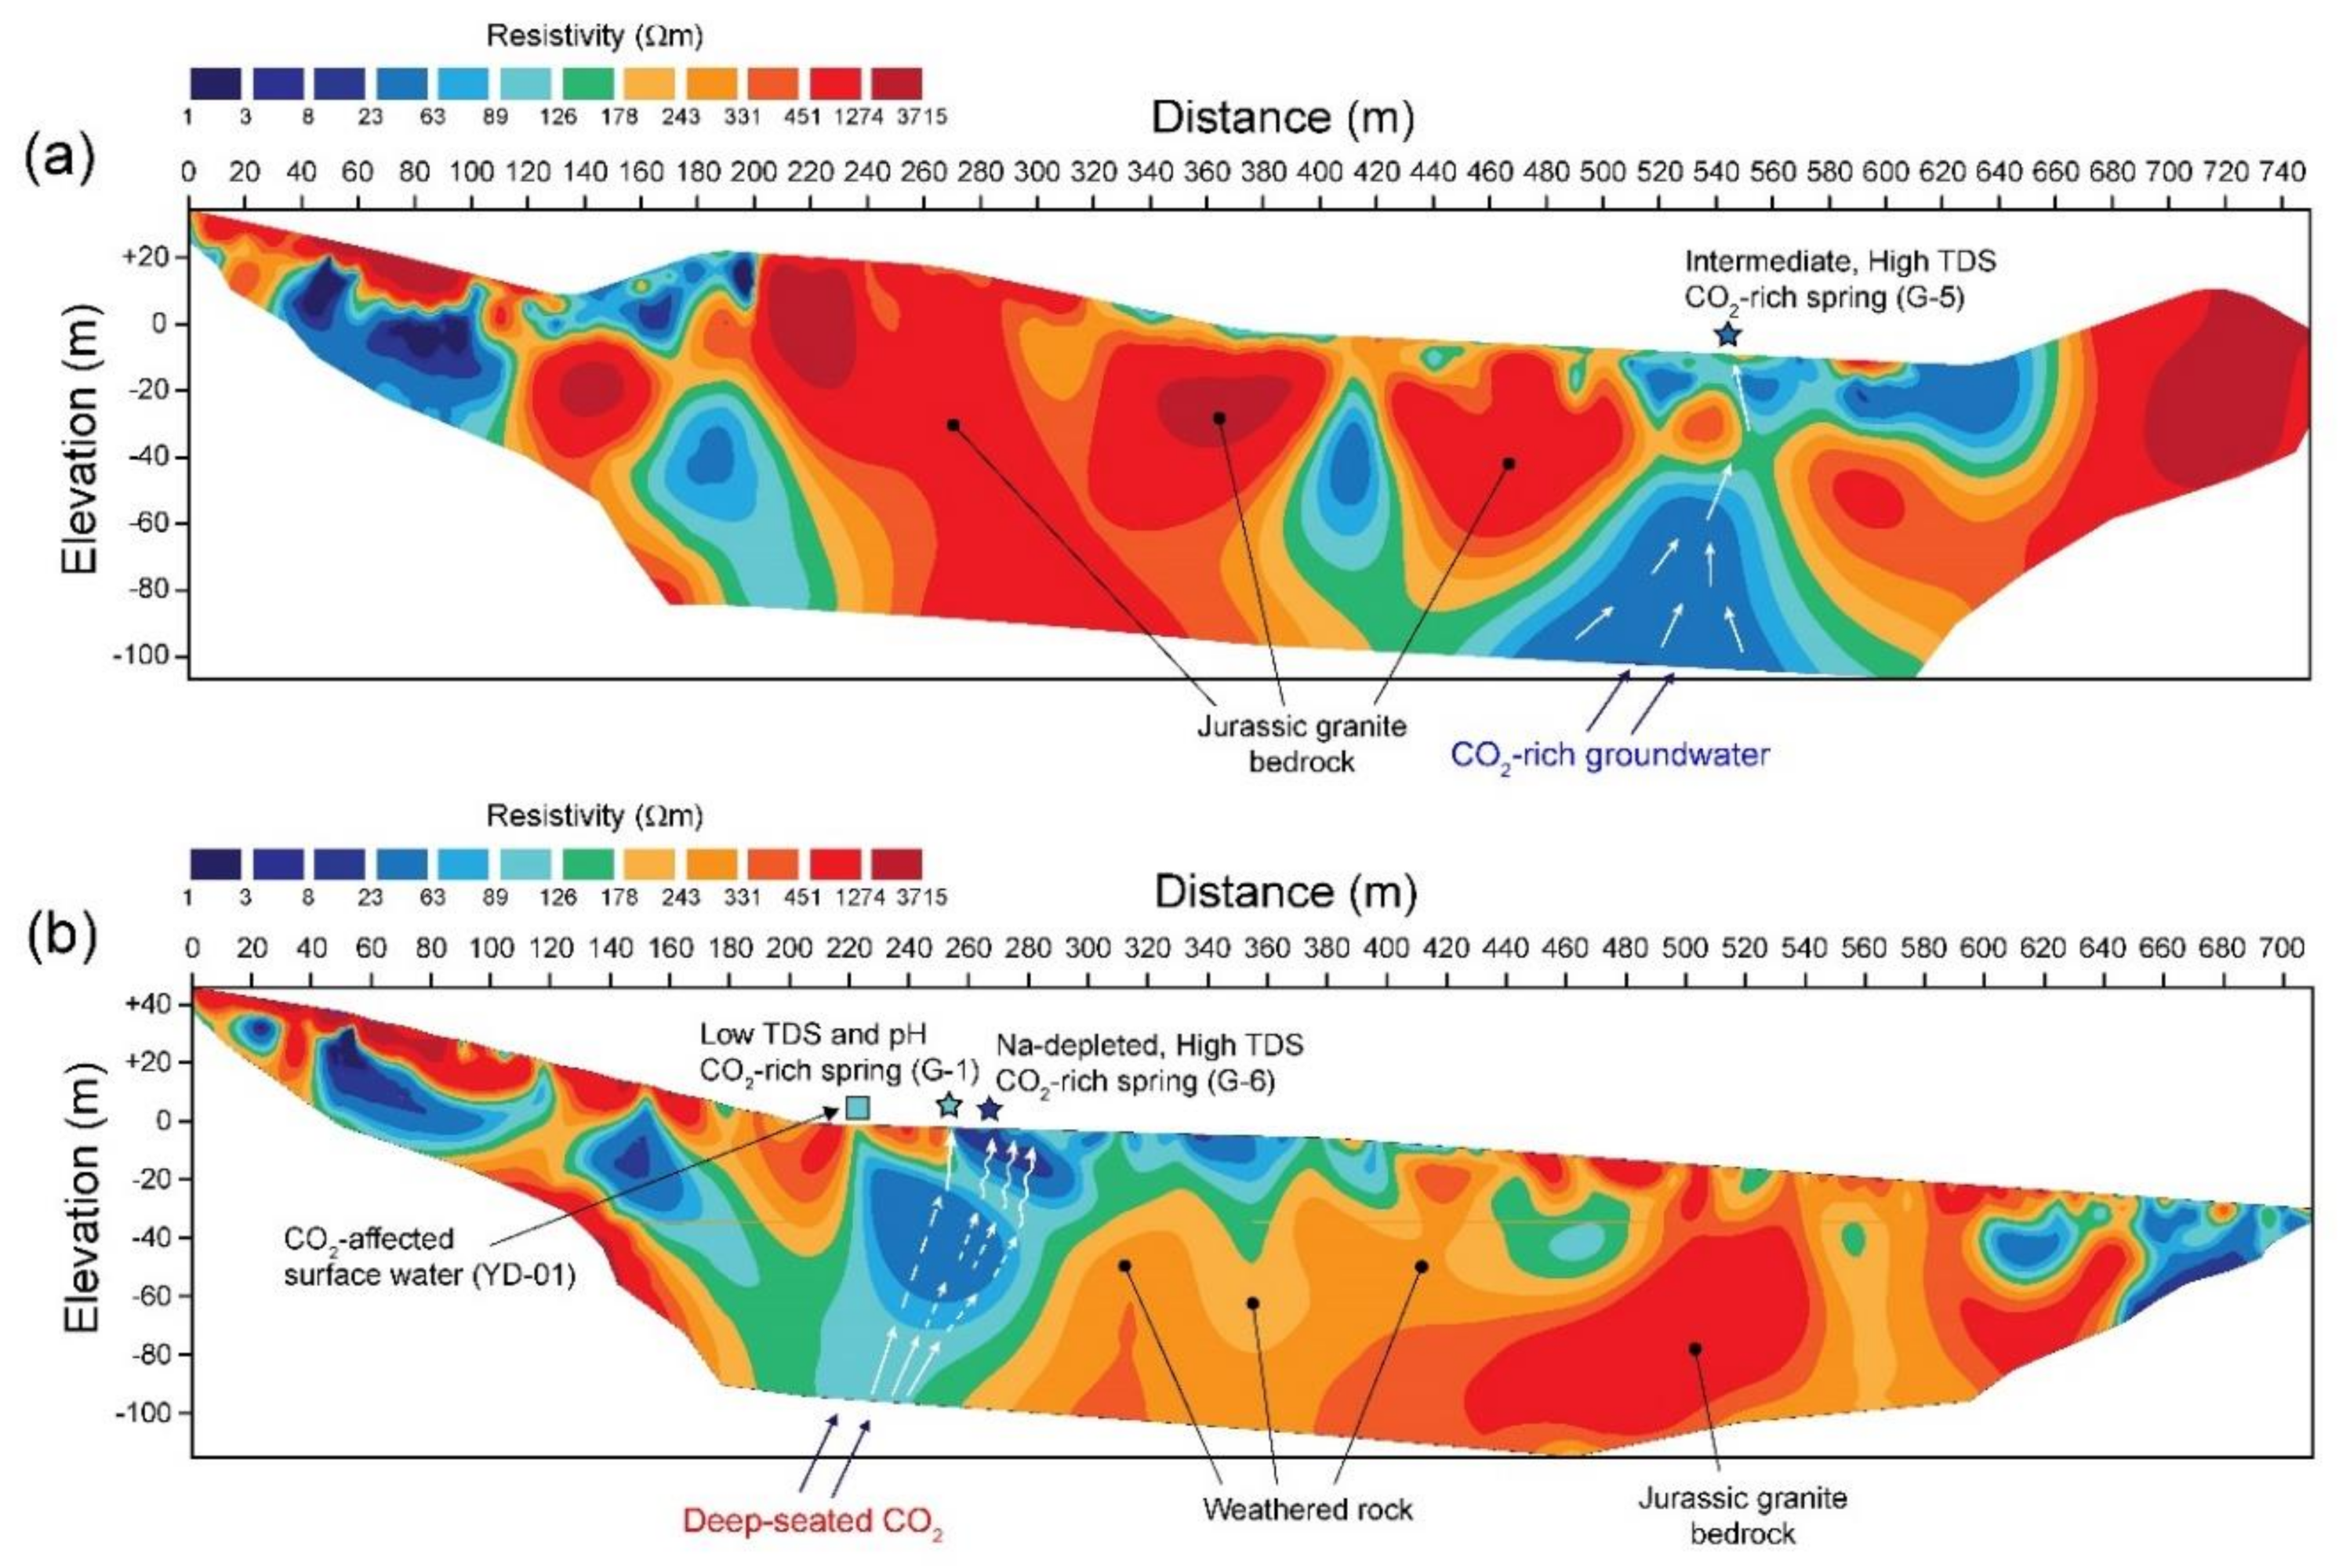
The ERT results show a wide range of resistivity values from 1 to ca. 3700 Ω·m (Figure 6). Along the ERT-1, a low resistivity zone of <63 Ω·m was located from surface to 100 m depth below the spring G-5 (Figure 6a). The low resistivity zone of 23–63 Ω·m was separated by a relatively high resistivity zone (>126 Ω·m) around 30 m depth. Low resistivity zones were also seen at a distance of 40 to 100 m and 120 to 200 m on the left end side, while no CO2-rich spring was found. Excluding these low resistivity zones, the high resistivity zones of 451 to 3715 Ω·m were distributed in the subsurface along the ERT-1.
On the other hand, a low resistivity zone of 23–63 Ω·m was observed from 20 to 60 m depth below the springs G-1 and G-6 along the ERT-2 (Figure 6b). In addition, a lower resistivity zone of <23 Ω·m was observed down to 20 m depth from the surface below the springs. Low resistivity zones of <63 Ω·m were also found between the distance of 40 and 120 m and between 130 and 170 m, but no CO2-rich spring has been reported around those regions. Instead, a CO2-rich surface water sample (YD-01 in Figure 6b) was reported by Kang et al. [52] just above the low resistivity zone at 220 m distance and approximately 40 m left of the G1. To the right of the low resistivity zone below the springs G-1 and G-6, there was a general trend of gradual increase in resistivity with depth without any noticeable low resistivity zones.
It should be noted that the springs G-1 (Group I) and G-6 (Group IV) were hydrochemically distinct (Table 1) and thus classified into the different water group (Figure 2) despite the similar location (i.e., about 7 m separation in Figure 1b and Figure 6b), while ERT could not explain the difference (Figure 6b) probably due to low resolution. Besides, EC in G-5 was higher than that in G-6 (Table 1), while the lower resistivity of 8–23 Ω·m was observed below G-6, probably because the electrical resistivity is affected by solid materials (e.g., small particles) as well as fluids [53].
5. Discussion
5.1. Source and Discharge Pathways of CO2
The high PCO2 values suggest the influx of external CO2 (Table 3; Figure 5). The enriched δ13C of DIC (average −3.1‰) indicates that the elevated PCO2 in the springs might be originated from the reaction between groundwater and deep-seated CO2 such as magmatic CO2. The relatively low 14C activities also suggest the deep-seated CO2 sources and little impacts of soil CO2 and carbonates since the CO2-rich springs excluding G-2 are in the granitoids with scarce carbonate minerals and no sources of 14C-free DIC except deep-seated CO2. As for the spring G-2 situated on the sedimentary rock (Figure 1), the main source of CO2 is also estimated to be the deep-seated CO2 based on the geological characteristic that the granite and andesite intruded the sedimentary rocks in G-2 [40]. Similarly, previous studies about the naturally occurring CO2-rich springs in South Korea suggested that the PCO2 in these springs were originated from the dissolution of deep-seated CO2 using noble gases and carbon isotope ratios [40,42,46,52,54]. The gas samples exsolved from CO2-rich springs in Cheongsong and Yeongdeok granitoids showed the higher 3He/4He ratios than the atmospheric and crustal-derived gases, indicating deep-seated sources such as mantle [42,46]. When considering the 3He/4He and 4He/20Ne ratios altogether, the gas samples obtained from CO2-rich springs were placed in the mantle origin or in the mixed region of the mantle origin and the atmospheric origin [42,46]. We acknowledge that the δ13C of DIC could be affected by carbonates given the sedimentary rocks in this region (Figure 1), while calcite may precipitate during degassing, affecting the δ13C of DIC in water [51], which needs to be further studied to understand carbon systems.
Faults seem to be related with a discharge pathway of deep-seated CO2 since all CO2-rich springs occur within 2 km from the NS-trending strike-slip faults (Figure 1b) and the low resistivity zones were vertically observed below the CO2-rich springs (Figure 6). We can estimate the low resistivity zones of <126 Ω·m to be aquifers, with considering the surface geology and features detected from aerial photographs and field works and the locations of the CO2-rich springs, although the absolute resistivity values corresponding to the properties of the geologic materials are unknown in the study area. Besides, the relatively low resistivity zones of <63 Ω·m can be considered to be ascending pathways of high-TDS CO2-rich water because electrical resistivity decreases when CO2 sources enhance the water-rock interactions and increase EC [32,53,55], although electrical resistivity may increase when a significant amount of CO2 gas invades into the saturated sediments of an aquifer because the CO2 gas dries out the sediments [53,55]. Previous studies also suggested that the deep-seated CO2 migrates to the shallow subsurface along the faults nearby the CO2-rich springs in the GSB [27,41].
5.2. Hydrochemical Evolutionary Processes
Different hydrochemistry indicates the different hydrochemical evolution of CO2-rich springs from the reservoir affected by CO2 to each spring. Note that the reservoir is not identified in this study, which remains future work.
5.2.1. Group I and II
Group I seems to represent a relatively fast rising through open fractures, while Group II seems to represent slow rising along rock discontinuities and extensive CO2-water-rock interactions over a long residence time as in Figure 7 based on the following results: First, the δD and δ18O values of Group I were the heaviest, whereas those of Group II were the lowest (Figure 4a), which suggests the shortest and longest recharge pathway, respectively. The previous studies of CO2-rich springs in South Korea showed that the lighter isotope ratios of CO2-rich water indicate the higher recharge altitudes and longer residence times [24,27,56,57,58]. A study using groundwater samples from various depths in the GSB also revealed that groundwater with a lighter water isotope has a relatively longer residence time and more water-rock interactions [59]. Second, Group II contained high pH, TDS, and contents of Na, K, F, and Li, which are well-known indicators of water-rock interactions in silicate bedrock [59,60], while Group I showed low pH and TDS indicating the impact of CO2 sources but little water-rock interactions. Third, 14C was not detected in Group II, while Group I showed higher 14C contents than the other groups, implying the mixing with relatively young groundwater unlike the other groups. In addition, NO3-, which is the indicator of anthropogenic activity, was high in Group I, which suggests the effect of both recently recharged groundwater and fast rising CO2-rich fluid in Group I. Fourth, the relatively narrow and vertical distribution of low resistivity zones below the CO2-rich springs G-1 and G-6 suggested a separate pathway for G-1 similar to for YD-01 (Figure 6b) since the G-1 and G-6 showed the different hydrochemistry (Table 1) despite the similar location (i.e., about 7 m separation in Figure 6b). According to Kang et al. [52], YD-01 was not surface water but CO2-rich groundwater discharging to the surface and had similar hydrochemical and isotopic characteristics to G-1. It appears that the high-EC CO2-rich groundwater rising from the depth of 60 m is divided into two (i.e., YD-01 and G-1) by the high resistivity zone at 220–250 m distance.
Highly connected open fractures seem to cause a fast movement of deep-seated CO2 at G-1 and YD-01, shortening the residence time and making little water-rock interaction. A hydrochemical evolving process can be suggested for Group I as: CO2 ascends to a shallow aquifer along a conduit (i.e., NS-trending fault and fracture in this study), is dissolved in groundwater, lowering pH and increasing PCO2, while the water-rock interaction is less advanced, causing low pH and EC. There have been several studies that reported CO2-rich springs with low pH and TDS as Group I in similar geologic conditions [23,57,58,61], which showed that the low pH and TDS in CO2-rich springs resulted from the continuous inflow of deep-seated CO2 to shallow aquifers, causing high PCO2 (average 0.8 atm) and heavy carbon isotope ratios of DIC (average −7.1‰), but short residence times (<35 years) based on the tritium data.
The highest concentration of aluminum (Al) exceeding the guideline for drinking-water quality of the World Health Organization (WHO) [47] in Group I suggests the aluminum can be risky at the early stage of CO2 leakage to groundwater, probably due to its high mobility at low pH [62]. Aluminum is immobilized in the pH range of about 6 to 8, while mobilized as cations and anions at pH below and above the range, respectively. The pH of Group I was as low as 5.14 on average, and thus the Al might exist in the form of Al(OH)2+, increasing the Al concentration, whereas the pH of the other groups was in the range of 5.96 to 6.48, in which Al is precipitated and immobilized.
Meanwhile the evolutionary process for Group II can be suggested as in Figure 7: groundwater acidified by CO2 travels along less connected fracture networks and undergoes a water-rock interaction over a long residence time. The Fe, Mn, and As concentrations in Group II exceeded the WHO guidelines. Group II showed highest As as well as Li (Table 2). Arsenic is a representative chalcophile element [63,64] and known to have good affinity with sulfur. It can be considered that arsenic contained in sulfide minerals was eluted during extensive CO2-water-rock interactions given high sulfate concentrations in Group II (Table 1; Figure 3). Besides, Group II occurs at different geology from the other groups (Figure 1), which might affect the high As concentrations.
5.2.2. Group III and IV
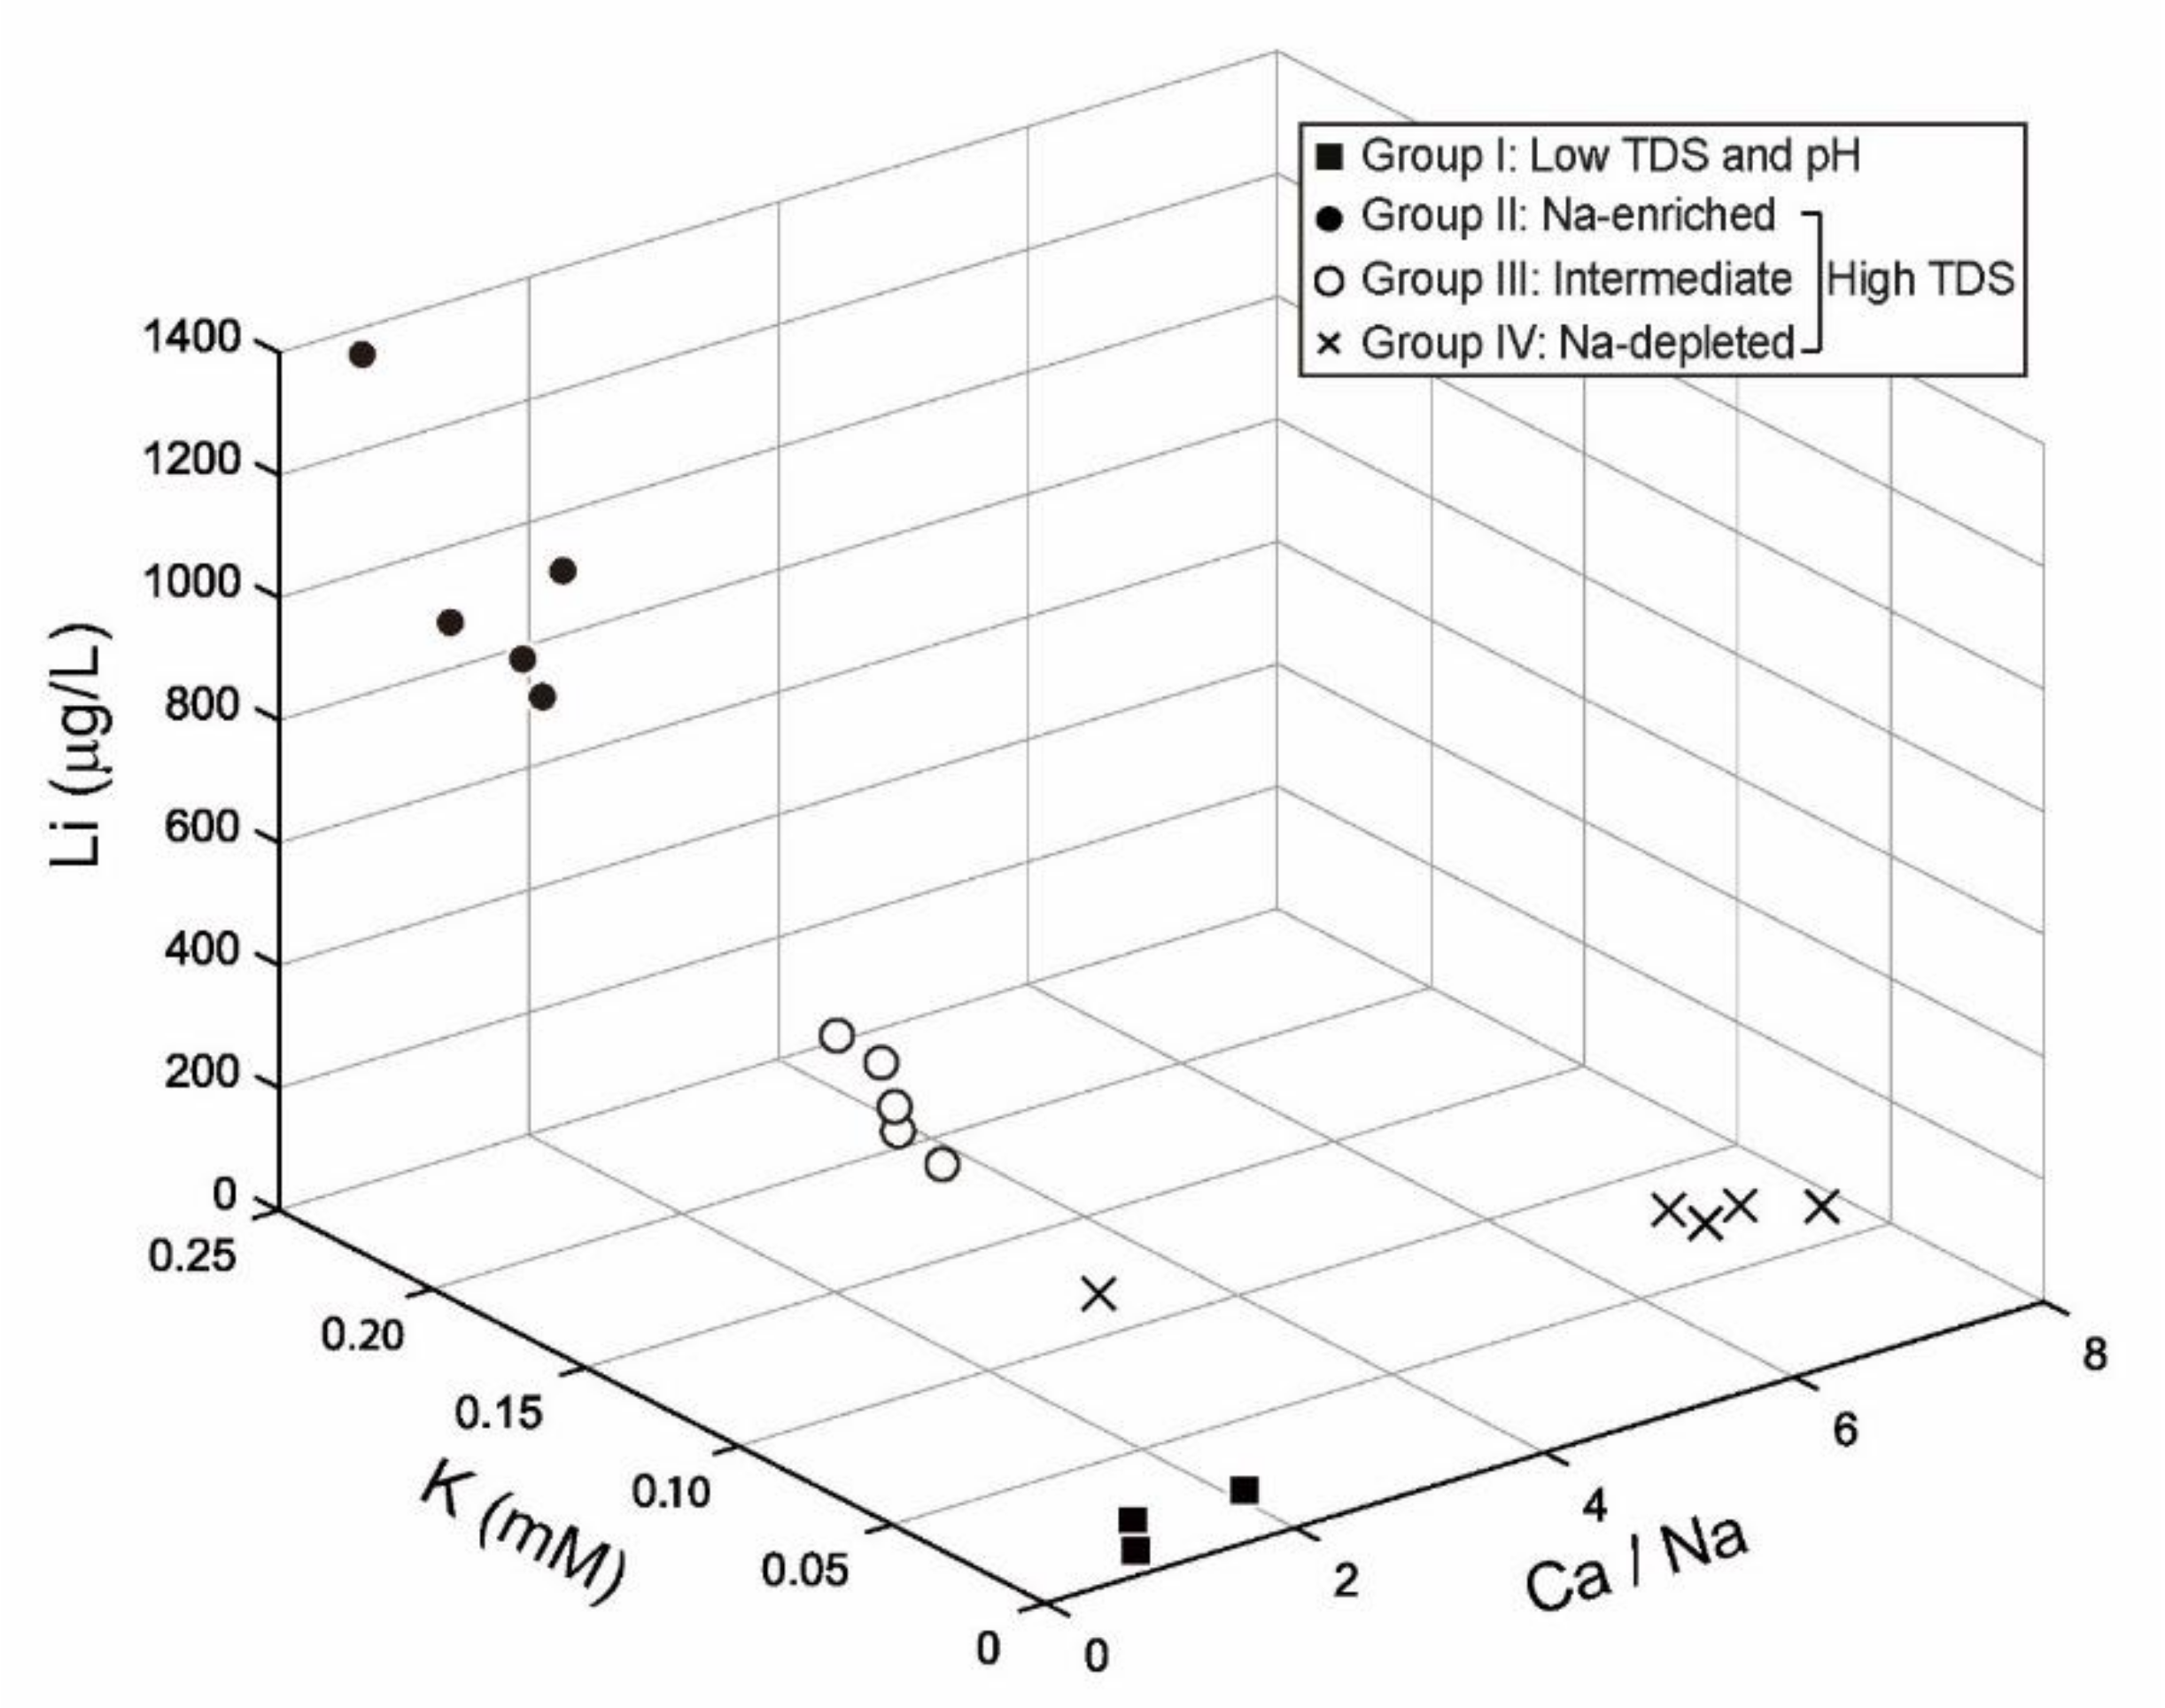
Group III and IV showed the similar δD and δ18O between Group I and II (Figure 4a), implying the similar recharge altitudes and had similar hydrochemical composition to Group II with high TDS (Figure 2). 14C concentrations were not detected except a sample in Group III (Figure 4b). Thus, Group III and IV also seem to have a longer residence time in the subsurface than Group I (Figure 7). Similarly, Kang et al. [52] suggested long residence times of G-6 (Group IV) by slow upward movement of CO2-rich groundwater through narrow or less-connected fractures unlike G-1 (Group I). However, there were different hydrochemical properties between Group III and IV (Figure 3; Table 1 and Table 2). In particular, Group IV had lower Na and K concentrations than Group III, while higher concentrations of Ca, Sr, Zn, Ba, Fe, Mn, U, and thus Ca/Na (Figure 8), although the levels of Fe, Mn, and U exceeded the WHO guidelines in both groups (Table 2).
The difference in hydrochemistry between the two groups from the same bedrock geology (Yeongdeok granitoid) is presumed to be due to different degrees of water-silicate rock interaction. In particular, the dissolution of plagioclase, which is the major component of the Yeongdeok granite, can account for the hydrochemical difference. At low temperature conditions, the different solubility of albite and anorthite causes the enrichment of Ca in water and thus increases the Ca/Na ratio as the dissolution of plagioclase proceeds [65]. However, the solubility difference between albite and anorthite decreases dramatically with increasing temperature [66]. Thus, the Ca/Na ratio in water tends to decrease at high temperature conditions. For instance, the calculated Ca/Na ratio of a water sample in equilibrium with plagioclase containing 20 wt % of anorthite was estimated to be 700 at 25 °C, while the ratio decreased to ca. 70 and 20 at 50 °C and 75 °C, respectively in [66]. In the field, the Ca/Na ratio can be lower than the estimation due to calcite precipitation at high temperature.
In the study area, the Ca/Na ratio of Group III (average 1.65) was about three times lower than that of Group IV (average 5.12) similar to Group I (average 1.42) (Figure 8), which can be explained by the different reaction temperature based on the different depth of low resistivity zones of <63 Ω·m (Figure 6), with assuming that the low resistivity zones represent the reservoirs of CO2-rich groundwater with relatively high EC since EC of the fluid is inversely proportional to the electrical resistivity [53]. Specifically, the low resistivity zone (<63 Ω·m) widely distributed below 40 m depth in Figure 6a suggests that the spring G-5 (Group III) has a large CO2-rich reservoir extending to a depth of >100 m. Whereas the ERT-2 showed the low resistivity zones of <63 Ω·m down to 60 m depth below G-6 (Group IV). In particular, the low resistivity zone of <23 Ω·m at a depth of 0–20 m distributed at 250–290 m distance along ERT-2 can be considered to be a reservoir for Na-depleted high-TDS CO2-rich water (i.e., Group IV).
Given the average geothermal gradient of the study area of 28.3 °C/km (http://kredc.kier.re.kr) and assuming 100 m difference in the reservoir depth, the difference in reaction temperature between the two groups would be 2.8 °C similar to the difference in measured temperature between Group III and Group IV (3.1 °C) in Table 1. Due to the low reaction temperature in the reservoir for Group IV probably at shallow depths, the Ca/Na ratio increases mainly as a result of dissolution of anorthite, while Li is low since Li is mobilized by the albite dissolution [67]. Subsequently, the significantly high concentrations of divalent metal ions (Sr, Zn, Ba, Fe, and Mn) in Group IV can be explained with their affinity with Ca [63,67]. In addition, it is known that the mobility of U is enhanced when the Ca content is high because the formation of calcium uranyl carbonate complexes (e.g., Ca2UO2(CO3)3) inhibits the sorption of U ions to the mineral surface [68,69,70].
Namely, an evolutionary process for Group IV can be suggested as in Figure 7: groundwater is reacted with CO2 in a relatively shallow and low-temperature aquifer similar for Group I, but slowly moves along less connected fractures unlike for Group I, thus shows high TDS. Group III may have a deep and high-temperature reservoir and move slowly from the reservoir to the discharge point.
5.3. Useful Hydrochemical Parameters
The study results indicate that the rising and dissolution of deep-seated CO2 and subsequent CO2-water-rock interaction in the silicate bedrock can cause various hydrochemical compositions in groundwater depending on the evolutionary process as in Figure 7. Based on the study result, hydrochemical parameters such as pH, TDS, Na, K, Mg, SO4, HCO3, Li and their ratios as Ca/Na were useful indicators to trace the evolving process of groundwater triggered by CO2 leakage (Figure 3 and Figure 8), despite the similar PCO2 and δ13C. δ18O and δD were also useful, reflecting the length of reaction pathways, while 14C addressed the impact of recently recharged groundwater.
Specifically, the significantly lower pH and higher PCO2 than the surrounding groundwater but little change in TDS indicate the early stage of CO2 leakage. When CO2 leaks as in Group I (Figure 7), the pH decreases and PCO2 increases as CO2 dissolves in groundwater, but the reaction time is short, and thus the reaction with surrounding aquifer sediments or rocks does not much proceed. For this reason, the ionic concentrations of groundwater do not increase noticeably. However, Al can be risky due to the low pH. In contrast, the later stage of CO2 leakage can be determined by high TDS, Na, K, and Li as in Group II because of extensive water-rock interactions. In general, the contents of monovalent ions such as Na, K and Li increase as the water-rock interaction proceeds [67]. Besides, the Ca/Na ratio is effective to distinguish the reaction depth between CO2 and groundwater as for Group III and IV.
6. Conclusions
Naturally occurring CO2-rich springs were classified into four groups according to the hydrochemical compositions. Then the evolutionary process of each CO2-rich spring group was assessed based on the combined result of hydrochemical, environmental isotopic, and geophysical studies. Hydrochemical, 14C, and hydrogen and oxygen isotopic results as well as the ERT survey result suggest that Group I (low pH and TDS) is formed by fast ascending of CO2 along faults and/or fractures and experiences the CO2 dissolution into shallow groundwater but little water-rock interactions, whereas Group II (Na-enriched and high TDS) ascends through less-connected fracture networks and experiences extensive CO2-water-rock interactions. According to the same geology and similar 14C concentrations and hydrogen and oxygen isotopic compositions, Group III (Na-intermediate and high TDS) and IV (Na-depleted and high TDS) have similar recharge altitudes, while different reaction temperatures may cause hydrochemical differences, in particular Ca/Na between two groups. Group IV seemed to have a shallower reservoir than Group III based on the higher Ca/Na and shallower depth of low resistivity zone of <63 Ω·m, although we did not identify the reservoir affected by deep-seated CO2 in this study.
The study result suggests that the combined use of pH, TDS, Na, K, Li, and Ca/Na are effective hydrochemical M&V parameters to assess the leakage stages in silicate rocks in GCS projects. A decrease in pH is noticeable at the beginning of the CO2 leakage, and the Ca/Na ratio decreases while the Na and Li content and TDS increase with extensive CO2-water-rock interactions. However, if the groundwater affected by CO2 is shallow, the Ca/Na ratio can be higher than the estimation in silicate rocks, and divalent metal ions are also enriched with increasing Ca. Besides, this study reveals that the groundwater quality can be degraded by Al contamination in the early stage of CO2 leakage, and by high levels of Fe, Mn, and U in the later stage or arsenic depending on the geology.
Author Contributions
The authors have contributed to this work as follows: conceptualization, S.-T.Y. and H.-K.D.; methodology, H.-K.D. and S.-T.Y.; formal analysis, H.-K.D.; investigation, H.-K.D.; writing—original draft preparation, H.-K.D.; writing—review and editing, S.Y. and S.-T.Y.; supervision, S.-T.Y.; project administration, S.-T.Y.; funding acquisition, S.-T.Y. All authors have read and agreed to the published version of the manuscript.
Funding
This research was funded by the Korea Ministry of Environment as “CO2 Storage Environmental Management (K-COSEM) Research Center Research Program (Grant number 2014001810001)” and partly by the Korea CCS 2020 Project for early-stage field campaigns.
Conflicts of Interest
The authors declare no conflict of interest.
References
- Metz, B.; Davidson, O.; De Coninck, H.C.; Loos, M.; Meyer, L.A. IPCC, 2005: IPCC Special Report on Carbon Dioxide Capture and Storage; Working Group III of the Intergovernmental Panel on Climate Change: Cambridge, UK; New York, NY, USA, 2005; p. 442.
- Oelkers, E.H.; Cole, D.R. Carbon dioxide sequestration a solution to a global problem. Elements 2008, 4, 305–310. [Google Scholar] [CrossRef]
- Benson, S.M.; Cole, D.R. CO2 Sequestration in Deep Sedimentary Formations. Elements 2008, 4, 325–331. [Google Scholar] [CrossRef]
- DOEFE (USDOE Office of Fossil Energy (FE) (United States)). Report of the Interagency Task Force on Carbon Capture and Storage; 2010. Available online: https://www.osti.gov/servlets/purl/985209 (accessed on 17 December 2018).
- Cuéllar-Franca, R.M.; Azapagic, A. Carbon capture, storage and utilisation technologies: A critical analysis and comparison of their life cycle environmental impacts. J. CO2 Util. 2015, 9, 82–102. [Google Scholar] [CrossRef]
- Cai, B.; Li, Q.; Liu, G.; Liu, L.; Jin, T.; Shi, H. Environmental concern-based site screening of carbon dioxide geological storage in China. Sci. Rep. 2017, 7, 7598. [Google Scholar] [CrossRef]
- Bachu, S.; Bennion, D.B. Experimental assessment of brine and/or CO2 leakage through well cements at reservoir conditions. Int. J. Greenh. Gas Control 2009, 3, 494–501. [Google Scholar] [CrossRef]
- Cahill, A.G.; Marker, P.; Jakobsen, R. Hydrogeochemical and mineralogical effects of sustained CO2 contamination in a shallow sandy aquifer: A field-scale controlled release experiment. Water Resour. Res. 2014, 50, 1735–1755. [Google Scholar] [CrossRef]
- Spangler, L.H.; Dobeck, L.M.; Repasky, K.S.; Nehrir, A.R.; Humphries, S.D.; Barr, J.L.; Keith, C.J.; Shaw, J.A.; Rouse, J.H.; Cunningham, A.B.; et al. A shallow subsurface controlled release facility in Bozeman, Montana, USA, for testing near surface CO2 detection techniques and transport models. Environ. Earth Sci. 2010, 60, 227–239. [Google Scholar] [CrossRef]
- Ju, Y.; Gilfillan, S.M.V.; Lee, S.-S.; Kaown, D.; Hahm, D.; Lee, S.; Park, I.-W.; Ha, S.-W.; Park, K.; Do, H.-K.; et al. Application of noble gas tracers to identify the retention mechanisms of CO2 migrated from a deep reservoir into shallow groundwater. Int. J. Greenh. Gas Control 2020, 97, 103041. [Google Scholar] [CrossRef]
- Martens, S.; Liebscher, A.; Möller, F.; Henninges, J.; Kempka, T.; Lüth, S.; Norden, B.; Prevedel, B.; Szizybalski, A.; Zimmer, M.; et al. CO2 storage at the Ketzin Pilot site, Germany: Fourth year of injection, monitoring, modelling and verification. Energy Procedia 2013, 37, 6434–6443. [Google Scholar] [CrossRef] [Green Version]
- Emberley, S.; Hutcheon, I.; Shevalier, M.; Durocher, K.; Mayer, B.; Gunter, W.D.; Perkins, E.H. Monitoring of fluid–rock interaction and CO2 storage through produced fluid sampling at the Weyburn CO2-injection enhanced oil recovery site, Saskatchewan, Canada. Appl. Geochem. 2005, 20, 1131–1157. [Google Scholar] [CrossRef]
- Bickle, M.; Kampman, N.; Wigley, M. Natural Analogues. Rev. Mineral. Geochem. 2013, 77, 15–71. [Google Scholar] [CrossRef] [Green Version]
- Keating, E.H.; Fessenden, J.; Kanjorski, N.; Koning, D.J.; Pawar, R. The impact of CO2 on shallow groundwater chemistry: Observations at a natural analog site and implications for carbon sequestration. Environ. Earth Sci. 2010, 60, 521–536. [Google Scholar] [CrossRef] [Green Version]
- Lewicki, J.L.; Birkholzer, J.; Tsang, C.-F. Natural and industrial analogues for leakage of CO2 from storage reservoirs: Identification of features, events, and processes and lessons learned. Environ. Geol. 2007, 52, 457–467. [Google Scholar] [CrossRef] [Green Version]
- Menció, A.; Guasch, H.; Soler, D.; Canelles, A.; Zamorano, M.; Brusi, D. Influence of regional hydrogeological systems at a local scale: Analyzing the coupled effects of hydrochemistry and biological activity in a Fe and CO2 rich spring. Sci. Total Environ. 2016, 569–570, 700–715. [Google Scholar] [CrossRef] [PubMed]
- Lemieux, J.-M. Review: The potential impact of underground geological storage of carbon dioxide in deep saline aquifers on shallow groundwater resources. Hydrogeol. J. 2011, 19, 757–778. [Google Scholar] [CrossRef]
- Ko, K.; Lee, J.; Chung, H. Highly efficient colorimetric CO2 sensors for monitoring CO2 leakage from carbon capture and storage sites. Sci. Total Environ. 2020, 138786. [Google Scholar] [CrossRef]
- Kim, J.; Yu, S.; Yun, S.-T.; Kim, K.-H.; Kim, J.-H.; Shinn, Y.-J.; Chae, G. CO2 leakage detection in the near-surface above natural CO2-rich water aquifer using soil gas monitoring. Int. J. Greenh. Gas Control 2019, 88, 261–271. [Google Scholar] [CrossRef]
- Schroder, I.F.; Zhang, H.; Zhang, C.; Feitz, A.J. The role of soil flux and soil gas monitoring in the characterisation of a CO2 surface leak: A case study in Qinghai, China. Int. J. Greenh. Gas Control 2016, 54, 84–95. [Google Scholar] [CrossRef] [Green Version]
- Schroder, I.F.; Wilson, P.; Feitz, A.F.; Ennis-King, J. Evaluating the performance of soil flux surveys and inversion methods for quantification of CO2 leakage. Energy Procedia 2017, 114, 3679–3694. [Google Scholar] [CrossRef]
- Schütze, C.; Sauer, U.; Beyer, K.; Lamert, H.; Bräuer, K.; Strauch, G.; Flechsig, C.; Kämpf, H.; Dietrich, P. Natural analogues: A potential approach for developing reliable monitoring methods to understand subsurface CO2 migration processes. Environ. Earth Sci. 2012, 67, 411–423. [Google Scholar] [CrossRef]
- Choi, B.-Y. Potential impact of leaking CO2 gas and CO2-rich fluids on shallow groundwater quality in the Chungcheong region (South Korea): A hydrogeochemical approach. Int. J. Greenh. Gas Control 2019, 84, 13–28. [Google Scholar] [CrossRef]
- Do, H.-K.; Yun, S.-T.; Yu, S.; Ryuh, Y.-G.; Choi, H.-S. Evaluation of long-term impacts of CO2 leakage on groundwater quality using hydrochemical data from a natural analogue site in South Korea. Water 2020, 12, 1457. [Google Scholar] [CrossRef]
- Choi, B.Y.; Yun, S.T.; Mayer, B.; Hong, S.Y.; Kim, K.H.; Jo, H.Y. Hydrogeochemical processes in clastic sedimentary rocks, South Korea: A natural analogue study of the role of dedolomitization in geologic carbon storage. Chem. Geol. 2012, 306–307, 103–113. [Google Scholar] [CrossRef]
- Kim, K.-H.; Yun, S.-T.; Yu, S.; Choi, B.-Y.; Kim, M.-J.; Lee, K.-J. Geochemical pattern recognitions of deep thermal groundwater in South Korea using self-organizing map: Identified pathways of geochemical reaction and mixing. J. Hydrol. 2020, 589, 125202. [Google Scholar] [CrossRef]
- Choi, H.; Woo, N.C. Natural analogue monitoring to estimate the hydrochemical change of groundwater by the carbonating process from the introduction of CO2. J. Hydrol. 2018, 562, 318–334. [Google Scholar] [CrossRef]
- Hutcheon, I.; Abercrombie, H.J.; Krouse, H.R. Inorganic origin of carbon dioxide during low temperature thermal recovery of bitumen: Chemical and isotopic evidence. Geochim. Cosmochim. Acta 1990, 54, 165–171. [Google Scholar] [CrossRef]
- Yoshimura, K.; Liu, Z.; Cao, J.; Yuan, D.; Inokura, Y.; Noto, M. Deep source CO2 in natural waters and its role in extensive tufa deposition in the Huanglong Ravines, Sichuan, China. Chem. Geol. 2004, 205, 141–153. [Google Scholar] [CrossRef]
- Weaver, T.R.; Cartwright, I.; Tweed, S.O.; Ahearne, D.; Cooper, M.; Czapnik, K.; Tranter, J. Controls on chemistry during fracture-hosted flow of cold CO2-bearing mineral waters, Daylesford, Victoria, Australia: Implications for resource protection. Appl. Geochem. 2006, 21, 289–304. [Google Scholar] [CrossRef]
- Marques, J.M.; Andrade, M.; Carreira, P.M.; Eggenkamp, H.G.M.; GraçA, R.C.; Aires-Barros, L.; Antunes Da Silva, M. Chemical and isotopic signatures of Na/HCO3/CO2-rich geofluids, North Portugal. Geofluids 2006, 6, 273–287. [Google Scholar] [CrossRef]
- Rodrigo-Naharro, J.; Aracil, E.; del Villar, L.P. Geophysical investigations in the Gañuelas-Mazarrón Tertiary basin (SE Spain): A natural analogue of a geological CO2 storage affected by anthropogenic leakages. J. Appl. Geophys. 2018, 155, 187–198. [Google Scholar] [CrossRef]
- Sauer, U.; Watanabe, N.; Singh, A.; Dietrich, P.; Kolditz, O.; Schütze, C. Joint interpretation of geoelectrical and soil-gas measurements for monitoring CO2 releases at a natural analogue. Surf. Geophys. 2014, 12, 165–178. [Google Scholar] [CrossRef] [Green Version]
- Griffiths, D.H.; Barker, R.D. Two-dimensional resistivity imaging and modelling in areas of complex geology. J. Appl. Geophys. 1993, 29, 211–226. [Google Scholar] [CrossRef]
- Chough, S.K.; Kwon, S.-T.; Ree, J.-H.; Choi, D.K. Tectonic and sedimentary evolution of the Korean peninsula: A review and new view. Earth Sci. Rev. 2000, 52, 175–235. [Google Scholar] [CrossRef]
- Shin, Y.S.; Lee, Y.T.; Lee, Y.J.; Koh, I.S. Petrochemical characteristics of sandstones and mudrocks from the Lower Hayang Group (Cretaceous), Taegu. Korea J. Geol. Soc. Korea 2001, 37, 153–168. [Google Scholar]
- Cheong, C.S.; Kwon, S.T.; Sagong, H. Geochemical and Sr-Nd-Pb isotopic investigation of Triassic granitoids and basement rocks in the northern Gyeongsang Basin, Korea: Implications for the young basement in the East Asian continental margin. Isl. ARC 2002, 11, 25–44. [Google Scholar] [CrossRef]
- Woo, H.; Jang, Y. Petrological characteristics of the Yeongdeok granite. J. Petrol. Soc. Korea 2014, 23, 31–43. [Google Scholar] [CrossRef] [Green Version]
- Sagong, H.; Kwon, S.T.; Ree, J.H. Mesozoic episodic magmatism in South Korea and its tectonic implication. Tectonics 2005, 24, 1–18. [Google Scholar] [CrossRef]
- Jeong, C.H. Genesis of hydrochemistry of CO2-rich springs from Kyungpook Province, Korea. Econ. Environ. Geol. 2002, 35, 121–136. [Google Scholar]
- Jeong, C.H.; Kim, H.J.; Lee, S.Y. Hydrochemistry and genesis of CO2-rich springs from Mesozoic granitoids and their adjacent rocks in South Korea. Geochem. J. 2005, 39, 517–530. [Google Scholar] [CrossRef] [Green Version]
- Jeong, C.-H.; Yoo, S.-W.; Kim, K.-H.; Nagao, K. Hydrochemistry and origin of noble gases and CO2 gas within carbonated mineral waters in the Kyeoungbuk-Kangwon Province, Korea. J. Eng. Geol. 2011, 21, 65–77. [Google Scholar] [CrossRef] [Green Version]
- Jeong, C.H.; Jeong, G.Y. Geochemical water quality and genesis of carbonated Dalki mineral water in the Chungsong area, Kyungpook, Econ. Environ. Geol. 1999, 32, 455–468. [Google Scholar]
- Parkhurst, B.D.L.; Appelo, C.A.J. User’s Guide to PHREEQC (Version 2)—A Computer Program for Speciation, and Inverse Geochemical Calculations. Water Resour. Investig. Rep. 1999, 99, 312. [Google Scholar]
- Yun, J.A.; Kim, K.H. Geochemistry and stable isotopes of carbonated waters in South Korea. J. Korean Soc. Groundw. Environ. 2000, 7, 116–124. [Google Scholar]
- Jeong, C.-H.; Kim, K.-H.; Nagao, K. Hydrogeochemistry and origin of CO2 and noble gases in the Dalki carbonate waters of the Chungsong area. J. Eng. Geol. 2012, 22, 123–134. [Google Scholar] [CrossRef] [Green Version]
- World Health Organization. Guidelines for Drinking-Water Quality, 4th ed.; World Health Organization: Geneva, Switzerland, 2017; ISBN 978-92-4-154995-0. [Google Scholar]
- Clark, I.D.; Fritz, P. Environmental Isotopes in Hydrogeology; CRC Press: Boca Raton, FL, USA, 2013; ISBN 1-4822-4291-5. [Google Scholar]
- Lee, K.-S.; Kim, Y. Determining the seasonality of groundwater recharge using water isotopes: A case study from the upper North Han River basin, Korea. Environ. Geol. 2007, 52, 853–859. [Google Scholar] [CrossRef]
- Deines, P.; Langmuir, D.; Harmon, R.S. Stable carbon isotope ratios and the existence of a gas phase in the evolution of carbonate ground waters. Geochim. Cosmochim. Acta 1974, 38, 1147–1164. [Google Scholar] [CrossRef]
- Hoefs, J. Stable Isotope Geochemistry; Springer: Berlin/Heidelberg, Germany, 2009; Volume 285. [Google Scholar]
- Kang, Y.-J.; Yun, S.-T.; Yu, S.; Do, H.-K.; Chae, G. Quantitative assessment of deep-seated CO2 leakage around CO2-rich springs with low soil CO2 efflux using end-member mixing analysis and carbon isotopes. J. Environ. Manag. 2020, 276, 111333. [Google Scholar] [CrossRef]
- Sharma, P.V. Environmental and Engineering Geophysics; Cambridge University Press: Cambridge, UK, 1997. [Google Scholar]
- Do, H.-K.; Kim, K.-H.; Yun, S.-T. Hydrochemical and isotopic characteristics of CO2-rich groundwater in the Gyeongsang Sedimentary Basin, South Korea: A natural analogue study on the potential leakage of geologically-stored CO2. Energy Procedia 2017, 114, 3805–3811. [Google Scholar] [CrossRef]
- Arts, R.J.; Baradello, L.; Girard, J.F.; Kirby, G.; Lombardi, S.; Williamson, P.; Zaja, A. Results of geophysical monitoring over a “leaking” natural analogue site in Italy. Energy Procedia 2009, 1, 2269–2276. [Google Scholar] [CrossRef]
- Choi, H.S.; Yun, S.T.; Koh, Y.K.; Mayer, B.; Park, S.S.; Hutcheon, I. Geochemical behavior of rare earth elements during the evolution of CO2-rich groundwater: A study from the Kangwon district, South Korea. Chem. Geol. 2009, 262, 334–343. [Google Scholar] [CrossRef]
- Chae, G.; Yu, S.; Jo, M.; Choi, B.-Y.; Kim, T.; Koh, D.-C.; Yun, Y.-Y.; Yun, S.-T.; Kim, J.-C. Monitoring of CO2-rich waters with low pH and low EC: An analogue study of CO2 leakage into shallow aquifers. Environ. Earth Sci. 2016, 75, 1–15. [Google Scholar] [CrossRef]
- Kim, K.; Jeong, D.H.; Kim, Y.; Koh, Y.; Kim, S.; Park, E. The geochemical evolution of very dilute CO2-rich water in Chungcheong Province, Korea: Processes and pathways. Geofluids 2008, 8, 3–15. [Google Scholar] [CrossRef]
- Kim, K.; Jeong, G.Y. Factors influencing natural occurrence of fluoride-rich groundwaters: A case study in the southeastern part of the Korean Peninsula. Chemosphere 2005, 58, 1399–1408. [Google Scholar] [CrossRef] [PubMed]
- Chae, G.-T.; Yun, S.-T.; Kim, K.; Mayer, B. Hydrogeochemistry of sodium-bicarbonate type bedrock groundwater in the Pocheon spa area, South Korea: Water–rock interaction and hydrologic mixing. J. Hydrol. 2006, 321, 326–343. [Google Scholar] [CrossRef]
- Koh, Y.K.; Choi, B.Y.; Yun, S.T.; Choi, H.S.; Mayer, B.; Ryoo, S.W. Origin and evolution of two contrasting thermal groundwaters (CO2-rich and alkaline) in the Jungwon area, South Korea: Hydrochemical and isotopic evidence. J. Volcanol. Geotherm. Res. 2008, 178, 777–786. [Google Scholar] [CrossRef]
- Faure, G. Principles and Applications of Inorganic Geochemistry: A Comprehensive Textbook for Geology Students; Maxwell Macmillan International: New York, NY, USA, 1991; ISBN 0-02-336441-6. [Google Scholar]
- White, W.M. Geochemistry; John Wiley & Sons: Hoboken, NJ, USA, 2013; ISBN 1-118-48527-0. [Google Scholar]
- Shankar, S.; Shanker, U. Shikha arsenic contamination of groundwater: A review of sources, prevalence, health risks, and strategies for mitigation. Sci. World J. 2014, 2014, 1–18. [Google Scholar] [CrossRef] [PubMed]
- Gascoyne, M.; Kamineni, D. The hydrogeochemistry of fractured plutonic rocks in the Canadian Shield. Appl. Hydrogeol. 1994, 2, 43–49. [Google Scholar] [CrossRef]
- Stober, I.; Bucher, K. Deep groundwater in the crystalline basement of the Black Forest region. Appl. Geochem. 1999, 14, 237–254. [Google Scholar] [CrossRef]
- Aiuppa, A.; Allard, P.; D’Alessandro, W.; Michel, A.; Parello, F.; Treuil, M.; Valenza, M. Mobility and fluxes of major, minor and trace metals during basalt weathering and groundwater transport at Mt. Etna volcano (Sicily). Geochim. Cosmochim. Acta 2000, 64, 1827–1841. [Google Scholar] [CrossRef]
- Bernhard, G.; Geipel, G.; Reich, T.; Brendler, V.; Amayri, S.; Nitsche, H. Uranyl(VI) carbonate complex formation: Validation of the Ca2UO2(CO3)3(aq.) species. Radiochim. Acta 2001, 89, 511–518. [Google Scholar] [CrossRef]
- Dong, W.; Brooks, S.C. Determination of the formation constants of ternary complexes of uranyl and carbonate with alkaline earth metals (Mg2+, Ca2+, Sr2+, and Ba2+) using anion exchange method. Environ. Sci. Technol. 2006, 40, 4689–4695. [Google Scholar] [CrossRef] [PubMed]
- Shin, W.; Oh, J.; Choung, S.; Cho, B.-W.; Lee, K.-S.; Yun, U.; Woo, N.-C.; Kim, H.K. Distribution and potential health risk of groundwater uranium in Korea. Chemosphere 2016, 163, 108–115. [Google Scholar] [CrossRef] [PubMed]
Figure 1.
Study area at the southeastern part of South Korea. (a) Geological map with the locations of CO2-rich springs (G-1 to G-8; n = 8). The four groups were classified by pH, total dissolved solids, and Na contents in Figure 2. (b,c) show the geophysical survey lines around the G-5 (ERT-1) and the G-1 and G-6 (ERT-2), respectively. In (a), the black lines indicate faults, while in (b,c) the white dashed lines are faults.

Figure 2.
Durov diagram showing the hydrochemical compositions of water samples (n = 18) from the CO2-rich springs (n = 8). They are clustered into four groups by pH, total dissolved solids (TDS), and Na contents, while all show the Ca-HCO3 type.
Figure 2.
Durov diagram showing the hydrochemical compositions of water samples (n = 18) from the CO2-rich springs (n = 8). They are clustered into four groups by pH, total dissolved solids (TDS), and Na contents, while all show the Ca-HCO3 type.

Figure 3.
Plots of total dissolved solids (TDS) versus major compositions for water samples: (a) Ca, (b) Mg, (c) Na, (d) K, (e) SO4, and (f) HCO3.
Figure 3.
Plots of total dissolved solids (TDS) versus major compositions for water samples: (a) Ca, (b) Mg, (c) Na, (d) K, (e) SO4, and (f) HCO3.

Figure 4.
Isotopic compositions. (a) Plot of δ18O versus δD values (n = 18). The solid and dashed line are the global meteoric water line (δD = 8 × δ18O + 10 [48]) and the local meteoric water line (δD = 8.06 × δ18O + 12.87 [49]), respectively. (b) Plot of 14C contents versus δ18O (n = 9).

Figure 5.
Partial pressure of CO2 versus stable carbon isotopic composition of dissolved inorganic carbon (δ13C) in water from the CO2-rich springs.
Figure 5.
Partial pressure of CO2 versus stable carbon isotopic composition of dissolved inorganic carbon (δ13C) in water from the CO2-rich springs.

Figure 6.
The results of electrical resistivity tomography along the survey lines: (a) ERT-1 and (b) ERT-2 (see Figure 1 for location). In (b), G-1 and G-6 are separate by approximately 7 m; the water running above ground at YD-01 is the seepage water affected by the deep-seated CO2 [52].

Figure 7.
Evolutionary processes suggested for each group.

Figure 8.
Useful hydrochemical parameters: Li, K, and Ca/Na.


Table 1.
Physicochemical data of water samples from the CO2-rich springs (n = 8) in the northern part of the GSB. The CO2-rich springs are grouped based on pH, TDS, and Na contents in Figure 2. Group I: dilute and acidic CO2-rich water; Group II: “Na-enriched” Ca-HCO3 type water; Group III: “intermediate” Ca-HCO3 type water; Group IV: “Na-depleted” Ca-HCO3 type water.
| Group | Sample ID | Sampling Date | Temp. (°C) | pH | Eh (mV) | EC (µS/cm) | DO (mg/L) | PCO2 * (atm) | TDS (mg/L) | Concentration (mg/L) | |||||||||
|---|---|---|---|---|---|---|---|---|---|---|---|---|---|---|---|---|---|---|---|
| Ca | Mg | Na | K | SiO2 | F | Cl | NO3 | SO4 | HCO3 | ||||||||||
| I | G-1 | February-2013 | 10.8 | 4.92 | 517.6 | 214 | 2.3 | 2.2 | 328.9 | 40.19 | 6.15 | 19.16 | 0.63 | 63.14 | 0.30 | 9.54 | 1.64 | 4.89 | 182.08 |
| February-2014 | 8.0 | 5.38 | 378.5 | 217 | 3.6 | 0.7 | 280.1 | 47.43 | 2.95 | 13.07 | 0.67 | 38.52 | 0.36 | 8.31 | 1.43 | 4.76 | 161.70 | ||
| March-2015 | 11.4 | 5.13 | 424.9 | 222 | 3.2 | 0.8 | 200.3 | 25.36 | 2.33 | 14.88 | 0.57 | 41.04 | 0.35 | 7.63 | 1.38 | 4.71 | 100.68 | ||
| Average | 10.1 | 5.14 | 440.3 | 217.6 | 3.0 | 1.2 | 269.8 | 37.7 | 3.8 | 15.7 | 0.6 | 47.6 | 0.3 | 8.5 | 1.5 | 4.8 | 148.2 | ||
| II | G-2 | February-2013 | 14.3 | 6.20 | 490.9 | 2100 | 1.0 | 1.1 | 2983.8 | 355.82 | 114.19 | 212.51 | 8.26 | 72.15 | 1.37 | 31.76 | 0.34 | 37.19 | 2144.43 |
| February-2014 | 8.7 | 6.40 | 299.2 | 2725 | 2.2 | 0.7 | 2727.5 | 271.70 | 87.24 | 232.93 | 9.87 | 57.58 | 1.27 | 28.30 | 0.19 | 43.35 | 1989.17 | ||
| March-2015 | - | 6.23 | 296.0 | 2588 | 1.6 | 1.0 | 2632.5 | 249.70 | 106.55 | 219.33 | 8.58 | 47.56 | 0.76 | 25.53 | 0.17 | 46.59 | 1912.95 | ||
| G-3 | February-2014 | 9.5 | 6.44 | 297.1 | 2816 | 1.6 | 0.6 | 2575.9 | 238.25 | 131.65 | 171.46 | 7.60 | 69.19 | 1.46 | 23.75 | 1.64 | 29.20 | 1897.72 | |
| March-2015 | - | 6.21 | 285.5 | 2858 | 0.9 | 1.0 | 2485.2 | 196.83 | 130.16 | 178.17 | 7.25 | 73.16 | 0.41 | 9.15 | 0.96 | 13.14 | 1861.10 | ||
| Average | 10.8 | 6.30 | 333.7 | 2617.4 | 1.4 | 0.9 | 2681.0 | 262.5 | 114.0 | 202.9 | 8.3 | 63.9 | 1.1 | 23.7 | 0.7 | 33.9 | 1961.1 | ||
| III | G-4 | February-2014 | 12.2 | 6.08 | 300.8 | 1979 | 1.2 | 1.0 | 1838.1 | 230.14 | 67.76 | 87.73 | 4.36 | 63.84 | 0.49 | 13.92 | 0.09 | 15.40 | 1348.52 |
| March-2015 | - | 6.16 | 340.4 | 1984 | 0.8 | 0.9 | 2008.5 | 257.27 | 74.07 | 91.06 | 4.01 | 66.50 | 0.01 | 9.31 | 0.03 | 14.02 | 1479.67 | ||
| G-5 | February-2013 | 13.6 | 6.35 | 277.7 | 3240 | 1.2 | 0.8 | 2817.5 | 318.55 | 137.89 | 120.24 | 4.93 | 110.20 | 0.80 | 16.33 | 0.73 | 18.85 | 2085.38 | |
| February-2014 | 11.4 | 6.48 | 262.8 | 3190 | 3.0 | 0.5 | 2295.5 | 297.74 | 87.60 | 91.36 | 5.03 | 80.06 | 1.10 | 16.89 | 0.71 | 18.82 | 1693.41 | ||
| March-2015 | 14.1 | 6.19 | 259.9 | 2980 | 1.8 | 1.0 | 2409.3 | 301.15 | 97.82 | 97.02 | 4.66 | 92.11 | 0.52 | 12.37 | 0.27 | 16.93 | 1769.67 | ||
| Average | 12.8 | 6.25 | 288.3 | 2674.6 | 1.6 | 0.8 | 2273.8 | 281.0 | 93.0 | 97.5 | 4.6 | 82.5 | 0.6 | 13.8 | 0.4 | 16.8 | 1675.3 | ||
| IV | G-6 | February-2013 | 11.6 | 6.03 | 489.0 | 2046 | 1.3 | 1.6 | 2893.9 | 544.48 | 72.28 | 47.62 | 1.71 | 94.37 | 1.14 | 12.83 | 0.05 | 9.36 | 2103.73 |
| February-2014 | 11.0 | 6.24 | 321.4 | 2125 | 2.4 | 0.7 | 2108.3 | 396.64 | 41.39 | 36.18 | 1.76 | 69.16 | 1.33 | 13.71 | 0.37 | 8.88 | 1510.17 | ||
| March-2015 | 12.5 | 5.96 | 258.8 | 2007 | 0.8 | 1.7 | 2458.0 | 460.05 | 41.31 | 36.67 | 1.55 | 71.61 | 0.61 | 9.18 | 0.05 | 8.91 | 1800.01 | ||
| G-7 | February-2014 | 8.2 | 6.08 | 361.7 | 1500 | 2.6 | 0.7 | 1381.1 | 223.73 | 53.12 | 19.84 | 2.47 | 79.45 | 0.23 | 8.96 | 0.50 | 5.31 | 970.17 | |
| G-8 | February-2013 | 5.0 | 6.30 | 349.9 | 908 | 1.1 | 0.5 | 1554.3 | 266.16 | 46.91 | 71.42 | 2.64 | 52.75 | 0.42 | 11.47 | 0.57 | 21.99 | 1057.12 | |
| Average | 9.7 | 6.12 | 356.2 | 1717.2 | 1.6 | 1.1 | 2079.1 | 378.2 | 51.0 | 42.3 | 2.0 | 73.5 | 0.7 | 11.2 | 0.3 | 10.9 | 1488.2 | ||
* Calculated based on the physicochemical data measured for this study using PHREEQC (Parkhrust and Appelo [44]).
Table 2.
Trace element concentrations of water samples from the CO2-rich springs in the northern part of the GSB. The CO2-rich springs are grouped based on pH, TDS and Na contents in Figure 2. Group I: dilute and acidic CO2-rich water; Group II: “Na-enriched” Ca-HCO3 type water; Group III: “intermediate” Ca-HCO3 type water; Group IV: “Na-depleted” Ca-HCO3 type water.
| Group | Sample ID | Sampling Date | Concentration (µg/L) | ||||||||
|---|---|---|---|---|---|---|---|---|---|---|---|
| Fe | Mn | Al | Sr | Li | Zn | As | U | Ba | |||
| I | G-1 | February-2013 | n.d. | 133 | 197.0 | 226 | 9.7 | 16.5 | n.a. | n.a. | 166.0 |
| February-2014 | 12.6 | 51 | 237.2 | 381 | 8.2 | 22.0 | n.a. | n.a. | 174.2 | ||
| March-2015 | 1.8 | 91 | 171.7 | 429 | 0.0 | 14.9 | 0.3 | 1.0 | 189.0 | ||
| Average | 7.2 | 91.7 | 202.0 | 345.3 | 6.0 | 17.8 | 0.3 | 1.0 | 176.4 | ||
| II | G-2 | February-2013 | - | 1367 | 2.7 | 3542 | 945.0 | 17.5 | n.a. | n.a. | 126.0 |
| February-2014 | - | 99 | 32.9 | 4107 | 1356.3 | 30.7 | n.a. | n.a. | 164.9 | ||
| March-2015 | 6842.0 | 1023 | 6.5 | 5236 | 997.0 | 12.1 | 10.4 | 15.4 | 134.1 | ||
| G-3 | February-2014 | - | 464 | 29.3 | 3047 | 1147.3 | 16.9 | n.a. | n.a. | 253.7 | |
| March-2015 | 9581.0 | 869 | 18.0 | 3795 | 955.0 | 7.8 | 55.5 | 18.4 | 235.3 | ||
| Average | 8211.5 | 764.4 | 17.9 | 3945.4 | 1080.1 | 17.0 | 32.9 | 16.9 | 182.8 | ||
| III | G-4 | February-2014 | - | 845 | 23.9 | 4114 | 437.0 | 51.7 | n.a. | n.a. | 326.9 |
| March-2015 | 5390.0 | 1122 | 0.7 | 4290 | 359.0 | 8.9 | 4.5 | 5.0 | 303.9 | ||
| G-5 | February-2013 | - | - | 1.1 | 3496 | 501.0 | 13.4 | n.a. | n.a. | 306.0 | |
| February-2014 | - | - | 73.1 | 2100 | 435.8 | 6.4 | n.a. | n.a. | 294.2 | ||
| March-2015 | 11,260.0 | 924 | 2.5 | 3520 | 353.0 | 13.8 | 4.0 | 14.1 | 426.3 | ||
| Average | 8325.0 | 963.7 | 20.3 | 3504.0 | 417.2 | 18.8 | 4.3 | 9.5 | 331.5 | ||
| IV | G-6 | February-2013 | - | 2106 | 10.8 | 3237 | 146.0 | 45.6 | n.a. | n.a. | 459.0 |
| February-2014 | 22,651.4 | 2082 | 55.5 | 3313 | 131.8 | 57.1 | n.a. | n.a. | 565.9 | ||
| March-2015 | 22,070.0 | 1870 | 6.3 | 3278 | 104.0 | 24.7 | 1.1 | 40.2 | 591.3 | ||
| G-7 | February-2014 | 13,564.0 | 442 | 58.0 | 1650 | 93.2 | 25.9 | n.a. | n.a. | 327.6 | |
| G-8 | Feb-2013 | 7949.0 | 1228 | 0.0 | 12,758 | 193.0 | 69.0 | n.a. | n.a. | 231.0 | |
| Average | 16,558.6 | 1545.6 | 26.1 | 4847.2 | 133.6 | 44.5 | 1.1 | 40.2 | 435.0 | ||
| Surface water in the study area (1) | 24~300 | 1~51 | 1.4~554 | 32~450 | 0.6~49.9 | 0.2~4.2 | 0.6~1.3 | 0.1~1.0 | 5.0~307.0 | ||
| Shallow groundwater in the study area (2) | 19~100 | n.d. | 3.5~9 | 50~94 | 0.6~108 | 2.1~6.3 | 50.1 | n.d. | 19.6~28.0 | ||
| Guidelines for Drinking-Water Quality in Chemical Aspects (WHO) (3) | - | - | - | - | - | - | 10 | 30 | 1300 | ||
| Guidelines for Drinking-Water Quality in Acceptability Aspects (WHO) (4) | 300 | 100 | 100 | - | - | 4000 | - | - | - | ||
Table 3.
Isotopic compositions of water samples from the CO2-rich springs in the northern part of the GSB. The CO2-rich springs are grouped based on pH, TDS, and Na contents in Figure 2. Group I: dilute and acidic CO2-rich water; Group II: “Na-enriched” Ca-HCO3 type water; Group III: “intermediate” Ca-HCO3 type water; Group IV: “Na-depleted” Ca-HCO3 type water.
| Group | Sample ID | δ18O (‰) | δD (‰) | δ13C (‰) | 14C (pMC) | Age (BP) |
|---|---|---|---|---|---|---|
| I | G-1 | −8.8 | −60.8 | −1.3 | 1.2 | 35,720 ± 330 |
| −8.7 | −58.3 | −5.8 | n.a. | n.a. | ||
| −8.9 | −58.6 | −6.3 | 0.6 | 41,190 ± 560 | ||
| II | G-2 | −9.4 | −64.7 | −1.0 | n.a. | n.a. |
| −9.7 | −64.3 | −0.6 | n.a. | n.a. | ||
| −9.4 | −63.1 | −3.2 | 0.0 | >43,500 | ||
| G-3 | −10.2 | −68.6 | −2.8 | n.a. | n.a. | |
| −10.2 | −70.3 | −4.8 | 0.0 | >43,500 | ||
| III | G-4 | −9.1 | −62.0 | −3.8 | n.a. | n.a. |
| −9.1 | −62.6 | −2.1 | 0.0 | >43,500 | ||
| G-5 | −9.2 | −62.5 | −3.2 | 0.7 | 40,010 ± 500 | |
| −9.2 | −59.0 | −1.8 | n.a. | n.a. | ||
| −9.2 | −59.5 | −2.3 | 0.0 | >43,500 | ||
| IV | G-6 | −9.1 | −61.3 | −2.9 | 0.0 | >43,500 |
| −9.0 | −58.7 | −3.7 | n.a. | n.a. | ||
| −9.1 | −59.0 | −3.1 | 0.0 | >43,500 | ||
| G-7 | −9.5 | −61.4 | −4.0 | n.a. | n.a. | |
| G-8 | −9.1 | −62.1 | −4.1 | n.a. | n.a. |
n.a.: not analyzed.
Publisher’s Note: MDPI stays neutral with regard to jurisdictional claims in published maps and institutional affiliations. |
© 2020 by the authors. Licensee MDPI, Basel, Switzerland. This article is an open access article distributed under the terms and conditions of the Creative Commons Attribution (CC BY) license (http://creativecommons.org/licenses/by/4.0/).
Share and Cite
MDPI and ACS Style
Do, H.-K.; Yu, S.; Yun, S.-T. Hydrochemical Parameters to Assess the Evolutionary Process of CO2-Rich Spring Water: A Suggestion for Evaluating CO2 Leakage Stages in Silicate Rocks. Water 2020, 12, 3421. https://doi.org/10.3390/w12123421
AMA Style
Do H-K, Yu S, Yun S-T. Hydrochemical Parameters to Assess the Evolutionary Process of CO2-Rich Spring Water: A Suggestion for Evaluating CO2 Leakage Stages in Silicate Rocks. Water. 2020; 12(12):3421. https://doi.org/10.3390/w12123421
Chicago/Turabian StyleDo, Hyun-Kwon, Soonyoung Yu, and Seong-Taek Yun. 2020. "Hydrochemical Parameters to Assess the Evolutionary Process of CO2-Rich Spring Water: A Suggestion for Evaluating CO2 Leakage Stages in Silicate Rocks" Water 12, no. 12: 3421. https://doi.org/10.3390/w12123421
Note that from the first issue of 2016, this journal uses article numbers instead of page numbers. See further details here.