Comparison of Fish, Macroinvertebrates and Diatom Communities in Response to Environmental Variation in the Wei River Basin, China


1
College of Water Sciences, Beijing Normal University, Beijing 100875, China
2
Beijing Key Laboratory of Urban Hydrological Cycle and Sponge City Technology, Beijing 100875, China
3
Sericultural Research Institute, Chengde Medical University, Chengde 067000, China
4
College of Chemistry and Life Sciences, Chifeng University, Chifeng 024000, China
5
College of Fisheries and Life Science, Dalian Ocean University, Dalian 116023, China
6
School of Resources and Environment, University of Jinan, Jinan 250022, China
*
Author to whom correspondence should be addressed.
Water 2020, 12(12), 3422; https://doi.org/10.3390/w12123422
Submission received: 7 October 2020
/
Revised: 25 November 2020
/
Accepted: 1 December 2020
/
Published: 4 December 2020
Abstract
:Land use changes usually lead to the deterioration of freshwater ecosystems and reduced biodiversity. Aquatic organisms are considered valuable indicators for reflecting the conditions of freshwater ecosystems. Understanding the relationship between organisms and land use type, as well as physiochemical conditions, is beneficial for the management, monitoring and restoration of aquatic ecosystems. In this study, fish, macroinvertebrates, and diatoms were investigated at 60 sampling sites in the Wei River basin from October 2012 to April 2013 to determine the relationships between the environment and aquatic organisms. The richness, abundance, Shannon diversity, evenness, Margalef diversity, and Simpson diversity were selected as biological indices for analyzing the correlation between these communities and environmental variables according to Pearson’s coefficient. Canonical correspondence analysis (CCA) was used to analyze the relationship between the biotic communities and environmental variables. The results showed that three diatom indices were weakly correlated with chemical oxygen demand (COD), qualitative Habitat Evaluation Index (QH), and dissolved oxygen (DO). Four macroinvertebrate indices were associated with total phosphorus (TP) while total nitrogen (TN), and agricultural land (AL) had a significant influence on assemblages, suggesting that macroinvertebrates could respond to nutrient levels in the Wei River basin. All land use types had a strong effect on fish indices except AL, indicating that fish would be better used as indicators of spatial changes in the aquatic ecosystem. In conclusion, fish and macroinvertebrates have the potential for use in routine monitoring programs in the Wei River basin.
1. Introduction
The effects of land use change on aquatic biotic communities have been widely demonstrated by ecologists throughout the world [1,2,3,4] Land use changes have resulted in strong disadvantages to the maintenance of the ecological integrity of river systems [5,6,7]. Urbanization, agriculturalization, industrialization, and commercialization has become more prevalent with the rapid development of society and economy and the rapid growth of the population [8,9,10] Much of the forest, grass, and other natural vegetation cover has been replaced with urban land. This may destroy the equilibrium of the primary ecosystem and alter the biotic community structure.
The demands of human development result in the exploitation of large amounts of natural land through processes such as deforestation. Soil erosion tends to increase with the decrease in forestland, which results in increases in sandy concentrations; nutrients such as nitrogen, phosphorus, and ammonia; heavy metal ions; organic contaminants and toxic pollutants, which flow into rivers via storm runoff [11,12]. Moreover, habitat diversity decreases and fine sediments replace cobblestone sediments, which adversely impact fish spawning and diatom or macroinvertebrate attachment [6]. Meanwhile, sewage from agriculture, industry, and domestic sources discharges into rivers with the increase in agriculturalization and urbanization, also reducing water quality [13]. Another effect of land use change on aquatic organisms is through hydraulic engineering; for example, the construction of dams and reservoirs and the channelization and realignment of rivers to satisfy agricultural irrigation demands, ensuring adequate water for industrial and domestic activities [14]. All of these changes have strong impacts on the original ecological environment.
Aquatic organisms play important roles in freshwater ecosystems and can indicate variations in ecosystem conditions through their richness, abundance, diversity, composition, or other biological indices [15,16,17]. Fish are relatively higher-order organisms and represent an important component of the aquatic ecosystem. Because of their strong mobilities and longer growing periods, fish can reflect the effects of land use change on aquatic organisms at large spatial and temporal scales. Almeida et al. [18] demonstrated that fish biotic integrity indices were positively correlated with forest cover and negatively correlated with agricultural and urban land cover percentages in a large Mediterranean river. Macroinvertebrates are also common in freshwater ecosystems and good indicators of changes in environmental conditions that are favored by many ecological researchers [19]. They are easily sampled and are a very biodiverse group that may inhabit waters contaminated to different extents from clean to highly polluted. Macroinvertebrates are also important for the cycling of organic matter and provide food resources for higher trophic levels. Wang et al. [20] showed that the diversity and community structure of macroinvertebrates exhibited obvious changes when forestland was converted to agricultural land because the proportion of Annelida taxa increased and the number of aquatic insects decreased. Diatoms are primary producers in the aquatic ecosystem and important food sources for higher trophic level organisms. Because diatoms are incapable of movement, they can be more sensitive to water quality changes that are caused by land use changes. Vázquez et al. [4] argued that diatom assemblages respond to micro-watershed conditions and can be used to monitor the effects of land use on streams in tropical regions. Moreover, their results indicated that forest coverage was positively correlated with acidophilus and oligo-eutraphentic diatom species, and coffee coverage was significantly positively correlated with motile species and significantly negatively correlated with pollution-sensitive diatom taxa. Li et al. [21] indicated that the biomass, abundance, richness, average density, and biological diatom index (IBD) of diatoms were higher in forestland than in any other land use. However, most of these studies used signal species to analyze the relationship between land use type and organism community. Different organisms will have different responses to the environment. Understanding the relationship between several organism communities and land use types will be beneficial for decision-making by governments or managers tasked with monitoring or restoring the aquatic ecosystem.
The Wei River basin is located in central China, where the development speed is limited and slower than that in the eastern part of China [22]. However, during the last decade, the local economy has grown very rapidly. Thus, developing methods of balancing social development and ecological security is becoming a crucial challenge for future development plans. Therefore, the objectives of this research were to (1) understand the distribution of land use types in the Wei River basin, (2) determine the relationship between the biological indices and land use types, and (3) determine which organism community would be a better indicator in routine monitoring. We hope that the results of this study will be valuable for urban planners and managers to make better decisions for future developments.
2. Materials and Methods
2.1. Study Area Description
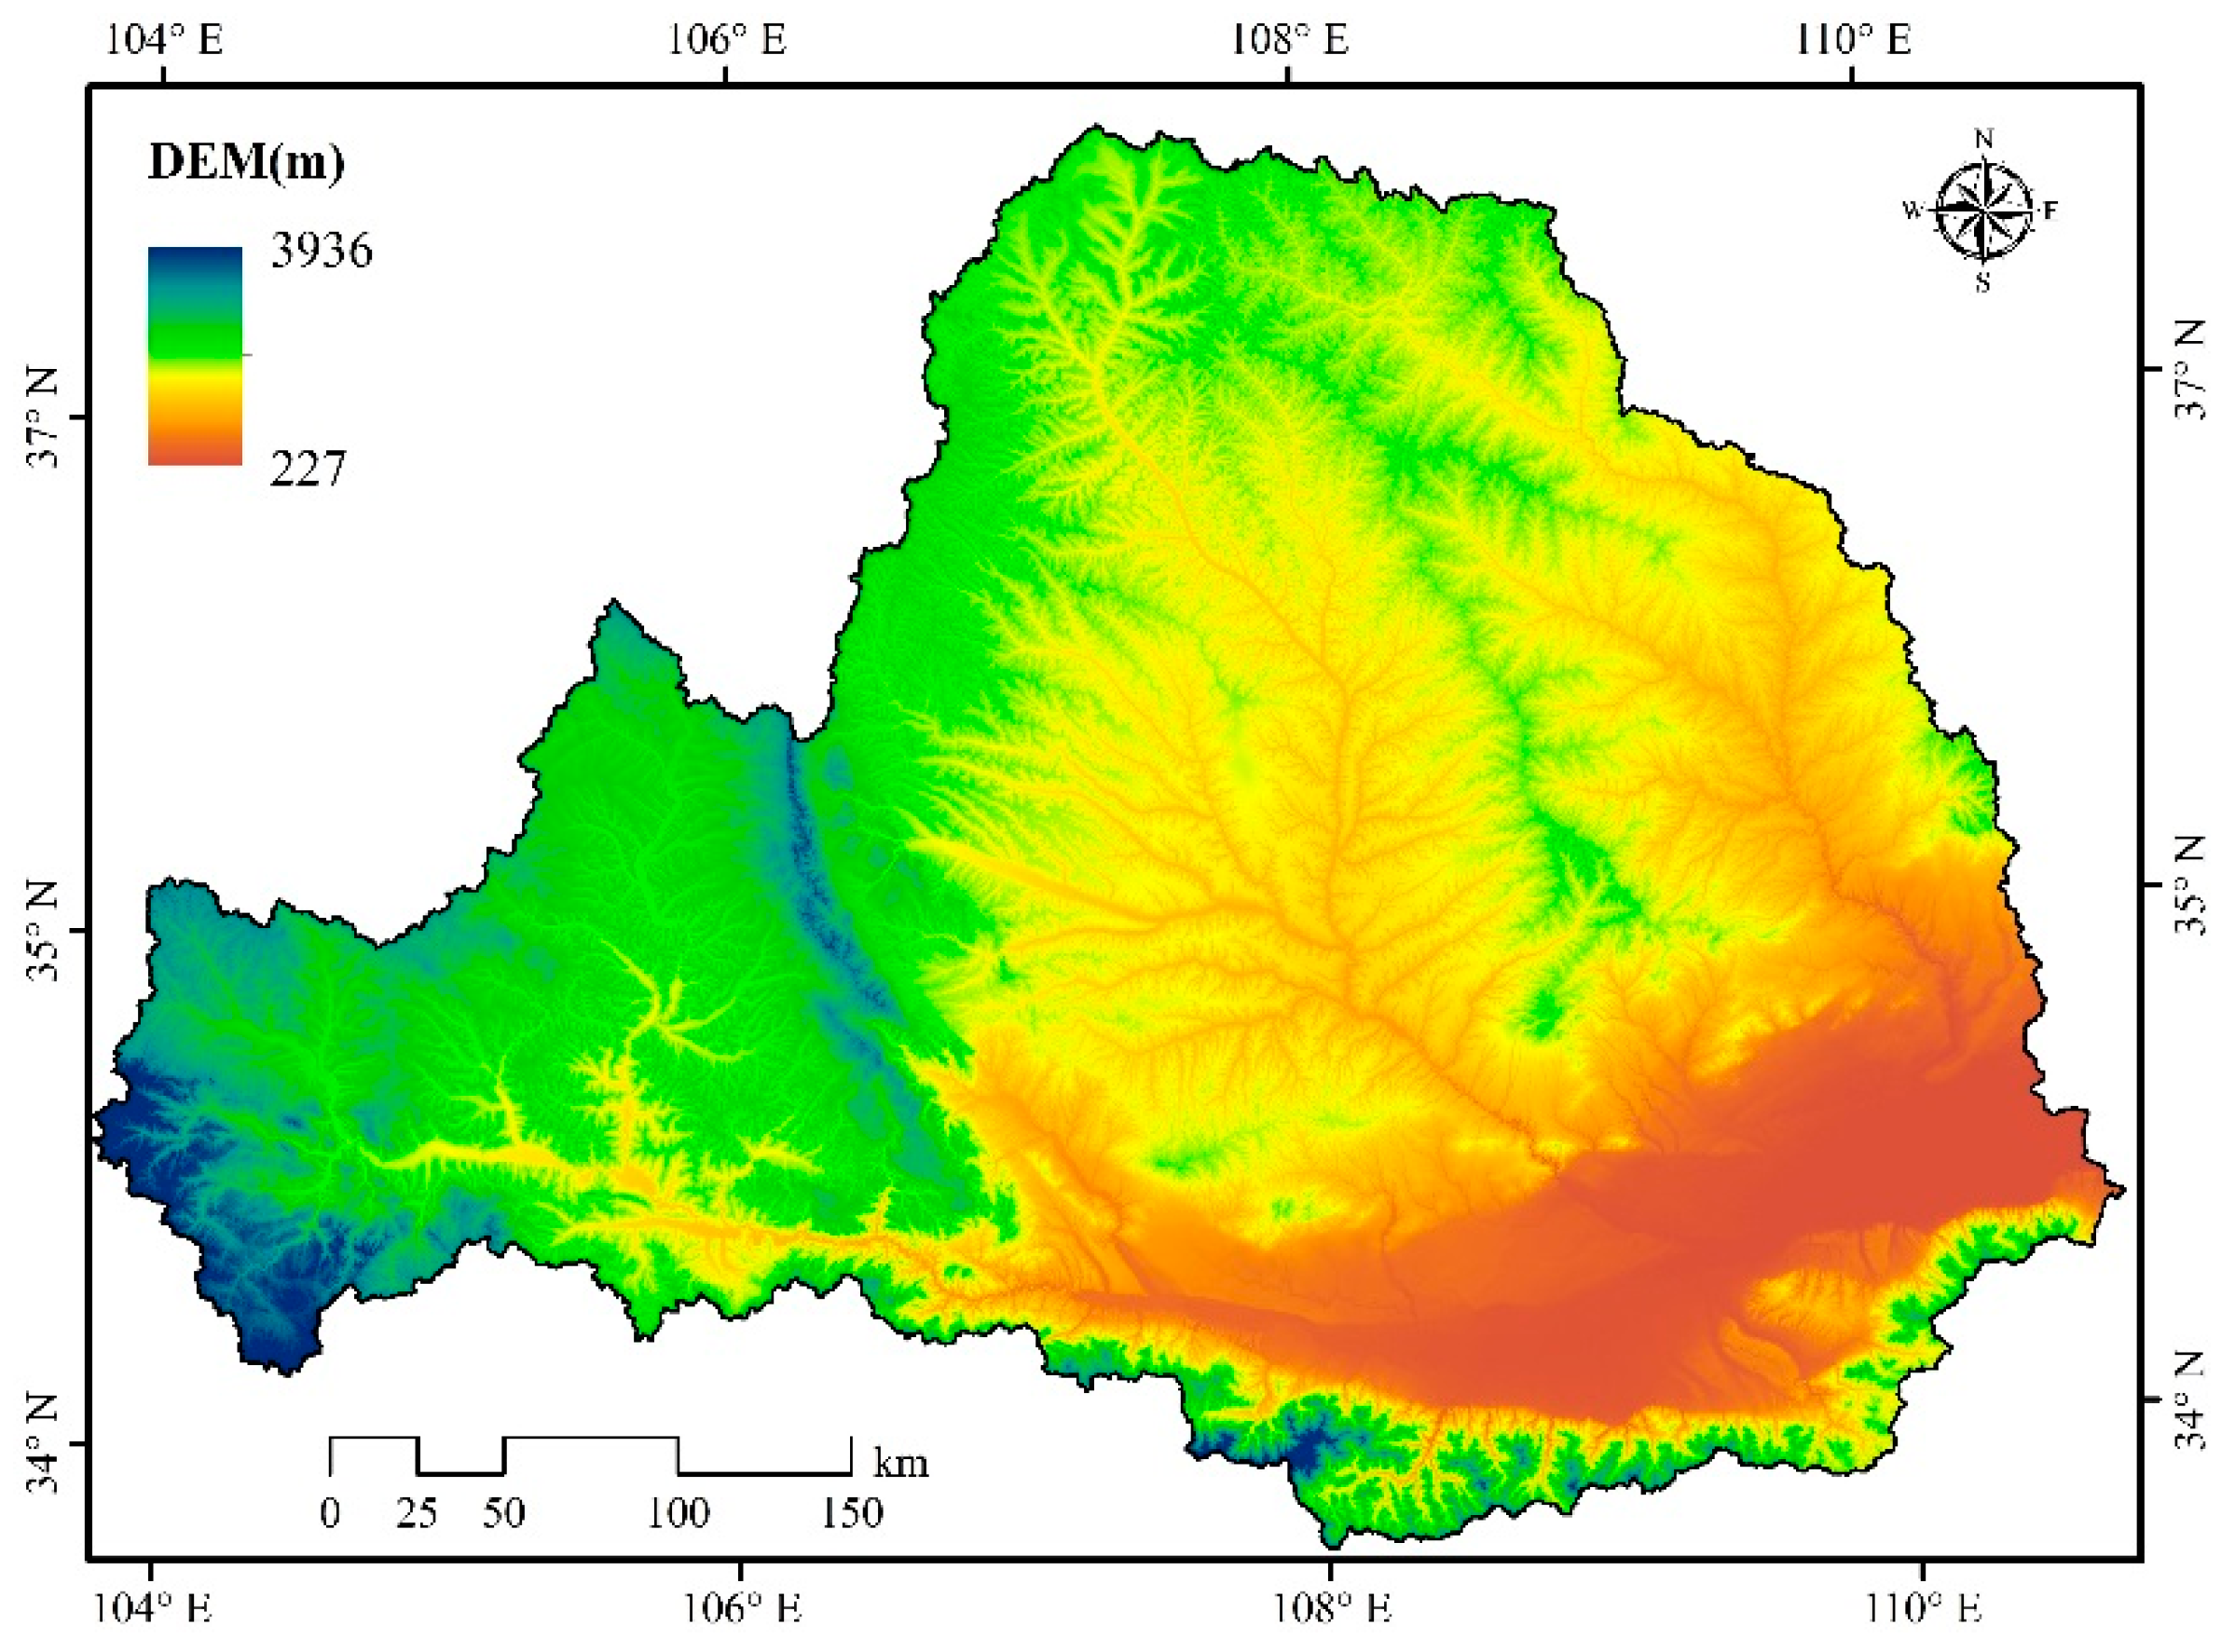
The Wei River is the largest tributary of the Yellow River and is located in central China. Its elevation ranges from 227 to 3936 m (Figure 1). The mainstream length is approximately 818 km with a drainage area of 1.34 × 10⁵ km2. The Jing River is the largest tributary of the Wei River and flows across 455.1 km with a drainage area of 4.54 × 10⁴ km2. The Beiluo River is the second largest tributary of the Wei River and flows across 680.3 km with a drainage area of 2.69 × 10⁴ km2 [23].
The geomorphology of the Wei River basin is complicated. The southern part of the basin is surrounded by the Qinling Mountains; however, the northern and western parts of the basin are on the Loess Plateau, where soil erosion is severe, which results in high turbidity and low transparency. The terrain comprises the Guanzhong Plain in the eastern part of the basin, where anthropogenic activities, such as high urbanization, industrialization, and commercialization, are common [24].
The Wei River basin is located in the arid to humid transition zone, and the climate is continental monsoon. The mean annual air temperature is approximately 3.7–13.9 °C, and the mean annual precipitation is approximately 290–910 mm. The wet season usually occurs from July to October when many rainstorms bring high amounts of precipitation. Runoff during the wet season accounts for 60% of the yearly total. The precipitation minimum usually occurs in January and December, when only 1.6–3.1% of the yearly runoff occurs [25].
2.2. Data Collection
2.2.1. Sampling Sites
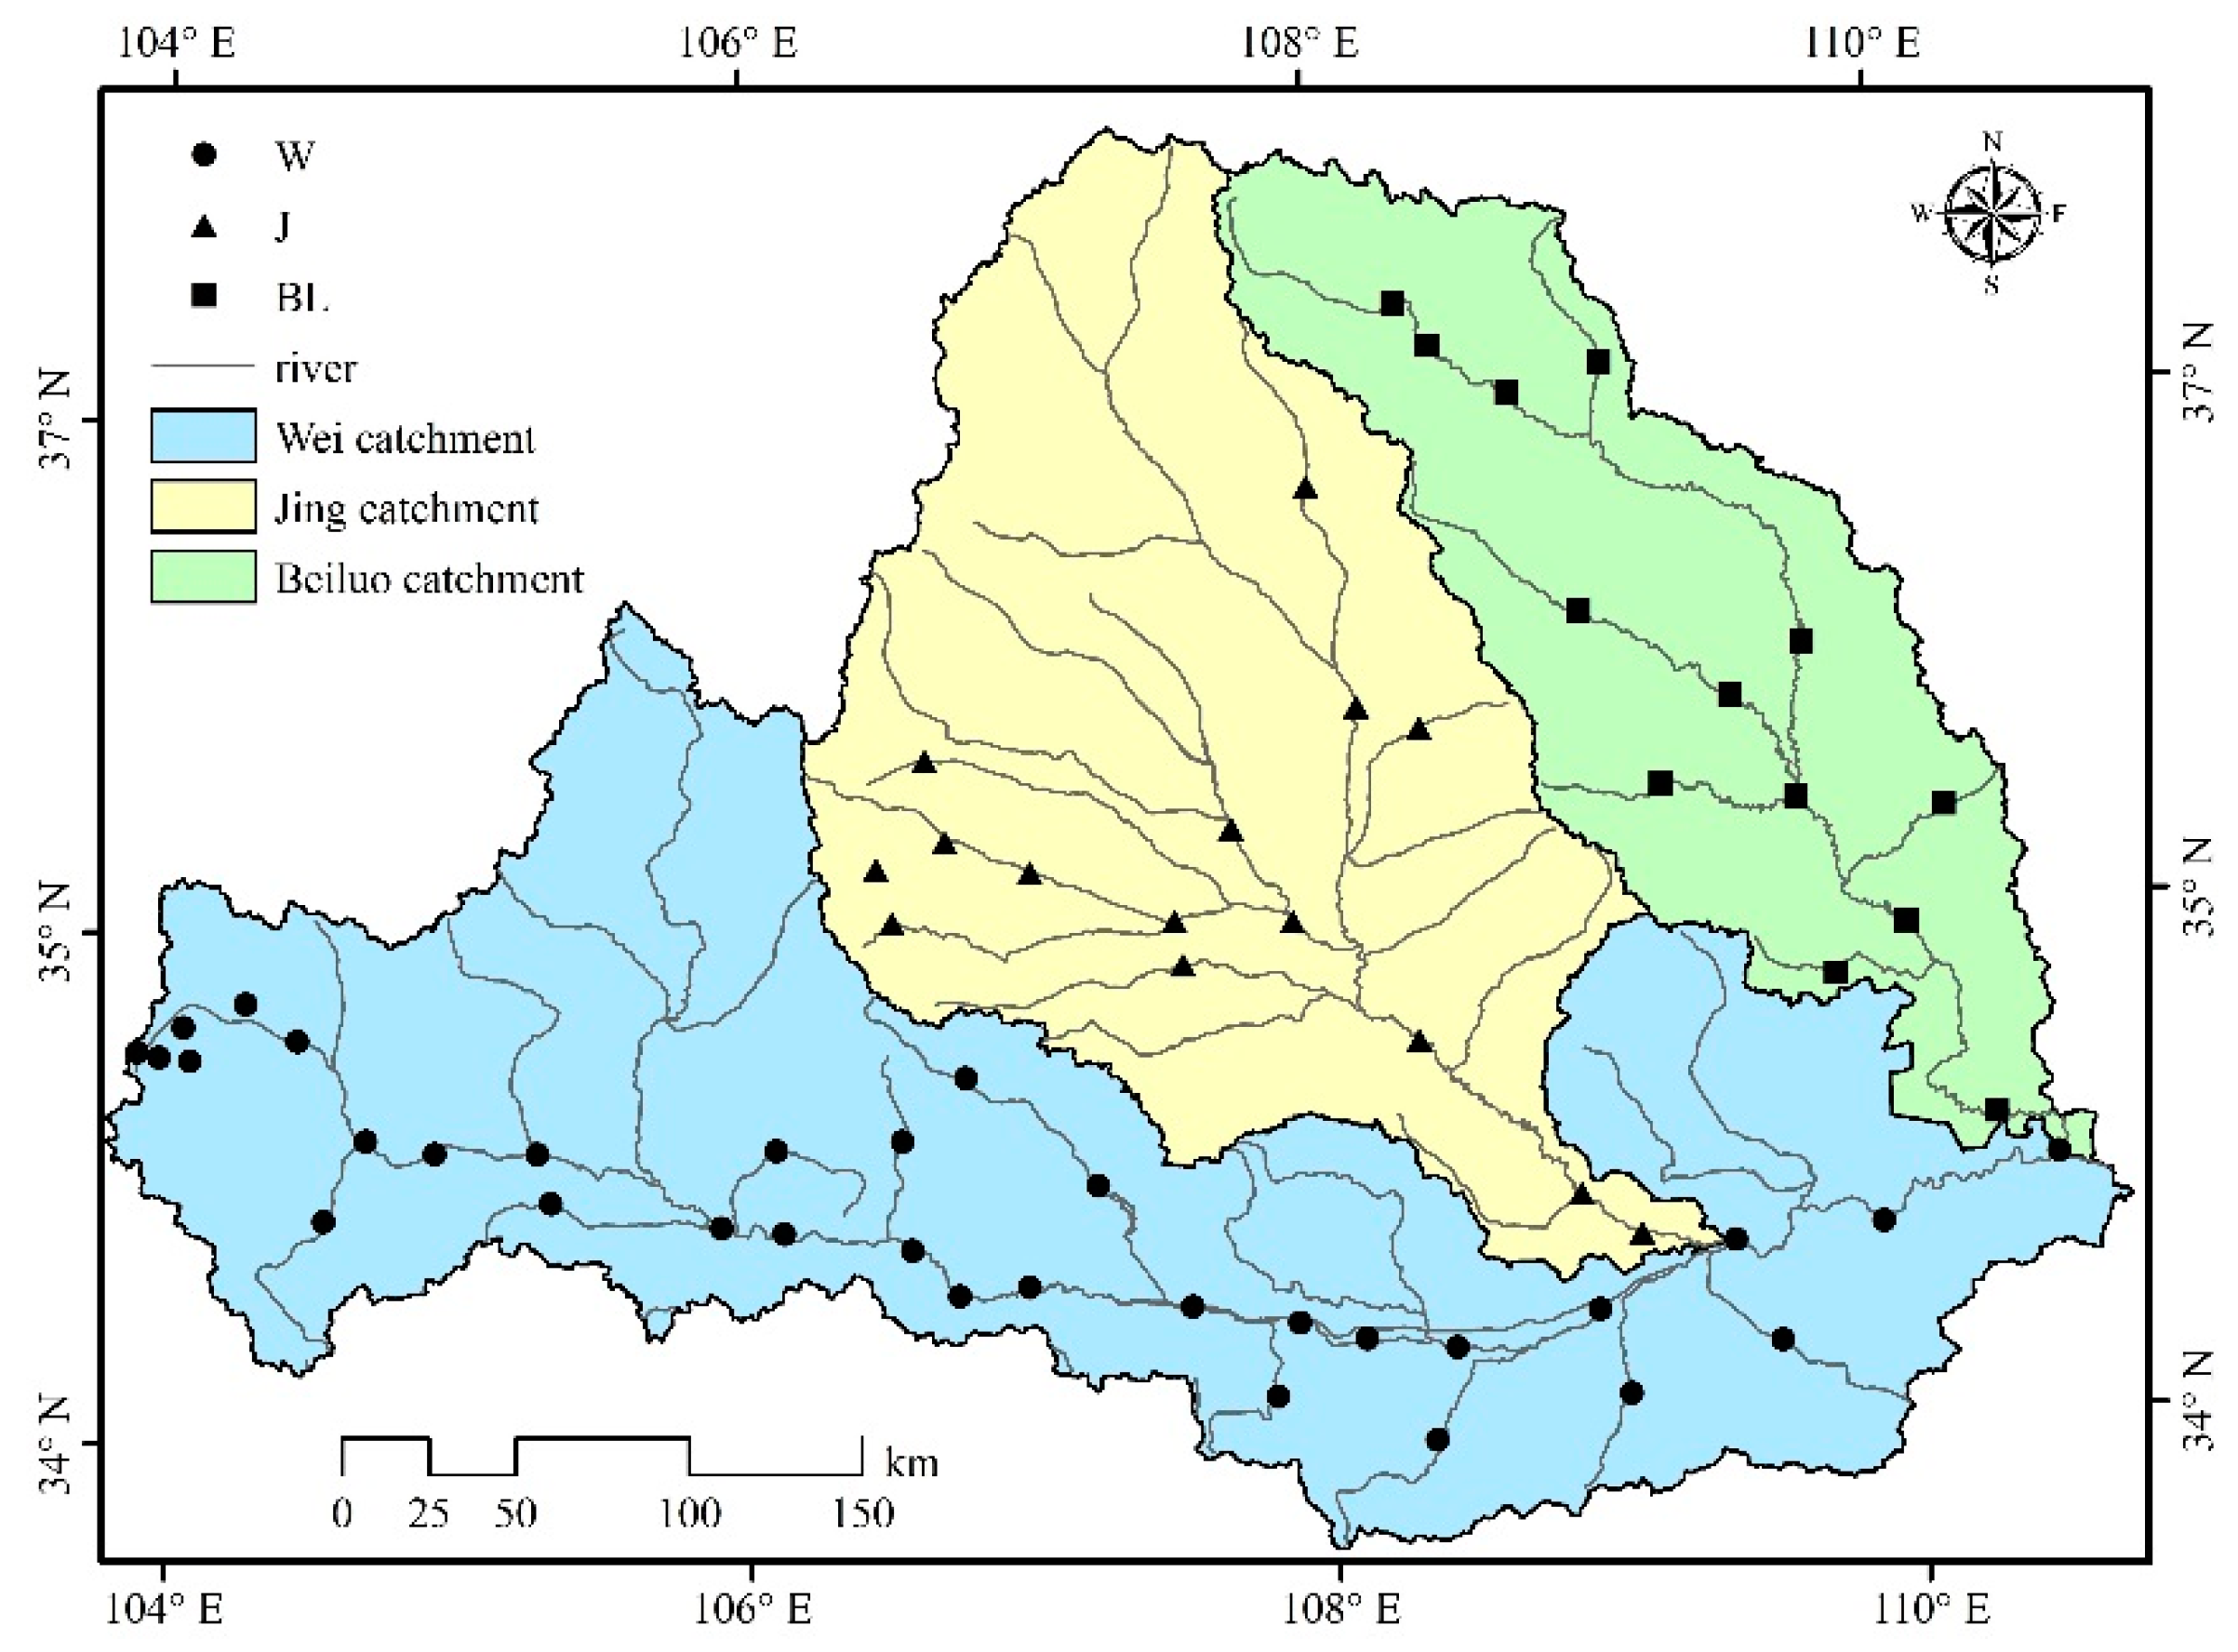
Sixty sampling sites were selected to investigate the characteristics of the fish, macroinvertebrate and diatom communities in October 2012 (wet season) and April 2013 (dry season). These sampling sites covered the entire basin. Most of the sampling stations were located in the fourth- or fifth-order streams because these streams were strongly affected by various human activities [26]. The sampling sites were divided into three groups: (1) W sites, which included 32 sampling sites located in the Wei River catchment; (2) J sites, which included 15 sampling sites located in the Jing River catchment; and (3) BL sites, which included 13 sampling sites in the Beiluo River catchment (Figure 2). A total of 120 samples were collected during these two periods for each biotic assemblage.
2.2.2. Fish Sampling
For the wadable streams, fish were collected across 200–300 m at each site using electrofishing for 30 min within. All types of habitat were included, such as pools, runs, and riffles. In the unwadable streams, fish collection was performed by boat using seines (30 × 40 mm). We identified the fish in situ by referring to the relevant reference books Chen (1998). Each fish species was counted and weighed using an electronic scale.
2.2.3. Macroinvertebrate Sampling
Macroinvertebrates were collected using a Surber sampler (30 × 30 cm). For each sampling site, two parallel samples were collected from different randomly selected habitats, including stones, marginal areas, sand, mud, leaves, and vegetation (6–12 Surber samples for each site). All samples were mixed on a white tray, and the macroinvertebrates were collected and placed into a plastic bottle containing a 95% alcohol solution for preservation. The samples were identified in the laboratory by an anatomical lens or a microscope depending on the reference [27,28,29]. Each taxon was identified to the family or genus level.
2.2.4. Epilithic Diatom Sampling
At each sampling station, three equal-sized pebbles were randomly selected and scraped by a toothbrush and bottle cap (11.34 cm2) to obtain the diatom samples from an equivalent size area. All samples were collected in a plastic bottle containing 4% formalin and transported to the laboratory, where they remained undisturbed for 48 h. Then, the supernatant liquids were extracted, and the remnant liquids were concentrated at 100 mL for future analysis. The diatom samples were corroded by concentrated nitric acid and sulfuric acid. Two replicate slides were taken for each sampling site, and 1000 valves per slide were identified under a microscope with a magnification of 1000× as described by Hu and Wei [30] and Zhu and Chen [31]. Each taxon was identified to the species level.
2.2.5. Biodiversity Indices
Six biological indicators, i.e., richness, abundance, Shannon diversity (SD), Shannon evenness (SE), Margalef diversity (MD), and Simpson diversity (SP) were calculated for each community. Richness was calculated based on the taxonomic classification. Diversity and evenness were calculated as follows:
where pi is the proportion of individuals found in the ith taxon; S is the total number of organisms in the sample; and N is the total number of individuals in the sample.
2.2.6. Physiochemical Variable
Dissolved oxygen (DO) and electrical conductivity (EC) were measured in situ using a YSI Pro plus 85. Two-liter water samples were collected from each sampling station and sent to the laboratory within 48 h. Total nitrogen (TN), total phosphorus (TP) and chemical oxygen demand (COD) were measured in the laboratory following the standards from the State Environmental Protection Administration of China (GB 3838-2002). The Qualitative Habitat Evaluation Index (QH) was used to evaluate the condition of the habitat according to Barbour et al. [32].
2.2.7. Land Use Type
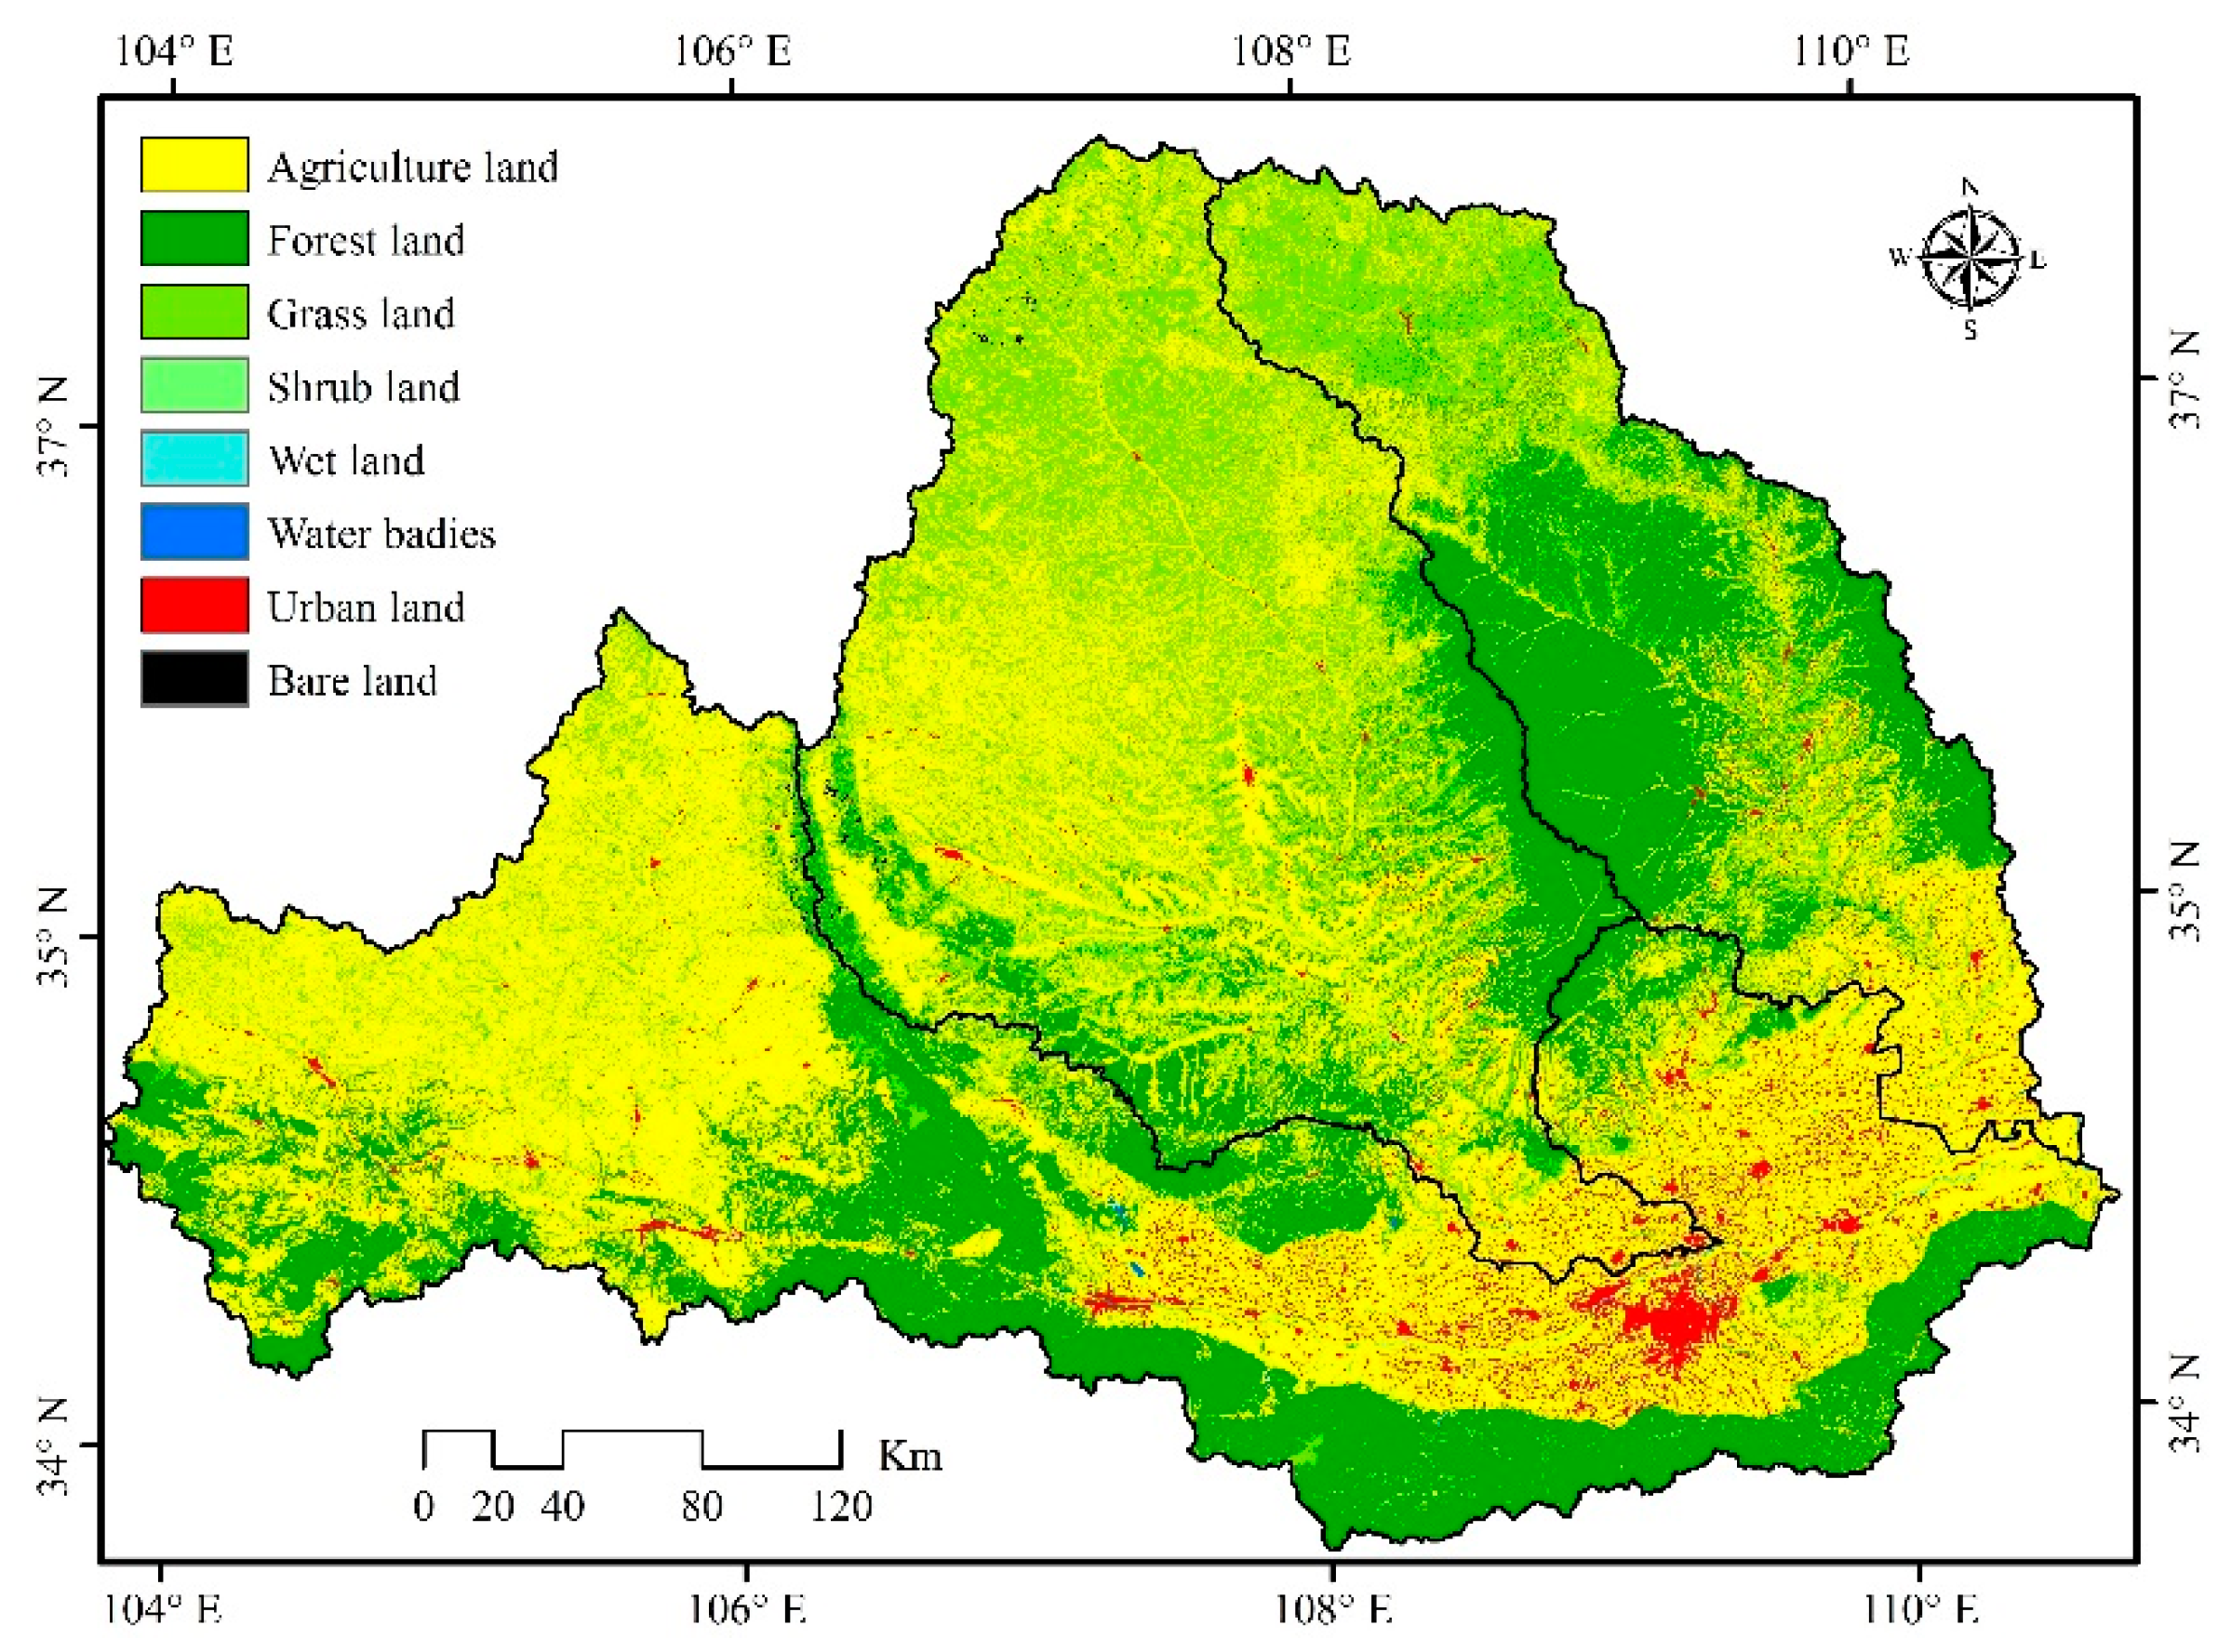
The land use types of the Wei River basin were obtained from the National Geomatics Center of China. The land use types were divided into the following eight categories according to the 30-m global land cover dataset from 2010 (Figure 3): agricultural land, forestland, grassland, shrubland, wetland, aquatic land, urban land, and bare land. Because forestland, grassland, agricultural land and urban land accounted for more than 99% of the Wei River basin, these four land use types were considered in the subsequent analysis.
Each sampling site was selected as an outlet point, and the Wei River basin was delineated into 60 subbasins depending on the digital elevation model (DEM) at a 30 × 30-m resolution. Then, we obtained the land use composition of each sampling site at the sub-basin level.
2.3. Data Analysis
The averages of each biological index, physiochemical variable, and land use type were calculated in the Wei River catchment, Jing River catchment and Beiluo River catchment, and the range was displayed by boxplots and violin figures to express the discrimination of the three catchments. The Indicator Species Analysis was used to define the indicator species for each catchment using PC-ORD 5.0 soft (https://www.pcord.com/pc5fixes.htm) [22].
The Kolmogorov–Smirnov test (K–S test) was used to examine whether all variables fit a normal distribution. In this study, values of p > 0.05 indicated that the variables fit a normal distribution. For such variables, Pearson’s correlation analysis was used to analyze the relationships between the biological indices and land use types and physiochemical variables.
Before analyzing the correlations between biotic abundance and environmental variables, a detrended correspondence analysis (DCA) was conducted to determine the model (linear model or unimodal model) that would be more appropriate for further analysis [22]. In this study, the gradient lengths of macroinvertebrate and fish abundance were greater than 3; therefore, a canonical correspondence analysis (CCA-unimodal model) was used to analyze the effects of land use type and physiochemical variables on the macroinvertebrate and fish communities. However, for gradient lengths of diatom abundance lower than 3, a redundancy analysis (RDA) was more appropriate for analyzing the association of diatom assemblages with environmental variables.
3. Results
3.1. Land Use Characteristics
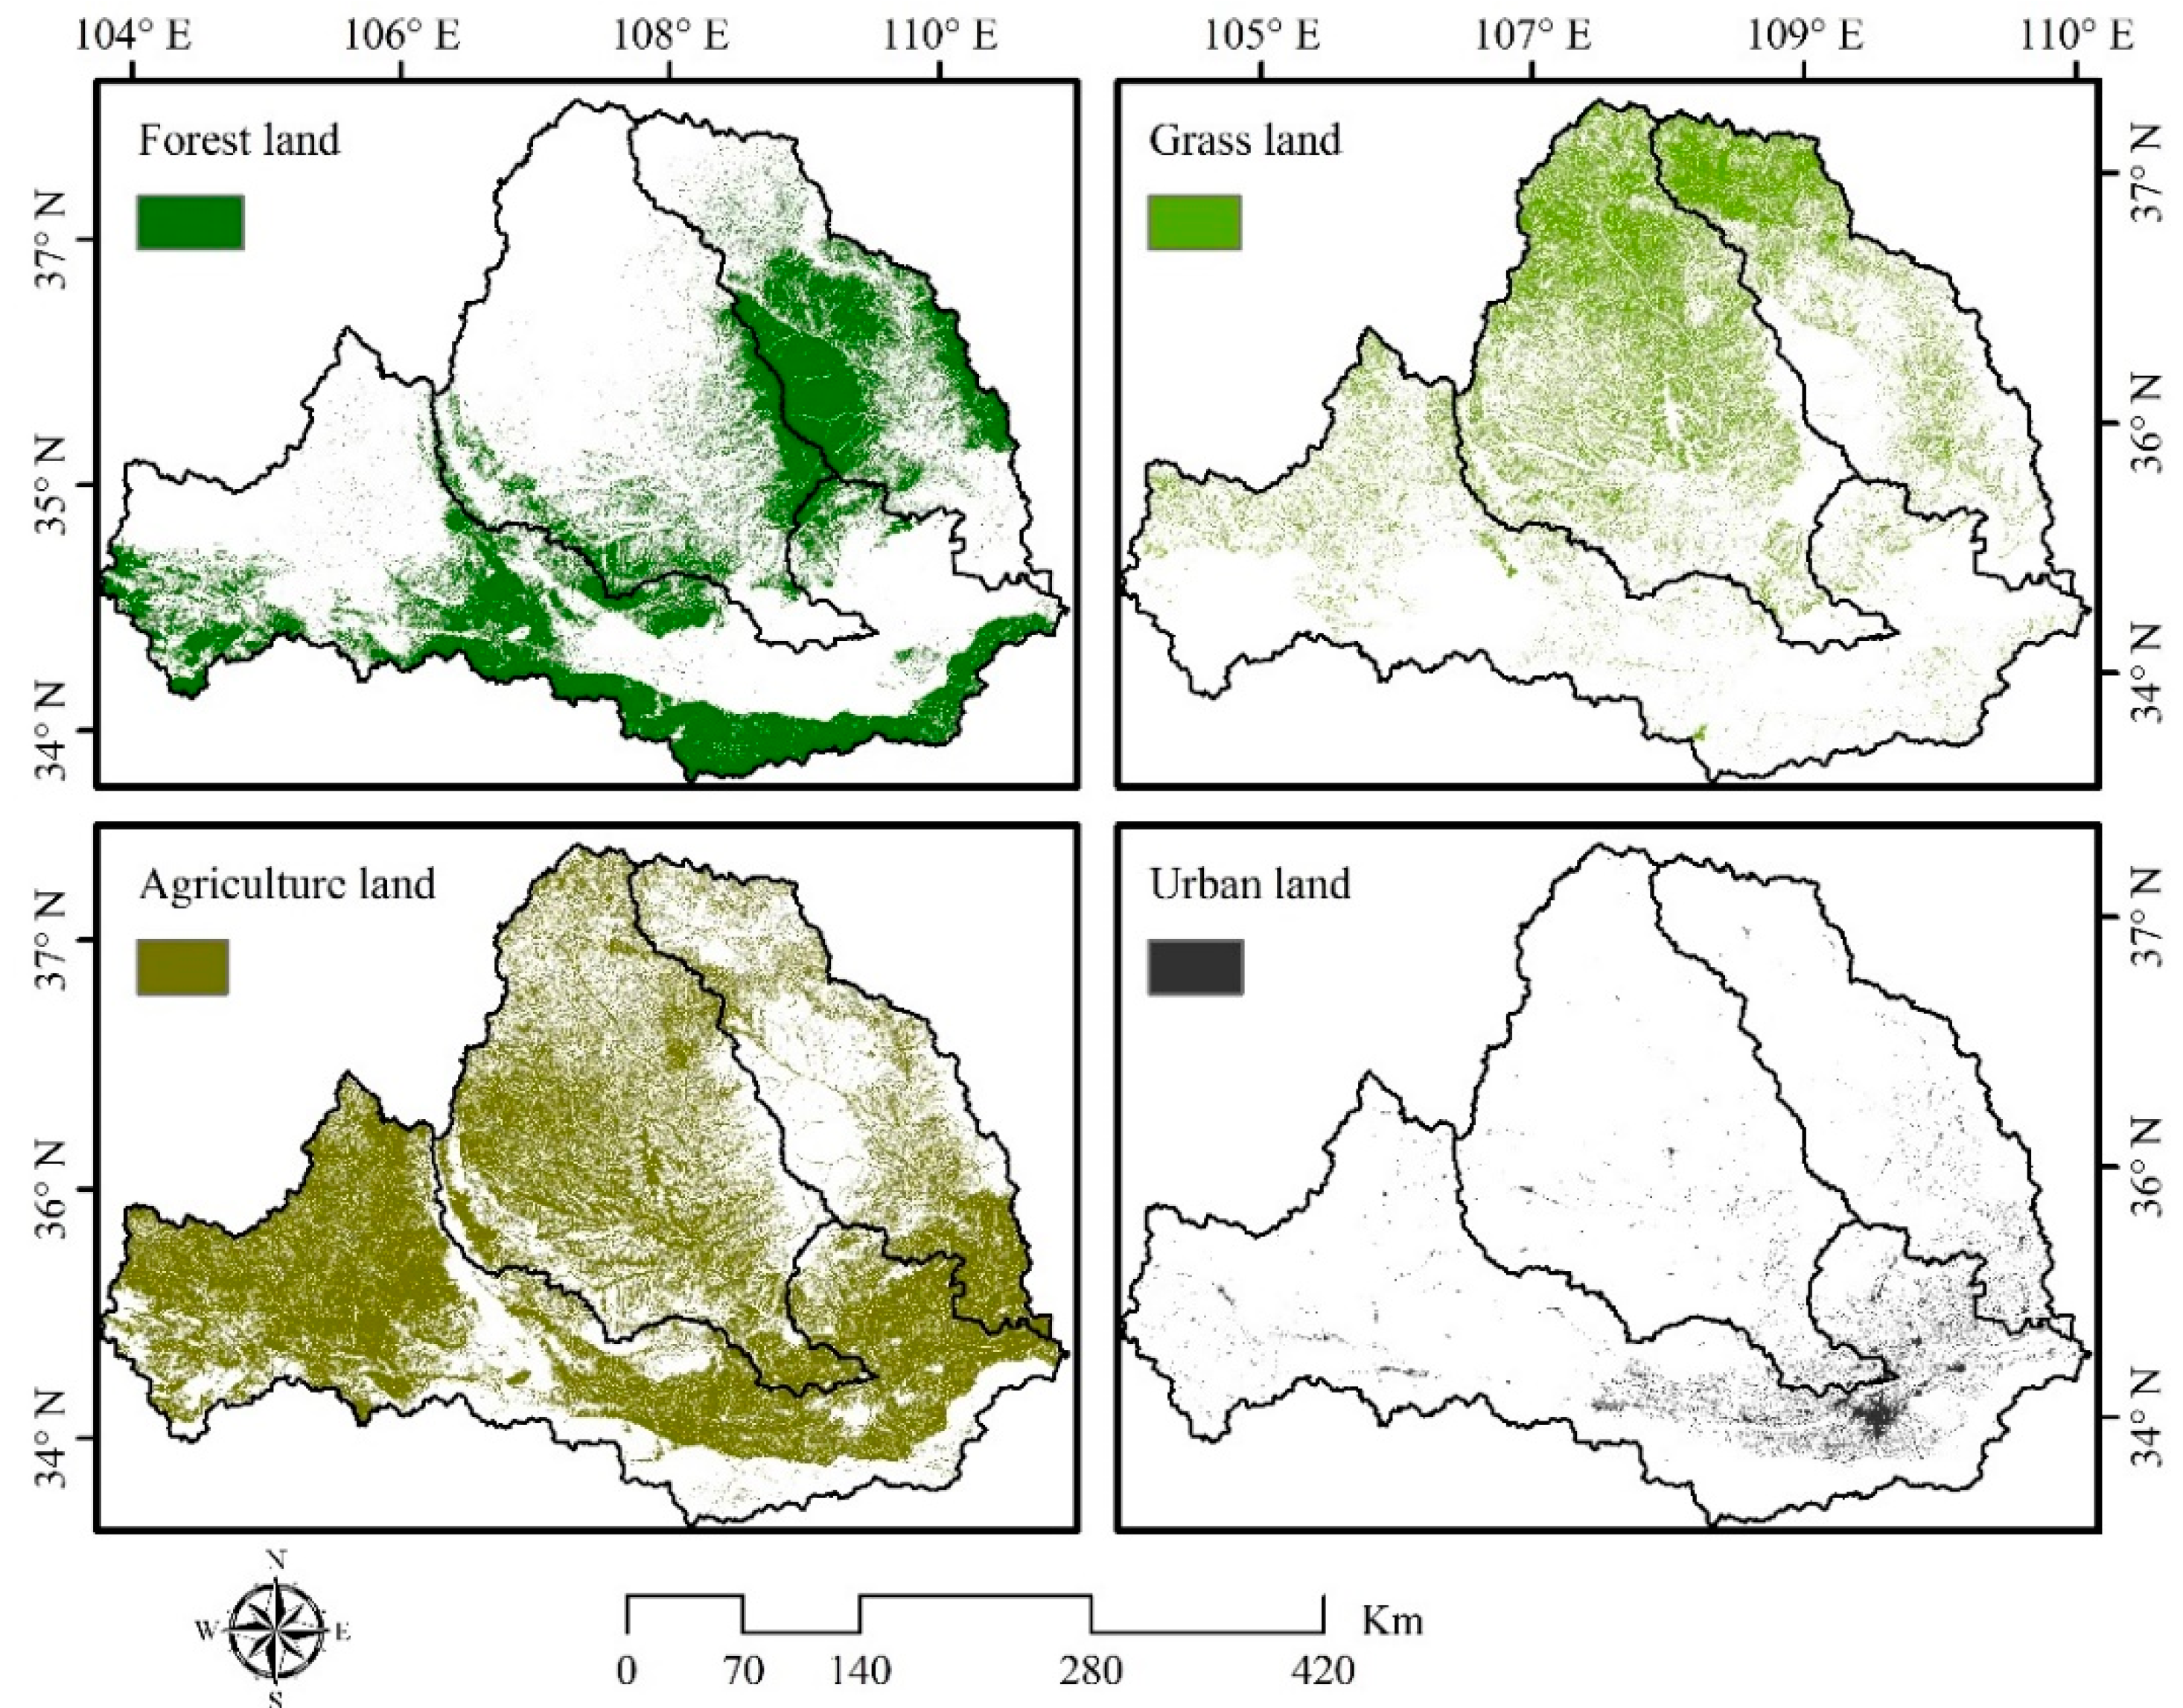
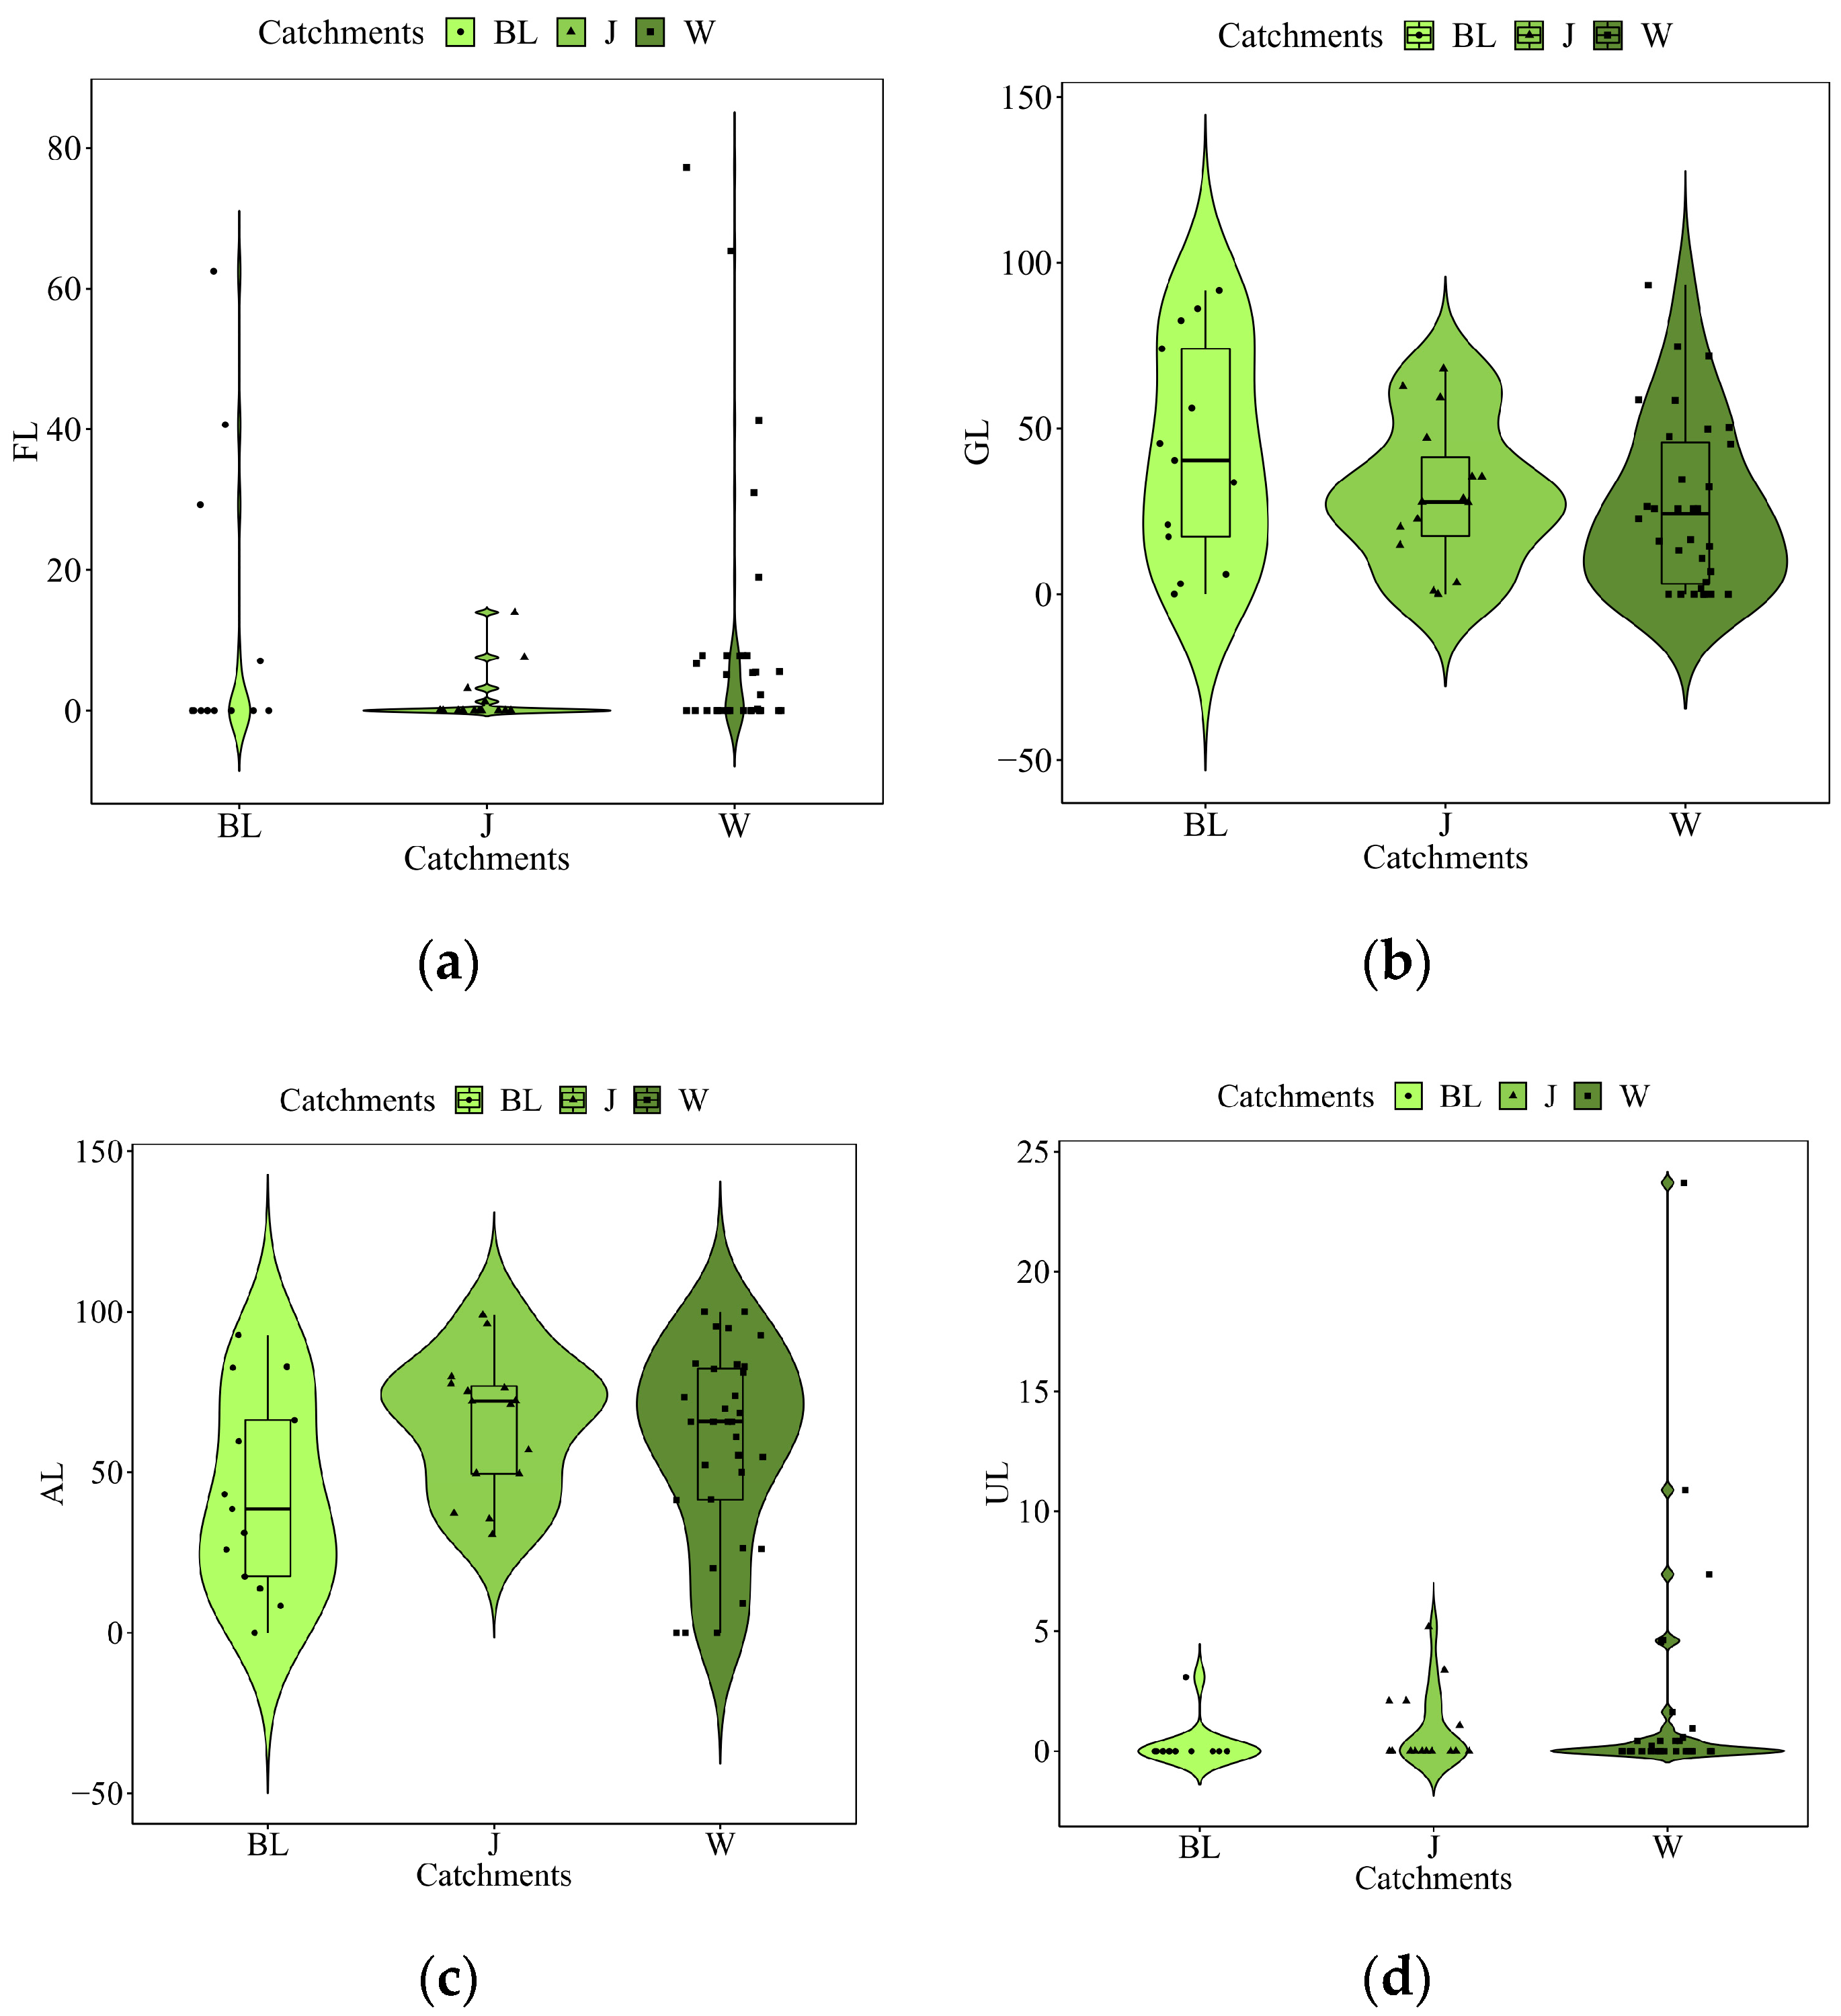
The 30-m global land cover dataset in 2010 showed that agricultural land (AL) was the main land use type in the basin and accounted for 48.4% of the total area (Figure 4). At the reach scale, the proportion of AL was lowest in the BL catchment at nearly 43.3%, and it was 58.8% and 65.2% in the W and J catchments, respectively (Figure 5). The next most abundant land use types were forestland (FL) and grassland (GL), which were mainly distributed in the southern and northeastern parts of the Wei River basin, and they accounted for 28.9% and 19.0% of the total area, respectively (Figure 4). The proportion of FL and GL were both highest in the BL catchment at 10.7% and 42.9%, respectively, at the reach scale. The proportion of FL in the W catchment (9.5%) was higher than that in the J catchment (1.7%), whereas the results for GL showed an opposite trend, with proportions of 30.3% and 26.7% in the J and W catchments, respectively (Figure 5). Although the urban land area (UL) was relatively small, it was concentrated in the Guanzhong Plain in the eastern part of the basin, and the urban land area accounted for 3.0% of the total area (Figure 4). Most of the urban land area was distributed in the W catchment, and the proportion was 1.8%, which was twice the value in the J catchment. Urban land in the BL catchment was rather small at a proportion of only 0.2% (Figure 5).
3.2. Physiochemical variables
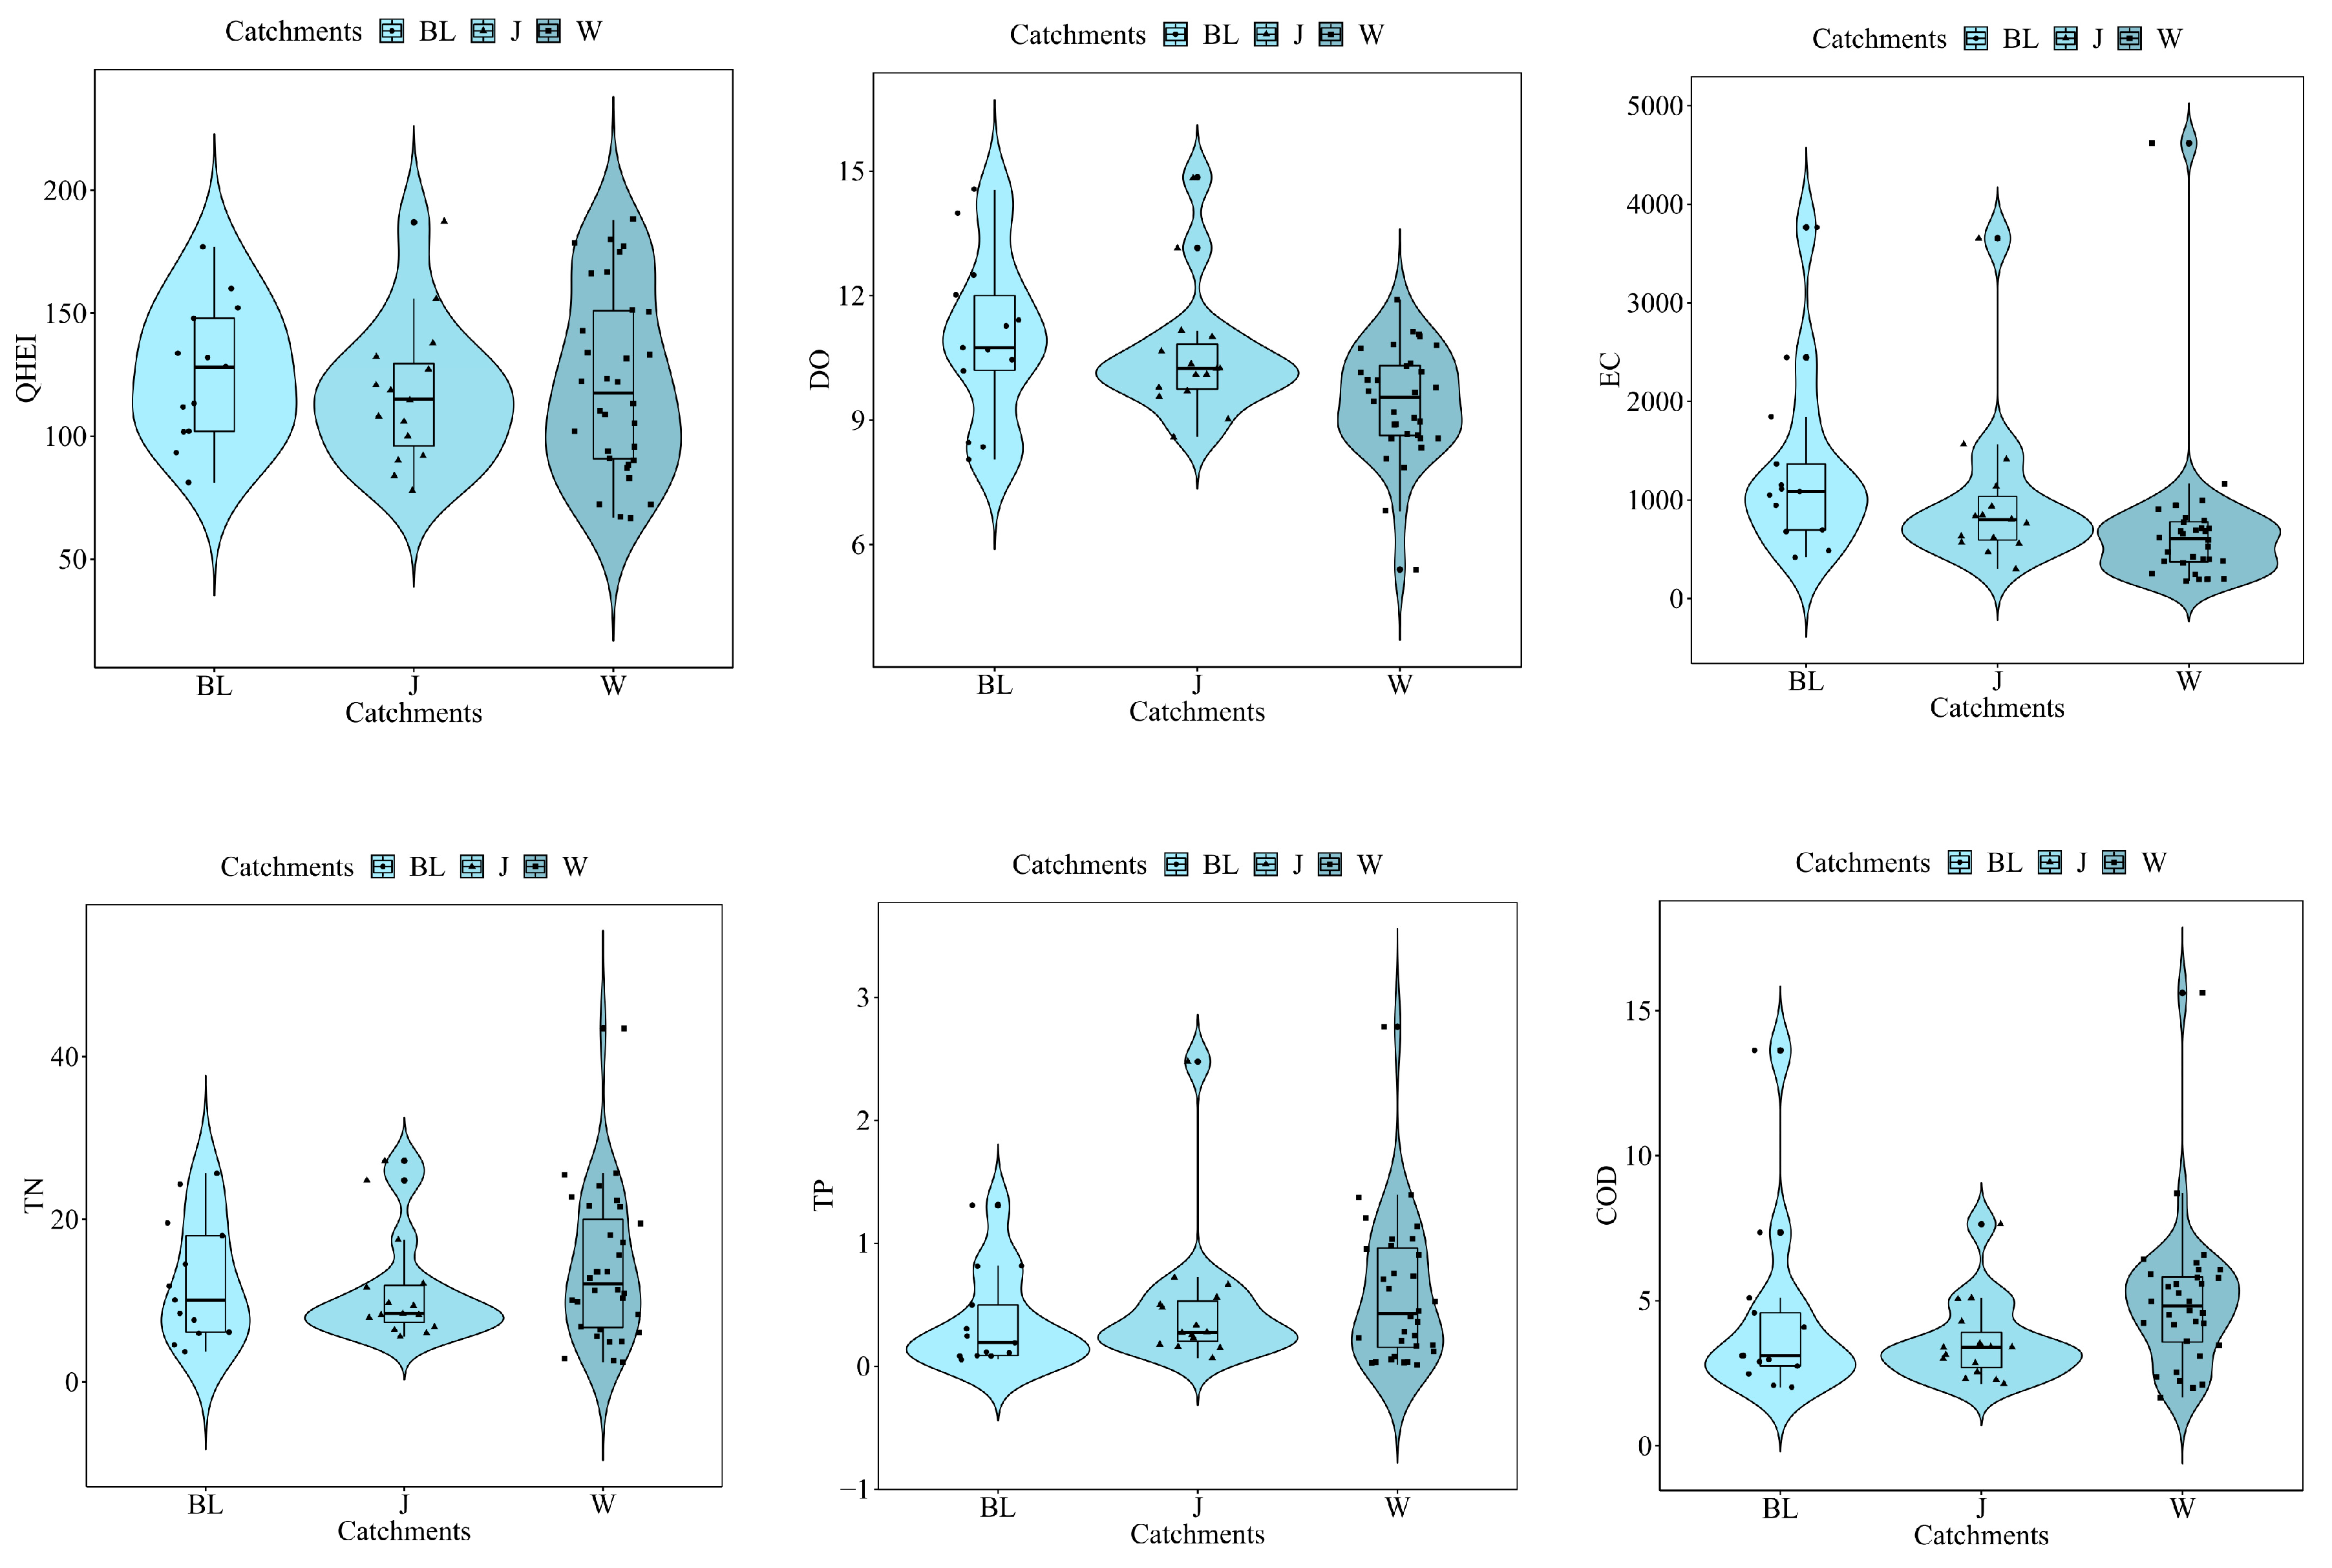
Significant differences were observed for some variables in some catchments. QH, DO, and EC were slightly higher in the BL catchment than in the other catchments, and the average values were 125.7, 11.0 mg/L, and 1311.5 us/cm therein and 121.5, 9.4 mg/L, and 392.0 us/cm in the W catchment and 116.9, 10.6 mg/L, and 1006.6 us/cm in the J catchment, respectively. TN, TP, and COD were a slightly higher in the W catchment than in the other catchments, with average values of 13.9 mg/L, 0.6 mg/L, and 4.96 mg/L therein, and 12.3 mg/L, 0.36 mg/L, and 4.32 mg/L in the BL catchment, respectively. TN and COD were relatively lower in the J catchment than in the BL catchment, and the average values were 11.32 mg/L and 3.6 mg/L, respectively. TP was higher in the J catchment and had an average value of 0.49 mg/L (Figure 6).
3.3. Community Structure and Biological Indices
A total of 251 diatom species belonging to 31 genera were collected. Navicula was the most numerous genus and included 61 species. The species Encyonema ventricosum and Achnanthidium minutissimum were the indicator species for the W catchment, and Pantocsekiella ocellata was the indicator species for the J catchment. The number of indicator species of diatoms for the BL catchment was much higher than that of the above catchments, and the indicator species included Diatoma elongata, Achnanthidium minutissimum var. cryptocephala, Chamaepinnularia begeri, Caloneis budensis, and Neidium kozlowi var. elliptica (Table 1). In total, 73 macroinvertebrate species were identified, and they represented seven classes and 12 orders. Diptera was the dominant order and included 34 species in the Wei River basin. Orthocladius makabensis, Rheocricotopus fuscipes, Polypylis hemisphaerula, Limnodrilus claparedianus, and Sinopotamidae were the indicator species in the BL catchment; however, no macroinvertebrate indicator species were observed in the W and J catchments (Table 1). A total of 45 fish species were recorded in this study, and the most indicator fish species were observed in the W catchment, including Triplophysa minxianensis, Cobitis granoei, Huigobio chinssuensis, and Gobio coriparoides. Only one indicator fish species was found in the J catchment (Triplophysa kungessana orientalis) and BL catchment (Gnathopogon imberbis).
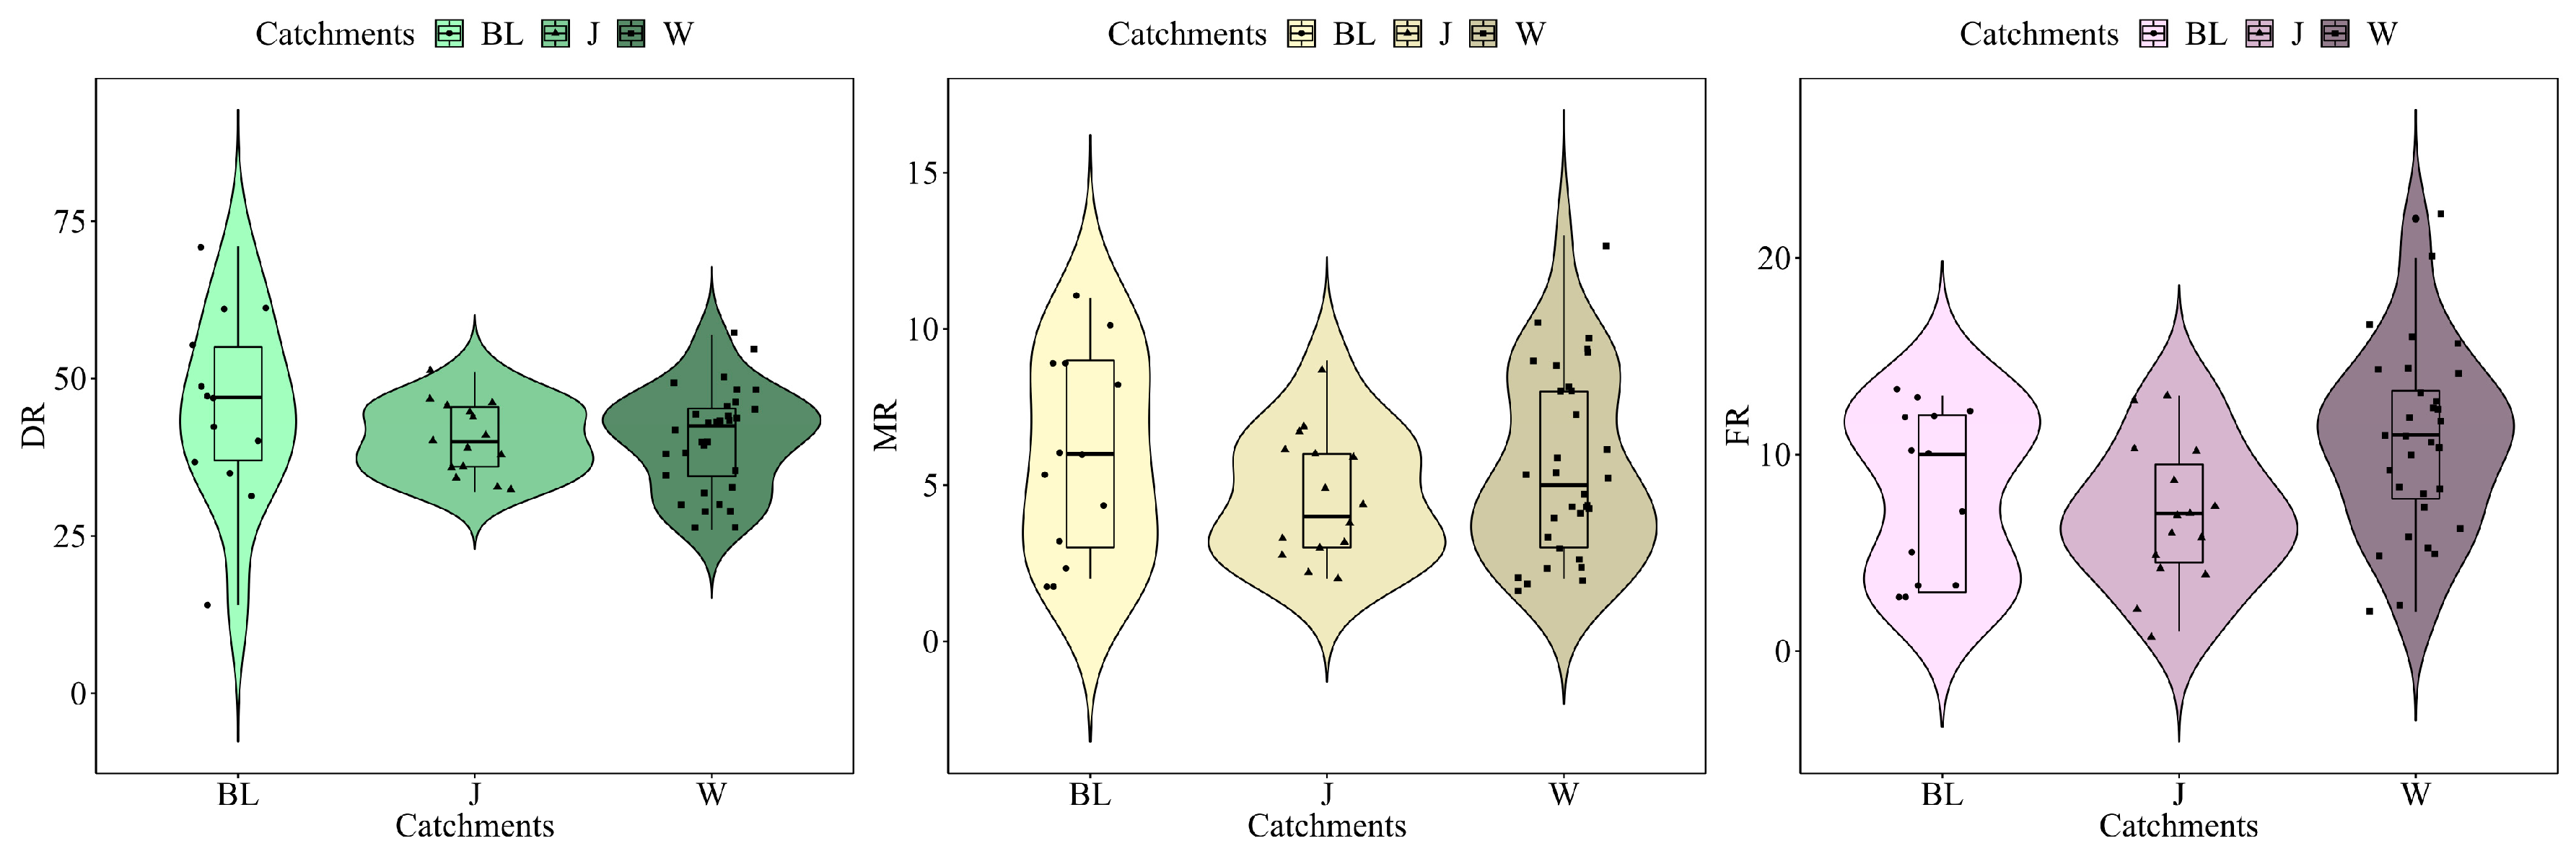
For the BL catchment, the richness of diatoms and macroinvertebrate was the highest among the three catchments, and the average values were nearly 45.4 and 5.9, respectively. The richness of fish in the BL catchment was lower than that of the W catchment but higher than that of the J catchment, reaching a mean value of 8.2. For the J catchment, the richness of fish and macroinvertebrates was the lowest among the three catchments, and the average values were 6.9 and 4.7, respectively. The mean richness value of diatoms was 40.5. For the W catchment, the richness of fish was the highest among the three catchments, with a mean value of 10.6. The average richness of diatom and macroinvertebrates was 5.5 and 40.3, respectively (Figure 7).
3.4. Correlations between Biological Indices and Environmental Variables
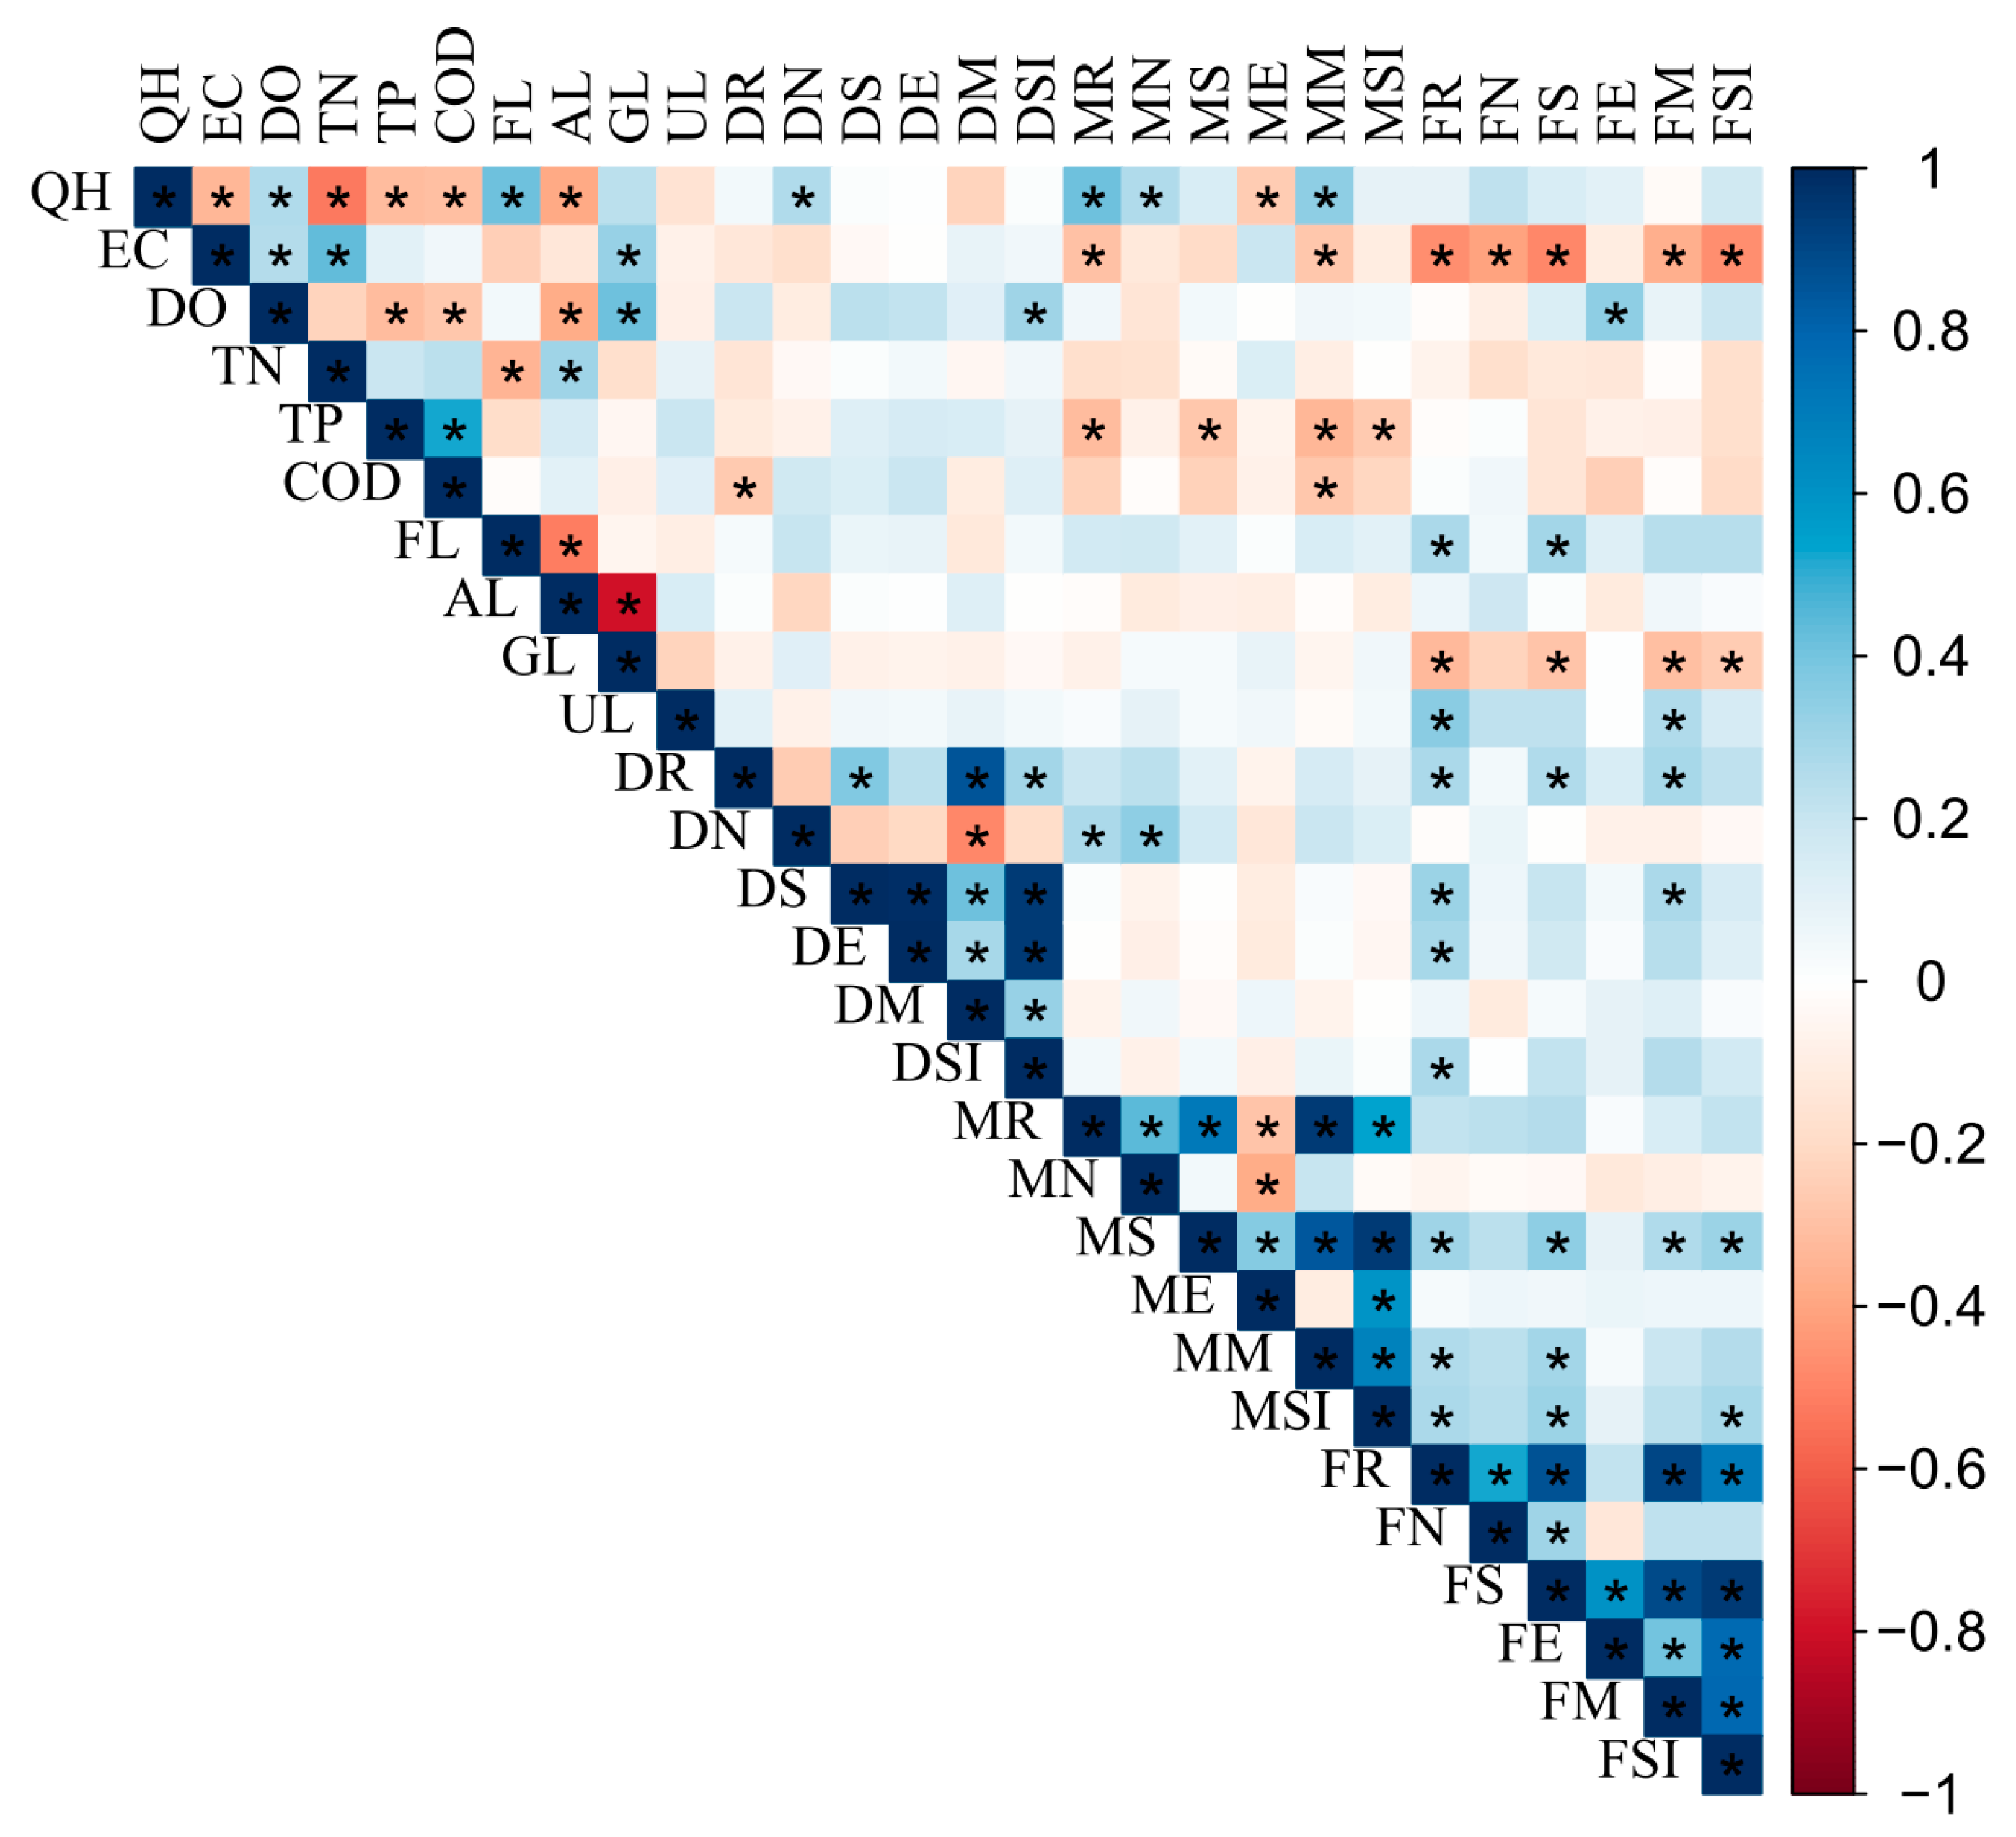
For the diatom indices, only richness, abundance, and Simpson diversity were significantly associated with COD, QH, and DO, respectively. For the macroinvertebrate biotic indices, QH and TP both had a great effect on the four biological indices. Macroinvertebrate richness and Margalef diversity were both statistically correlated with QH and TP, while macroinvertebrate abundance was associated with QH and macroinvertebrate Simpson diversity was associated with TP. Macroinvertebrate richness and macroinvertebrate Margalef diversity were also affected by EC. In addition, macroinvertebrate Margalef diversity was associated with COD as well. For the fish, all of the biotic indices had a significant correlation with EC except evenness. GL had a strong association with fish richness, Shannon diversity, Margalef diversity and Simpson diversity. FL was correlated with fish richness and Shannon diversity, while UL was associated with fish richness and Margalef diversity. Only DO had a strong correlation with fish evenness (Figure 8).
3.5. Relationships between Biological Assemblages and Environmental Variables
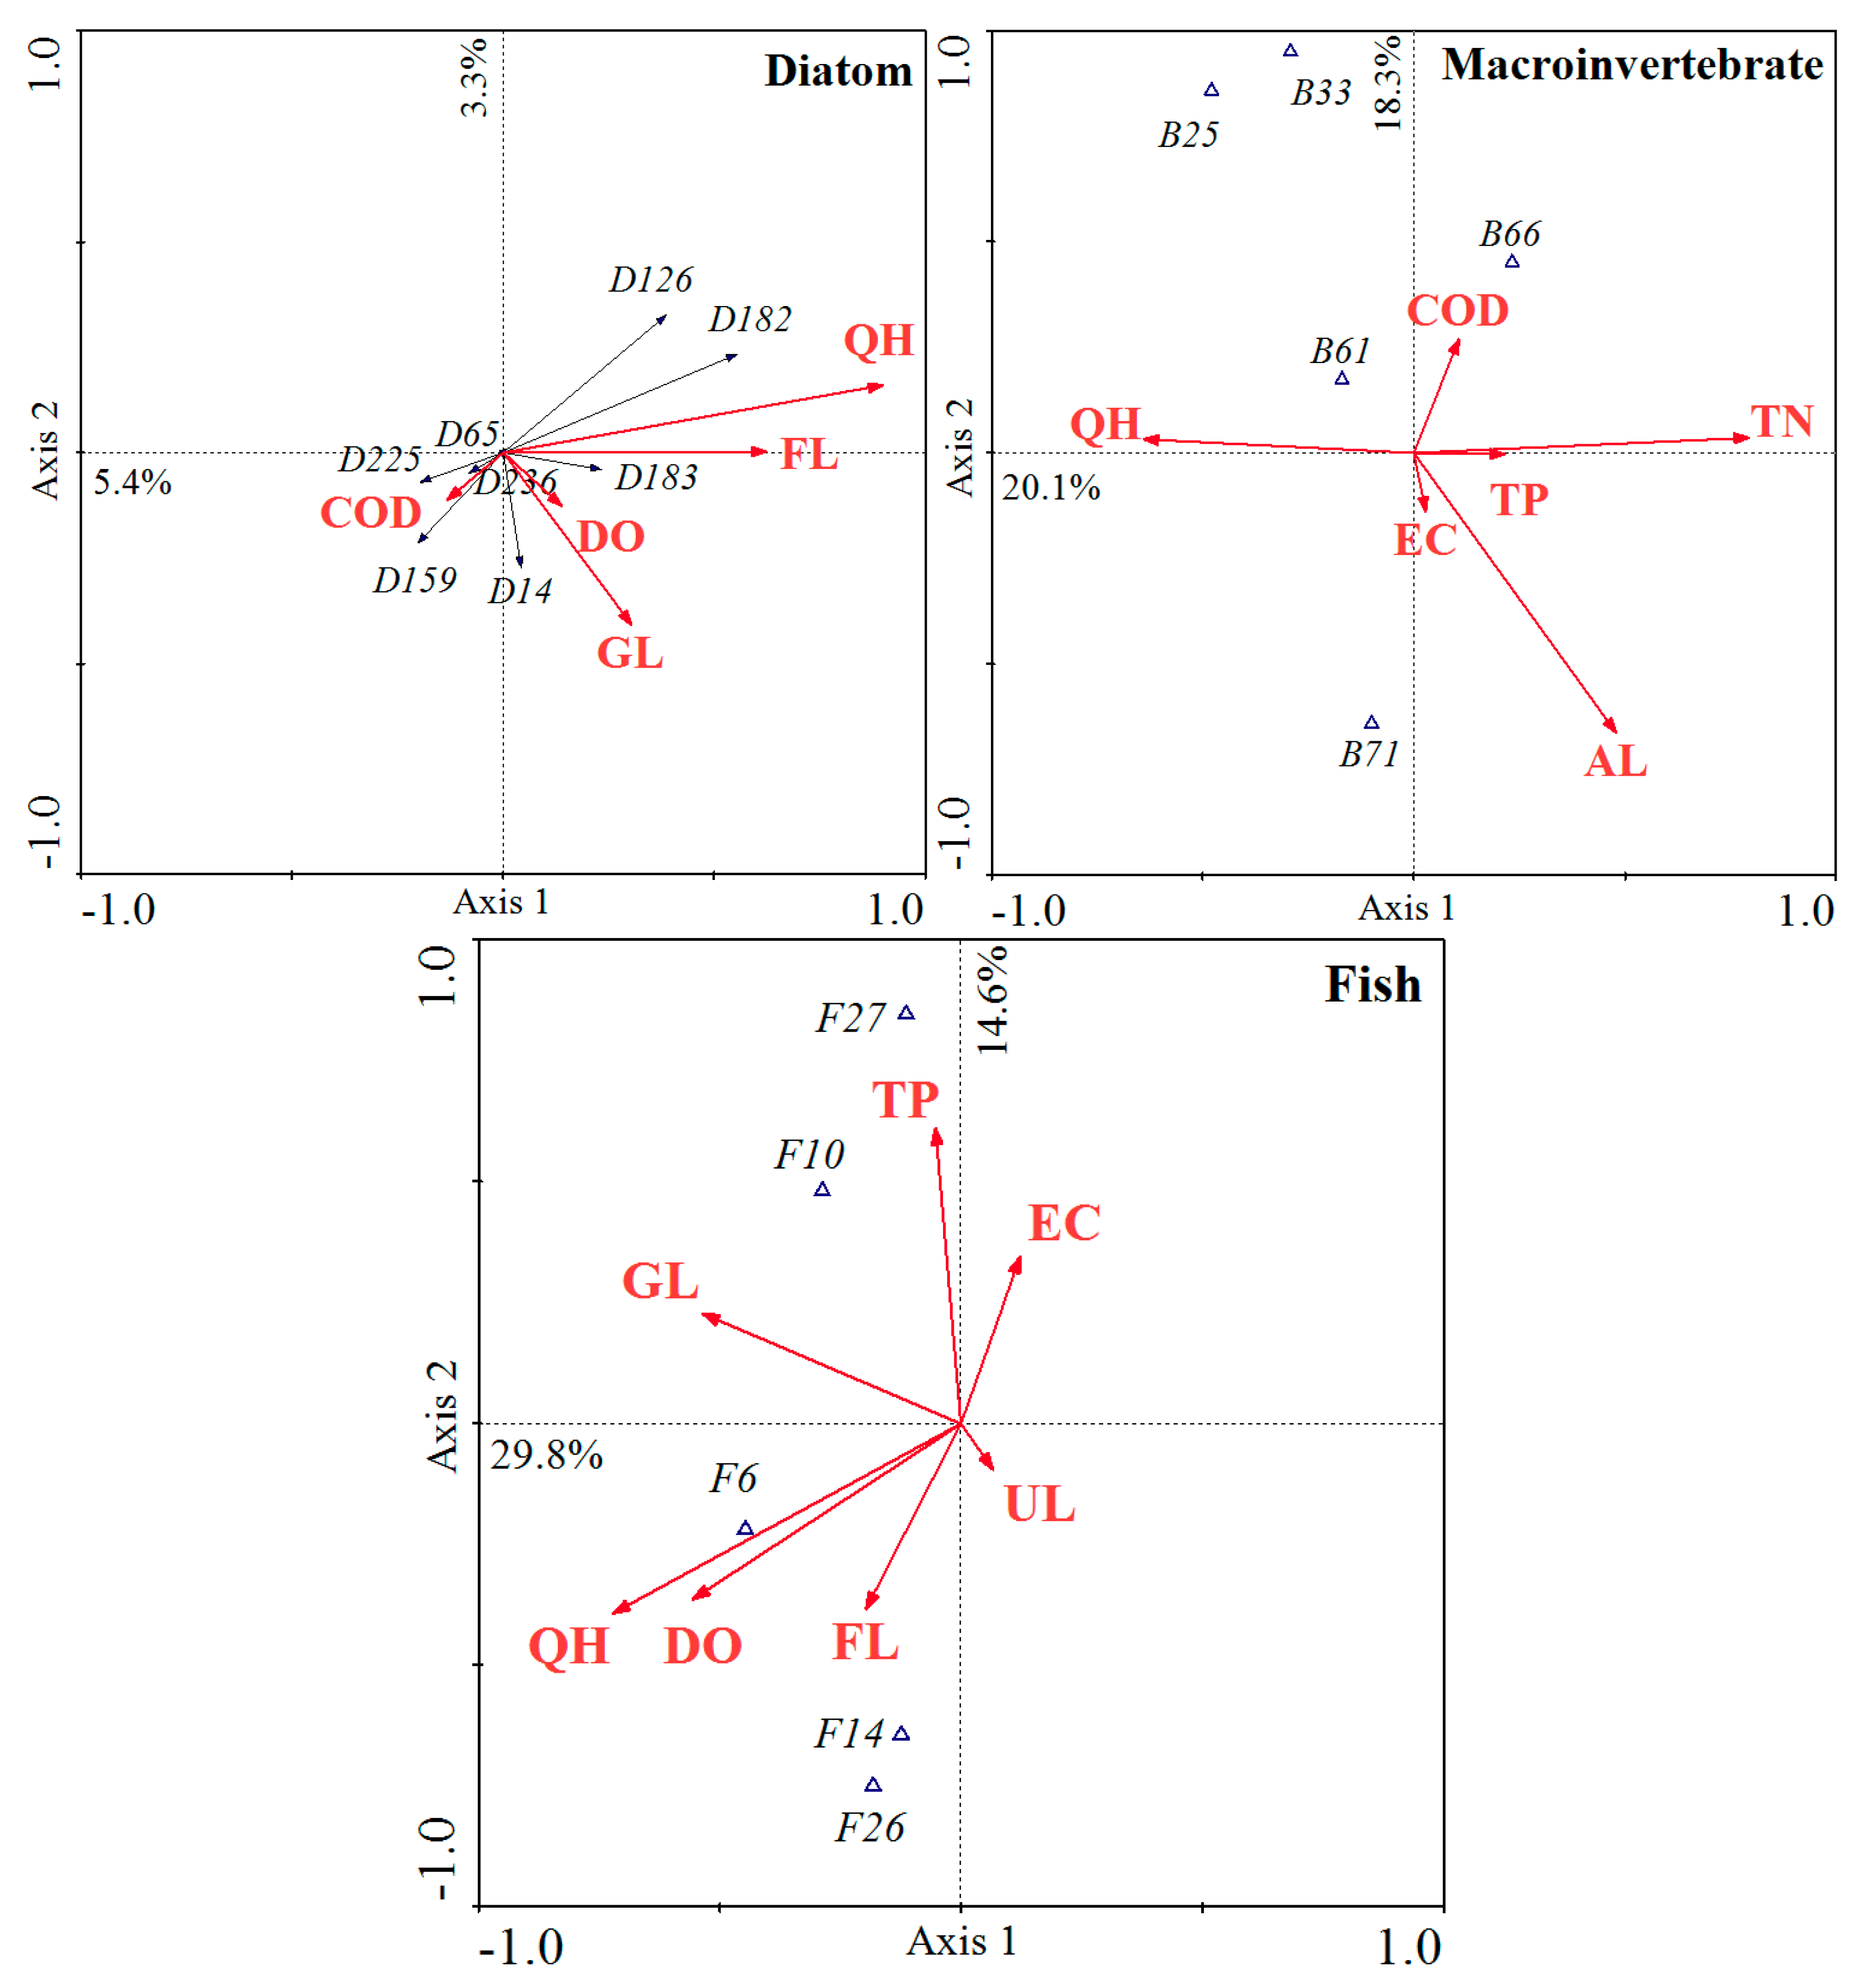
In the RDA model for the diatom assemblage, axes 1 and 2 explained 5.4% and 3.3% of the variation, respectively (Table 2). The Monte Carlo permutation test indicated that QH, FL, and GL had a significant influence on diatom assemblages (p < 0.05) (Table 3). Encyonema ventricosum and Achnanthidium minutissimum, which were the indicator species, were positively correlated with QH and FL (Figure 9). Pantocsekiella ocellata was the indicator species for the J catchment, and it was positively associated with COD. Diatoma elongata and Caloneis budensis had a great positive association with COD, and Achnanthidium minutissimum var. cryptocephala and Chamaepinnularia begeri were strongly correlated with GL and FL, respectively. In the CCA for the macroinvertebrates, TN and AL were selected as the main factors influencing assemblage structure. Axes 1 and 2 explained 20.1% and 18.3% of the variation, respectively. Limnodrilus claparedianus was associated with TN, and Sinopotamidae was correlated with AL. In the CCA model for fish, QH, DO, TP and GL had significant associations with the assemblage structure. Axes 1 and 2 explained 29.8% and 14.6% of the variation, respectively. Huigobio chinssuensis, Gobio coriparoides, and Triplophysa kungessana orientalis were strongly associated with TP; meanwhile, Cobitis granoei and Gnathopogon imberbis were not. Triplophysa minxianensis had a high correlation with QH and DO.
4. Discussion
4.1. Characteristic of Aquatic Ecosystems
Anthropogenic influences and land use are most likely responsible for the variations in water quality [33]. In our study, QH and DO were the highest in the BL catchment and TN and TP were the lowest. Meanwhile, the percentage of agricultural land and urban land were obviously lower in the BL catchment than in the other catchments while the percentages of forestland and grassland were higher. Moreover, the richness of diatoms and macroinvertebrates was the highest in the BL catchment. These findings suggest that land use may affect the water quality and biological community structure, which is consistent with a number of previous studies [18,34,35]. Ding [12] found that water quality was most strongly affected by the configuration metrics of land use. Agricultural land was the main land use type in the Wei River basin at both the large scale and the reach scale, suggesting that aquatic ecosystems were severely affected by the agricultural activity. Urban land, which accounted for 3% of the area, was a minor land use type in the Wei River basin, indicating that economic development was relatively slower than that observed in the eastern parts of China, such as in Shanghai or Hangzhou. Therefore, non-point pollution was considered the main source of contamination in the Wei River basin because of the higher proportion of agricultural land and lower proportion of urban land [23]. Other studies, such as Longyang [36], reported that runoff would carry agrochemicals into rivers and cause non-point source pollution. Forest land and grassland are often considered filter strips that could decrease the nutrient content of water resources caused by non-point pollution, reinforce bank stability and provide aquatic habitats [26].
4.2. Influence of Environmental Variables on Biological Indices
The indices of macroinvertebrates and fish were more sensitive to the environmental parameters than the indices of diatoms in Wei River basin, and the macroinvertebrate indices were more strongly correlated with physicochemical variables while the fish indices were more strongly correlated with the land use type. The weak correlations observed for the indices based on diatom were primarily related to the degraded habitat and high amounts of silt sediment. The Loess Plateau is located in the Wei River basin, and considerable amounts of runoff with silt or sand enter the river and lead to finer sediment, which decreases the survival of diatoms. Many studies have indicated that diatom indices are sensitive to the nitrogen or phosphorous content and are beneficial indicators for evaluating the eutrophication conditions of freshwater ecosystems [37,38,39,40]. In our study, diatom richness was correlated with organic pollution, such as COD, indicating that the nutrient content was not sufficient to cause eutrophication; rather, organic pollution was the major limiting factor for diatom growth. Although many studies have demonstrated that diatom assemblages represent the “first choice” for detecting nutrient enrichment levels in water quality [26,37,39], several studies have confirmed that diatom indices could be a useful indicator for predicting organic pollution as well [41]. Hence, diatom indices could be used as an indicator for organic pollution in the Wei River basin. All of the macroinvertebrate indices had a strong correlation with environmental variables, especially the macroinvertebrate richness and Margalef diversity. QH and TP were the major environmental parameters that influenced the four macroinvertebrate indices. Zhang et al. [42] demonstrated that the concentration of nitrogen had a great effect on the distribution of the macroinvertebrate community in basins where agricultural area was the main land use type, which is consistent with our results. The fish indices were also strongly associated with environmental variables in our study, especially EC. Maceda-Veiga et al. [43] showed that high water conductivity was negatively correlated with migratory, pelagic, invertivorous and native fish in Spain and suggested that the current condition of riparian zones was sufficient to decrease the pollution effects on fish, with high conductivity presenting a significant inverse association with the length of the food chain [44]. In conclusion, diatom and macroinvertebrate indices represent better indicators for organic pollution and eutrophication, respectively, and fish indices represent better indicators for conductivity in the Wei River basin.
4.3. Response of Biological Assemblages to Environmental Variables
The results of the RDA showed that QH, FL, and GL were significantly correlated with the diatom assemblages. Forest land and grassland were strongly correlated with the water quality and indirectly affected the biological assemblages [26]. We found that Encyonema and Achnanthidium preferred habitat with a higher percentage of forest or grassland use, consistent with several studies indicating that these genera are indicators of good water quality. For instance, some studies showed that Achnathidium minutissimum was so sensitive to water quality that it was rarely observed in impaired sites, especially when the phosphorus content was over 0.3 mg/L [37,45]. Pantocsekiella has been defined as a tolerant species that can indicate polluted areas. Shen et al. [39] divided the Ying River into three regions based on nutrient status and found that Achnathidium minutissimum was the dominant species in the region with the lowest nutrient level, whereas Pantocsekiella meneghiniana was the dominant species in the region with the highest nutrient level. These findings are consistent with our results. TN and AL were the significant variables for the macroinvertebrate assemblage in the Wei River basin. The richness and diversity indices and assemblage structure were correlated with nutrient variables, suggesting that the macroinvertebrates could be indicators of nutrition status in the Wei River basin. Limnodrilus was extensively adaptable to the environment and often acted as the dominant species in impaired stations. Because of the extreme tolerance of this species, it generally indicated poor water quality [46,47,48,49]. In this study, Limnodrilus was strongly positively associated with TP, TN and COD, consistent with previous studies [48,49]. In addition, QH, TP, DO and GL were all significantly correlated with the fish assemblages in the Wei River basin. Wu et al. [50] demonstrated that Triplophysa was the dominant species at altitudes over 800 m, corresponding to locations at the origin of the river in the Wei River basin, which generally present good water quality. Our results showed that Triplophysa minxianensis was associated with QH and DO, which was in agreement with the results of Wu et al. [50]. Moreover, the fish indices and assemblage structure were strongly correlated with physiochemical variables and land use types, suggesting that fish could be considered the “best” organism for indicating the degree of pollution in the Wei River basin. Uncertainty was inevitable in the sampling process. We investigated only twice at different hydrological periods. The physiochemical parameters were easily affected by discharge and anthropogenic activities as well as biological assemblages, and this likely affects the relationships between biological indices and environmental variables. More investigation events would be required for future research.
5. Conclusions
This study demonstrated the response of fish, macroinvertebrate, and diatom assemblages to four land use types and six physiochemical variables in the Wei River basin. According to our results, diatoms were weakly associated with nutrient variables compared with macroinvertebrates and fish; however, macroinvertebrate indices and assemblages were significantly correlated with TP, TN, and AL, suggesting that they represented powerful indicators of the nutrient level in the Wei River basin. The fish indices and assemblage structure were strongly correlated with all variables but AL, TN, and COD, indicating that fish could adequately reflect spatial changes, such as the changes in land use type, in the Wei River basin. In conclusion, diatoms are not a good indicator in routine monitoring programs in the Wei River basin, macroinvertebrates could be beneficial for indicating the nutrient level, and fish represent the best indicator of spatial changes in the Wei River basin.
Author Contributions
Individual contributions of authors was as follows: Conceptualization, Z.X. and L.L.; methodology, L.L.; writing-original draft preparation, L.L.; writing-review and editing, Z.X.; investigation, X.Y. and W.W.; funding acquisition, Z.Z., F.Y. and J.L. All authors have read and agreed to the published version of the manuscript.
Funding
This study was supported by the National Natural Science Foundation of China (51279005) and Project for Science and Technology Innovation Guidance Fund of Hebei Provincial Department of Science and Technology.
Acknowledgments
The authors would like to thank Xuwang Yin for organizing the sampling survey and his colleagues for collecting and identifying the aquatic organisms.
Conflicts of Interest
The authors declare no conflict of interest.
Appendix A. The Distribution of Diatom Assemblage in the W, J, and BL Catchments

Table A1.
The list of diatom species in Wei River basin.
| ID | Species | W | J | BL |
|---|---|---|---|---|
| D1 | Melosira varians | + | + | |
| D2 | Melosira granulata | + | + | + |
| D3 | Melosira granulata var. angustissima | + | ||
| D4 | Navicula lanceolata | + | + | + |
| D5 | Navicula exigua Krasske | + | + | |
| D6 | Navicula confervacea | + | + | |
| D7 | Navicula cryptocephala | + | + | + |
| D8 | Navicula cryptocephala var. intermedia | + | + | + |
| D9 | Navicula cryptocephala var. venta | + | + | + |
| D10 | Navicula cincta | + | + | + |
| D11 | Navicula cincta var. leptocephala | + | + | + |
| D12 | Navicula cincta var. heufleri | + | ||
| D13 | Navicula pusilla | + | + | |
| D14 | Chamaepinnularia begeri | + | + | + |
| D15 | Navicula pupula | + | + | + |
| D16 | Navicula pupula var. capitata | + | + | + |
| D17 | Navicula cuspidata | + | ||
| D18 | Navicula cuspidata var. heribaudii | + | + | + |
| D19 | Navicula radiosq | + | + | + |
| D20 | Navicula cari | + | + | + |
| D21 | Navicula cari var. angusta | + | ||
| D22 | Navicula salinarum | + | ||
| D23 | Navicula viridula | + | + | + |
| D24 | Navicula viridula var. capitata | + | + | + |
| D25 | Navicula viridula var. pamirensis | + | + | |
| D26 | Navicula simplex | + | + | + |
| D27 | Navicula gothlandica | + | + | + |
| D28 | Navicula accommoda | + | + | + |
| D29 | Navicula rhynchocephala | + | + | |
| D30 | Navicula virihensis | + | + | + |
| D31 | Navicula menisculus | + | + | + |
| D32 | Naviclua anglica | + | ||
| D33 | Navicula exigua Ehr | + | ||
| D34 | Navicula gracilis | + | + | + |
| D35 | Navicula gracilis var. neglecta | + | + | |
| D36 | Navicula rostellata | + | + | |
| D37 | Navicula seminulum | + | ||
| D38 | Navicula seminuloides | + | + | + |
| D39 | Navicula | + | + | + |
| D40 | Navicula muralis | + | + | + |
| D41 | Navicula notha | + | + | + |
| D42 | Navicula halophilioides | + | + | + |
| D43 | Navicula scabellum | + | ||
| D44 | Navicula omissa | + | ||
| D45 | Navicula perrostrata | + | ||
| D46 | Navicula disjuncta | + | ||
| D47 | Navicula disjuncta f. anglica | + | ||
| D48 | Navicula minuscula | + | + | |
| D49 | Navicula placentula | + | ||
| D50 | Navicula asellus | + | ||
| D51 | Navicula dicephala | + | ||
| D52 | Navicula lenzii | + | ||
| D53 | Navicula rotaenea | + | ||
| D54 | Navicula virihensis | + | + | |
| D55 | Navicula hasta Pantocsek | + | ||
| D56 | Navicula protracta | + | ||
| D57 | Navicula protracta var. elliptica | + | ||
| D58 | Navicula adversa | + | ||
| D59 | Navicula tuscula | + | + | + |
| D60 | Navicula atomus | + | + | |
| D61 | Navicula permitis | + | + | + |
| D62 | Navicula nivaloides | + | ||
| D63 | Navicula virihensis | + | ||
| D64 | Navicula virihensis | + | ||
| D65 | Pinnularia appendiculata var. budensis | + | + | + |
| D66 | Pinnularia molaris | + | + | |
| D67 | Pinnularia bogotensis | + | ||
| D68 | Hantzschia amphioxys | + | + | |
| D69 | Hantzschia amphioxys var. aequalis | + | ||
| D70 | Meridion circulare | + | + | |
| D71 | Nitzschia obtusa var. scalpelliformis | + | ||
| D72 | Nitzschia palea | + | + | + |
| D73 | Nitzschia acicularis | + | + | + |
| D74 | Nitzschia hantzschiana | + | ||
| D75 | Nitzschia frustulum | + | + | |
| D76 | Nitzschia frustulum var. perpusilla | + | ||
| D77 | Nitzschia frustulum var. perminuta | + | ||
| D78 | Nitzschia frustulum var. subsalina | + | + | + |
| D79 | Nitzschia recta | + | + | + |
| D80 | Nitzschia dissipata | + | + | + |
| D81 | Nitischia constricta | + | + | + |
| D82 | Nitzschia hungarica | + | + | |
| D83 | Nitzschia sigmoides | + | + | |
| D84 | Nitzschia linearis | + | + | + |
| D85 | Nitzschia microcephala | + | + | + |
| D86 | Nitzschia heuflerana | + | ||
| D87 | Nitzschia stagnorum | + | + | |
| D88 | Nitzschia fonticola | + | + | + |
| D89 | Nitzschia ovalis | + | + | |
| D90 | Nitzschia paleacea | + | ||
| D91 | Nitzschia | + | + | + |
| D92 | Nitzschia thermalis | + | ||
| D93 | Nitzschia tryblionella var. victorise | + | + | + |
| D94 | Nitzschia tryblionella var. levidensis | + | ||
| D95 | Nitzschia commutata | + | ||
| D96 | Nitzschia acula | + | + | |
| D97 | Nitzschia debilis | + | + | |
| D98 | Nitzschia actinastroides | + | ||
| D99 | Nitzschia communis var. abbreviata | + | + | |
| D100 | Nitzschia heidenii | + | + | |
| D101 | Nitzschia angustata var. acuta | + | ||
| D102 | Nitzschia kuetzingiana | + | ||
| D103 | Nitzschia sinuata var. tabellaria | + | + | + |
| D104 | Nitzschia gracilis | + | + | + |
| D105 | Nitzschia romana | + | ||
| D106 | Nitzschia amphbia | + | + | |
| D107 | Nitzschia clausi | + | ||
| D108 | Nitzschia sublinearis | + | ||
| D109 | Stauroneis anceps | + | ||
| D110 | Stauroneis anceps var. linearis | + | ||
| D111 | Stauroneis schroederi | + | + | |
| D112 | Stauroneis dubitabilis | + | ||
| D113 | Stauroneis kriegeri | + | ||
| D114 | Stauroneis palustris | + | ||
| D115 | Rhoicosphenia curvata | + | + | |
| D116 | Amphora ovalis | + | + | + |
| D117 | Amphora ovalis var. gracilis | + | + | + |
| D118 | Amphora perpusilla | + | + | |
| D119 | Cymbella ehrenbergii | + | + | + |
| D120 | Cymbella sinnata | + | + | + |
| D121 | Cymbella microcephala | + | + | + |
| D122 | Cymbella pusilla | + | + | + |
| D123 | Cymbella cistula | + | + | + |
| D124 | Cymbella cistula var. maculata | + | + | |
| D125 | Cymbella cistula var. caldostagnensis | + | ||
| D126 | Encyonema ventricosum | + | + | + |
| D127 | Cymbella ventricosa var. simicircularis | + | + | |
| D128 | Cymbella amphicephala | + | + | + |
| D129 | Cymbella amphicephala var. intermedia | + | ||
| D130 | Cymbella aequalis | + | + | + |
| D131 | Cymbella tumidula | + | + | |
| D132 | Cymbella turgida | + | + | + |
| D133 | Cymbella turgidula | + | ||
| D134 | Cymbella aequalis | + | ||
| D135 | Cymbella aequalis var. pisciculus | + | + | + |
| D136 | Cymbella prostrata | + | + | + |
| D137 | Cymbella gaeumanni | + | + | |
| D138 | Cymbella sphaerophora | + | + | + |
| D139 | Cymbella cymbiformis | + | + | + |
| D140 | Cymbella perpusilla | + | + | |
| D141 | Cymbella bremii | + | + | |
| D142 | Cymbella lata | + | + | |
| D143 | Cymbella gracilis | + | ||
| D144 | Cymbella lunata | + | ||
| D145 | Cymbella excisa | + | ||
| D146 | Cymbella alpina var. minuta | + | ||
| D147 | Cymbella lapponica | + | ||
| D148 | Cymbella aspera | + | ||
| D149 | Cymbella hustedtii | + | + | |
| D150 | Cymbella jolmolungnensis | + | ||
| D151 | Cymbella hauckii | + | ||
| D152 | Cymbella parva | + | ||
| D153 | Cymbella hybrida | + | + | + |
| D154 | Cymbella helvatica | + | ||
| D155 | Diatoma vulgare | + | + | + |
| D156 | Diatoma vulgare var. lineare | + | + | + |
| D157 | Diatoma vulgare var. producta | + | + | + |
| D158 | Diatoma anceps | + | ||
| D159 | Diatoma elongata | + | ||
| D160 | Diatoma elongata var. tenuis | + | + | + |
| D161 | Diatoma hiemale | + | ||
| D162 | Gomphonema parvulum | + | + | + |
| D163 | Gomphonema parvulum var. subellipticum | + | + | + |
| D164 | Gomphonema parvulum var. exilissima | + | + | |
| D165 | Gomphonema angustatum | + | + | + |
| D166 | Gomphonema angustatum var. aequalis | + | ||
| D167 | Gomphonema intricatum | + | + | + |
| D168 | Gomphonema intricatum var. dichotomiformis | + | + | + |
| D169 | Gomphonema olivaceum | + | + | + |
| D170 | Gomphonema olivaceum var. minutissima | + | ||
| D171 | Gomphonema turris | + | ||
| D172 | Gomphonema gracile | + | + | + |
| D173 | Gomphonema gracile var. intricatiformis | + | + | |
| D174 | Gomphonema constrictum | + | + | + |
| D175 | Gomphonema montanum | + | + | |
| D176 | Gomphonema sphaerophorum | + | + | + |
| D177 | Gomphonema | + | ||
| D178 | Gomphonema tergestium | + | ||
| D179 | Achnanthes lanceolata | + | ||
| D180 | Achnanthes lanceolata f. ventricosa | + | + | + |
| D181 | Achnanthes linearis | + | + | |
| D182 | Achnanthidium minutissimum | + | + | + |
| D183 | Achnanthidium minutissimum var. cryptocephala | + | + | + |
| D184 | Achnanthes amphicephala | + | + | |
| D185 | Achnanthes hauckiana | + | + | + |
| D186 | Achnanthes tibetica | + | ||
| D187 | Achnanthes affinis | + | + | + |
| D188 | Achnanthes delicatula | + | + | |
| D189 | Achnanthes montana | + | + | + |
| D190 | Achnanthes crassa | + | + | + |
| D191 | Achnanthes exilis | + | ||
| D192 | Achnanthes subhudsonis | + | ||
| D193 | Achnanthes conspicua | + | ||
| D194 | Achnanthes clevei | + | ||
| D195 | Achnanthes nodosa | + | ||
| D196 | Achnanthes microcephala | + | + | |
| D197 | Cocconeis pediculus | + | + | + |
| D198 | Cocconeis placentula | + | + | + |
| D199 | Fragilaria capucina | + | + | |
| D200 | Fragilaria capucina var. mesolepta | + | ||
| D201 | Fragilaria var. subsalina | + | + | + |
| D202 | Fragilaria ungeriana | + | ||
| D203 | Fragilaria intermedia | + | ||
| D204 | Fragilaria vaucheriae var. capitellata | + | ||
| D205 | Fragilaria virescens var. mesolepta | + | ||
| D206 | Synedra acus | + | + | |
| D207 | Synedra acus var. radians | + | ||
| D208 | Synedra ulna | + | + | + |
| D209 | Synedra ulna var. danica | + | + | + |
| D210 | Synedra ulna var. contracta | + | + | + |
| D211 | Synedra ulna var. oxyrhnchus | + | + | |
| D212 | Synedra amphicephala | + | ||
| D213 | Surirella subsalsa | + | ||
| D214 | Surirella tibetica | + | + | + |
| D215 | Surirella ovalis | + | ||
| D216 | Surirella ovalis var. salina | + | + | + |
| D217 | S.brebissonii | + | + | + |
| D218 | Surirella | + | ||
| D219 | Surirella robusta | + | ||
| D220 | Surirella capronii | + | ||
| D221 | Surirella angusta | + | + | |
| D222 | Cyclotella stelligera | + | + | + |
| D223 | Cyclotella meneghiniana | + | + | + |
| D224 | Cyclotella kuetzingiana | + | + | + |
| D225 | Pantocsekiella ocellata | + | + | + |
| D226 | Cyclotella catenata | + | + | + |
| D227 | Cyclotella asterocostata | + | ||
| D228 | Gyrosigma scalproides | + | + | + |
| D229 | Gyrosigma acuminatum | + | + | |
| D230 | Gyrosigma attenuatum | + | ||
| D231 | Gyrosigma kuetzingii | + | + | + |
| D232 | Cymatopleuta solea | + | + | |
| D233 | Diploneis elliptica | + | ||
| D234 | Diploneis ovalis | + | + | |
| D235 | Diploneis pseudovalis | + | ||
| D236 | Neidium kozlowi var. elliptica | + | ||
| D237 | Neidium iridis var. ampliatum | + | ||
| D238 | Stephanodiscus minutulus | + | ||
| D239 | Ceratoneis arcus | + | + | + |
| D240 | Ceratoneis arcus var. linearis | + | + | + |
| D241 | Ceratoneis arcus var. linearis f.recta | + | ||
| D242 | Ceratoneis arcus var. amphioxys | + | ||
| D243 | Caloneis alpestris var. lanceolata | + | ||
| D244 | Caloneis bacilaria | + | ||
| D245 | Caloneis amphisbaena | + | ||
| D246 | Amphiraphia xizangensis | + | ||
| D247 | Rhopalodia gibba | + | ||
| D248 | Amphipleura pellucida | + | + | |
| D249 | Didymosphenia geminata | + | ||
| D250 | Denticula elegans | + | ||
| D251 | Frustulia vulgaris | + |
Appendix B. The Distribution of Macroinvertebrate Assemblage in the W, J, and BL Catchments
Table A2.
The list of macroinvertebrate species in Wei River basin.
| ID | Species | W | J | BL |
|---|---|---|---|---|
| B1 | Baetidae Analetridae | + | + | + |
| B2 | Baetis vaillanti | + | + | + |
| B3 | Serratellasp. | + | + | + |
| B4 | Leptophlebiasp. | + | + | + |
| B5 | Cinygmasp. | + | + | |
| B6 | Polymitarcyidae | + | ||
| B7 | Epeorsu curvispinosa | + | ||
| B8 | Chromarcyssp. | + | ||
| B9 | Ephemera nigroptera | + | ||
| B10 | Osobenussp. | + | + | |
| B11 | Hydropsychesp. | + | + | + |
| B12 | Brunnea larva | |||
| B13 | Dolophilodes sp. | + | ||
| B14 | Austrotinodessp. | + | ||
| B15 | Tipulasp. | + | ||
| B16 | Antochasp. | + | ||
| B17 | Tabanussp. | + | + | |
| B18 | Natarsia punctata | |||
| B19 | Ablabesmyia phatta | + | ||
| B20 | Procladius choreus | + | + | + |
| B21 | Conchapelopia sp. | + | + | + |
| B22 | Polypedilum scalaenum | + | ||
| B23 | Procladius paradouxus | + | ||
| B24 | Orthocaladius mixtus | + | ||
| B25 | Orthocladius makabensis Sasa | + | + | |
| B26 | Cricotopus albiforceps | + | ||
| B27 | Cricotopus trifasciatus | + | + | + |
| B28 | Cricotopus triannulatus | + | + | + |
| B29 | Cricotopus bicinctus | + | + | |
| B30 | Paracricotopus sp. | + | + | |
| B31 | Cricotopus anulator Goetghebuer | + | ||
| B32 | Diplocladius Kieffer | + | ||
| B33 | Rheocricotopus fuscipes | + | + | |
| B34 | Rheocricotopus effuses | + | ||
| B35 | Paratrichocladius rufivertris | + | ||
| B36 | Rheotanytarsus sp. | + | ||
| B37 | Chironomus riparius Meigen | + | + | + |
| B38 | Chironomus salinarius Kiffer | + | + | |
| B39 | Thienmanniola sp. | + | + | + |
| B40 | Chironomus sp. | + | + | + |
| B41 | Polypedilum paraviceps Niitsuma | + | + | |
| B42 | Micropesectra atrofasciata | + | + | |
| B43 | Cyphomella cornea | + | ||
| B44 | Antocha bifida Alexander | + | ||
| B45 | Sympotthastia takatensis | + | ||
| B46 | Lappodiamesa sp. | + | + | |
| B47 | Simuliumsp. | + | + | + |
| B48 | Sciomyzidae sp. | + | + | |
| B49 | Psychodasp. | + | + | + |
| B50 | Liodessussp. | + | ||
| B51 | Hydrous sp. | + | ||
| B52 | Stenelmis sp adult | + | + | + |
| B53 | Gomphussp. | + | + | |
| B54 | Gomphidae sp. | + | + | |
| B55 | Aeschna sp. | + | ||
| B56 | Pontamalota sp. | + | ||
| B57 | Epitheca.marginata | |||
| B58 | Radix clessini | + | + | |
| B59 | Radix ovata | + | + | + |
| B60 | physa acuta cf. | + | + | |
| B61 | Polypylis hemisphaerula | + | + | |
| B62 | Bellamya aeruginosa | + | ||
| B63 | Schistodesmus lampreyanus | + | + | |
| B64 | Limnodrilus hoffmeisteri | + | + | + |
| B65 | Branchiura sowerbyi | + | ||
| B66 | Limnodrilus claparedianus | + | + | |
| B67 | Tubifex sinicus | + | + | |
| B68 | Whitmania pigra | + | ||
| B69 | Barbronia weberi | + | ||
| B70 | Gammarussp. | + | + | |
| B71 | Sinopotamidae.sp | + | + | |
| B72 | Exopalaemon modestus | + | + | |
| B73 | Macrobrachium nipponense de Haan | + |
Appendix C. The Distribution of Fish Assemblage in the W, J, and BL Catchments
Table A3.
The list of fish species in Wei River basin.
| ID | Species | W | J | BL |
|---|---|---|---|---|
| F1 | Protosalanx hyalocranius | + | ||
| F2 | Paracobitis variegates | + | ||
| F3 | Triplophysa dalaica | + | + | + |
| F4 | Triplophysa sellaefer | + | + | + |
| F5 | Triplophysa shaanxiensis | + | + | + |
| F6 | Triphysa stoliczkae | + | + | + |
| F7 | Triplopphysa bleekeri | + | + | + |
| F8 | Triplophysa robusta | + | + | + |
| F9 | Triplophysa stoliczkae dorsonotata | + | + | + |
| F10 | Triplophysa kungessana orientalis | + | + | |
| F11 | Triplophysa pappenheimi | + | + | + |
| F12 | Triplophysa sp. | + | ||
| F13 | Botia superciliaris | + | ||
| F14 | Cobitis granoei | + | ||
| F15 | Misgurnus anguillicaudatus | + | + | + |
| F16 | Paramisgurnus dabryyanus | + | + | |
| F17 | Opasariichthys bidens | + | + | + |
| F18 | Brachymystax lenok | + | ||
| F19 | Phoxinus lagowskii | + | + | + |
| F20 | Rhodeus sinensis | + | + | |
| F21 | Rhoaeus lighti | + | + | + |
| F22 | Hemiculter leucisculus | + | + | |
| F23 | Belligobio nummifer | + | + | |
| F24 | Oryzias latipes | + | + | |
| F25 | Pseudorasbora parva | + | + | + |
| F26 | Gnathopogon imberbis | + | + | |
| F27 | Huigobio chinssuensis | + | ||
| F28 | Gobio rivuloides | + | ||
| F29 | Abbottina rivularis | + | + | + |
| F30 | Sarcocheilichthys nigripinnis | + | ||
| F31 | Huigobio chinssuensis | + | + | + |
| F32 | Scaphesthes macrolepis | + | ||
| F33 | Gymnodiptychus pachycheilus weiheensis | + | ||
| F34 | Schizopygopsis pylzovi | + | ||
| F35 | Cyprinus carpio | + | ||
| F36 | Carassius auratus | + | + | + |
| F37 | Silurus asotus | + | + | + |
| F38 | Pelteobagrus nitidus | + | ||
| F39 | Hypseleotris swinhonis | + | + | |
| F40 | Ctenogobius cliffordpopei | + | + | + |
| F41 | Ctenogobius brunneus | + | + | + |
| F42 | Ctenogobius gymnauchen | + | + | |
| F43 | Ctenogobius shennongensis | + | + | |
| F44 | Ctenogobius giurinus | + | + | |
| F45 | Channa argus | + |
References
- Cooper, S.D.; Lake, P.S.; Sabater, S.; Melack, J.M.; Sabo, J.L. The effects of land use changes on streams and rivers in mediterranean climates. Hydrobiologia 2013, 719, 383–425. [Google Scholar] [CrossRef]
- Kratzer, B.E.; Jackson, J.K.; Arscott, D.B.; Aufdenkampe, A.K.; Dow, C.L. Macroinvertebrate distribution in relation to land use and water chemistry in New York City drinking-water-supply watersheds. J. N. Am. Benthol. Soc. 2009, 25, 954–976. [Google Scholar] [CrossRef]
- Spnseller, R.A.; Benfield, E.F.; Valett, H.M. Relationships between land use, spatial scale and stream macroinvertebrate communities. Freshw. Biol. 2001, 46, 1409–1424. [Google Scholar] [CrossRef] [Green Version]
- Vázquez, G.; Aké-Castillo, J.A.; Favila, M.E. Algal assemblages and their relationship with water quality in tropical Mexican streams with different land uses. Hydrobiologia 2011, 667, 173–189. [Google Scholar] [CrossRef]
- Dahm, V.; Hering, D.; Nemitz, D.; Graf, W.; Schmidt-Kloiber, A.; Leitner, P.; Melcher, A.; Feld, C.K. Effects of physico-chemistry, land use and hydromorphology on three riverine organism groups: A comparative analysis with monitoring data from Germany and Austria. Hydrobiologia 2013, 704, 389–415. [Google Scholar] [CrossRef]
- Miserendino, M.L.; Casaux, R.; Archangelsky, M.; di Prinzio, C.Y.; Brand, C.; Kutschker, A.M. Assessing land-use effects on water quality, in-stream habitat, riparian ecosystems and biodiversity in Patagonian northwest streams. Sci. Total Environ. 2011, 409, 612–624. [Google Scholar] [CrossRef]
- Villeneuve, B.; Souchon, Y.; Usseglio-Polatera, P.; Ferréol, M.; Valette, L. Can we predict biological condition of stream ecosystems? A multi-stressors approach linking three biological indices to physico-chemistry, hydromorphology and land use. Ecol. Indic. 2015, 48, 88–98. [Google Scholar] [CrossRef]
- Feld, C.K. Response of three lotic assemblages to riparian and catchment-scale land use: Implications for designing catchment monitoring programmes. Freshw. Biol. 2013, 58, 715–729. [Google Scholar] [CrossRef]
- Nerbonne, B.A.; Vondracek, B. Effects of local land use on physical habitat, benthic macroinvertebrates, and fish in the Whitewater River, Minnesota, USA. Environ. Manag. 2001, 28, 87–99. [Google Scholar] [CrossRef]
- Theodoropoulos, C.; Aspridis, D.; Iliopoulou-Georgudaki, J. The influence of land use on freshwater macroinvertebrates in a regulated and temporary Mediterranean river network. Hydrobiologia 2015, 751, 201–213. [Google Scholar] [CrossRef]
- Booth, D.B.; Karr, J.R.; Schauman, S.; Konrad, C.P.; Morley, S.A.; Larson, M.G.; Burges, S.J. Reviving urban streams: Land use, hydrology, biology, and human behavior. J. Am. Water Resour. Assoc. 2004, 40, 1351–1364. [Google Scholar] [CrossRef]
- Ding, J.; Jiang, Y.; Liu, Q.; Hou, Z.; Liao, J.; Fu, L.; Peng, Q. Influences of the land use pattern on water quality in low-order streams of the Dongjiang River basin, China: A multi-scale analysis. Sci. Total Environ. 2016, 551–552, 205–216. [Google Scholar] [CrossRef] [PubMed]
- Castello, L.; Macedo, M.N. Large-scale degradation of Amazonian freshwater ecosystems. Glob. Chang. Biol. 2016, 22, 990–1007. [Google Scholar] [CrossRef] [PubMed]
- Tong, S.T.Y.; Chen, W. Modeling the relationship between land use and surface water quality. J. Environ. Manag. 2002, 66, 377–393. [Google Scholar] [CrossRef] [PubMed]
- Aparicio, E.; Carmona-Catot, G.; Moyle, P.B.; García-Berthou, E. Development and evaluation of a fish-based index to assess biological integrity of Mediterranean streams. Aquat. Conserv. Mar. Freshw. Ecosyst. 2011, 21, 324–337. [Google Scholar] [CrossRef]
- Tan, X.; Ma, P.; Bunn, S.E.; Zhang, Q. Development of a benthic diatom index of biotic integrity (BD-IBI) for ecosystem health assessment of human dominant subtropical rivers, China. J. Environ. Manag. 2015, 151, 286–294. [Google Scholar] [CrossRef]
- Van Ael, E.; de Cooman, W.; Blust, R.; Bervoets, L. Use of a macroinvertebrate based biotic index to estimate critical metal concentrations for good ecological water quality. Chemosphere 2015, 119, 138–144. [Google Scholar] [CrossRef]
- Almeida, D.; Alcaraz-Hernández, J.D.; Merciai, R.; Benejam, L.; García-Berthou, E. Relationship of fish indices with sampling effort and land use change in a large Mediterranean river. Sci. Total Environ. 2017, 605–606, 1055–1063. [Google Scholar] [CrossRef]
- Urbanič, G.; Mihaljević, Z.; Petkovska, V.; Pavlin Urbanić, M. Disentangling the effects of multiple stressors on large rivers using benthic invertebrates—A study of Southeastern European large rivers with implications for management. Water 2020, 12, 621. [Google Scholar] [CrossRef] [Green Version]
- Wang, H.L.; Wan, A.; Zhang, X.K. The effect of land use type on the macroinvertebrate assemblage in Wannan mountain area, China. J. Suzhou Univ. 2015, 30, 110–113. [Google Scholar]
- Li, J.L.; Jin, W.; Wang, B.H.; Xiang, Z.L.; Yin, X.W.; Xu, Z.X.; Zhang, Y. Relationship between land use types within riparian zones and community structure of diatom in Taizi River, China. Res. Environ. Sci. 2015, 28, 1662–1669. [Google Scholar]
- Wu, W.; Xu, Z.; Kennard, M.J.; Yin, X.; Zuo, D. Do human disturbance variables influence more on fish community structure and function than natural variables in the Wei River basin, China? Ecol. Indic. 2016, 61, 438–446. [Google Scholar] [CrossRef]
- Yu, S.; Xu, Z.; Wu, W.; Zuo, D. Effect of land use types on stream water quality under seasonal variation and topographic characteristics in the Wei River basin, China. Ecol. Indic. 2016, 60, 202–212. [Google Scholar] [CrossRef]
- Zuo, D.; Xu, Z.; Wu, W.; Zhao, J.; Zhao, F. Identification of Streamflow Response to Climate Change and Human Activities in the Wei River Basin, China. Water Resour. Manag. 2014, 28, 833–851. [Google Scholar] [CrossRef]
- Zuo, D.; Xu, Z.; Peng, D.; Song, J.; Cheng, L.; Wei, S.; Abbaspour, K.C.; Yang, H. Simulating spatiotemporal variability of blue and green water resources availability with uncertainty analysis. Hydrol. Process. 2015, 29, 1942–1955. [Google Scholar] [CrossRef]
- Mangadze, T.; Bere, T.; Mwedzi, T. Choice of biota in stream assessment and monitoring programs in tropical streams: A comparison of diatoms, macroinvertebrates and fish. Ecol. Indic. 2016, 63, 128–143. [Google Scholar] [CrossRef]
- Lin, G.Y. Fauna Sinica: Phylum Mollusca, Class Gastropoda, Subclass Opisthobranchia, Order Cephalaspidea; Science Press: Beijing, China, 1997. [Google Scholar]
- Wang, J.C.; Wang, X.H. Chironomus Larvae in Northern China; China Yan Shi Press: Beijing, China, 2011. [Google Scholar]
- Yang, T. Fauna Sinica: Annelida, Hirudinea; Science Press: Beijing, China, 2002. [Google Scholar]
- Hu, H.J.; Wei, Y.X. The Freshwater Algae of China: Systematics, Taxonomy and Ecology; Science Press: Beijing, China, 2006. [Google Scholar]
- Zhu, H.Z.; Chen, J.Y. China Tibet Diatoms; Science Press: Beijing, China, 2000. [Google Scholar]
- Barbour, M.T.; Gerritsen, J.; Snyder, B.D.; Stribling, J.B. Rapid Bioassessment Protocols for Use in Streams and Wadeable Rivers: Periphyton, Benthic Macroinvertebrates and Fish; US Environmental Protection Agency, Office of Water: Washington, DC, USA, 1999.
- Wu, Z.; Wang, X.; Chen, Y.; Cai, Y.; Deng, J. Assessing river water quality using water quality index in Lake Taihu Basin, China. Sci. Total Environ. 2018, 612, 914–922. [Google Scholar] [CrossRef]
- Fonseca, D.G.; Tanaka, M.O. Influence of an exotic grass on benthic macroinvertebrate communities in a tropical rural landscape. Hydrobiologia 2015, 762, 239–251. [Google Scholar] [CrossRef]
- Hlúbiková, D.; Novais, M.H.; Dohet, A.; Hoffmann, L.; Ector, L. Effect of riparian vegetation on diatom assemblages in headwater streams under different land uses. Sci. Total Environ. 2014, 475, 234–247. [Google Scholar] [CrossRef]
- Longyang, Q. Assessing the effects of climate change on water quality of plateau deep-water lake-A study case of Hongfeng Lake. Sci. Total Environ. 2019, 647, 1518–1530. [Google Scholar] [CrossRef]
- Pardo, I.; Delgado, C.; Abraín, R.; Gómez-Rodríguez, C.; García-Roselló, E.; García, L.; Reynoldson, T.B. Apredictive diatom-based model to assess the ecological status of streams and rivers of Northern Spain. Ecol. Indic. 2018, 90, 519–528. [Google Scholar] [CrossRef]
- Petersen, C.R.; Jovanovic, N.Z.; Grenfell, M.C.; Oberholster, P.J.; Cheng, P. Responses of aquatic communities to physical and chemical parameters in agriculturally impacted coastal river systems. Hydrobiologia 2018, 813, 157–175. [Google Scholar] [CrossRef]
- Shen, R.; Ren, H.; Yu, P.; You, Q.; Pang, W.; Wang, Q. Benthic Diatoms of the Ying River (Huaihe River Basin, China) and Their Application in Water Trophic Status Assessment. Water 2018, 10, 1013. [Google Scholar] [CrossRef] [Green Version]
- Wang, L.; Pan, Y.; Cao, Y.; Li, B.; Wang, Q.; Wang, B.; Pang, W.; Zhang, J.; Zhu, Z.; Deng, G. Detecting early signs of environmental degradation in protected areas: An example of Jiuzhaigou Nature Reserve, China. Ecol. Indic. 2018, 91, 287–298. [Google Scholar] [CrossRef]
- Szczepocka, E.; Krawczyk, P.N.; Kruk, A. Deceptive ecological status of urban streams and rivers—evidence from diatom indices. Ecosphere 2018, 9, e02310. [Google Scholar] [CrossRef]
- Zhang, Y.; Cheng, L.; Tolonen, K.E.; Yin, H.; Gao, J.; Zhang, Z.; Li, K.; Cai, Y. Substrate degradation and nutrient enrichment structuring macroinvertebrate assemblages in agriculturally dominated Lake Chaohu Basins, China. Sci. Total Environ. 2018, 627, 57–66. [Google Scholar] [CrossRef]
- Maceda-Veiga, A.; Nally, R.M.; de Sostoa, A. Water-quality impacts in semi-arid regions: Can natural ‘green filters’ mitigate adverse effects on fish assemblages? Water Res. 2018, 144, 628–641. [Google Scholar] [CrossRef]
- Maceda-Veiga, A.; Nally, R.M.; de Sostoa, A. Environmental correlates of food-chain length, mean trophic level and trophic level variance in invaded riverine fish assemblages. Sci. Total Environ. 2018, 644, 420–429. [Google Scholar] [CrossRef]
- Delgado, C.; Pardo, I. Comparison of benthic diatoms from Mediterranean and Atlantic Spanish streams: Community changes in relation to environmental factors. Aquat. Bot. 2015, 120, 304–314. [Google Scholar] [CrossRef]
- Meador, M.R.; Frey, J.W. Relative Importance of Water-Quality Stressors in Predicting Fish Community Responses in Midwestern Streams. J. Am. Water Resour. Assoc. 2018, 54, 708–723. [Google Scholar] [CrossRef]
- Xu, M.; Wang, Z.; Duan, X.; Pan, B. Effects of pollution on macroinvertebrates and water quality bio-assessment. Hydrobiologia 2014, 729, 247–259. [Google Scholar] [CrossRef]
- Yoshimura, C.; Tockner, K.; Omura, T.; Moog, O. Species diversity and functional assessment of macroinvertebrate communities in Austrian rivers. Limnology 2006, 7, 63–74. [Google Scholar] [CrossRef]
- Zhang, Y.; Liu, L.; Cheng, L.; Cai, Y.; Yin, H.; Gao, J.; Gao, Y. Macroinvertebrate assemblages in streams and rivers of a highly developed region (Lake Taihu Basin, China). Aquat. Biol. 2014, 23, 15–28. [Google Scholar] [CrossRef] [Green Version]
- Wu, W.; Xu, Z.X.; Yin, X.W.; Yu, S.Y. Fish community structure and the effect of environmental factors in the Wei River basin. Acta Sci. Circumstantiae 2014, 34, 1298–1308. [Google Scholar]
Figure 1.
Elevation of the Wei River basin.

Figure 2.
Sampling sites in the Wei River basin.

Figure 3.
Land use types of the Wei River basin.

Figure 4.
Distribution of the four land use types in the Wei River basin.

Figure 5.
Distribution of the four land use types at three catchments in the Wei River basin. (a): forestland (FL), (b): grassland (GL), (c): agricultural land (AL), (d): urban land (UL).
Figure 5.
Distribution of the four land use types at three catchments in the Wei River basin. (a): forestland (FL), (b): grassland (GL), (c): agricultural land (AL), (d): urban land (UL).

Figure 6.
Distribution of physiochemical variables (QHEI, DO, EC, TN, TP, COD) at each catchment in the Wei River basin.
Figure 6.
Distribution of physiochemical variables (QHEI, DO, EC, TN, TP, COD) at each catchment in the Wei River basin.

Figure 7.
Distribution of three biotic indicators of diatom, macroinvertebrate and fish assemblages at each catchment in the Wei River basin. DR: diatom richness, MR: macroinvertebrate richness, FR: fish richness.
Figure 7.
Distribution of three biotic indicators of diatom, macroinvertebrate and fish assemblages at each catchment in the Wei River basin. DR: diatom richness, MR: macroinvertebrate richness, FR: fish richness.

Figure 8.
Correlation matrix between environmental variables and biotic indicators in the Wei River basin (* p < 0.05). D: diatom, M: macroinvertebrate, F: fish, R: richness, N: abundance, S: Shannon diversity, E: evenness, M: Margalef diversity, and SI: Simpson diversity.
Figure 8.
Correlation matrix between environmental variables and biotic indicators in the Wei River basin (* p < 0.05). D: diatom, M: macroinvertebrate, F: fish, R: richness, N: abundance, S: Shannon diversity, E: evenness, M: Margalef diversity, and SI: Simpson diversity.

Figure 9.
Redundancy analysis (RDA) between diatom metrics and environmental variables and canonical correspondence analysis (CCA) of macroinvertebrate and fish metrics and environmental variables in the Wei River basin. See Appendix A, Appendix B and Appendix C for abbreviations of the diatom, macroinvertebrate and fish species.

Table 1.
Indicator species at each catchment in the Wei River basin. See Appendix A, Appendix B and Appendix C for abbreviations of the diatom, macroinvertebrate and fish species.
Table 1.
Indicator species at each catchment in the Wei River basin. See Appendix A, Appendix B and Appendix C for abbreviations of the diatom, macroinvertebrate and fish species.
| Catchments | ID | Species | Value | P |
|---|---|---|---|---|
| W Catchment | D126 | Encyonema ventricosum | 41.4 | 0.003 |
| D182 | Achnanthidium minutissimum | 41.1 | 0.004 | |
| F6 | Triplophysa minxianensis | 37.9 | 0.008 | |
| F14 | Cobitis granoei | 28.1 | 0.016 | |
| F27 | Huigobio chinssuensis | 25.0 | 0.019 | |
| F33 | Gobio coriparoides | 24.3 | 0.042 | |
| J Catchment | D225 | Pantocsekiella ocellata | 41.0 | 0.002 |
| F10 | Triplophysa kungessana orientalis | 37.3 | 0.004 | |
| BL Catchment | D159 | Diatoma elongata | 53.8 | 0.001 |
| D183 | Achnanthidium minutissimum var. cryptocephala | 43.6 | 0.001 | |
| D14 | Chamaepinnularia begeri | 42.6 | 0.003 | |
| D65 | Caloneis budensis | 29.2 | 0.005 | |
| D236 | Neidium kozlowi var. elliptica | 30.8 | 0.002 | |
| B25 | Orthocladius makabensis Sasa | 42.8 | 0.001 | |
| B33 | Rheocricotopus fuscipes | 27.5 | 0.005 | |
| B61 | Polypylis hemisphaerula | 17.7 | 0.038 | |
| B66 | Limnodrilus.claparedianus | 31.3 | 0.012 | |
| B71 | Sinopotamidae | 13.3 | 0.042 | |
| F26 | Gnathopogon imberbis | 30.9 | 0.035 |
Table 2.
Eigenvalues and species-environment correlations of each canonical axis.
| Axis | Diatom | Macroinvertebrate | Fish | |||
|---|---|---|---|---|---|---|
| Eigenvalues | Correlations | Eigenvalues | Correlations | Eigenvalues | Correlations | |
| Axis 1 | 0.054 | 0.816 | 0.201 | 0.751 | 0.298 | 0.763 |
| Axis 2 | 0.033 | 0.786 | 0.183 | 0.748 | 0.146 | 0.698 |
| Axis 3 | 0.026 | 0.753 | 0.124 | 0.757 | 0.092 | 0.660 |
| Axis 4 | 0.022 | 0.842 | 0.105 | 0.724 | 0.061 | 0.674 |
Table 3.
Results of the Monte Carlo permutation tests in redundancy analysis (RDA) and canonical correspondence analysis (CCA).
Table 3.
Results of the Monte Carlo permutation tests in redundancy analysis (RDA) and canonical correspondence analysis (CCA).
| Variable | Diatom | Macroinvertebrate | Fish | |||
|---|---|---|---|---|---|---|
| F | P | F | P | F | P | |
| QH | 2.88 | 0.001 | 1.15 | 0.251 | 3.84 | 0.001 |
| DO | 0.99 | 0.438 | 1.34 | 0.091 | 2.14 | 0.006 |
| EC | 0.93 | 0.596 | 0.91 | 0.596 | 1.03 | 0.405 |
| TN | 1.04 | 0.416 | 1.85 | 0.007 | 1.20 | 0.261 |
| TP | 0.67 | 0.886 | 1.05 | 0.401 | 2.05 | 0.028 |
| COD | 1.23 | 0.168 | 0.93 | 0.550 | 0.62 | 0.870 |
| FL | 1.51 | 0.024 | 1.08 | 0.366 | 1.17 | 0.240 |
| GL | 1.38 | 0.039 | 0.75 | 0.807 | 1.63 | 0.032 |
| AL | 1.20 | 0.172 | 1.51 | 0.044 | 1.10 | 0.326 |
| UL | 0.88 | 0.593 | 1.02 | 0.393 | 0.79 | 0.660 |
The bold numbers indicate that the variables had a significant influence on the biological assemblages.
Publisher’s Note: MDPI stays neutral with regard to jurisdictional claims in published maps and institutional affiliations. |
© 2020 by the authors. Licensee MDPI, Basel, Switzerland. This article is an open access article distributed under the terms and conditions of the Creative Commons Attribution (CC BY) license (http://creativecommons.org/licenses/by/4.0/).
Share and Cite
MDPI and ACS Style
Liu, L.; Xu, Z.; Yang, F.; Yin, X.; Wu, W.; Li, J. Comparison of Fish, Macroinvertebrates and Diatom Communities in Response to Environmental Variation in the Wei River Basin, China. Water 2020, 12, 3422. https://doi.org/10.3390/w12123422
AMA Style
Liu L, Xu Z, Yang F, Yin X, Wu W, Li J. Comparison of Fish, Macroinvertebrates and Diatom Communities in Response to Environmental Variation in the Wei River Basin, China. Water. 2020; 12(12):3422. https://doi.org/10.3390/w12123422
Chicago/Turabian StyleLiu, Linfei, Zongxue Xu, Fan Yang, Xuwang Yin, Wei Wu, and Jisheng Li. 2020. "Comparison of Fish, Macroinvertebrates and Diatom Communities in Response to Environmental Variation in the Wei River Basin, China" Water 12, no. 12: 3422. https://doi.org/10.3390/w12123422
Note that from the first issue of 2016, this journal uses article numbers instead of page numbers. See further details here.