Holistic Design Approach of a Throttled Surge Tank: The Case of Refurbishment of Gondo High-Head Power Plant in Switzerland


1
Platform of Hydraulic Constructions (PL-LCH), Ecole Polytechnique Fédérale De Lausanne, 1015 Lausanne, Switzerland
2
Alpiq SA, 1003 Lausanne, Switzerland
*
Author to whom correspondence should be addressed.
Water 2020, 12(12), 3440; https://doi.org/10.3390/w12123440
Submission received: 2 November 2020
/
Revised: 3 December 2020
/
Accepted: 5 December 2020
/
Published: 8 December 2020
(This article belongs to the Special Issue Advances and Challenges in Hydropower)
Abstract
:In order to increase the installed capacity, the refurbishment of Gondo high-head power plant required a modification of the existing surge tank by installing a throttle at its entrance. In a previous study, the geometry of this throttle was optimized by physical modeling to achieve the target loss coefficients as identified by a transient 1D numerical analysis. This study complements previous analyses by means of 3D numerical modeling using the commercial software ANSYS-CFX 19 R1. Results show that: (i) a 3D computational fluid dynamics (CFD) model predicts sufficiently accurate local head loss coefficients that agree closely with the findings of the physical model; (ii) in contrast to a standard surge tank, the presence of an internal gallery in the surge tank proved to be of insignificant effect on a surge tank equipped with a throttle, as the variations in the section of the tank cause negligible local losses compared to the ones induced by the throttle; (iii) CFD investigations of transient flow regimes revealed that the head loss coefficient of the throttle only varies for flow ratios below 20% of the total flow in the system, without significantly affecting the conclusions of the 1D transient analysis with respect to minimum and maximum water level in the surge tank as well as pressure peaks below the surge tank. This study highlights the importance of examining the characteristics of a hydraulic system from a holistic approach involving hybrid modeling (1D, 3D numerical and physical) backed by calibration as well as validation with in-situ measurements. This results in a more rapid and economic design of throttled surge tanks that makes full use of the advantages associated with each modeling strategy.
1. Introduction
Hydropower represents around 60% of the annual electricity production in Switzerland and is therefore fundamental to the electricity supply sector [1]. The Swiss energy strategy 2050 aims to abandon nuclear energy and develop renewable energy production. The intermittent energy production of the new renewables raised the need for an increase in hydropower production in order to sustain the grid balance. The hydropower production is planned to rise from 35.35 TWh (reference year 2011) to 38.60 TWh in 2050 [1]. Among the available options to increase the hydroelectric generation capacity is the refurbishment and rehabilitation of existing plants, such as high head power plants (hydraulic head > 200 m). Refurbishment of such plants often requires a modification of the existing surge tanks to handle the increase in generation capacity.
This study focuses on Gondo high-head power plant (HPP) in Switzerland, which has been subjected to a moderate increase of installed capacity in 2017. In a previous work, a 1D numerical transient analysis identified the need for installing a throttle at the bottom of the existing surge tank. The geometrical design of the throttle was optimized by means of physical modeling. The 1D numerical model was calibrated before the refurbishment with prototype measurements (water level variations in the surge tank, pressure variations at turbine inlets). It was subsequently validated after mounting the throttle. The aim of this study is to complement previous analyses by 3D numerical modeling in establish a consolidated design methodology of throttled surge tanks that includes all means of modeling and identify issues that may improve future designs of such tanks.
Refurbishing and extending an existing plant typically require an increase in the discharge rate, resulting in an increase in the maximum water level and a decrease in the minimum water level in the existing surge tank, for the same opening or closure time. If these extreme levels are not kept within the allowable limits of the tank geometry, a modification of the surge tank should be done. However, changing the surge tank geometry is often a difficult task if it has been already installed; it is also costly because the height of the surge tank directly affects the investment costs [2,3,4]. Throttling the surge tank can help restrain these extreme water levels since it provides a larger damping effect on mass oscillations [3,5,6,7]. Several studies have been performed in the last few years to investigate the performance of throttled surge tanks, and several types and configurations of throttles have been addressed. All these studies have confirmed that placing a throttle is a cost-effective measure to adapt hydroelectric power plants submitted to moderate increase of generation capacity [2,4,6,8,9].
The required throttle head losses in each flow direction are generally evaluated through a transient analysis and 1D numerical simulations of the critical load cases. However, the main issue lies in the design of the throttle itself, finding a geometry that produces the intended losses in each flow direction is often a complex task [2,6]. There exists a considerable body of literature on throttles, where the orifice type is addressed. Several authors derived analytical formulations to get head loss coefficients for orifices in one flow direction (mainly sharp flow direction) while others adapted or extended the existing ones to account for both flow directions for particular orifice shapes such as rounded or chamfered orifices [10]. Some analytical formulations are also available to estimate asymmetrical head losses in simple diaphragm configurations such as T-junctions [11]. However, when the layout of the power plant imposes a design far away from the analytical models, the geometry optimization should be done on a case-by-case basis: by physical scale modeling, 3D numerical simulations, or both. Nevertheless, one can still benefit from the analytical formulae to get an acceptable first estimation of the required contraction ratio (ratio between the cross-sectional surface of the opening and that of the pipe) at an early stage of the design process [7,9]. Some authors even argued that the 3D computational fluid dynamics (CFD) models could be used as a preliminary design step to physical modeling as it could help decrease the number of iterations in the physical model to achieve the required head losses [6,12].
Ultimately, a hybrid modeling approach using a combination of 1D numerical models, 3D CFD models along with physical models is strongly advised for an optimal design. Additionally, prototype calibration and validation tests are highly recommended for checking the transient performance of waterways after a refurbishment of turbines with increases in installed capacity [2]. Validation measurements may also help to enhance the confidence in numerical methods [7]. Table 1 summarizes the most recent studies conducted on throttled surge tanks and the means of investigation. In these studies, a physical model, a 1D transient model and/or a 3D CFD model was used to optimize or visualize the behavior of a surge tank throttle. Only one study used all means of modeling, yet lacked prototype calibration and validation of water level measurements in the surge tank and pressure variations at turbine inlets or other locations of interest in the system.
A number of questions regarding throttled surge tanks remain to be addressed. Studies conducted in this context were mainly done under steady-state conditions, hence the need to investigate the transient behavior of such devices as emphasized in [7,13]. Such investigation can highlight the variation of the head loss coefficient with the flow share: early studies conducted on T-sections [4,14] have provided experimental evidence that the head loss coefficient of a throttle k or Cd value of an orifice is not constant throughout the flow ratio (flow in the branch pipe divided by the flow upstream of the T-section under dividing flow conditions; flow in the branch pipe divided by the flow downstream of the T-section for combining flow conditions). This issue has been also highlighted in a recent study through CFD modeling [15]. However, in the authors’ opinion, and based on literature search, the effect of a varying throttle’s head loss coefficient with the flow share on the conclusions of a 1D transient analysis has not been investigated so far.
Another issue rarely investigated, is the case of surge tanks consisting of chambers connected with a connecting gallery. It may be interesting to evaluate the effect of such a gallery on the inward and outward head loss coefficients of the surge tank and subsequently, the predicted maximum and minimum water levels in the 1D numerical transient analysis.

Table 1.
Summary of existing studies on throttled surge tanks (extended from [2]).
Table 1.
Summary of existing studies on throttled surge tanks (extended from [2]).
| Goal | Physical Scale | 1D Numerical Simulation | 3D Numerical Simulation (CFD) | Prototype Validation | Source |
|---|---|---|---|---|---|
| Geometry optimization and flow visualization | Done | Not done | Done | Not done | [16] |
| Throttle optimization | Not done | Done | Not done | Not done | [17] |
| Throttle optimization | Not done | Not done | Done | Not done | [18] |
| Throttle optimization | Not done | Done | Not done | Not done | [19] |
| Flow visualization | Done | Not presented | Done | Not done | [12] |
| Geometry optimization and flow visualization | Done | Not done | Done | Not done | [13] |
| Geometry optimization | Done | Done | Not done | Not done | [9] |
| Geometry optimization | Done | Done | Not done | Not done | [3] |
| Geometry optimization and flow visualization | Done | Done | Done | Not done | [6] |
| Geometry optimization and flow visualization | Done | Not done | Done | Not done | [20] |
| Geometry optimization and flow visualization | Done | Not done | Done | Not done | [21] |
| Geometry optimization | Not done | Done | Not done | Not done | [22] |
| Geometry optimization and flow visualization | Done | Done | Done | Not done | [15] |
| Geometry optimization and flow visualization | Done | Done | Done | Done | Current study |
The goal of the CFD model developed for Gondo HPP is to: (i) validate and reciprocally being validated with the results of the physical model, (ii) investigate the impact of the connecting gallery and (iii) flow sharing on the head loss coefficients of the throttle. Finally, the study highlights the importance of assessing the renovation from a multilayer approach that includes all means of modeling (1D numerical, 3D numerical, and 3D physical) in addition to prototype measurement and calibration.
2. Materials and Methods
2.1. Case Study Summary
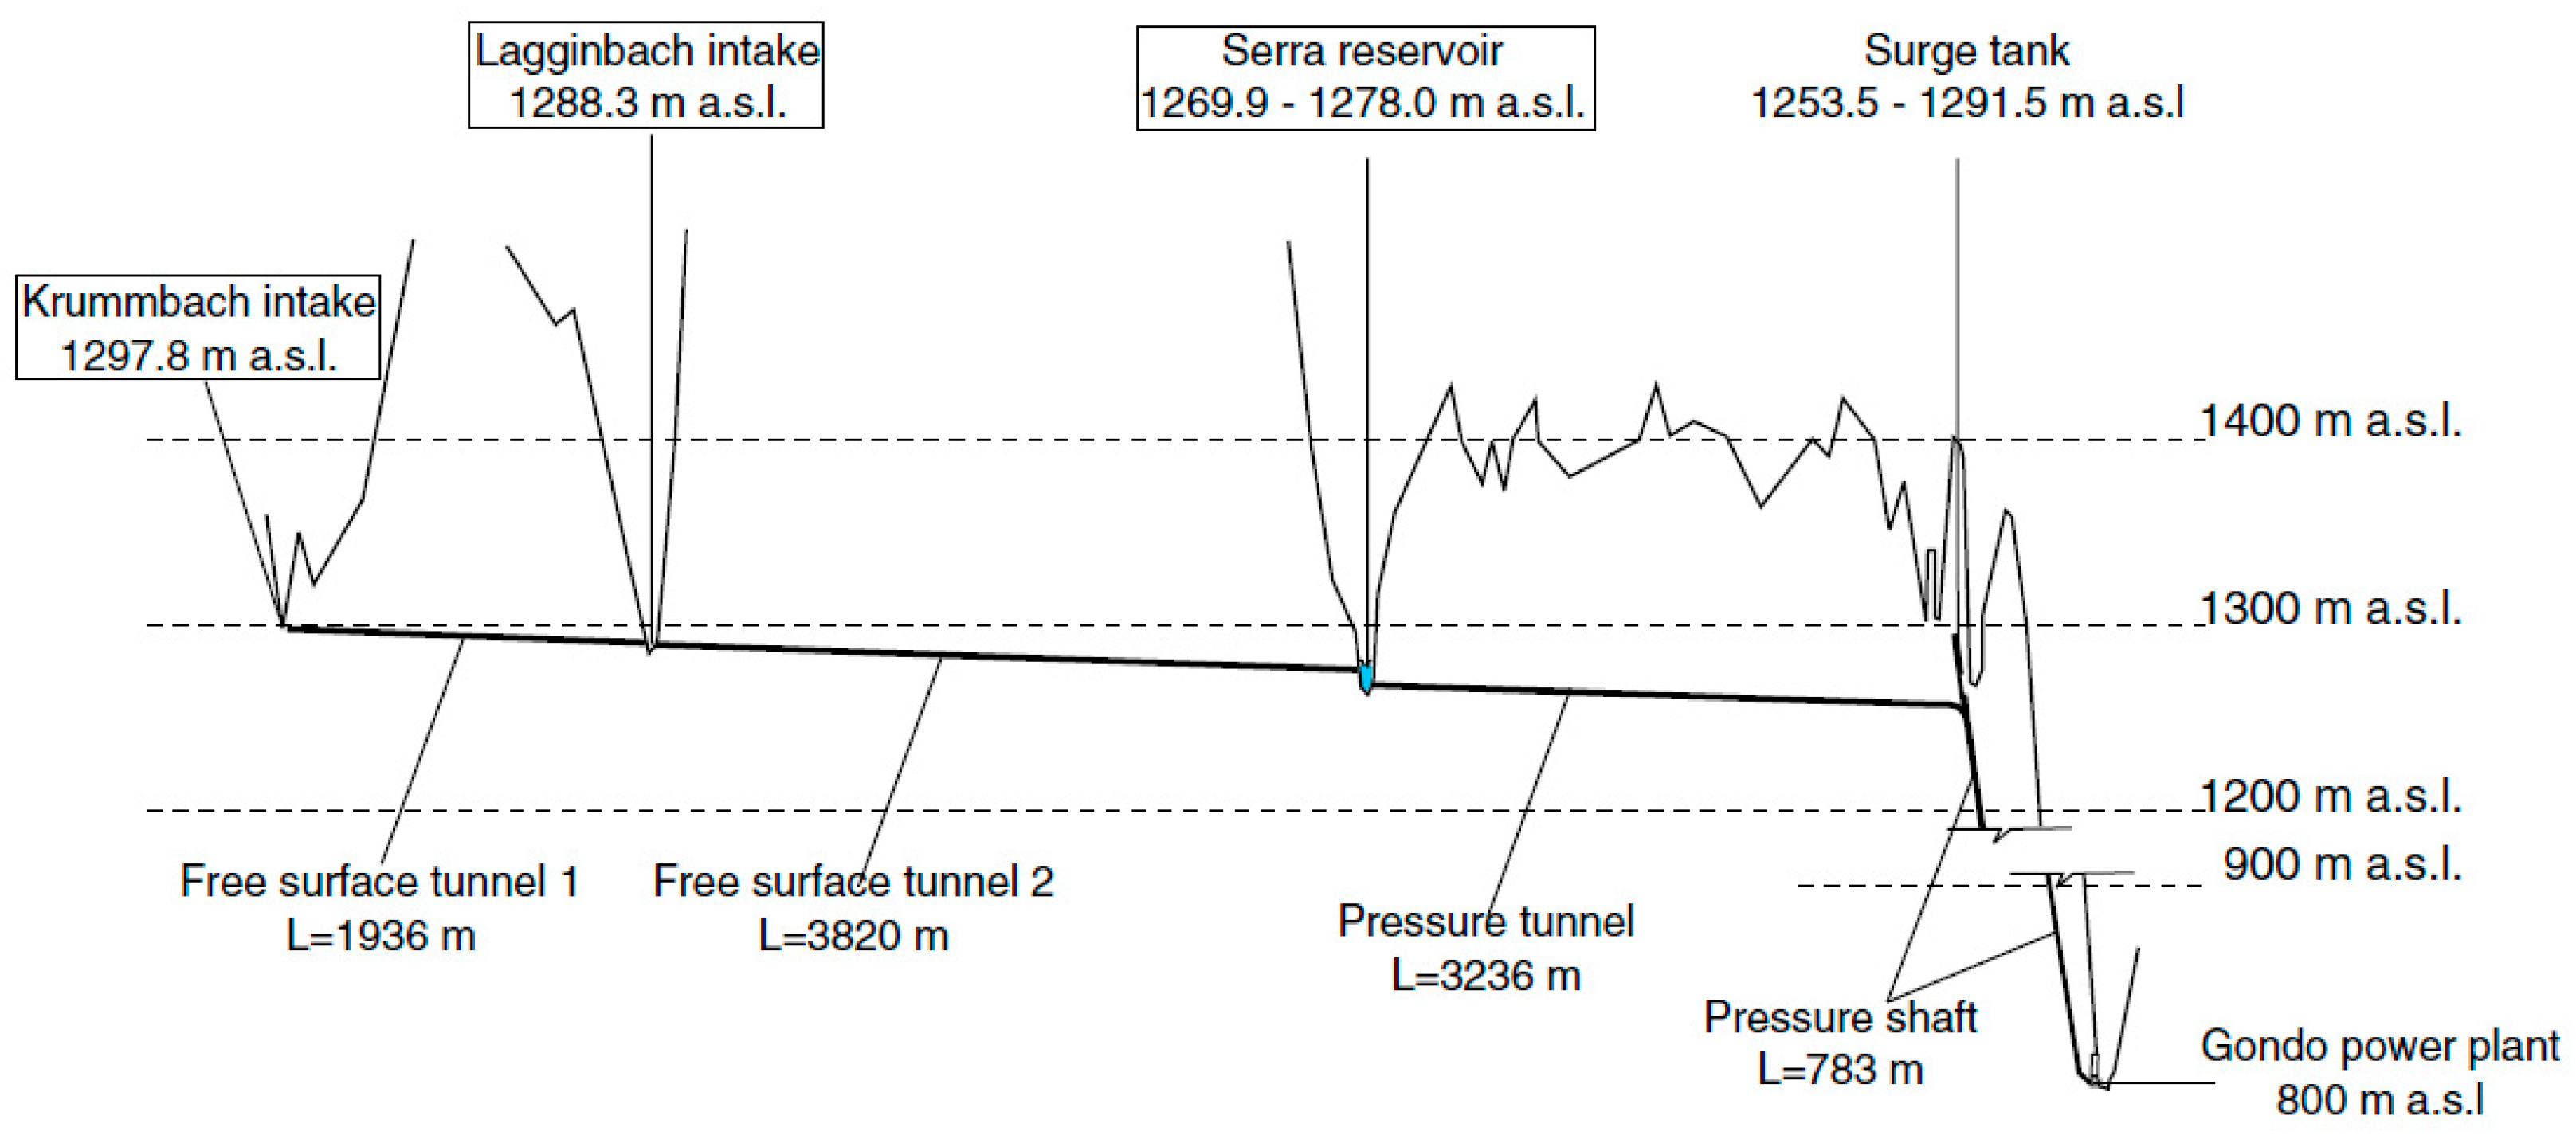
Gondo power plant is located in the Canton of Valais in Switzerland. It was commissioned in 1952 and is managed by Energie Electrique du Simplon SA along with the power plants of Gabi and Tannuwald. The reservoir supplying Gondo power plant is formed by the Sera arch dam, Gabi (11 MW) and Tannuwald (5 MW) powerhouse outlets. The plant was initially operating with two 18.5 MW Pelton turbines exploiting a 470-m head at a discharge of 11 m3/s up until the 1980s when a third Pelton turbine (8 MW) was installed. The discharge was then increased to 12.1 m3/s. The project, Renewal of Group 3, aimed to replace the third turbine by a more efficient and powerful one, which allows increasing the discharge flowing through the plant up to 14.7 m3/s.
Figure 1 shows the longitudinal profile of the waterway system and the hydroelectric power plant. In addition to the powerhouse outlets, two upstream intakes (Krummbach and Lagginbach) also feed the Sera reservoir. The latter’s level varies between 1269.9 and 1278 m above sea level (a.s.l) and the maximum head is 470 m.
A thorough 1D numerical analysis involving critical load cases showed that the increase in discharge from 12.1 to 14.7 m3/s could be safely done if the following two conditions are met:
- Increase of the existing injectors closure time to fulfill admissible maximum pressure in the penstock (load case: peak of Michaud)
- A solution is found to prevent surge tank dewatering (load case: unloading followed by a unit reloading)
Since extending the surge tank chambers was not practically feasible, an effective solution to adapt the existing surge tank to a small increase of installed capacity was the placement of a throttle at the bottom of the surge tank. An iterative optimization process using the 1D numerical simulations identified the required head loss coefficients of this throttle in each flow direction: k = (30–31,40–76) for inflow and outflow, respectively, was estimated to guarantee an optimal transient response over the entire upper reservoir water level range considering the discharge limitation for the reduced water levels.
To achieve the target head losses determined by the 1D model, the design of the throttle was optimized through an experimental campaign due to the complex geometry of the junction between the pressure tunnel and the surge tank. The physical model was constructed at the Platform of Hydraulic Constructions at Ecole Polytechnique Fédérale de Lausanne (EPFL), with a geometric scale of 1/12. Several throttle configurations were tested: gate throttles with different top or bottom openings that ensure asymmetry, and rack throttles consisting of horizontal asymmetric beams of various shapes/spacings. The final geometry that ensured the target range of head loss coefficients was a rack throttle consisting of parallel spaced trapezoidal bars. The measured head loss coefficients of this optimal geometry were reincorporated in the 1D model, which was later validated thanks to the availability of on-site measurements. Further details are presented in [2,8].
2.2. CFD Model
2.2.1. Geometry and Meshing
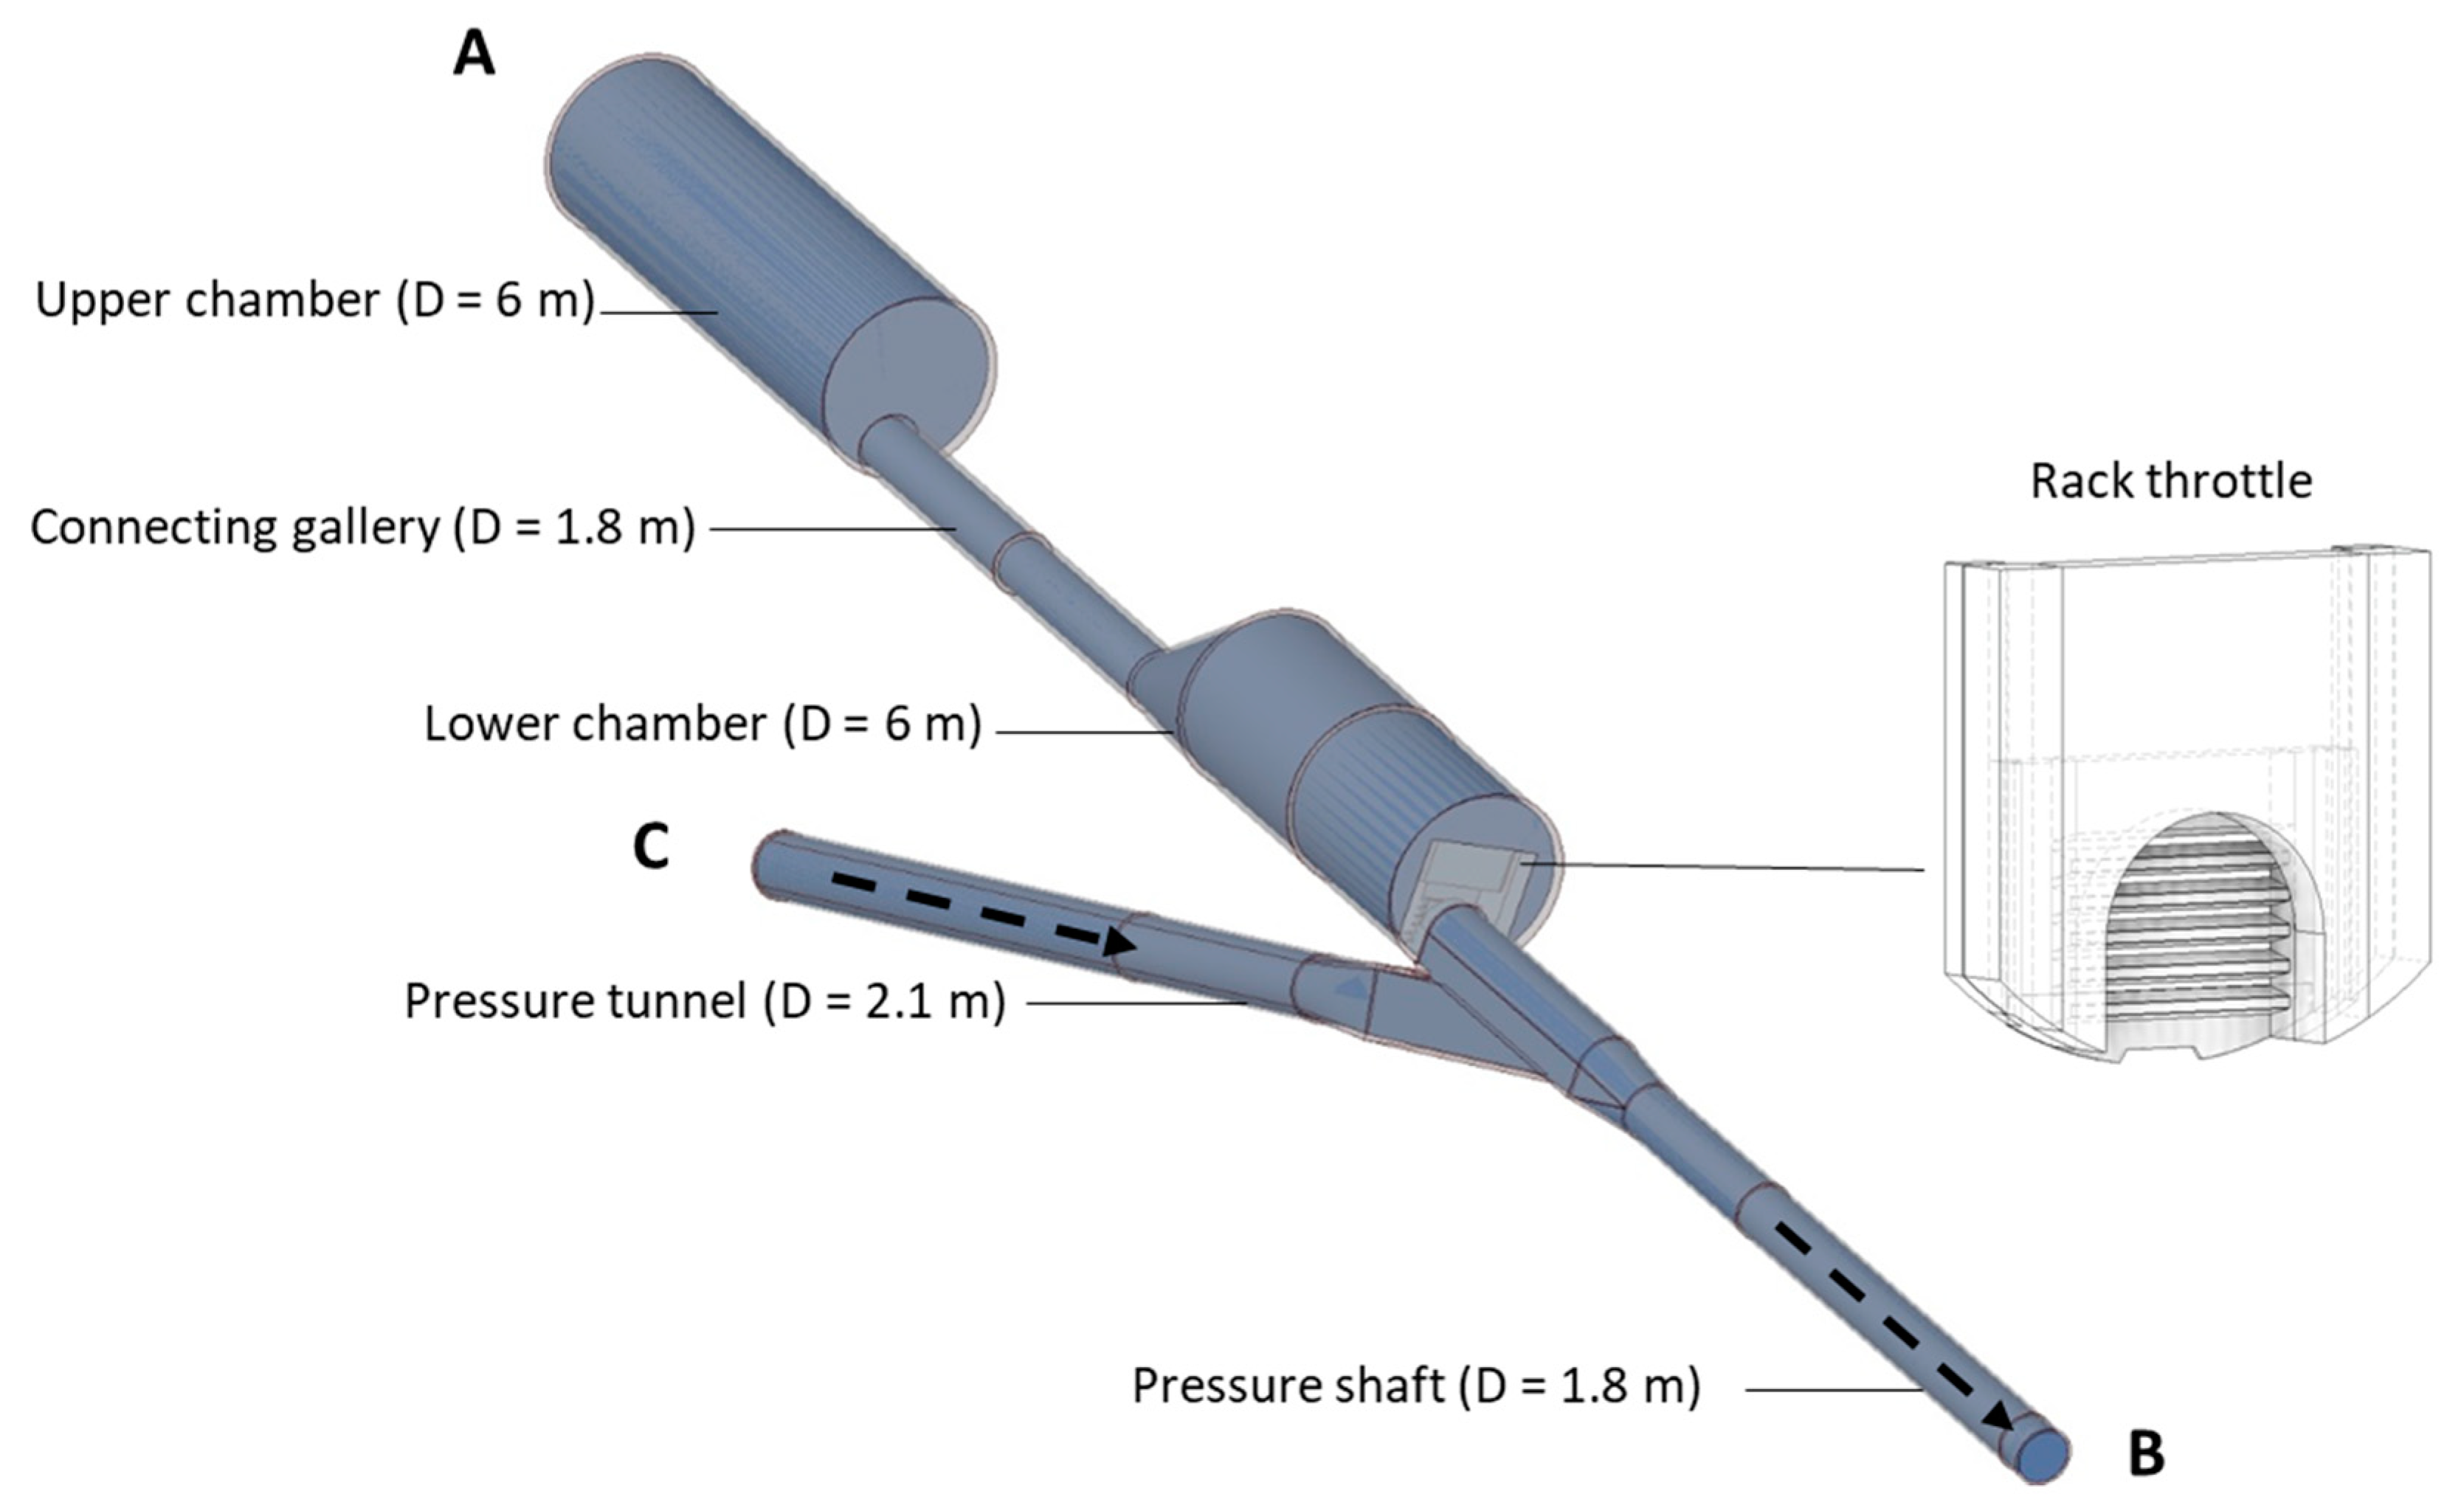
The 3D numerical model was conducted using the commercial software ANSYS-CFX (2019 R1). The flow domain is limited to the confined tunnel and penstock stretches (similarly to the physical model). The geometry of the system is sketched in prototype dimensions and is illustrated in Figure 2.
The fluid volume was meshed with tetrahedral elements (unstructured) under the patch conforming algorithm. Mesh refinements were done in regions of interest (sharp edges, bends, throttle elements, and the connecting gallery). Additionally, edge-sizing control was applied to the narrow spacings between the trapezoidal bars of the throttle. A mesh sensitivity analysis was conducted, and the maximal edge size that ensured a grid-independent solution with the least number of elements was 5 mm, consisting about 1/12 of the minimum spacing between the bars.
2.2.2. Pre-Processing: Physical Parameters, Boundary Conditions, and Turbulence Model
The fluid consists of water assessed at a temperature of 15 °C. All analyses aiming to estimate minor head loss coefficients are conducted under steady-state conditions. However, for investigations under transient conditions involving surge tank level variations, a multi-phase flow consisting of air and water should be used. As the flow in the system is gravity driven, buoyancy was activated, and the gravity was set in the negative Z-direction (−9.81 m/s2).
Depending on the investigated flow direction, each boundary condition is either set as inlet, outlet or opening. Regarding the pipe and surge tank walls, a no-slip boundary condition is set in order to ensure a zero fluid velocity immediately next to the walls. A roughness was applied to the wall surfaces and an equivalent sand-grain roughness of 0.27 mm is used as an input parameter.
The Shear Stress Transport (SST) model is used to provide closure for Reynolds-averaged Navier-Stokes equations. SST uses a transformation of the k−ε model into the k−ω model in the near-wall region, and the standard k−ε model in fully turbulent regions that are far from the wall (k being the turbulence kinetic energy, ε the rate of dissipation of turbulence kinetic energy and ω the turbulence frequency) [23]. This model has been proven to yield sufficient accuracy in predicting onset and amount of flow separation, as validated by comparable investigations in the literature [6,7,12].
2.2.3. Post-Processing: Visualization of Results and Head Loss Coefficient Estimation
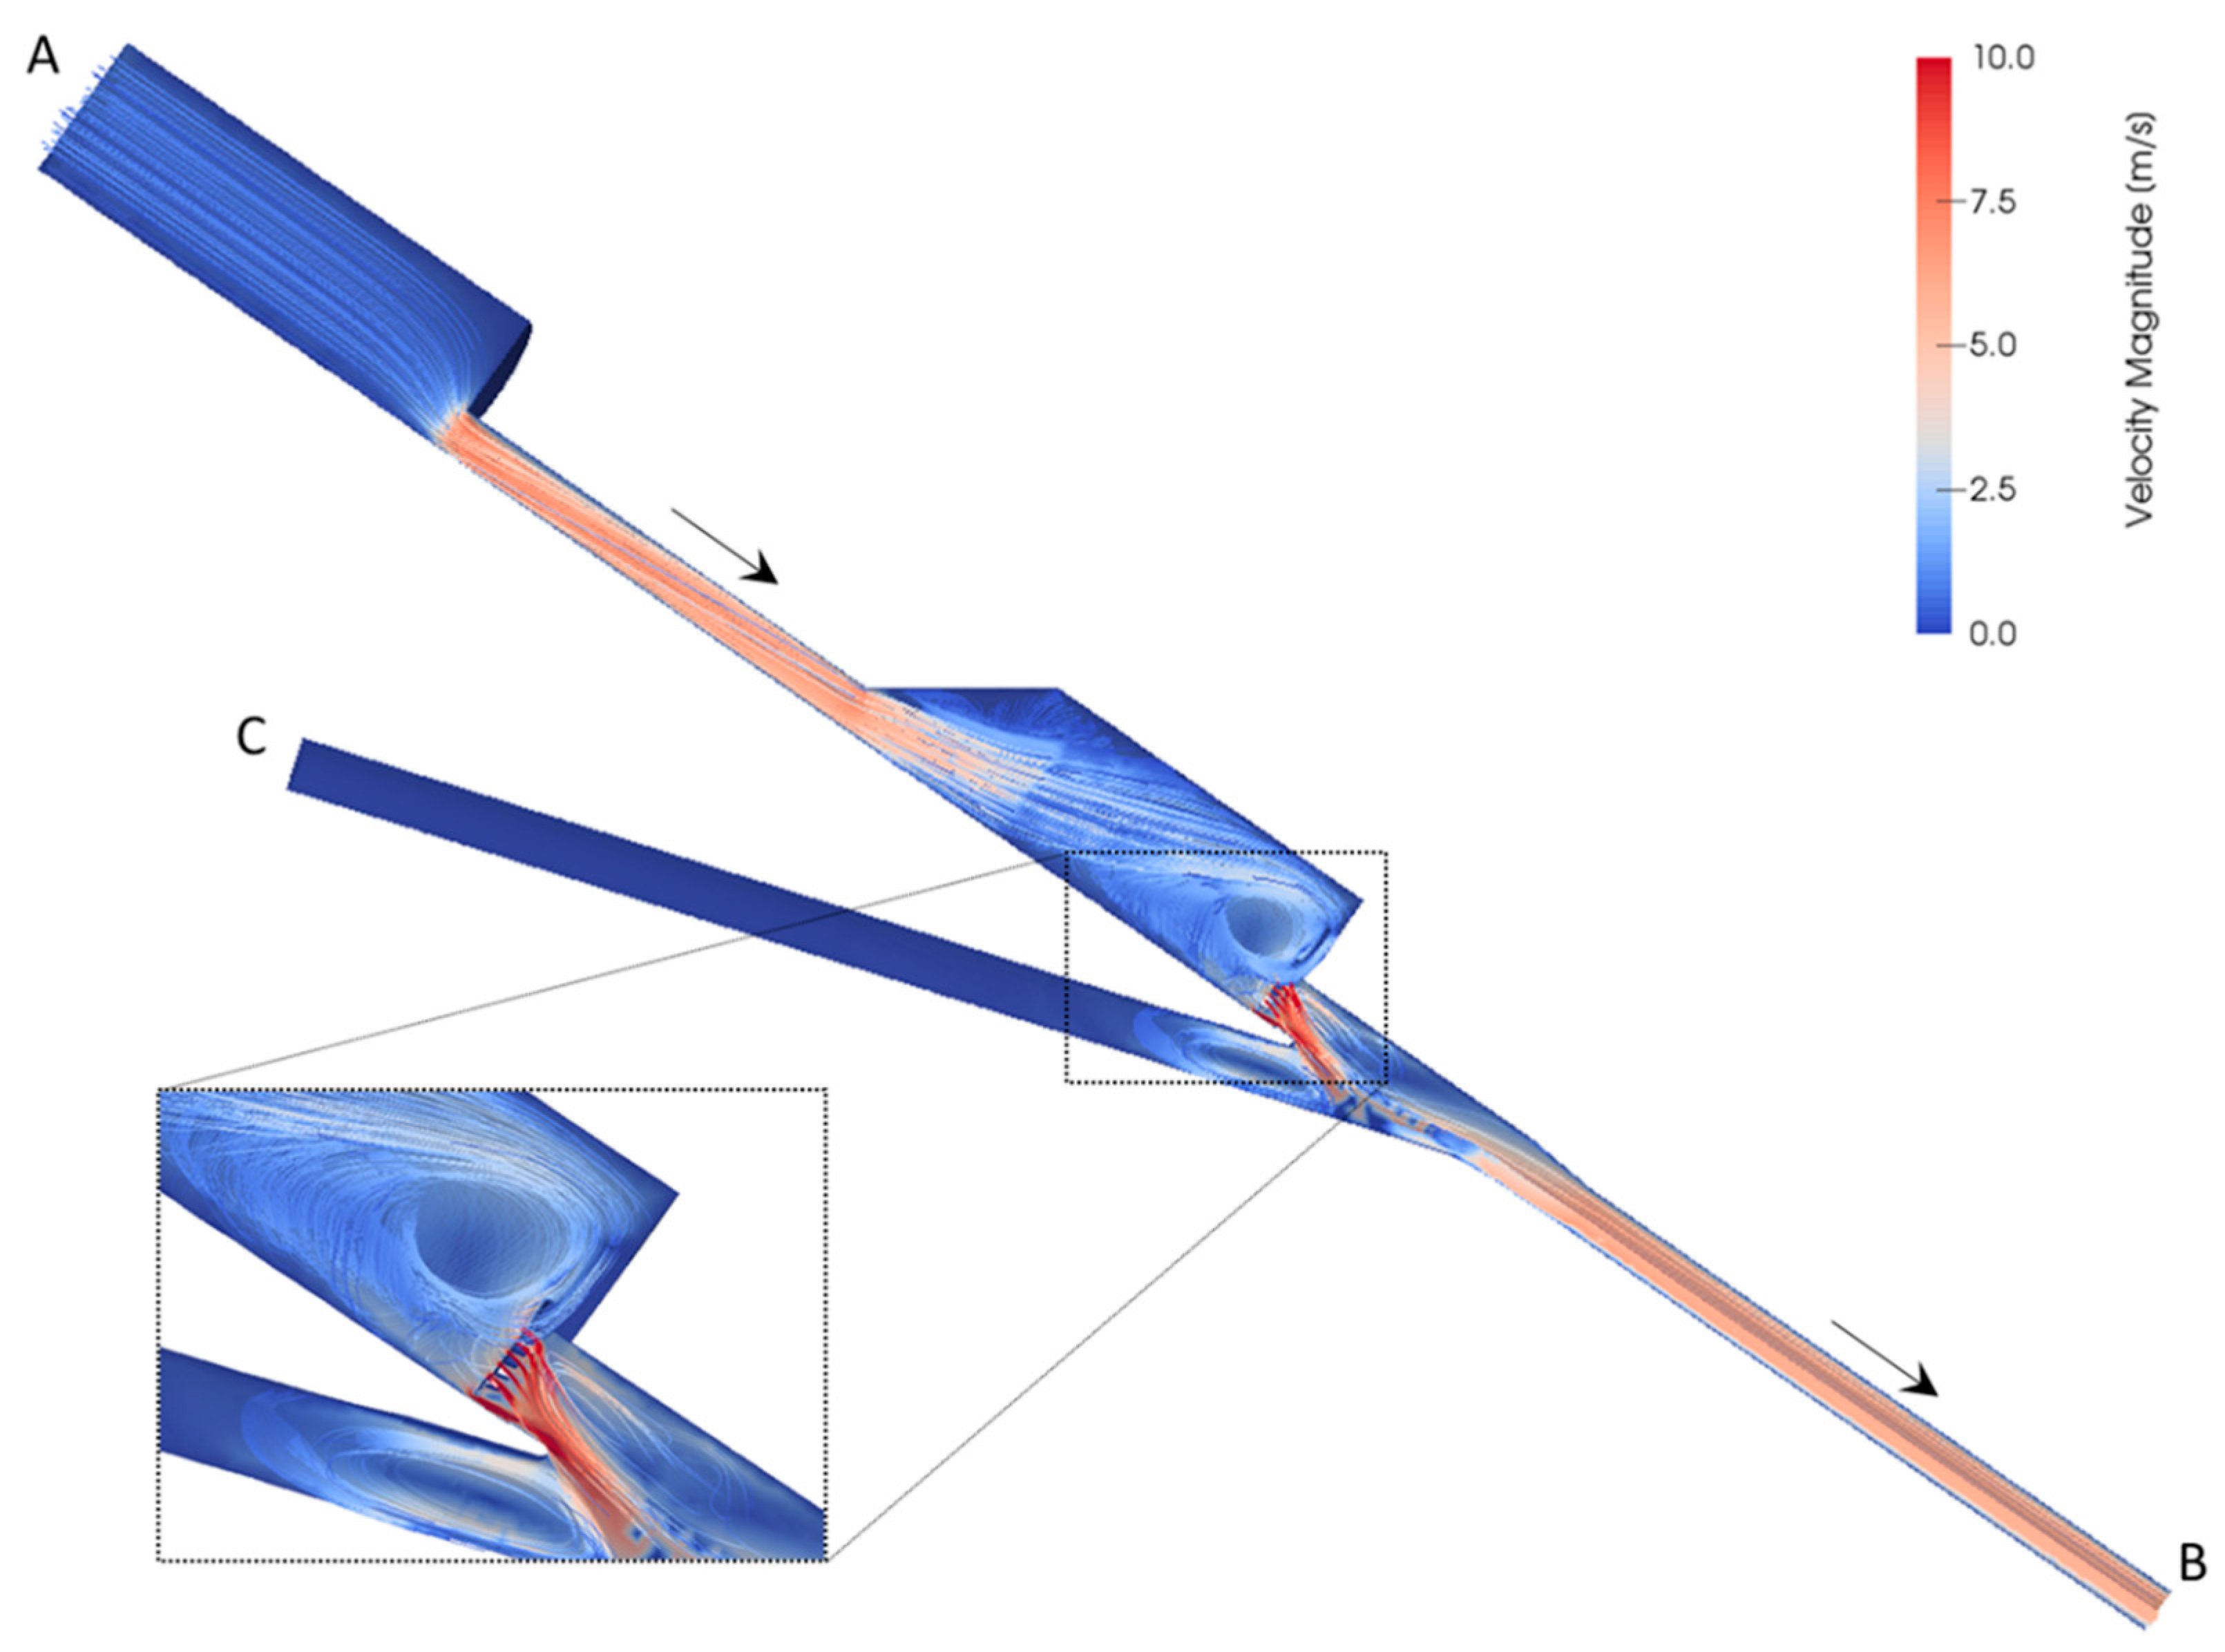
Post-processing allows the visualization and analysis of the results. Figure 3 illustrates an example of velocity streamlines for a 14 m3/s flow going from A to B (turbine opening). The lower chamber of the surge tank experiences high flow disturbances accompanied by recirculation zones. Very high velocities are noticed as the water passes through the narrow throttle spacings.
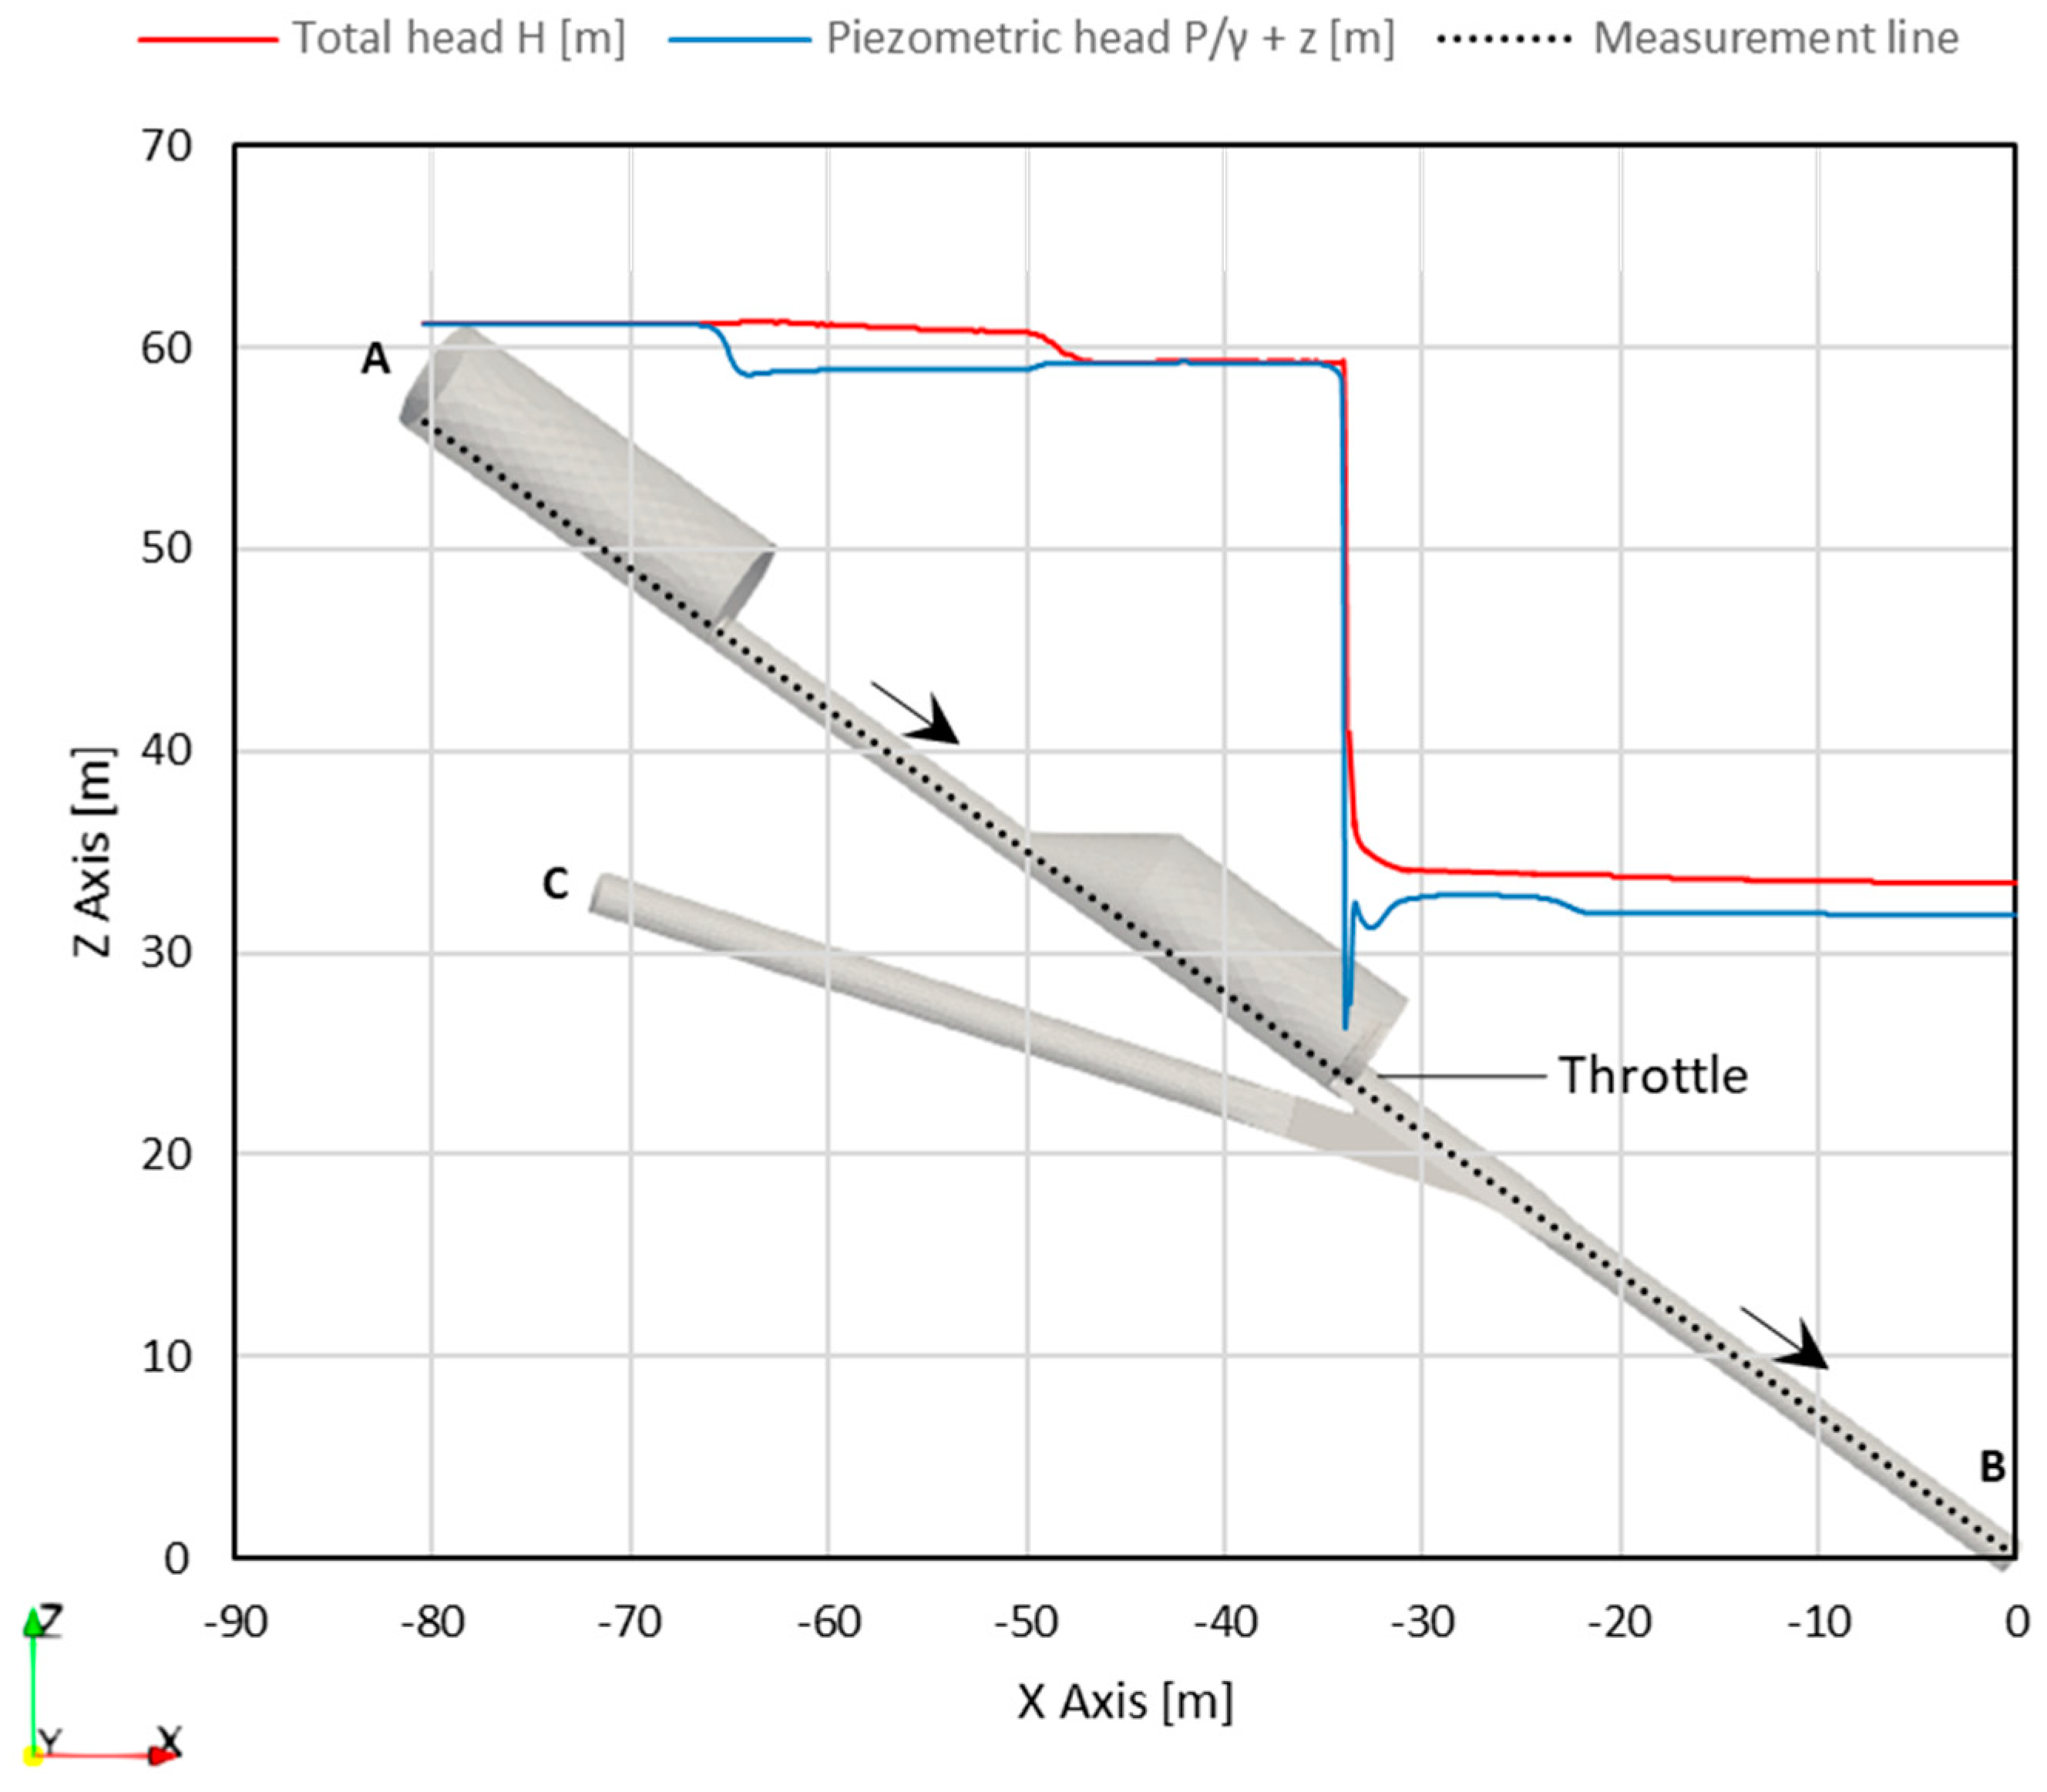
Figure 4 illustrates the total hydraulic head and the piezometric head ( plotted along an axis passing through the middle of the penstock (i.e., Y = 0), for the same scenario involving 14 m3/s flowing from A to B. Clearly, the linear head losses are negligible as we observe a quasi-horizontal energy grade line which experiences a slight drop by the end of the connecting gallery (due to a sudden contraction of the flow followed by a gradual expansion in the lower chamber of the surge tank). A sharp drop in the total head is later noticed at the location of the throttle (bottom of the lower chamber of the surge tank). Note that at this location, the flow experiences high disturbances, and some streamlines are discontinuous.
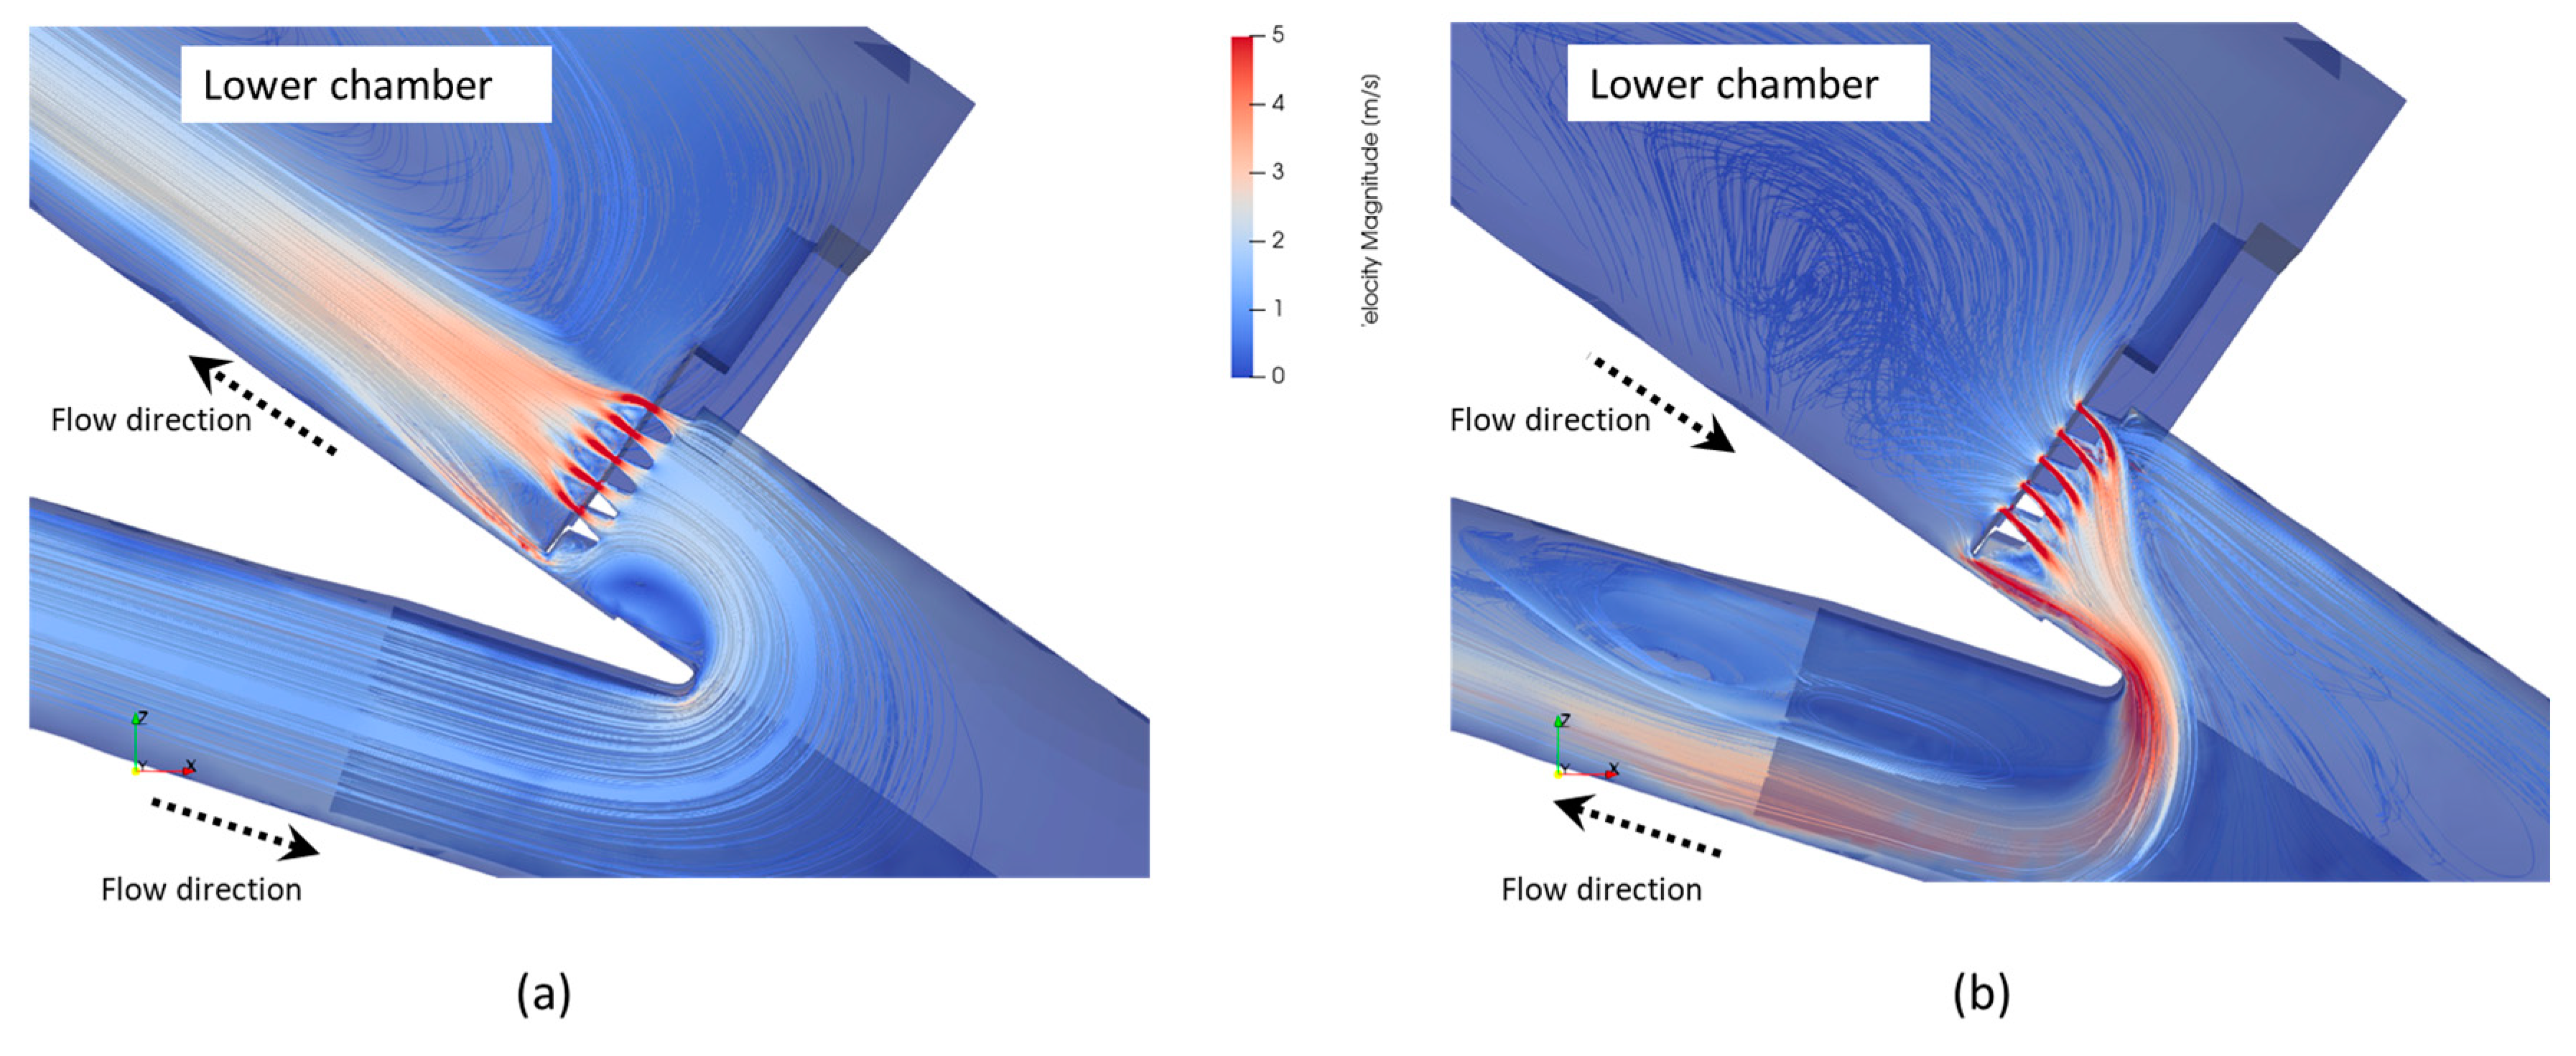
Further exemplary results of the velocity streamlines are illustrated in Figure 5 for a 5 m3/s surge tank inflow and outflow during mass oscillations. These results highlight the importance of the orientation of the rack throttle’s trapezoidal bars. The streamlines for a flow entering the surge tank are forced in one direction, hence they are more guided than the case of a flow exiting the surge tank. This should result in lower head loss coefficients in the upsurge direction than the downsurge direction as previously determined from the physical model and as proven subsequently with the CFD model.
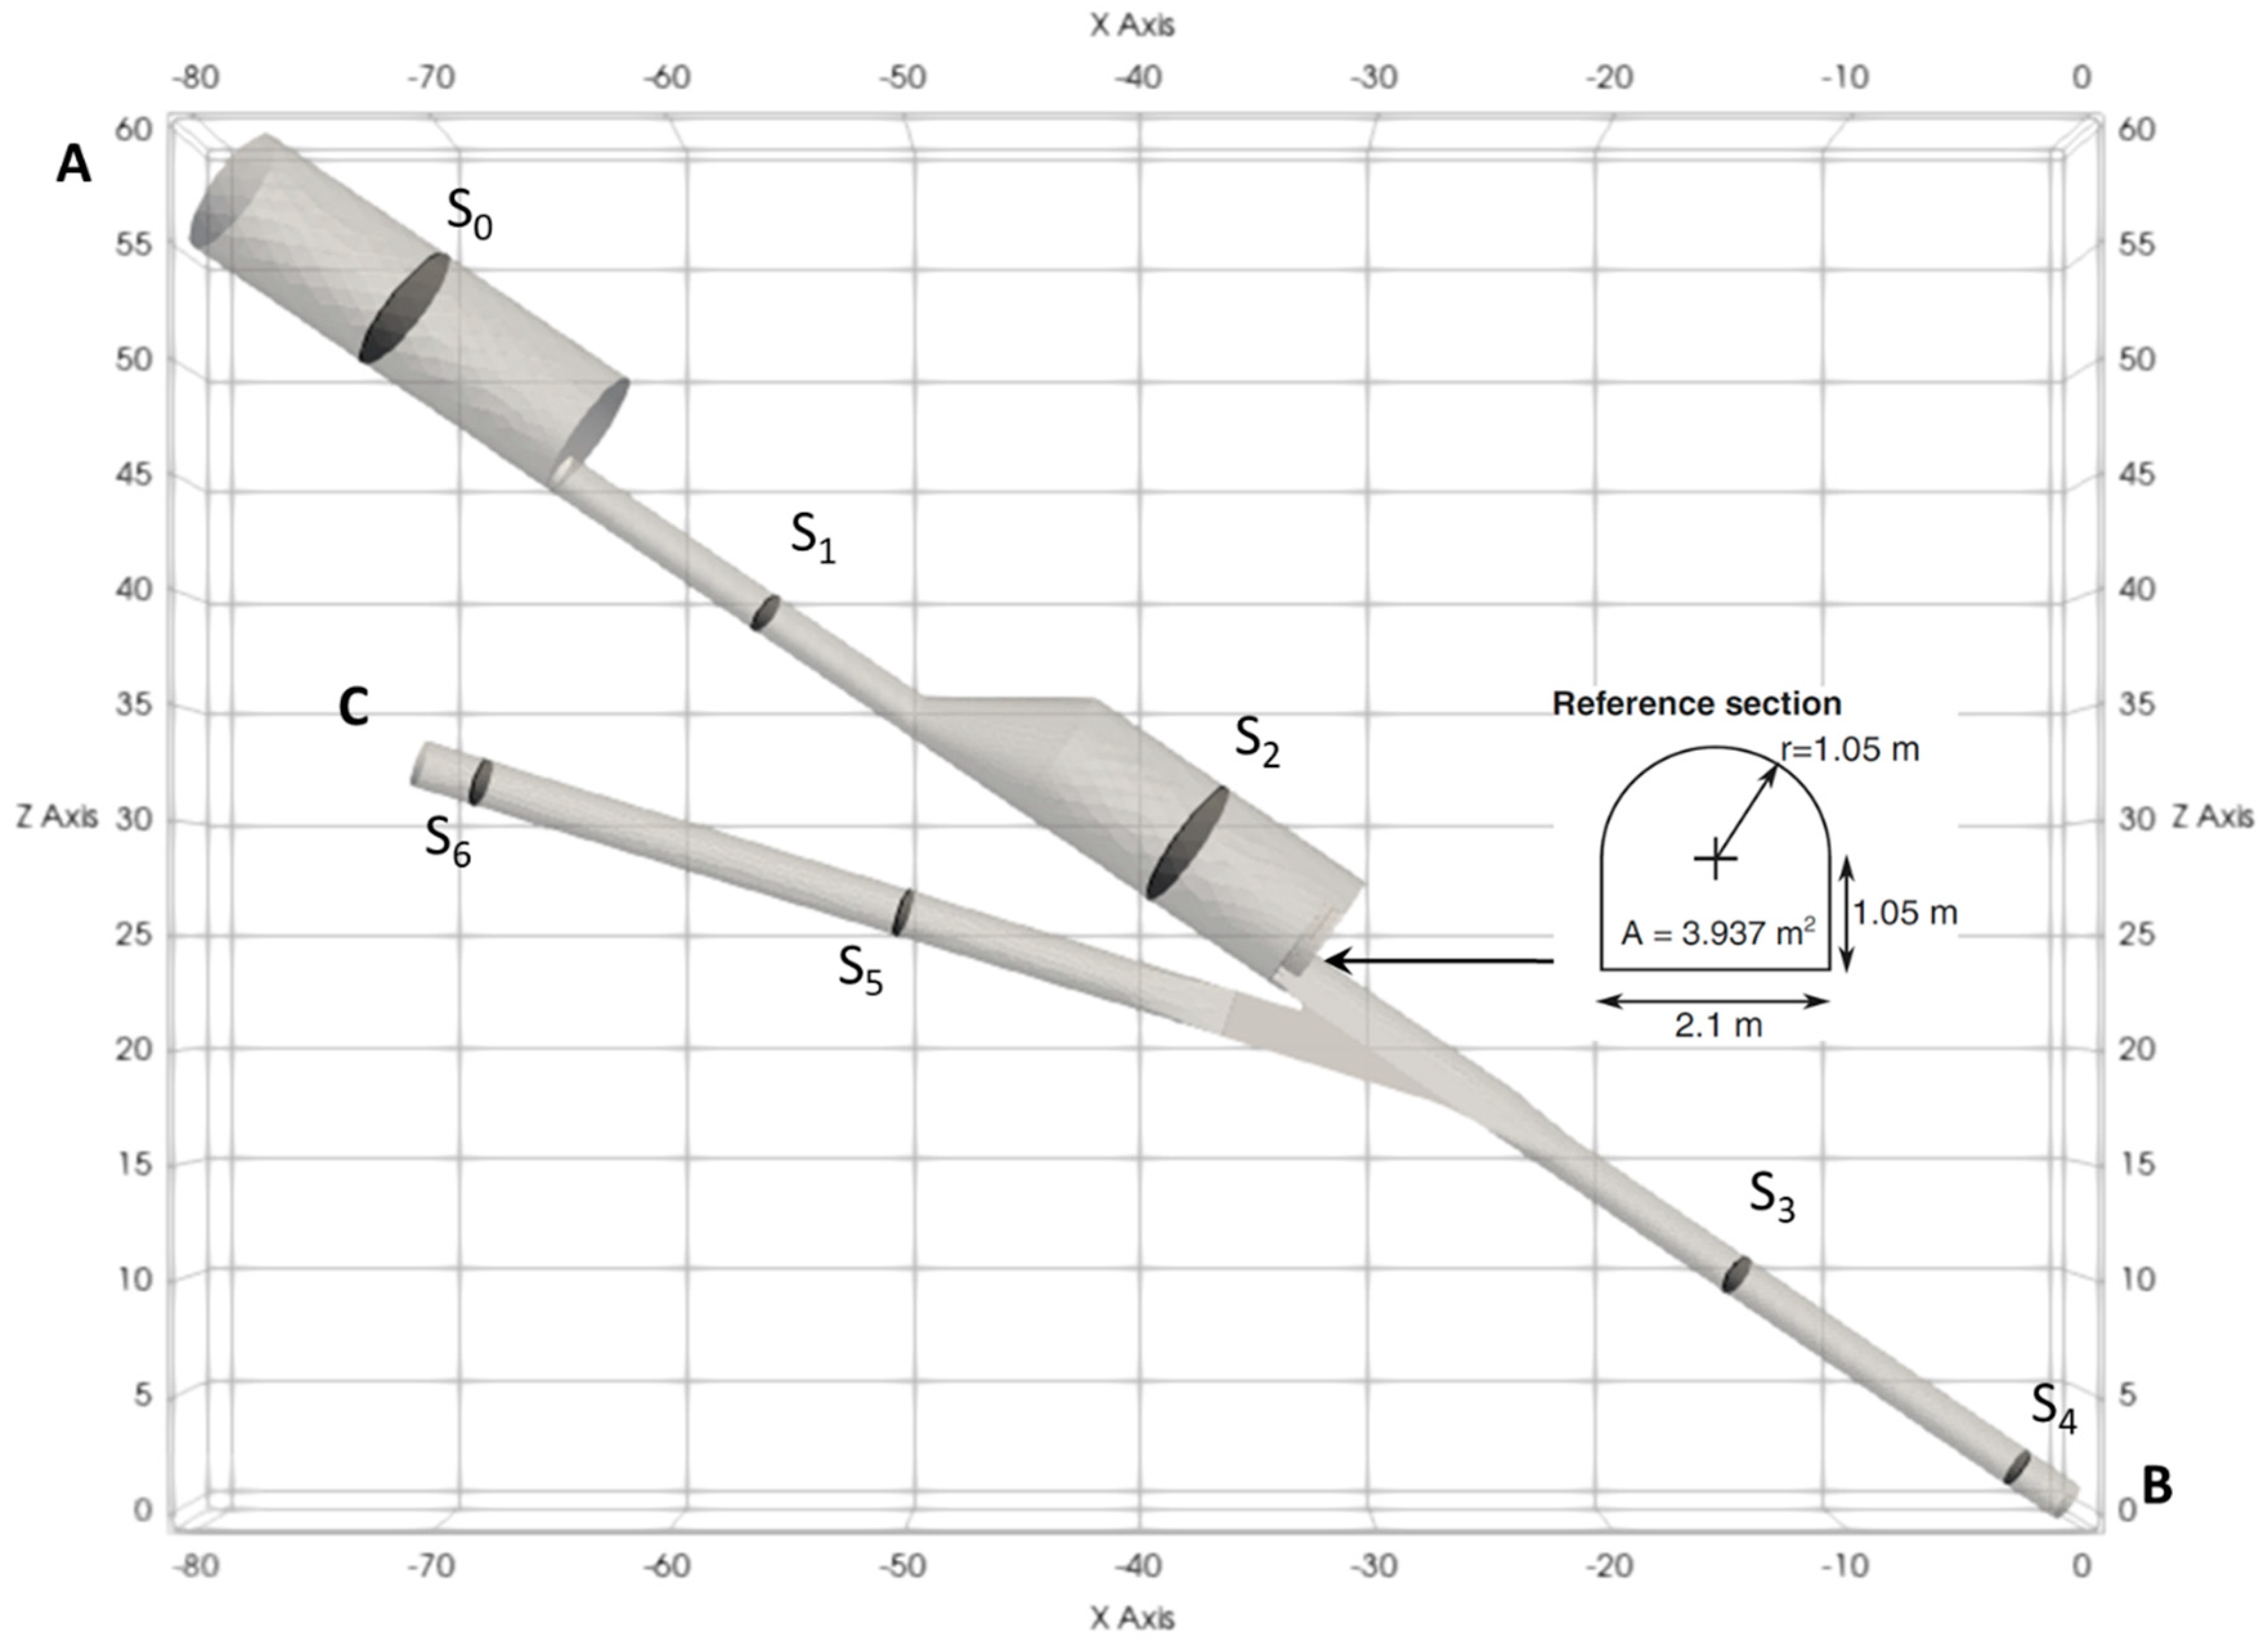
An important part of post-processing is the proper choice of the reference cross-sections for the calculation of the throttle’s head loss coefficient k. These sections should be far enough from the zones experiencing inhomogeneity or disturbance in the flow conditions. Figure 6 illustrates the location the measurement sections that are selected similarly to the physical model, for each flow direction as follows (Figure 6):
- S1–S5 for direction A–C (flow out of the surge tank during mass oscillation)
- S5–S1 for direction C–A (flow into the surge tank during mass oscillation)
- S1–S4 for direction A–B (flow out of the surge tank following a turbine opening)
- S5–S4 for direction C–B (steady flow during turbine operation)
The head loss is evaluated between two reference cross-sections Si and Sj under steady-state simulations (similarly to the physical model), for several discharges. The computation is based on the Bernoulli equation, which is valid along a streamline:
where E is the hydraulic head or energy, z is the altitude, is the pressure head, and is the kinetic head.
By considering negligible linear losses in this system, this head loss mainly comprises of singular steady-state losses and is calculated as follows:
Vref being the velocity in the reference cross-section, based on which the head loss coefficient k is evaluated. It consists of a horseshoe section located at the intersection between the bottom chamber of the surge tank and the junction between the pressure tunnel and the pressure shaft (Figure 6).
3. Results
3.1. Validation with the Physical Model Results
For each flow direction, several discharges were tested. Numerical values of the head loss (ANSYS-CFX values) are plotted along with the physical model results as a function of the kinetic energy (Figure 7). The corresponding head loss coefficients associated with each flow direction are then obtained by linear regression according to Equation (2).
Table 2 summarizes the values of the head loss coefficient as obtained numerically (ANSYS-CFX), experimentally and with the combined numerical and experimental data series. The relative difference between the experimental and the numerical value is presented with respect to the experimental one.
Results show a good agreement between the two methods. Since the physical model head loss coefficients have been implemented in a refined 1D numerical model and validated afterward with on-site measurements, the slight discrepancies between the two methods can be primarily attributed to possible errors or uncertainties in the CFD model.
The highest percentage of difference (around 12%) is noticed for a very low value of head loss coefficient (<1), in the C–B direction. This direction does not involve the throttle, meaning the head losses primarily consist of the minor losses caused by the bend, the backflow region formed on top of it, as well as the Darcy-Weisbach frictional losses. Such type of losses is not modelled accurately in CFD simulations due to the weakness of the turbulence models and the difficulty of the boundary mesh to solve small-scale roughness elements [24]. This issue results in underestimated friction factors when compared to the ones measured experimentally. However, it does not seem to significantly affect the head loss coefficients corresponding to directions A–C, A–B, and C–A since in such flow directions, the head losses are dominated by the local losses induced by the throttle, significant flow direction and cross sectional area changes.
Overall, one can safely say that the CFD model successfully provides the same conclusions as the physical model when comparing the head loss characteristics of a flow direction to another: The relationship kCB < kCA < kAB < kAC is valid numerically and experimentally.
3.2. Impact of the Connecting Gallery
Regarding mass oscillation, the head loss coefficient that was measured in the physical model corresponds to k (S1–S5) for surge tank outflow A–C and k (S5–S1) for surge tank inflow C–A. The same sections were chosen in the 3D model analysis aiming to validate the physical model results (kindly refer to Section 2.2.3). However, in order to investigate the impact of the connecting gallery on the head loss coefficients presented above, a reevaluation of these coefficients between section S5 (located in the pressure tunnel) and three different sections in the surge tank was conducted for flow directions A–C and C–A:
- Section S0 (in the middle of the upper surge tank chamber, above the connecting galley)
- Section S1 (in the middle of the connecting gallery)
- Section S2 (in the middle of the lower surge tank chamber, below the connecting gallery)
A flow going from A to C experiences a sudden contraction followed by a gradual expansion (conical expansion) and a flow going from C to A experiences a gradual contraction followed by a sudden expansion. In both cases, the approach flow is eccentric and the section that experiences the most uniform flow conditions (far from disturbances) is S1 which is why it was primarily used in the physical model as a pressure measurement section in the surge tank.
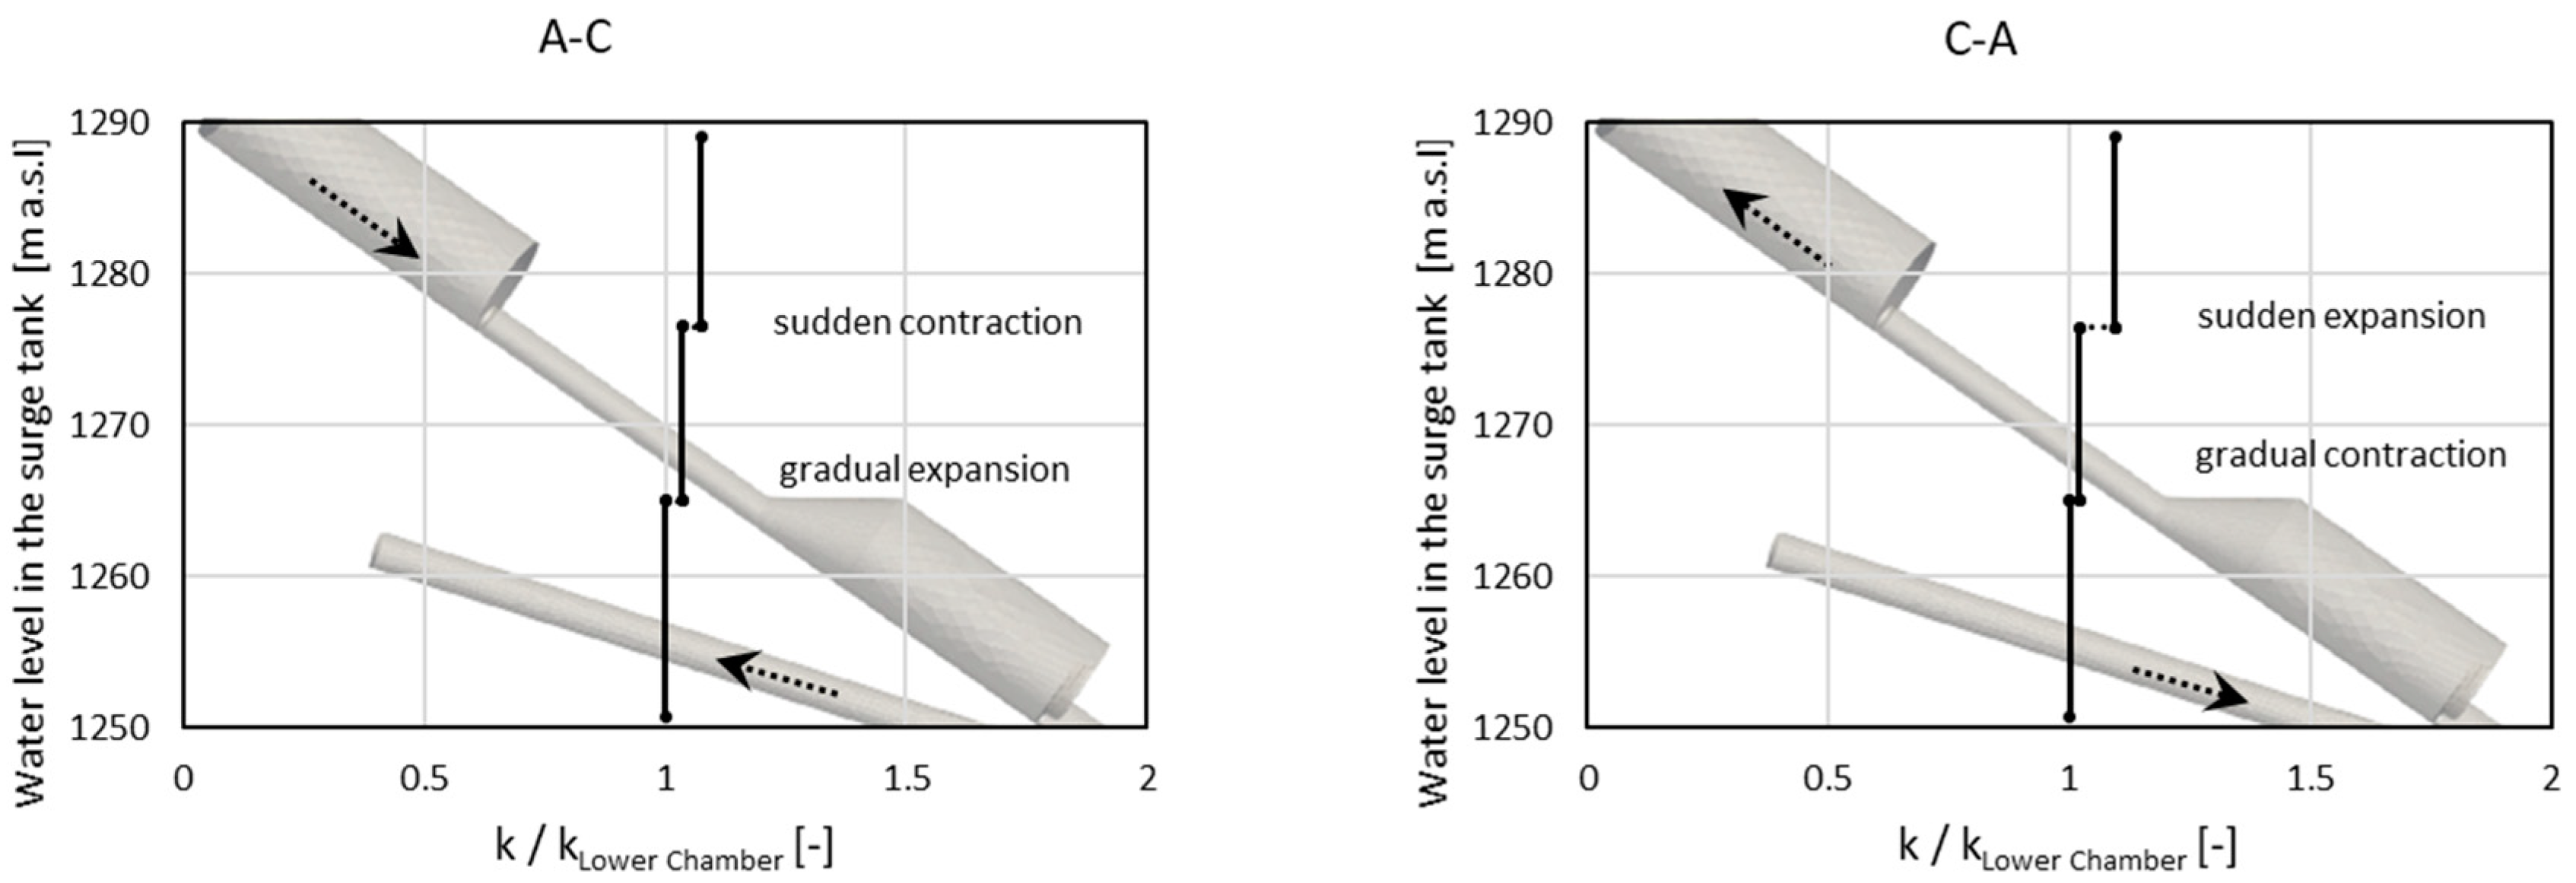
Figure 8 illustrates the effect of the sudden (or gradual) contraction (or expansion) on the outflow or inflow head loss coefficient of the surge tank k. Results of k are reported according to the water level in the surge tank and with respect to kLower Chamber which is measured between the pressure tunnel section S5 and the lower chamber of the surge tank S0.
A stepped behavior is observed when moving from a surge tank section to another one. For water levels within the lower surge tank chamber, the ratio between k and kLower Chamber is 1 meaning the surge tank inflow or outflow loss coefficient corresponds to the throttle’s loss coefficient. If the water level reaches the connecting gallery, the value of k increases, as it includes the effect of the conical section variation in addition to the throttle’s head loss coefficient. The value of k reaches its maximum when the water level in the surge tank reaches the upper chamber of the surge tank. At this point, the calculated value of k includes the throttle’s head loss coefficient in addition to the local losses caused by the gradual and sudden surge tank section variations. Note that linear head losses are negligible in the surge tank which is why a constant behavior of k is observed within each section of the tank, rather than a linear one.
As illustrated above, for a throttled surge tank, the effect of the section variation on the outflow or inflow head loss coefficient of the surge tank is not significant. In fact, the streamline contractions/expansions into or out of the connecting gallery cause a maximum increase of around 9% for k with respect to kLower Chamber. This means that the variations in the section of the surge tank result in very negligible local head losses when compared to the ones induced by the throttle.
On the contrary, investigations of the head loss coefficients of Gondo surge tank prior to installing the throttle (standard surge tank), showed that a very low head loss coefficient of the surge tank can be significantly affected by the presence of a connecting gallery (maximum increase of 90%). The losses caused by the connecting gallery should be included in the 1D software algorithm in such a way to vary the loss coefficients with the water level in the surge tank. Although it proved to be safer, the design approach ignoring the additional losses of the connecting gallery, may result in oversized structures. In this respect, it is worth mentioning that a narrowed connecting gallery can result in flow separation during a downsurge event; a thorough verification of this scenario should be considered in case of low head loss at the outlet of the surge tank, discharging at a higher rate than the connecting gallery.
3.3. Impact of the Flow Share
During transient flow events in waterways, flow splitting occurs at the initial stages in the 3-way junction between the pressure tunnel, pressure shaft, and surge chamber entry. Investigations of transient flow regimes were therefore done to evaluate the effect of the flow share in the surge tank on the head loss coefficient of the throttle.
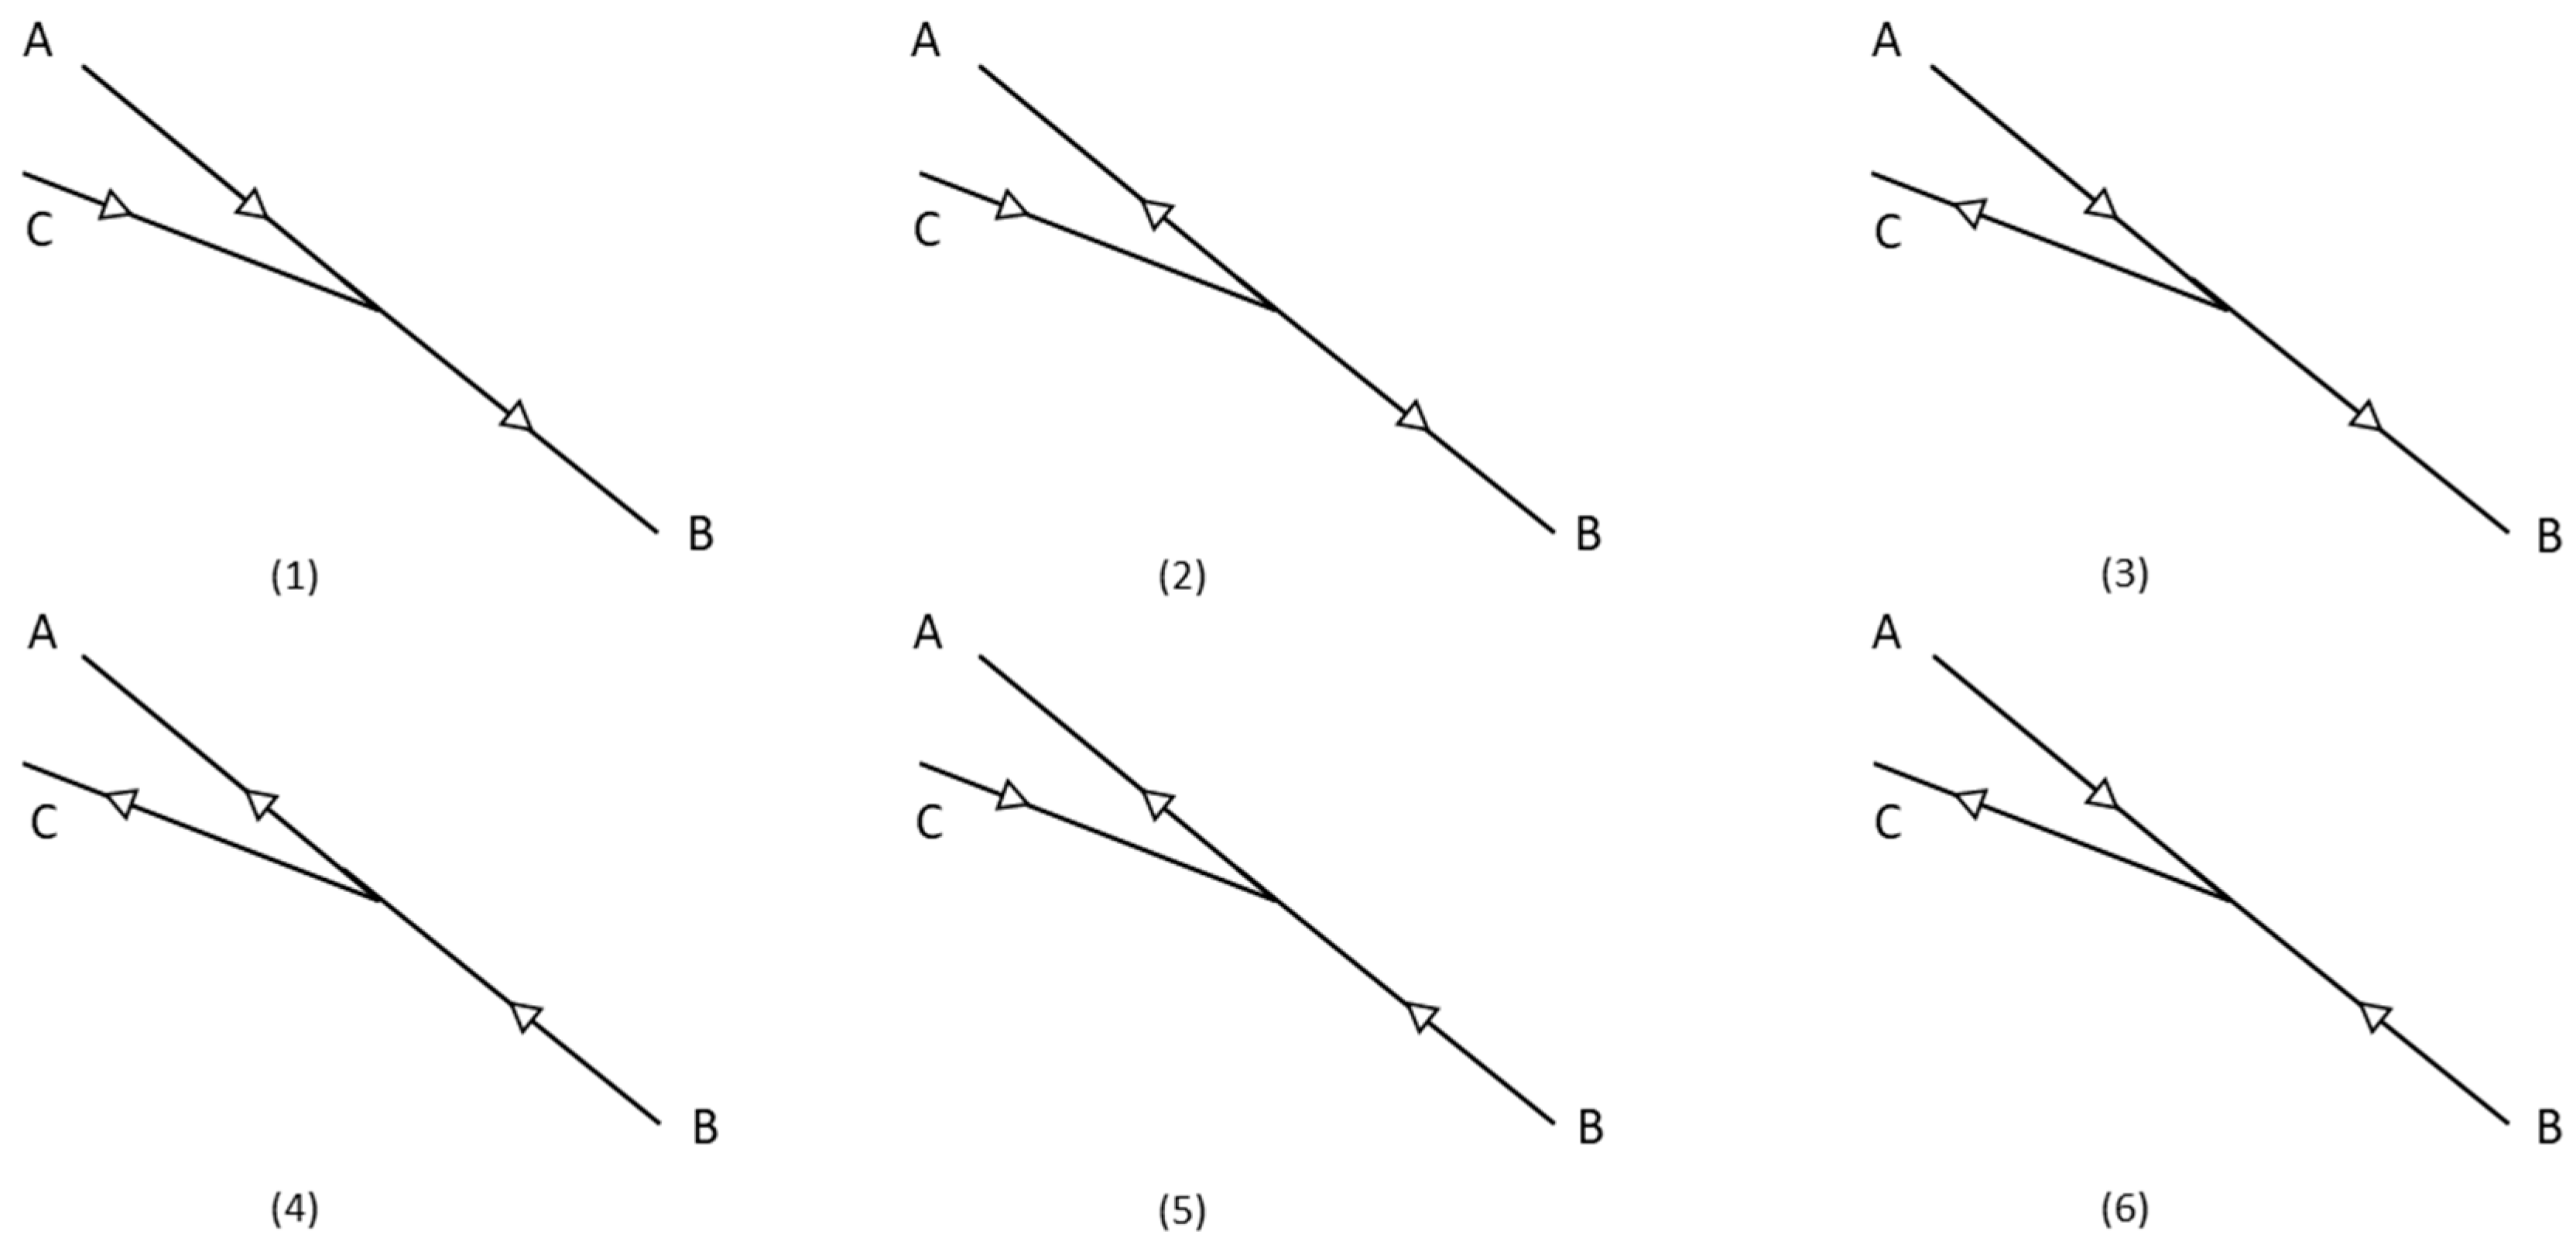
First, one needs to evaluate the possible combining and dividing flow regimes in the system. The latter is similar to a Y-junction with 3 branches corresponding to the surge tank connection, pressure tunnel and pressure shaft. Typically, there are 6 physically possible flow regimes through a Y-junction as illustrated in Figure 9. In Gondo power plant, only configurations (1), (2), and (3) are possible as water cannot flow from the penstock (B) towards the surge tank (A). Nevertheless, for a pumped-storage system, all possible regimes should be investigated.
Case (1) typically takes place at the beginning of an operation involving the opening of valves downstream of the penstock. It is followed by mass oscillation between the surge tank and the upstream reservoir, creating an alternation between cases (1) and (2). Case (2) also takes place following a closure of these valves, resulting in dividing flow conditions, followed by mass oscillation between the surge tank and the reservoir. Once mass oscillation starts, the surge tank’s flow share is equal to 1 as the flow going into the surge tank is the same as the one going out of the surge tank before being gradually attenuated to zero. Hence, cases (2) and (3) take place in the system but with QB = 0. This is nothing but the flow in C–A and A–C directions as presented in the previous sections of this study.
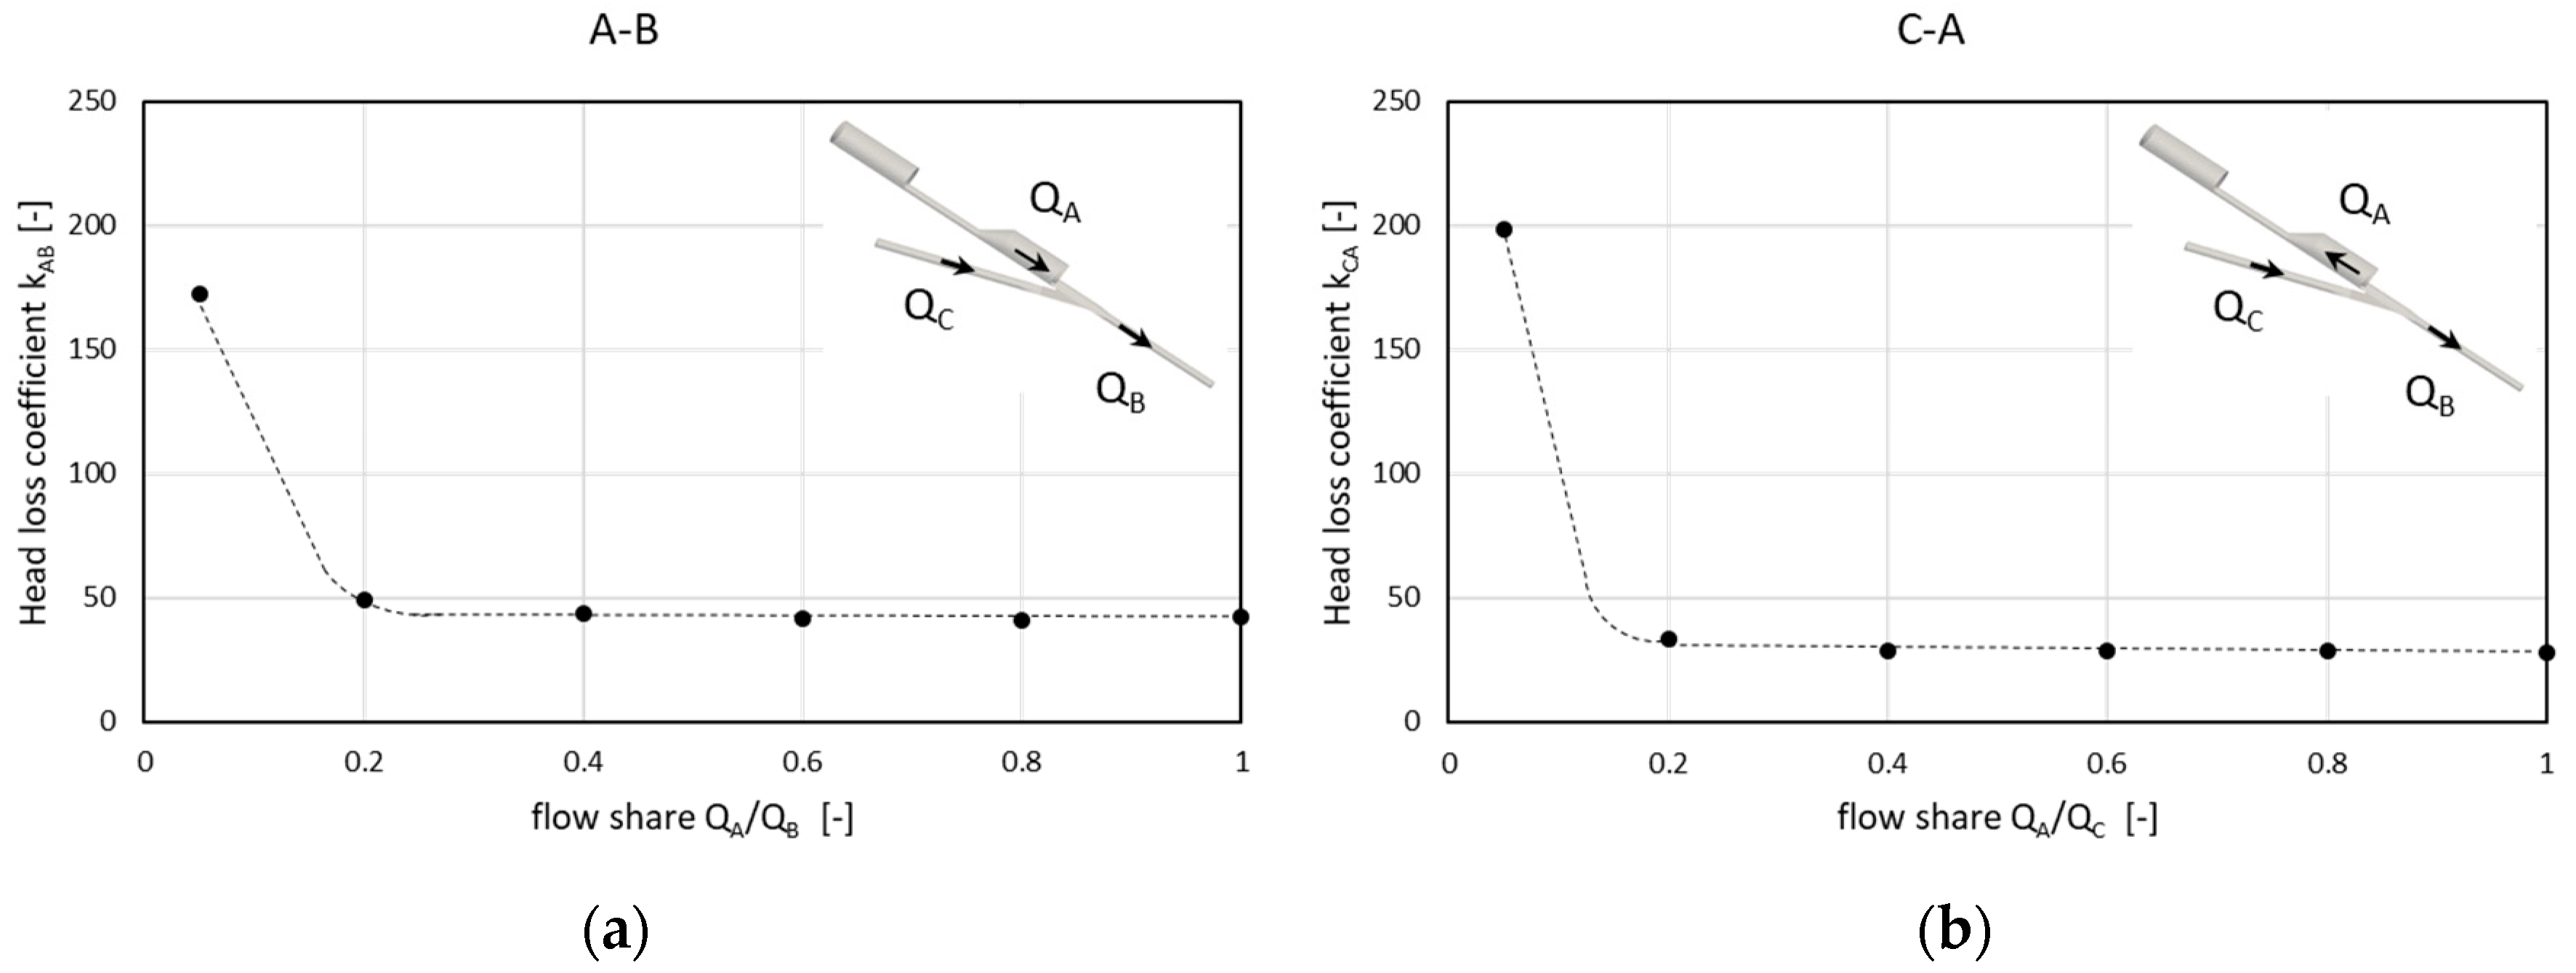
Therefore, combining and dividing flow conditions in this case study are merely associated to configurations (1) and (2) respectively. The associated outflow (kAB) and inflow (kCA) head loss coefficients of the throttle under combining (1) and dividing (2) flow conditions are presented in Figure 10. Similar to the previous analyses, the value of k is computed with respect to the reference section at the bottom of the surge tank.
For both cases, a variation of the head loss coefficient k is only noticed for very low flow ratios (<20% of the total flow in the waterway). The shape of the curve depends on the choice of the reference section. This trend is in good agreement with the ones presented in literature [4] when the reference cross-section (and the associated velocity) is taken in the throttle branch.
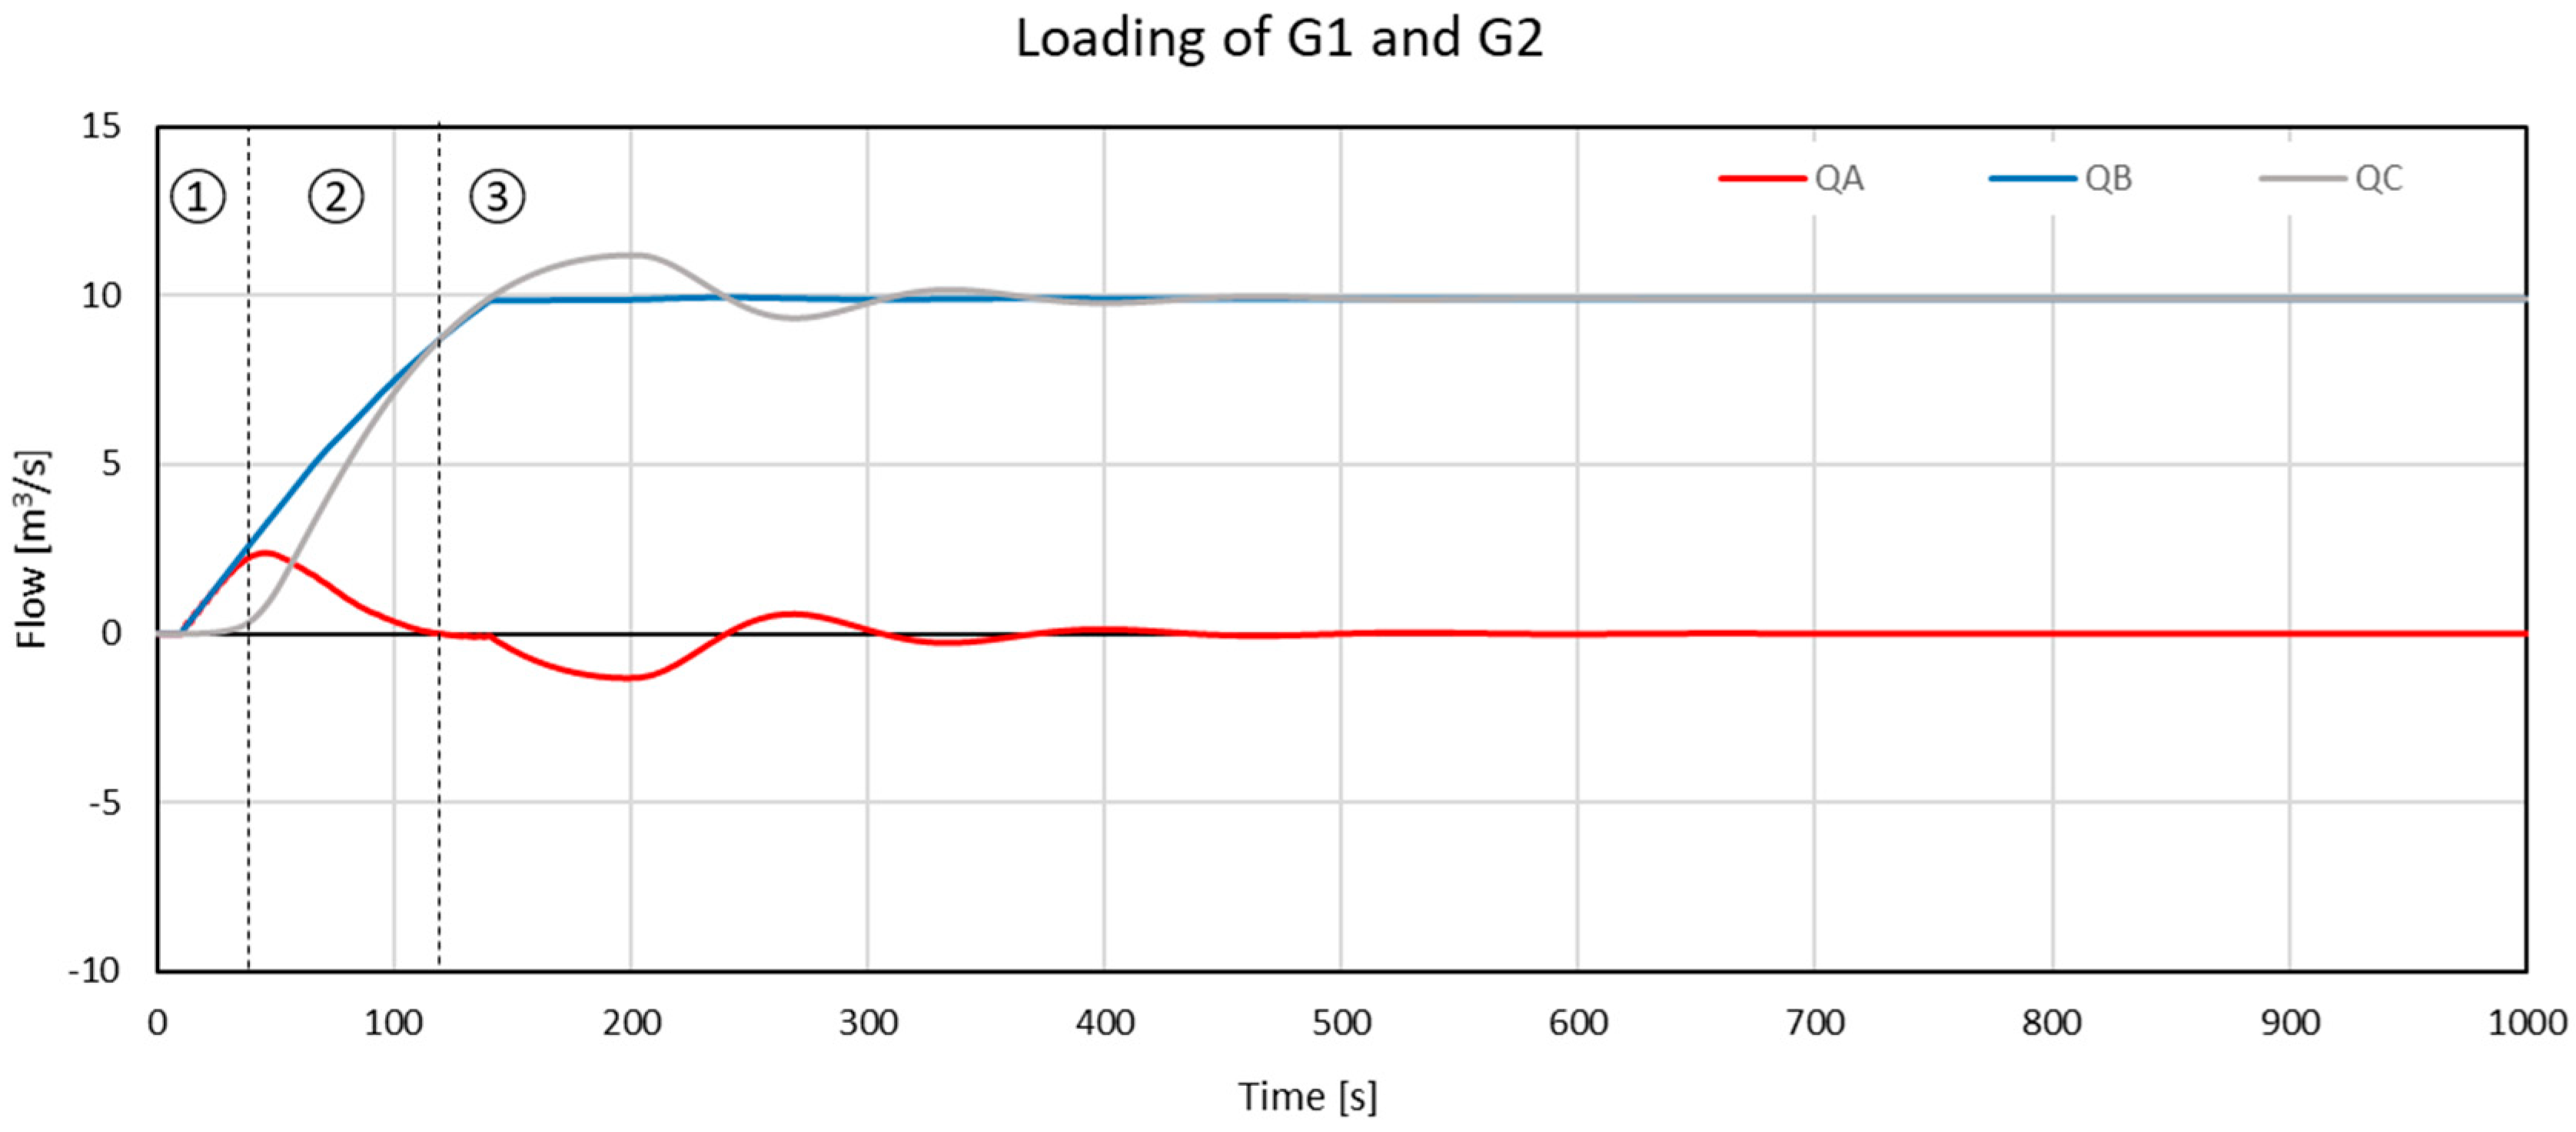
In order to evaluate the effect of this variation on the results of the 1D transient analysis, the values of k associated with each flow ratio are inserted for upsurge and downsurge directions in a 1D numerical model (Hytran software, v. 387.5.17, iConsult, Beirut, Lebanon). Two scenarios were tested, the scenario of loading of turbine groups G1 and G2 and the emergency closure of these two groups (QB = 10 m3/s, reservoir level at 1277 m a.s.l). Results showed that a variable inflow and outflow head loss coefficient with the flow share of the surge tank does not alter the transient analysis. Neither the water level extremes of the surge tank, nor the periods of mass oscillation seem to be affected. Pressure plots at the bottom of the surge tank were evaluated for the same scenarios, and they do not seem to be affected either.
By looking at the evolution of the discharges in the three branches of the system (Figure 11 and Figure 12), it is possible to identify the periods in which flow sharing takes place. Note that a positive value of QA refers to a flow going out of the surge tank into the main waterway galleries (pressure tunnel–pressure shaft) and a negative value of QA refers to a flow entering the surge tank from the main waterway galleries. A negative QC refers to a reverse flow in the pressure tunnel.
During a loading operation, three different zones can clearly be distinguished:
- 0 ≤ t < 40 s: the flow in the pressure tunnel QC is null, which is expected since the surge tank takes the role of the upstream reservoir to supply the penstock with the demanded flow. It is therefore the flow configuration (1) with QA = QB (QC = 0, no flow sharing).
- 40 ≤ t < 120 s: the flow supplied by the tank decreases gradually and the upstream reservoir starts to supply the system with an increasing QC. It is therefore flow configuration (1) with 0 < QA/QB < 1.
- 120 ≤ t < 500 s: mass oscillation between the upstream reservoir and the surge tank takes place. A flow entering the surge tank (negative flow) creates a demand for the flow in the system in addition to the one required by the penstock. This results in an increased pressure tunnel flow QC to accommodate both demands. This phase consists of successive alternations between modes (2) and (1) in which and 0 < QA/QC < 1 and 0 < QA/QB < 1. After 500 s, the steady generation mode is reached, and the mass oscillation phenomenon ends.
During an emergency closure, two different zones can be distinguished:
- 0 < t < 65 s: the flow in the pressure tunnel QC is shared by both the surge tank and the penstock. It is therefore the flow configuration (2) with 0 < QA/QC < 1. Note that the zone in which the flow ratio is below 20% constitutes about 18 s.
- t > 65 s: the flow in the penstock QB becomes null by around 65 s. Then, mass oscillation takes place. In this case, alternations between flow configurations (3) and (2) occur with QB ≈ 0. No flow sharing takes place, QA ≈ QC.
It can be seen from the charts in both operational cases, that the time extent involving flow sharing is too narrow to cause a significant effect on the discharge rate of the throttle. Therefore, the effect of flow splitting during transient events on the throttling head loss coefficient can be neglected without prejudice.
4. Discussion
In all the investigated aspects of this project, an evident interaction between the three modeling strategies (1D numerical, 3D numerical and physical) was observed and deemed necessary for a comprehensive design. By utilizing hybrid modeling, it is important to bear in mind that each modeling strategy is accompanied by advantages and limitations:
- 1D numerical modeling:
- Advantages: It is a fast method that can provide sufficient data for analyzing transient events and designing appropriate transient control devices in the system (surge tank dimensions for instance) based on critical load cases.
- Limitations: It can only provide the required head loss coefficients of the throttle and cannot serve as a tool to design its geometry. The throttle is modeled as a local restriction that has specific head loss characteristics without reflecting the real flow conditions (formation of the jet upstream or downstream, development of regions of swirling or flow separation). Current commercial 1D software are unable to model complex geometries of surge shafts, failing to reflect the real flow conditions across the expansion chambers.
- Physical Modeling:
- Advantages: It is adequate to represent the flow conditions of the real system on a reduced scale.
- Limitations: The design, construction, and systematic investigations are time-consuming. A sufficient number of measurements should be done for higher precision. Measurements of very small pressures or velocities that are in the same order of magnitude of the tolerance of the sensors may bias the results. Additionally, physical modeling does not allow obtaining flow parameters or visualizing flow patterns in all locations, despite the common usage of Plexiglas walls and the tests with dye injection. The latter does not lead to perceptible flow field features in a scaled model due to very rapid plume dispersion. Non-intrusive measurements e.g., using ultrasonic Doppler profiler (UVP) or particle image velocimetry (PIV) can reduce this limitation but require advanced instrumentation.
- 3D Numerical Modeling:
- Advantages: It allows the extraction of hydrodynamic values (numerical measurements) anywhere in the flow domain as well as the visualization of the flow fields on a prototype scale, the flow field being the major indicator of the effectiveness of the throttle arrangement and design. Iterations on the numerical model in the geometry optimization process are generally not as costly as the ones constructed and tested on a physical scale model.
- Limitations: It is accompanied by errors and uncertainties in the modelling approaches that should preferably be validated by a physical model. It takes a long computational time if a high mesh precision is required; a symmetry boundary condition may not always be used since a symmetrical geometry does not always imply symmetrical flow conditions.
- Hybrid Modeling As a Necessity
Eventually, adopting a holistic integrated approach that combines all means of modeling and backs them up by on-site measurements enables surmounting the limitations of a modeling strategy by the advantages of another one.
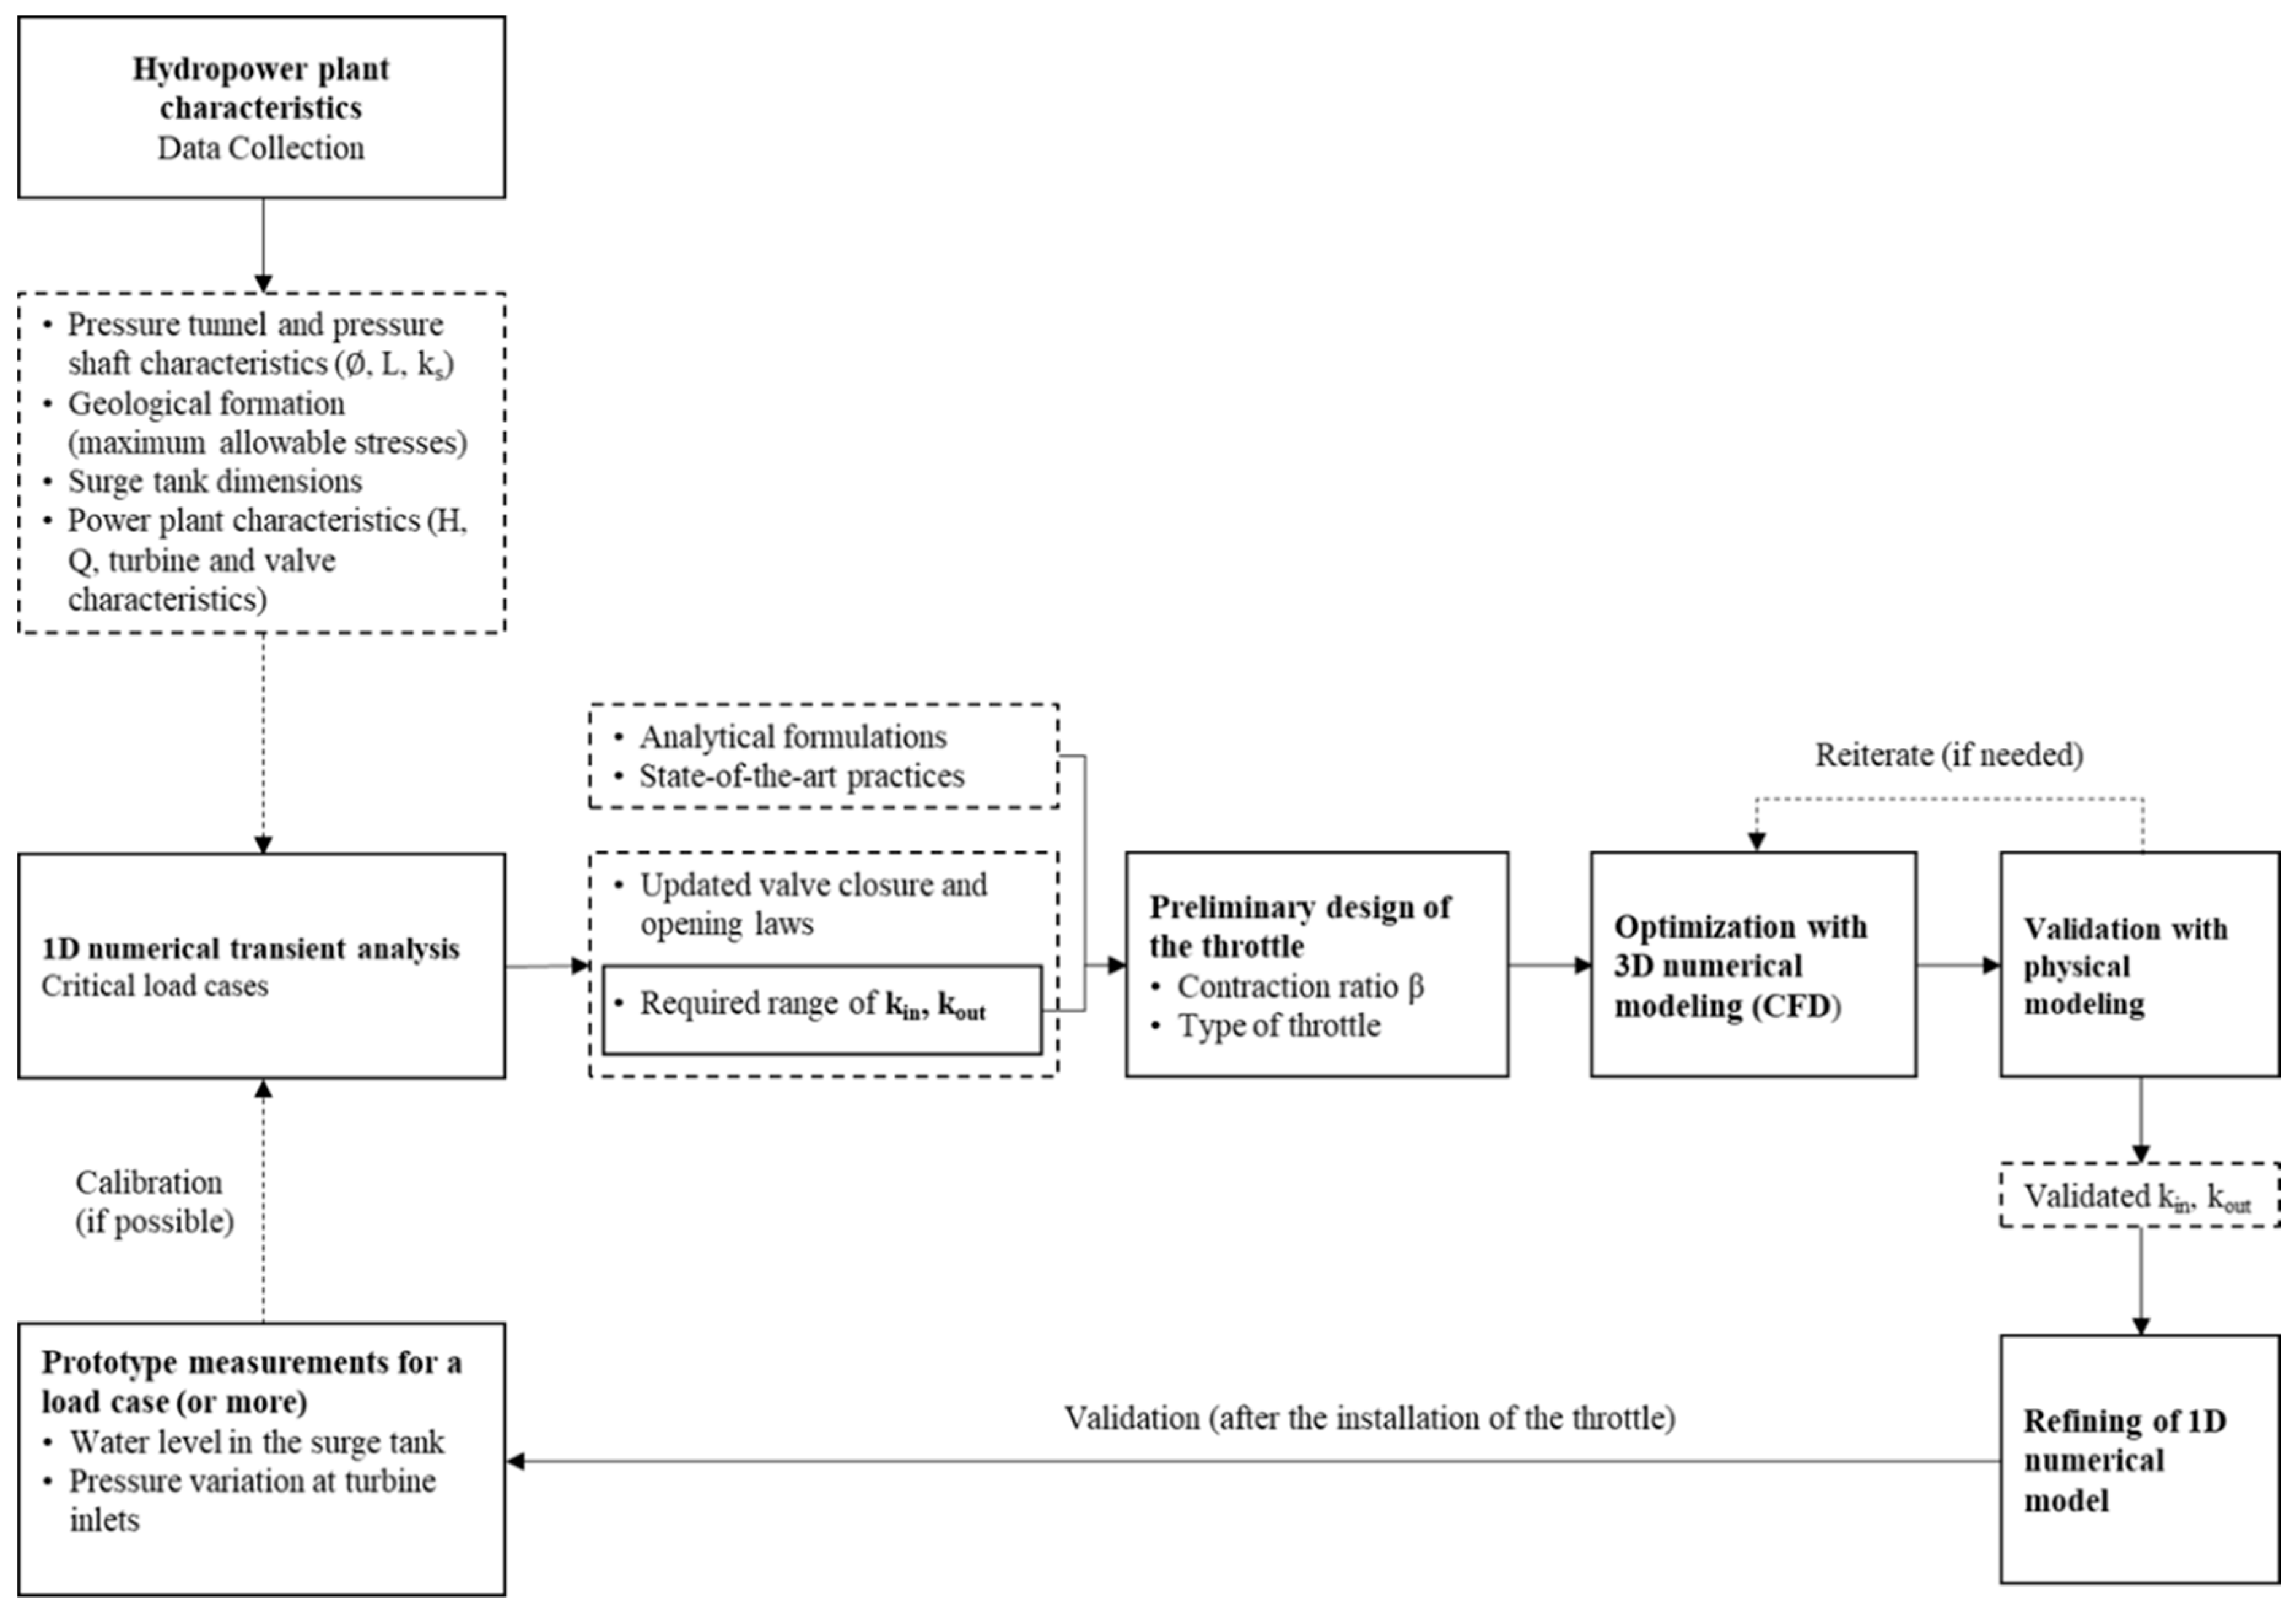
Figure 13 summarizes the proposed way of conducting such an approach in designing a throttled surge tank in the context of refurbishing high-head power plants.
The first step consists of collecting available data about the hydropower plant characteristics and the proposed changes with the refurbishment (increased discharge). Then, a 1D numerical transient analysis is conducted. The critical load cases allow identifying whether the maximum allowable pressures in the pressure tunnel and pressure shaft are respected, and whether water level extremes can be kept within the existing surge tank geometry. Otherwise, a modification of the transient event (such as slower valve closure/opening) and/or a modification of the geometry of the surge tank by introducing throttle devices might be needed. Associated parameters (inflow and outflow head loss coefficients) can be defined via 1D runs. Note that in the case of an island power plant (or a grid-connected power plant with frequency control), in addition to the pressure and water level constraints, the refurbishment analysis must also verify the stability of the system and the interference with the governor configuration.
A calibration of the 1D model is highly recommended and could be done via prototype measurements of water level in the surge tank and/or pressure measurements at turbine inlets (for one load case, or ultimately more).
Given the target range of head loss coefficients of the throttle, one can benefit from available analytical formulae as well as the state-of-the-art practices to come up with a preliminary design of the throttle: required contraction ratio, type of throttle (orifice, rack, and vortex) that depends on both the asymmetry ratio and the complexity of the geometry in the system.
Once the type of throttle and the preliminary dimensions are chosen, an optimization of the geometry may be done using 3D numerical modeling. After identifying the main geometrical characteristics of the throttle, the CFD model should be validated on a reduced scale model. If high discrepancies between the numerically and physically computed values of throttle’s head loss coefficients are noticed, a reiteration between the CFD and physical model might be needed. Once validated, the accurately determined head loss coefficients of the throttle can be re-implemented in the 1D numerical model to refine it. Optimally, the latter should be validated with on-site measurements that take place after mounting the throttle.
5. Conclusions
The current study enhances the confidence in 3D numerical modeling to provide preliminary convenient conclusions prior to passing into validation on a physical scale model, which thereby decreases the number of likely costly modifications with the latter. This implies that, in the case of Gondo for instance, using a 3D numerical model at the beginning of the design phase could have prevented testing on a physical scale model the alternative of a sliding gate with a very small opening. The latter was unable to achieve the objective head loss coefficients. A holistic approach is therefore proposed to examine the characteristics of a hydropower plant subject to a moderate increase of installed capacity. It includes hybrid modeling (1D numerical, 3D numerical and physical modeling) backed by calibration as well as validation with in-situ measurements. In such an approach, the physical model may no longer be advised for optimization purposes, but rather for validation tests on the beforehand numerically improved geometry.
Ultimately, further CFD investigations could be performed to explore the aptitudes of the CFD models to predict the same fluctuations of pressures and water levels as a 1D numerical model.
Author Contributions
Conceptualization and methodology: G.D.C., M.S. and S.V.; validation: S.V. and G.D.C.; formal analysis: M.S.; physical model investigations: N.A.; 1D and 3D numerical model investigation: M.S. and S.V.; writing—original draft preparation: M.S.; writing—review and editing: all authors; visualization and graphic design: M.S.; supervision and project administration, G.D.C. All authors have read and agreed to the published version of the manuscript.
Funding
This research received no external funding.
Acknowledgments
Special thanks goes to Energie électrique du Simplon SA (EES) and Alpiq Ltd. for mandating the Platform to perform the original study. The authors would also like to thank Etaeval who performed measurements during the first transient test campaign for model calibration; Hydro Exploitation SA who was involved in the power plant operation and supervision during transient tests and performed the second transient test campaign as well as the measurements of the detailed 3D geometry of the surge tank.
Conflicts of Interest
The authors declare no conflict of interest. The funders had no role in the design of the study; in the collection, analyses, or interpretation of data; in the writing of the manuscript, or in the decision to publish the results.
References
- Office Fédéral de L’énergie OFEN. Potentiel Hydroélectrique de la Suisse: Évaluation du Potentiel de Développement de la Force Hydraulique Dans le Cadre de la Stratégie Énergétique 2050; Département fédéral de l’environnement, des transports, de l’énergie et de la communication DETEC: Berne, Switzerland, 2019. [Google Scholar]
- Adam, N.J.; De Cesare, G.; Nicolet, C.; Billeter, P.; Angermayr, A.; Valluy, B.; Schleiss, A.J. Design of a Throttled Surge Tank for Refurbishment by Increase of Installed Capacity at a High-Head Power Plant. J. Hydraul. Eng. 2018, 144, 05017004. [Google Scholar] [CrossRef]
- Kendir, T.E.; Ozdamar, A. Numerical and experimental investigation of optimum surge tank forms in hydroelectric power plants. Renew. Energy 2013, 60, 323–331. [Google Scholar] [CrossRef]
- Li, Y.T. Orifice head loss in the T-section of a throttled surge tank. Water Power 1972, 24, 326–334. [Google Scholar]
- Adam, N.J.; De Cesare, G.; Schleiss, A. Surge Tank Throttles for Safe and Flexible Operation of Storage Plants; Hydro Conference: Montreux, Switzerland, 2016; Volume 8. [Google Scholar]
- Alligne, S.; Rodic, P.; Arpe, J.; Mlacnik, J.; Nicolet, C. Determination of Surge Tank Diaphragm Head Losses by CFD Simulations. In Advances in Hydroinformatics; Gourbesville, P., Cunge, J., Caignaert, G., Eds.; Springer: Singapore, 2014; pp. 325–336. ISBN 978-981-4451-41-3. [Google Scholar]
- Gabl, R.; Righetti, M. Design criteria for a type of asymmetric orifice in a surge tank using CFD. Eng. Appl. Comput. Fluid Mech. 2018, 12, 397–410. [Google Scholar] [CrossRef] [Green Version]
- De Cesare, G.; Adam, N.J.; Nicolet, C.; Angermayr, A.; Valluy, B. Surge Tank Geometry Modification for Power Increase; Hydro Conference 2015: Bordeaux, France, 2015; p. 16. [Google Scholar]
- Hachem, F.; Nicolet, C.; Duarte, R.; De Cesare, G.; Micoulet, G. Hydraulic Design of the Diaphragm’s Orifice at the Entrance of the Surge Shaft of FMHL Pumped-storage Power Plant. In Proceedings of the 35th IAHR World Congress, Chengdu, China, 8–13 September 2013. [Google Scholar]
- Adam, N.J.; De Cesare, G.; Schleiss, A.J. Influence of geometrical parameters of chamfered or rounded orifices on head losses. J. Hydraul. Res. 2019, 57, 263–271. [Google Scholar] [CrossRef]
- Idelchik, I.E. Handbook of hydraulic resistance, 2nd ed.; Revised and Augmented; Hemisphere Publishing Corporation: New York, NY, USA, 1986. [Google Scholar]
- Richter, W.; Dobler, W.; Knoblauch, H. Hydraulic and numerical modelling of an asymmetric orifice within a surge tank. In Proceedings of the 4th IAHR International Symposium on Hydraulic Structures, Porto, Portugal, 9–11 February 2012; p. 7. [Google Scholar]
- An, J.F.; Zhang, J.; Cheng, S. Coefficients of Local Head Losses in Steady-State Flow of Throttled Surge Tanks with Standpipe by CFD. Adv. Mater. Res. 2013, 677, 290–295. [Google Scholar] [CrossRef]
- Gardel, A.; Rechsteiner, G.F. Les Pertes de Charge Dans les Branchements en té des Conduites de Section Circulaire. In Bulletin Technique de la Suisse Romande; Publication/Ecole Polytechnique Fédérale Lausanne: Lausanne, Switzerland, 1970; Volume 118. [Google Scholar]
- Zhou, J.; Palikhe, S.; Cai, F.; Liu, Y. Experimental and simulation-based investigations on throttle’s head loss coefficients of a surge tank. Energy Sci. Eng. 2020, 1–12. [Google Scholar] [CrossRef]
- Klasinc, R.; Bilus, I. Experimental and numerical approach to surge tank improvements. In Proceedings of the International Symposium on Water Management and Hydraulic Engineering, University of Ss Cyril and Methodius, Skopje, Macedonia, 1–5 September 2009; pp. 339–348. [Google Scholar]
- Kim, S.-H. Design of surge tank for water supply systems using the impulse response method with the GA algorithm. J. Mech. Sci. Technol. 2010, 24, 629–636. [Google Scholar] [CrossRef]
- Gabl, R.; Achleitner, S.; Neuner, J.; Götsch, H.; Aufleger, M. 3D-numerical optimisation of an asymmetric orifice in the surge tank of a high-head power plant. In Proceedings of the 34th IAHR Congress 2011-Balance and Uncertainty: Water in a Changing World, Incorporating the 33rd Hydrology and Water Resources Symposium and the 10th Conference on Hydraulics in Water Engineering; International Association for Hydro-Environment Engineering and Research (IAHR), Brisbane, Australia, 26 June–1 July 2011; pp. 2428–2435. [Google Scholar]
- Nabi, G.; Kashif, M.; Tariq, M. Hydraulic Transient Analysis of Surge Tanks: Case Study of Satpara and Golen Gol Hydropower Projects in Pakistan. Pak. J. Eng. Appl. Sci. 2011, 8, 15. [Google Scholar]
- Schneider, J.; Richter, W.; Knoblauch, H.; Zenz, G. Physikalische und numerische Untersuchungen von Wasserschlössern im Rahmen der Neuerrichtung von Pumpspeicherkraftwerken. Simul. Model. Wasserbau Wasserwirtsch. 2014, 50, 313–322. [Google Scholar]
- Meusburger, P. Study of different surge tank design for Observer-muntwerk II. Wasserwirtschaft 2015, 105, 53–57. [Google Scholar] [CrossRef]
- Bhattarai, K.P.; Zhou, J.; Palikhe, S.; Pandey, K.P.; Suwal, N. Numerical Modeling and Hydraulic Optimization of a Surge Tank Using Particle Swarm Optimization. Water 2019, 11, 715. [Google Scholar] [CrossRef] [Green Version]
- Versteeg, H.K.; Malalasekera, W. An Introduction to Computational Fluid Dynamics: The Finite Volume Method, 2nd ed.; Pearson Education Ltd.: Harlow, UK; New York, NY, USA, 2007; ISBN 978-0-13-127498-3. [Google Scholar]
- Christensen, R.T.; Spall, R.E.; Barfuss, S.L. Application of Three RANS Turbulence Models to Aged Water Transmission Pipes. J. Hydraul. Eng. 2011, 137, 135–139. [Google Scholar] [CrossRef]
Figure 1.
Sketch of the waterway and the hydroelectric power plant [2].
Figure 1.
Sketch of the waterway and the hydroelectric power plant [2].

Figure 2.
3D model of the system consisting of the pressure tunnel, pressure shaft, surge tank and a throttle installed at its entrance (black-dotted arrows indicate the flow direction from C to B in turbining mode i.e., normal operation).
Figure 2.
3D model of the system consisting of the pressure tunnel, pressure shaft, surge tank and a throttle installed at its entrance (black-dotted arrows indicate the flow direction from C to B in turbining mode i.e., normal operation).

Figure 3.
Velocity streamlines for a 14 m3/s flow going from A to B (turbine opening).

Figure 4.
Variation of the total head and piezometric head as plotted along a measurement axis passing through the middle of the pipeline (Q = 14 m3/s, in the A-B direction during turbine opening).
Figure 4.
Variation of the total head and piezometric head as plotted along a measurement axis passing through the middle of the pipeline (Q = 14 m3/s, in the A-B direction during turbine opening).

Figure 5.
Velocity streamlines during mass oscillation: (a) flow into the surge tank (direction C–A); (b) flow exiting the surge tank (direction A–C) (Q = 5 m3/s).
Figure 5.
Velocity streamlines during mass oscillation: (a) flow into the surge tank (direction C–A); (b) flow exiting the surge tank (direction A–C) (Q = 5 m3/s).

Figure 6.
Pressure measurement sections (similar to the physical model).

Figure 7.
Head loss coefficient for the four flow directions (the best linear fit of combined numerical and experimental data series is shown).
Figure 7.
Head loss coefficient for the four flow directions (the best linear fit of combined numerical and experimental data series is shown).

Figure 8.
Variation of relative value of the head loss coefficient kAC (surge tank outflow) and kCA (surge tank inflow) with the water level in the surge tank.
Figure 8.
Variation of relative value of the head loss coefficient kAC (surge tank outflow) and kCA (surge tank inflow) with the water level in the surge tank.

Figure 9.
Physically possible flow configurations through a Y-junction.

Figure 10.
(a) Variation of kAB with the flow share; (b) Variation of kCA with the flow share.

Figure 11.
Flows through the three branches during loading of G1 and G2.

Figure 12.
Flows through the three branches during the emergency closure of G1 and G2.

Figure 13.
Holistic approach to design throttled surge tanks (during a refurbishment of a high-head power plant).
Figure 13.
Holistic approach to design throttled surge tanks (during a refurbishment of a high-head power plant).

Table 2.
Experimental, numerical (ANSYS-CFX), and combined best linear fit head loss coefficients.
| Investigated Flow Direction | k (Combined Data Series Best Fit) | k (Experimental Data Series) | k (Numerical Data Series) | Relative Difference (%) |
|---|---|---|---|---|
| A–C (S1–S5) | 45.7 ± 0.48 | 45.9 ± 0.70 | 45.2 ± 0.12 | 1.42 |
| A–B (S1–S4) | 40.6 ± 0.35 | 39.8 ± 0.35 | 42.1 ± 0.33 | 6.05 |
| C–A (S5–S1) | 28.4 ± 0.25 | 29.6 ± 0.54 | 28.2 ± 0.013 | 4.93 |
| C–B (S5–S4) | 0.95 ± 0.02 | 0.98 ± 0.02 | 0.86 ± 0.004 | 12.24 |
Publisher’s Note: MDPI stays neutral with regard to jurisdictional claims in published maps and institutional affiliations. |
© 2020 by the authors. Licensee MDPI, Basel, Switzerland. This article is an open access article distributed under the terms and conditions of the Creative Commons Attribution (CC BY) license (http://creativecommons.org/licenses/by/4.0/).
Share and Cite
MDPI and ACS Style
Seyfeddine, M.; Vorlet, S.; Adam, N.; De Cesare, G. Holistic Design Approach of a Throttled Surge Tank: The Case of Refurbishment of Gondo High-Head Power Plant in Switzerland. Water 2020, 12, 3440. https://doi.org/10.3390/w12123440
AMA Style
Seyfeddine M, Vorlet S, Adam N, De Cesare G. Holistic Design Approach of a Throttled Surge Tank: The Case of Refurbishment of Gondo High-Head Power Plant in Switzerland. Water. 2020; 12(12):3440. https://doi.org/10.3390/w12123440
Chicago/Turabian StyleSeyfeddine, Mona, Samuel Vorlet, Nicolas Adam, and Giovanni De Cesare. 2020. "Holistic Design Approach of a Throttled Surge Tank: The Case of Refurbishment of Gondo High-Head Power Plant in Switzerland" Water 12, no. 12: 3440. https://doi.org/10.3390/w12123440
Note that from the first issue of 2016, this journal uses article numbers instead of page numbers. See further details here.