Water Loss Management in Small Municipalities: The Situation in Tyrol


1
Unit of Environmental Engineering, Department of Infrastructure Engineering, University of Innsbruck, Technikerstraße 13, 6020 Innsbruck, Austria
2
Federal State of Tyrol, District Construction Office, 6020 Innsbruck, Austria
*
Authors to whom correspondence should be addressed.
Water 2020, 12(12), 3446; https://doi.org/10.3390/w12123446
Submission received: 29 October 2020
/
Revised: 4 December 2020
/
Accepted: 6 December 2020
/
Published: 8 December 2020
(This article belongs to the Section Water Resources Management, Policy and Governance)
Abstract
:Water losses in water distribution networks (WDNs) are unavoidable. Water losses are evaluated based on performance indicators (PIs) and used for future recommendations for network operators to take measures against water losses. However, these evaluations primarily focus on large and medium sized WDN and do not deal with the challenges of small WDNs (e.g., technical, and financial limitations, missing data). Therefore, an appropriate water loss management is a major challenge for operators in the federal state of Tyrol (Austria) due to the high number of small WDNs, e.g., low income in combination with long network lengths. In this regard, this work specifies and discusses state funding in Austria to support network operators to reduce water losses. To assess the impacts on management strategies, 40 WDNs, supplying 200 to 16,000 inhabitants, are investigated in detail. As the comparison of different PIs shows, a volume related PI (e.g., water loss volume divided by total water demand) is recommend as the decision criterion for local authorities due to minimal efforts and its easy calculation. Moreover, public funding helps to significantly reduce water losses in individual systems, but countermeasures should be different for small and larger WDNs. For example, leakage detection campaigns and rehabilitation planning based on pipe age should be established in future for larger WDNs in Tyrol. In contrast, an online flow metering system to monitor system inflows is suggested for small WDNs. Based on measurement data, leakages and burst can be detected and repaired swiftly.
1. Introduction
Water loss in water distribution networks (WDNs) can be defined as the difference between the quantity of drinking water fed to the system and the metered and billed water consumption [1,2]. These losses, called non-revenue water (NRW), consist of unbilled but authorized water consumption (e.g., extractions from hydrants), apparent losses (e.g., unauthorized water extractions or meter inaccuracies), and real losses caused by leakages [1,2], whereby the greatest influence on water balance is from real losses [3]. Water losses in WDNs vary widely depending on the maintenance efforts. In this context, water losses can be as high as 40% and 80% of system inputs in Europe [4] and developing countries [5], respectively, while being on average between 16% and 30% [4,5,6]. Apart from financial costs, water losses cause ecological issues too, for example, drinking water that has to be treated and pumped more than once [7,8] and water losses can increase stress on water resources in countries with water scarcity [9]. Additionally, leakages represent a major challenge in sustainable agriculture and food growing, whereas water losses reduce the amount of available water and further increase the resource conflict between agriculture and domestic water usage [10,11,12]. In total, global water losses in WDNs are estimated to be 126 billion cubic meters per year, corresponding to a total value of USD 39 billion [13].
Water losses in individual WDNs are evaluated and compared by using technical performance indicators (PIs) as described by the International Water Association (IWA) [1,14]. Basically, PIs relate water losses to system parameters, where a higher value corresponds to an increased amount of water losses. However, a correct assessment is important as recommendations for network operators are based on these indicators [1]. For example, these measures can include leakage detection approaches [15,16,17,18,19,20,21,22] or rehabilitation planning [23,24,25] to reduce water losses in WDNs. According to the literature, simple PIs (e.g., NRW compared to total system input) are too dependent on current withdrawal quantities and should not be used [14,26]. Therefore, the infrastructure leakage index (PIILI) as the ratio between real losses and real losses reduced to a technically unavoidable level is recommended as the input value in the literature [26,27]. The determination of PIILI as an input parameter for future measures requires a large amount of data and is therefore time-consuming. In this regard, water loss management is, particularly for very small municipalities (<5000 inhabitants), a major challenge [28,29]. Additionally, network operators of small WDNs (common in Austria) have to deal with the following problems: (1) long total network length due to distributed settlement area; and (2) low income due to low number of inhabitants supplied with drinking water. Consequently, advanced water loss strategies and qualified manpower are too expensive, and an appropriate water loss management is a major challenge. This work presents and discusses experiences and influences of state funding on water loss management for small municipalities in the federal state of Tyrol (Austria).
The detailed objective of this work is to support network operators of small municipalities and local authorities for a goal-oriented tackling of water loss management. Our goals can be summarized as follows:
- Identify a usable performance indicator (PI) for water loss management that is especially suitable for challenges of very small municipalities.
- Present common sources of water loss in small water distribution networks (WDNs).
- Describe influences of state funding and rehabilitation planning on performance of WDNs (e.g., improving water loss management).
- Discuss additional problems faced by operators of small WDNs.
In this context, the article is structured as follows: Section 2 reviews state-of-the-art PIs for WDNs, including an insight into Austrian regulations and state funding. Furthermore, characteristics of the 40 investigated WDNs are described in this section. In Section 3, results regarding different areas of water loss management (water loss assessment, identification of locations of water loss, and rehabilitation planning) are presented and discussed, supplemented by additional problems faced by network operators. Finally, Section 4 provides the conclusions and give guidance how to apply goal-oriented water loss management in small municipalities.
2. Materials and Methods
2.1. Technical Performance Indicators for WDNs
One of the simplest PIs is the volume related PI (PIV), calculated by the following equation:
where QL is the estimated water loss volume (m3/a) and QD is the water demand volume (m3/a). The literature recommends total system input as the reference value [26,27]. In contrast, Austrian water law specifies that water demand should be used for comparison and therefore that is what was used as the basis in this work. The key advantage of PIV is that this PI can be easily calculated and is therefore often used, but according to recommendations of the IWA, it is not suitable for determining the effectiveness of measures in regard to real water losses [14,26].
Other simple PIs are PIL (m3/h/km) and PIC (litre/day/service connection), which include basic network characteristics in the calculation. For example, PIL relates water losses to network length, whereas PIC establishes a relationship between water losses and number of service connections. PIL and PIC are calculated by the following equations:
where Lm is the total length of the network (km) and NC the total number of service connections. Equation (2) is limited to not more than 20 service connections per kilometer of main pipe as the amount of water loss of service connections are not considered explicitly. In contrast, Equation (3) relates water losses to the number of service connections and should be used with more than 20 service connections per kilometer of main pipe. According to the literature, application of a PI related to network design is limited and more suitable for target settings as it does not take operating characteristics (e.g., water pressure, seasonality) into account [23].
In this regard, the infrastructure leakage index (PIILI) is the most used and recommended PI:
where Lp is the average length of service connections (m) and P is the average operating pressure (m). PIILI was specifically designed to compare real losses between different systems, including local conditions like the operating pressure [26]. Additionally, PIILI provides an indication of the minimum possible water loss that can be achieved by the existing infrastructure [23,26]. However, disadvantages of PIILI are the high number of input parameters and that the results of the equation are not particularly understandable for non-technicians [23]. At first, usage of PIILI was limited to larger networks (more than 5000 or 3000 service connections depending on the literature), but recent literature [30,31] concluded that PIILI can be used for smaller WDNs.
2.2. Overview of Austrian Standards and State Funding Related to WDNs
The Austrian water law (Wasserrechtsgesetz—WRG, 1959) specifies an efficient use of drinking water [32], inducing network operators to maintain the WDN. The law obliges network operators to engage external consultants to technically and hygienically assess the state of the investigated WDN. This process includes the use of state-of-the-art technologies to quantify water losses, to calculate a water balance, and to identify and localize leakages. Subsequently, the network operators have to repair and renew the system and submit a report to the competent authority. This process is repeated every five years to maintain the WDNs at a high standard. Furthermore, the law regulates that in case of intentionally wrong reports, the network operator has to compensate for the damages caused.
Additionally, the Austrian government funds various measures that ensure problem-free operation and a reduction of water consumption. To specifically support operators of small WDNs, development of a pipe information systems and leakage detection campaigns were funded with a maximum of 50% and 62.5% of the total cost since 2007 and 2016, respectively. The development of a pipe information system includes a survey of location and properties (e.g., diameter, material, construction year) of various network elements and a creation of a digital image of the network. When water losses are higher than 20% of the total system input, leakage detection is mandatory to obtain governmental funding.
2.3. Case Study
In this study, the performances of different WDNs located in the federal state of Tyrol (Austria) were investigated. Tyrol is a federal state with 757,850 inhabitants and an area of 12,640 km2, subdivided into 279 municipalities. Only 24 municipalities have an official population of more than 5000 persons, and 150 municipalities have less than 1500 inhabitants. In total there are 760 public drinking water facilities, which are mostly operated by municipalities, with a degree of connection to about 96% of the population [33]. Additionally, tourism accounts for a significant share of water consumption due to the Alpine location of Tyrol, and in winter, water is used for artificial snow production too. The federal state of Tyrol is located in the Dfb climate cone, where D, f, and b, refer to cold climate, without dry season, and warm summer, respectively [34]. Average domestic water consumption is 135 L per capita per day. Additionally, there is a clear distinction between winter (120 L per capita per day) and summer (150 L per capita per day), mainly caused through increased outdoor applications (e.g., garden irrigation, filling of private swimming pools) [35].
The evaluations of the WDNs were based on using the above-mentioned reports according to the Austrian water law (11 available supervision reports) and funding reports (23 available reports). Additionally, a network survey was conducted in 2012 and the results were included in this work (40 available reports).
2.3.1. Network Characteristics
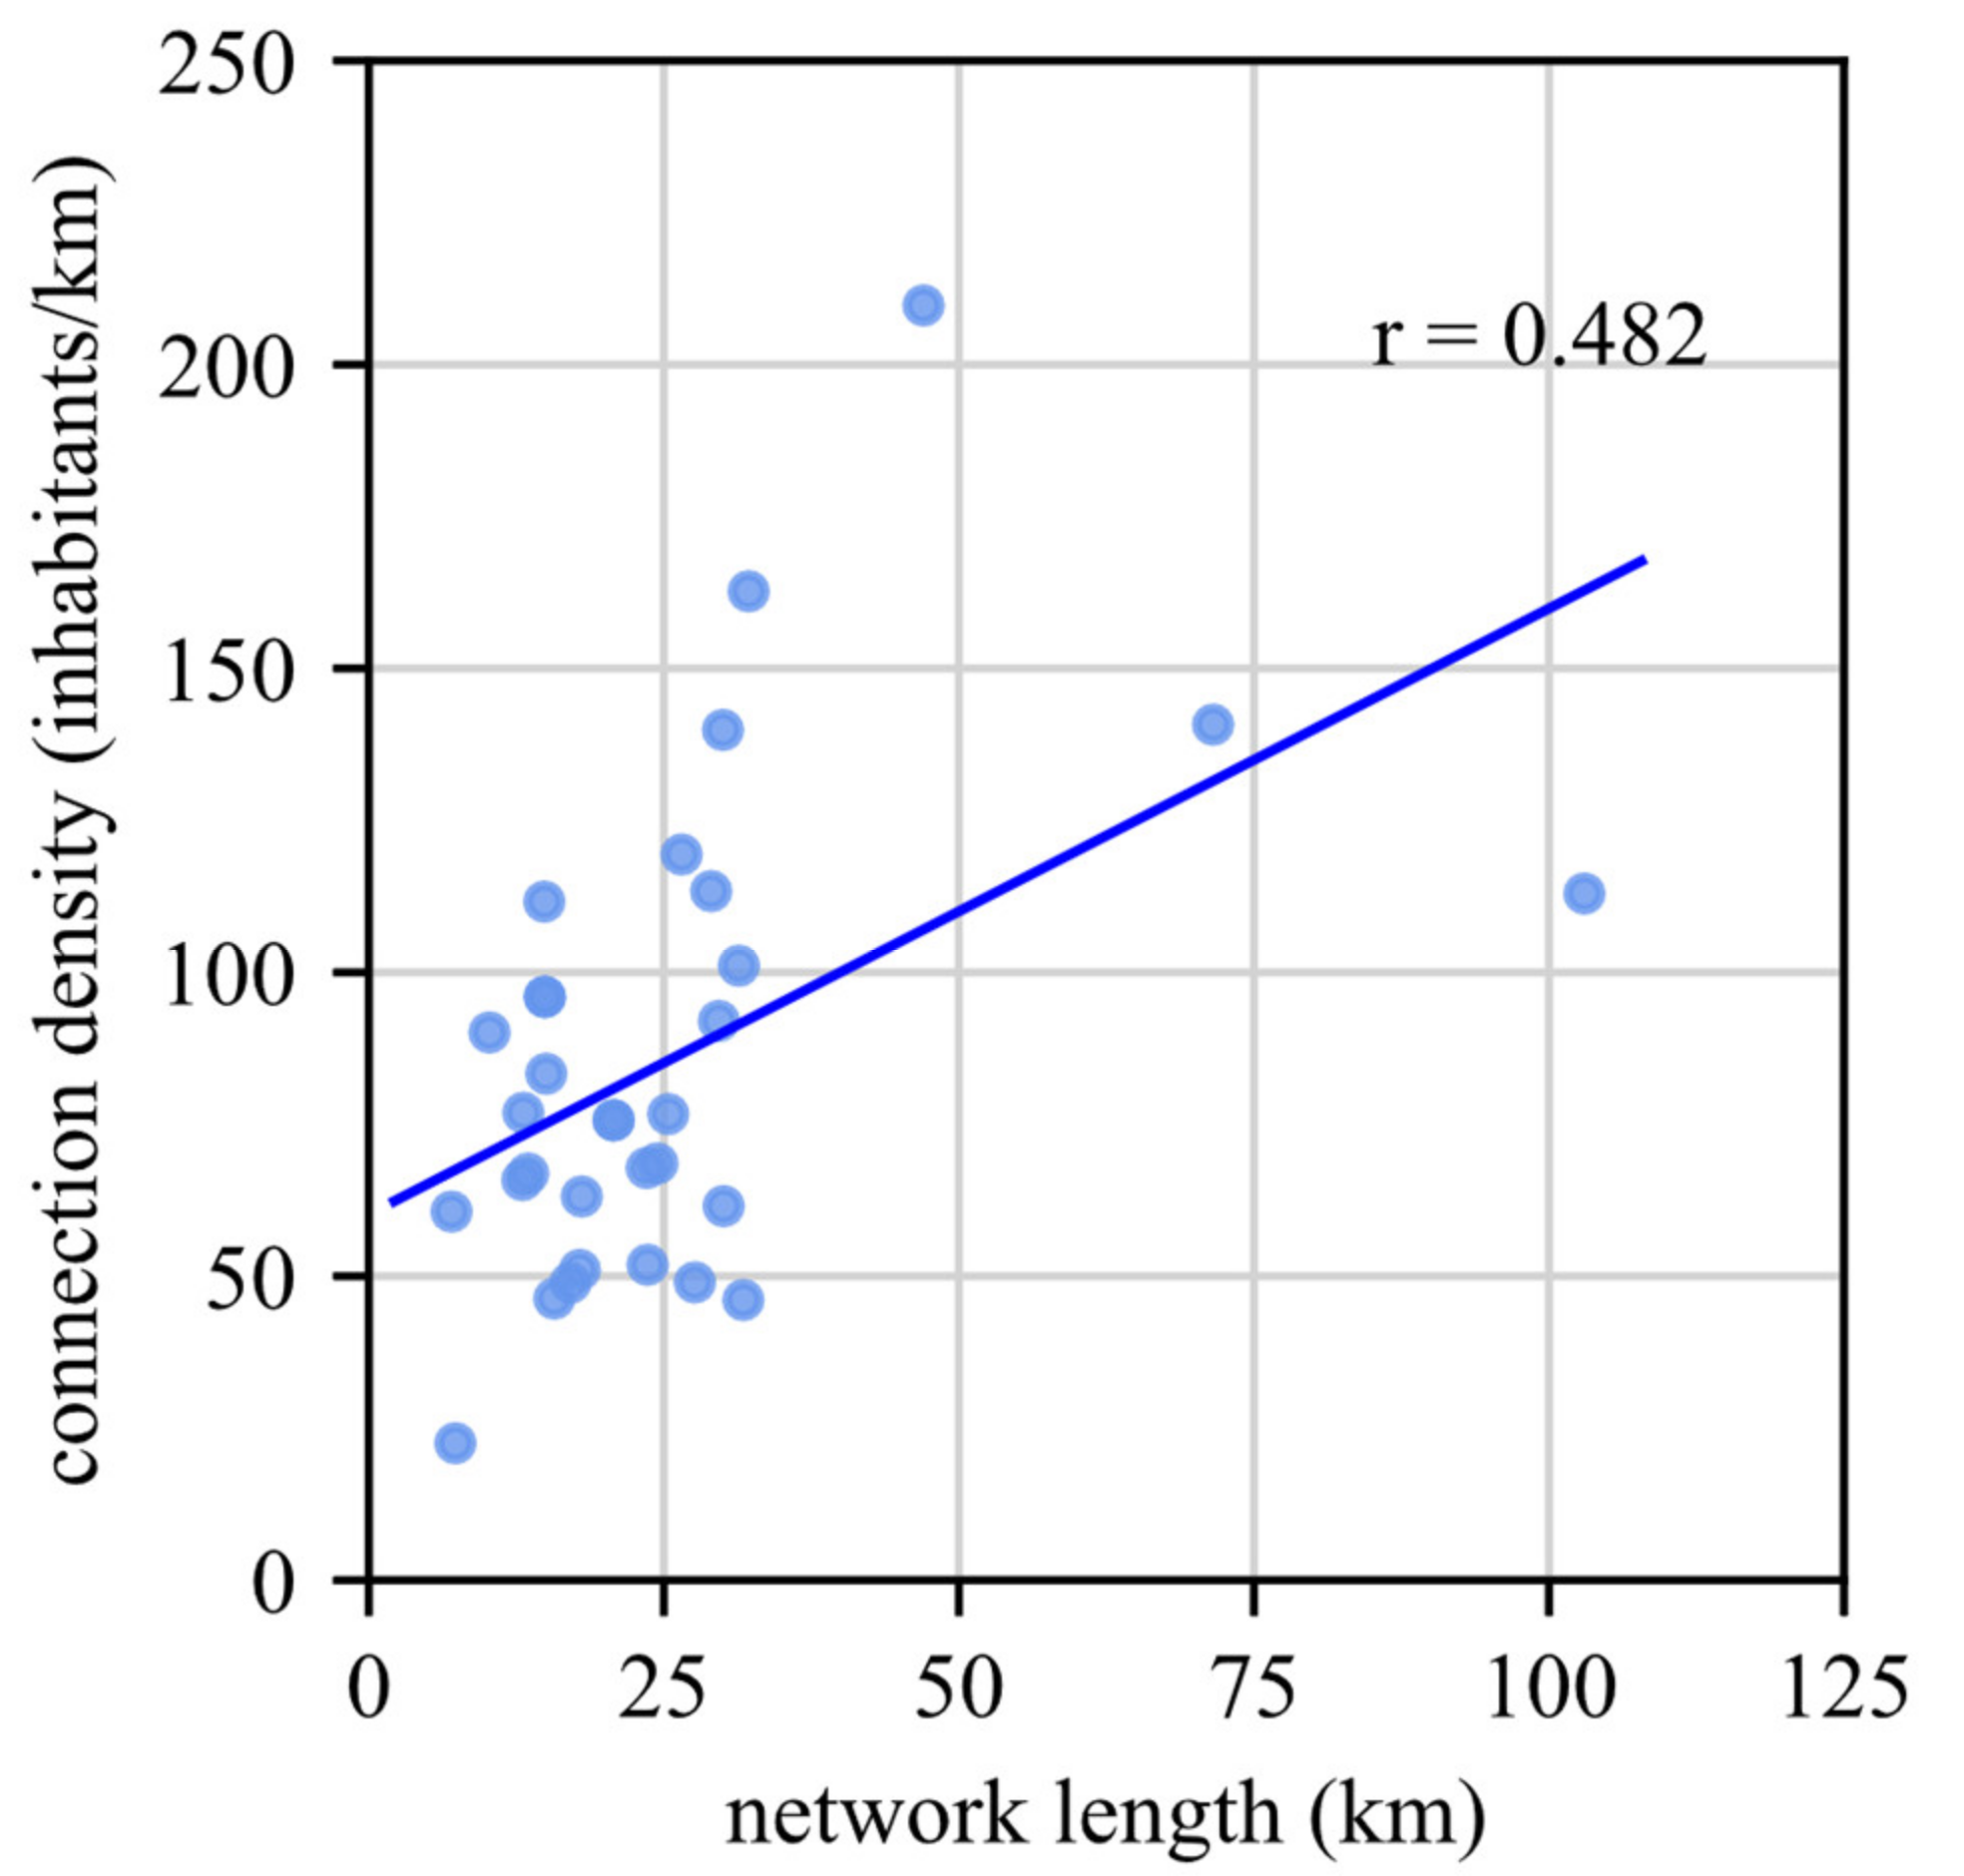
In total, 40 WDNs were investigated with a supply area ranging from 0.36–120 km2. However, WDNs located in Tyrol are subject of the critical infrastructure protection (CIP) of Austria [36], including the regulation of usage of WDNs data. Therefore, the data presented should not give any indication of the location of the WDNs and, consequently, detailed information on the water infrastructure itself cannot be provided. To overcome this limitation, Table 1 shows characteristic system variables using statistical parameters (e.g., minimum, mean, and maximum) to provide certain details relevant for calculation of PIs. Network data was extracted from funding reports, including average length and number of service connections, and afterwards was analyzed with a geographical information system (GIS). The average total network length was 25.6 km and the average number of service connections was 642, with 16.8 m length each. In this context, Figure 1 shows the connection density between total inhabitants and total network length. As can be seen, connection density is in the range of 22 to 210 connected inhabitants per km network pipes and increases slightly with increased network length. Sources of drinking water are mostly springs; groundwater wells are additionally used in five WDNs. In all investigated cases, drinking water is supplied fully gravity driven. System pressure was estimated based on the difference between tank height and the center the of supplied area, considering pressure reduction valves (if known). As the evaluations have shown, average network pressure was in the range of 50 to 110 m. Average network age was calculated as a weighted average of all pipes being between 1962 and 2002.
2.3.2. Missing Data
In 29 reports water demand was missing and in 11 reports number of service connections was missing. In the literature [37,38,39], the following approaches to handle incomplete data sets and missing data are described: (1) complete case analysis: deleting all cases with missing data and investigating only complete datasets; (2) single imputation: replacing missing values with methods that allow for a good estimation of the values, and (3) multiple imputation: 3-step procedure (imputation, analysis, and pooling) to determine missing values including uncertainty analysis. As the probability of missing values (demand and/or service connections) is equal for all investigated WDNs, single imputation is a possible approach [40] and was chosen as the method to handle missing values in this work. Additionally, estimations with single imputations are based on simpler relationships, therefore promoting practical application for local authorities and network operators of small WDNs. For calculations, official and free available governmental data (e.g., number of inhabitants, overnight stays, and number of buildings) were used as input parameters to estimate assumed missing values. The estimated (assumed missing) data can then be validated with actual available data.
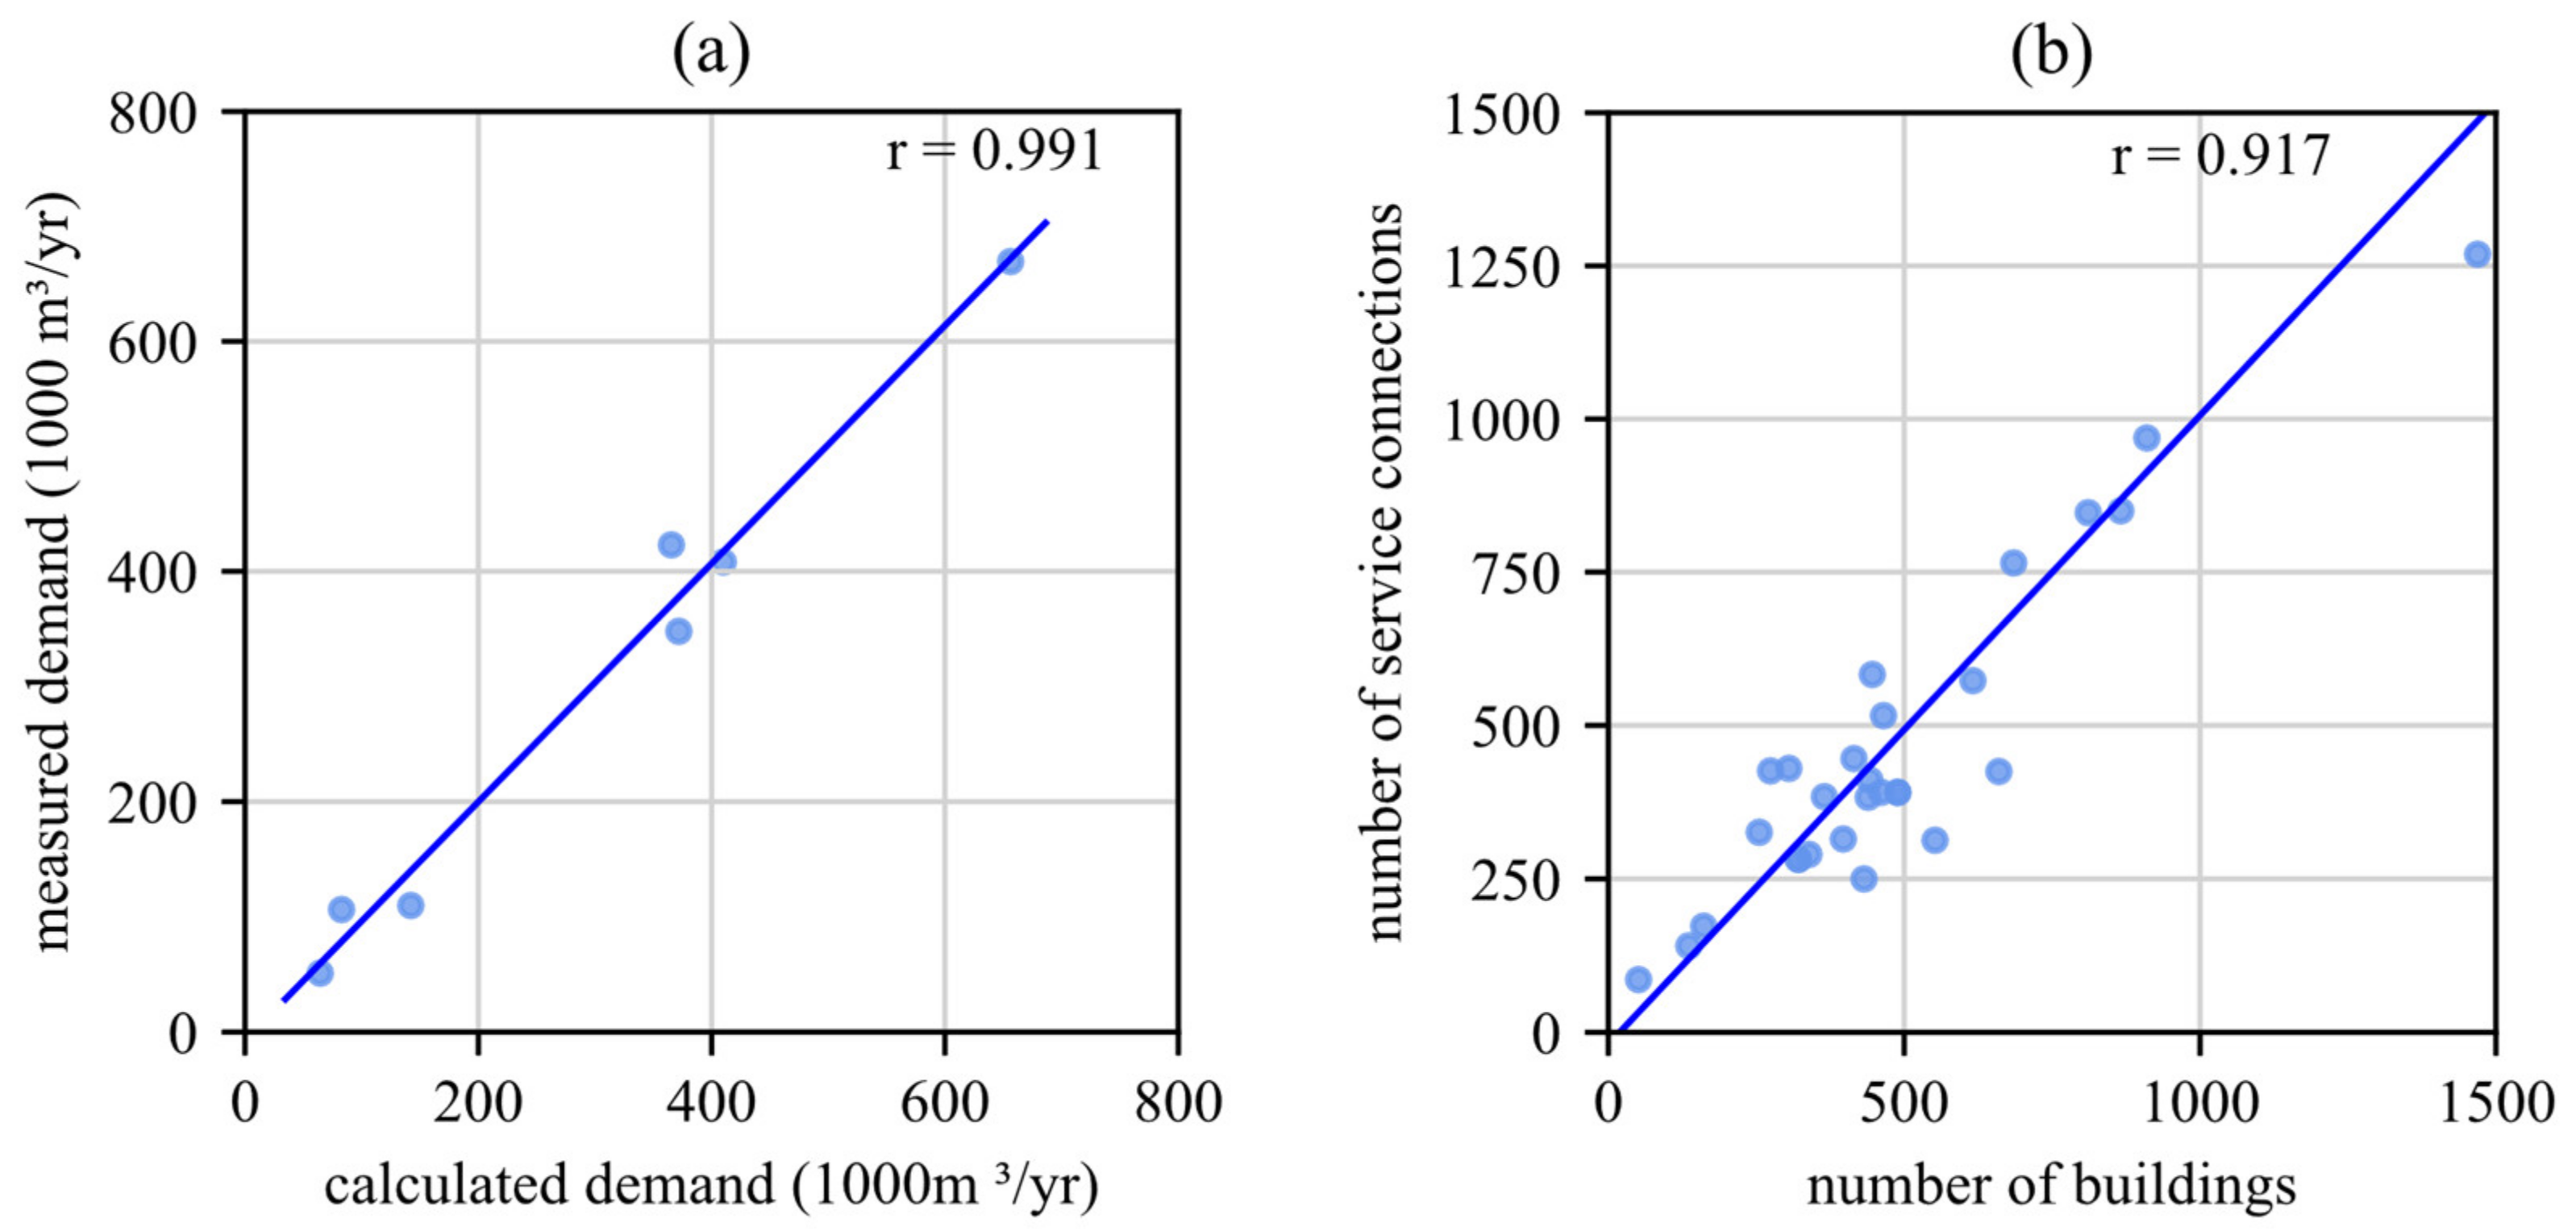
A water consumption of 250 L per inhabitant per day, including domestic, agriculture, and industrial use, and a water usage of 200 L per overnight stay was assumed to calculate annual water demand. Figure 2a shows a comparison between calculated water demand and measured network inflow from supervision reports reduced by estimated water losses. One municipality has a high amount of water demand for snow making, and was therefore not considered further [28]. In the case of a missing number of service connections, this value was estimated by using the number of buildings in a municipality. Figure 2b shows the correlation between number of buildings and number of service connections. In two municipalities, consumers are only partially supplied with drinking water from the public WDNs, therefore, these municipalities were not considered further for evaluations.
A correlation analysis revealed that both correlation coefficients (r) are higher than 0.9, indicating a good correlation between measured and estimated values. Consequently, number of inhabitants and overnight stays allow for a good assumption of annual water demand, and number of buildings allows for a conclusion of service connections in the case of missing data. In the case of missing length, length of service connections was assumed to be 15 m.
3. Results and Discussion
3.1. Evaluation of Water Loss Performance
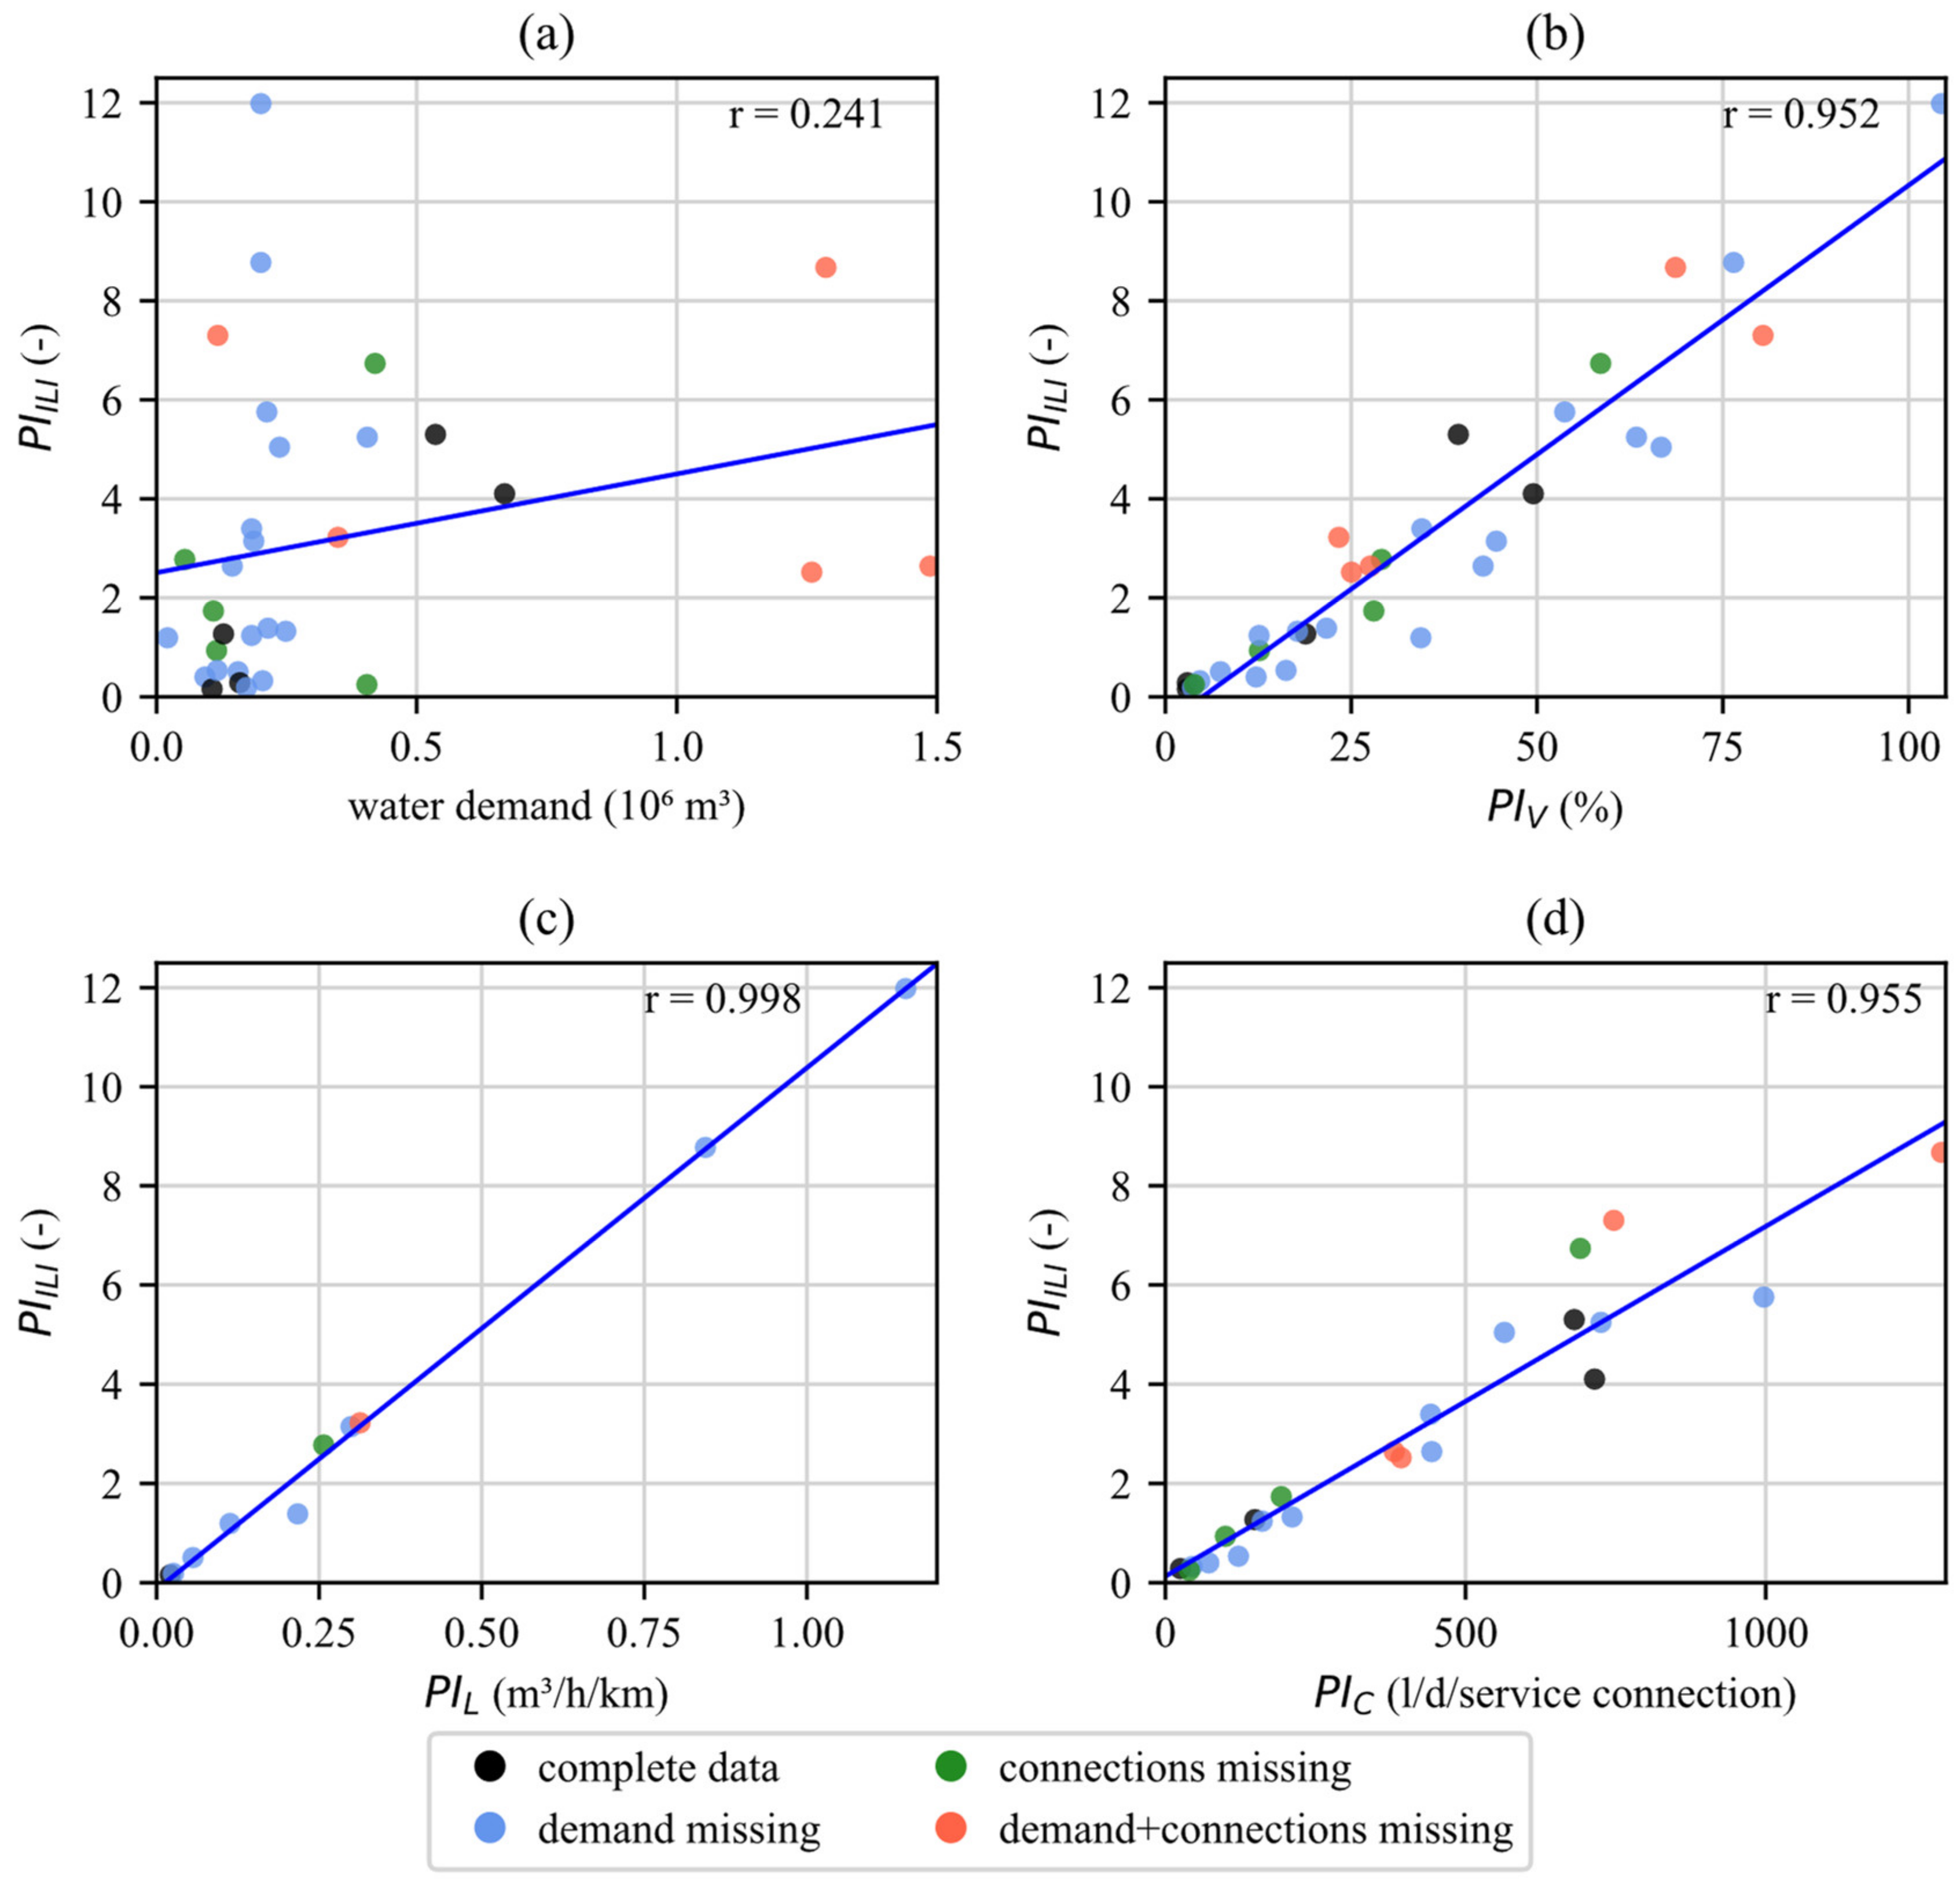
The infrastructure leakage index PIILI was applied to evaluate and compare the performance of the 40 WDNs. As shown in Figure 3a, the PIILI ranged from 0.15 to 12 for the investigated WDNs. In particular, smaller systems with low water demands had a wide variation of that PI. Consequently, there was no correlation between water demand (as an indicator for population size) and PIILI, which was indicated by a pearson correlation coefficient of 0.24. In total, 9 WDNs, having a water demand less than 0.4 million m3 (corresponding to 300–7000 inhabitants), had a value less than 1.0. These results are in accordance with the findings of a recent study, in which 24 of 54 investigated WDNs in Austria had a PIILI lower than 1.0 [31]. As described by the authors, there are two possible explanations for such low values. Basically, PIILI is calculated as a ratio between real losses and real losses reduced to technically unavoidable levels. First, continuous night flow measurements allow for a rapid identification of leakages in small WDNs, therefore, real losses can be decreased significantly. Secondly, design, installation, and maintenance efforts are high in Austria due to local standards and guidelines for reducing the reported number of failures and water losses. Consequently, the number of failures in Austria is lower than assumed in the calculation of technically unavoidable losses, supporting lower PIILI values. Another explanation is that water losses in small WDNs can be too low to measure. In this case, water losses are often underestimated, resulting in lower PIILI values.
Another disadvantage of PIILI is the large number of network parameters required for calculation. In this context, Figure 3b–d compare the simpler PIV (ranging from 3 to 104%), PIL (ranging from 0.02 to 1.15 m3/h/km), and PIC (ranging from 25 to 1290 L/day/service connection) with PIILI. Since water consumption instead of system input was used as a comparative value for calculation of these PIs, values above 100% are possible (occurring in one investigated WDN). In this case, (estimated) water losses were higher than water consumption of all consumers. As can be seen, the pearson correlation coefficient is for all configurations was very high (above 0.95), indicating that all simpler PIs are a good substitution for PIILI in smaller WDNs. However, only PIV has the advantage of a practical evaluation. The advantage of PIV is that it can be easily calculated, whereas PIL and PIC can be used only for parts of the WDNs due to limitations regarding service connections. We suggest using PIV for small WDNs (less than 10,000 inhabitants) and PIILI for medium networks (greater than 10,000 inhabitants) in Tyrol.
To test the robustness of the chosen approach (estimation of missing demand and number of service connections based on number of inhabitants, overnight stays, and number of buildings), Table 2 shows correlation coefficients between the investigated PIs with PIILI. for different missing data techniques (complete datasets, available datasets, or estimation of missing values). Although different missing data techniques were applied, the correlation coefficients did not change significantly, and, therefore, the obtained relations are robust in terms of data availability. Additionally, complete, and missing datasets are color-coded in Figure 3, Figure 4 and Figure 5. However, simplified missing data techniques (e.g., single imputation) imply that uncertainties of variables affect the results and robustness of the chosen approach. In contrast, more complex procedures, such as multiple imputation, include uncertainty analysis by generating multiple datasets with plausible values [39,40,41]. Moreover, uncertainty and sensitivity analyses can be carried out to investigate the influence of uncertain input parameters [42]. However, these tools are time-consuming, and are, therefore, in conflict with the requirements of PIs for small municipalities and local authorities, which have to deal with limited time and human resources for goal-oriented water loss management. In this context, the PIs and also the data collection should be as simple as possible for a practical application. Consequently, detailed and time-consuming uncertainty and robustness analyses are not the focus of this work. Therefore, the results are subject to statistical fluctuations, but, as can be seen from the figures, this simple approach can compensate very well for a lack of basic data.
3.2. Identification of Water Losses
Leakage detection campaigns were utilized in 9 WDNs to detect and localize network failures. The results were divided into different network elements, namely: main pipes, service connections, hydrants, and valves; these are summarized in Table 3. As can be seen, failures were the most frequent at service connections with an average value of 4.5 failures per WDN. One reason for this can be retrofitting of existing WDNs with house connections, whereby for this process the main network is usually subsequently bored. In total, an average of 1.8 L/s (or 6.5 m3/h) of drinking water is lost through faulty service connections. The second most common failure was found in hydrants, with an average of 1.9 hydrants per WDN showing a leakage. Interestingly, an average water loss of 0.2 L/s (or 0.7 m3/h) is the lowest for faulty hydrants compared that of to other network elements. In contrast, failures in the main pipes occur on average 1.6 times per WDN, causing drinking water losses of 1.2 L/s (or 4.3 m3/h). For the last investigated network element, the valves, a total of 0.6 faulty valves per network were detected, corresponding to an average additional water loss of 0.4 L/s (or 1.5 m3/h). For the total network, water losses were on average 3.8 L/s (or 13.7 m3/h), with a peak value of 13.0 L/s (or 46.8 m3/h).
3.3. Experiences Regarding Rehabilitation
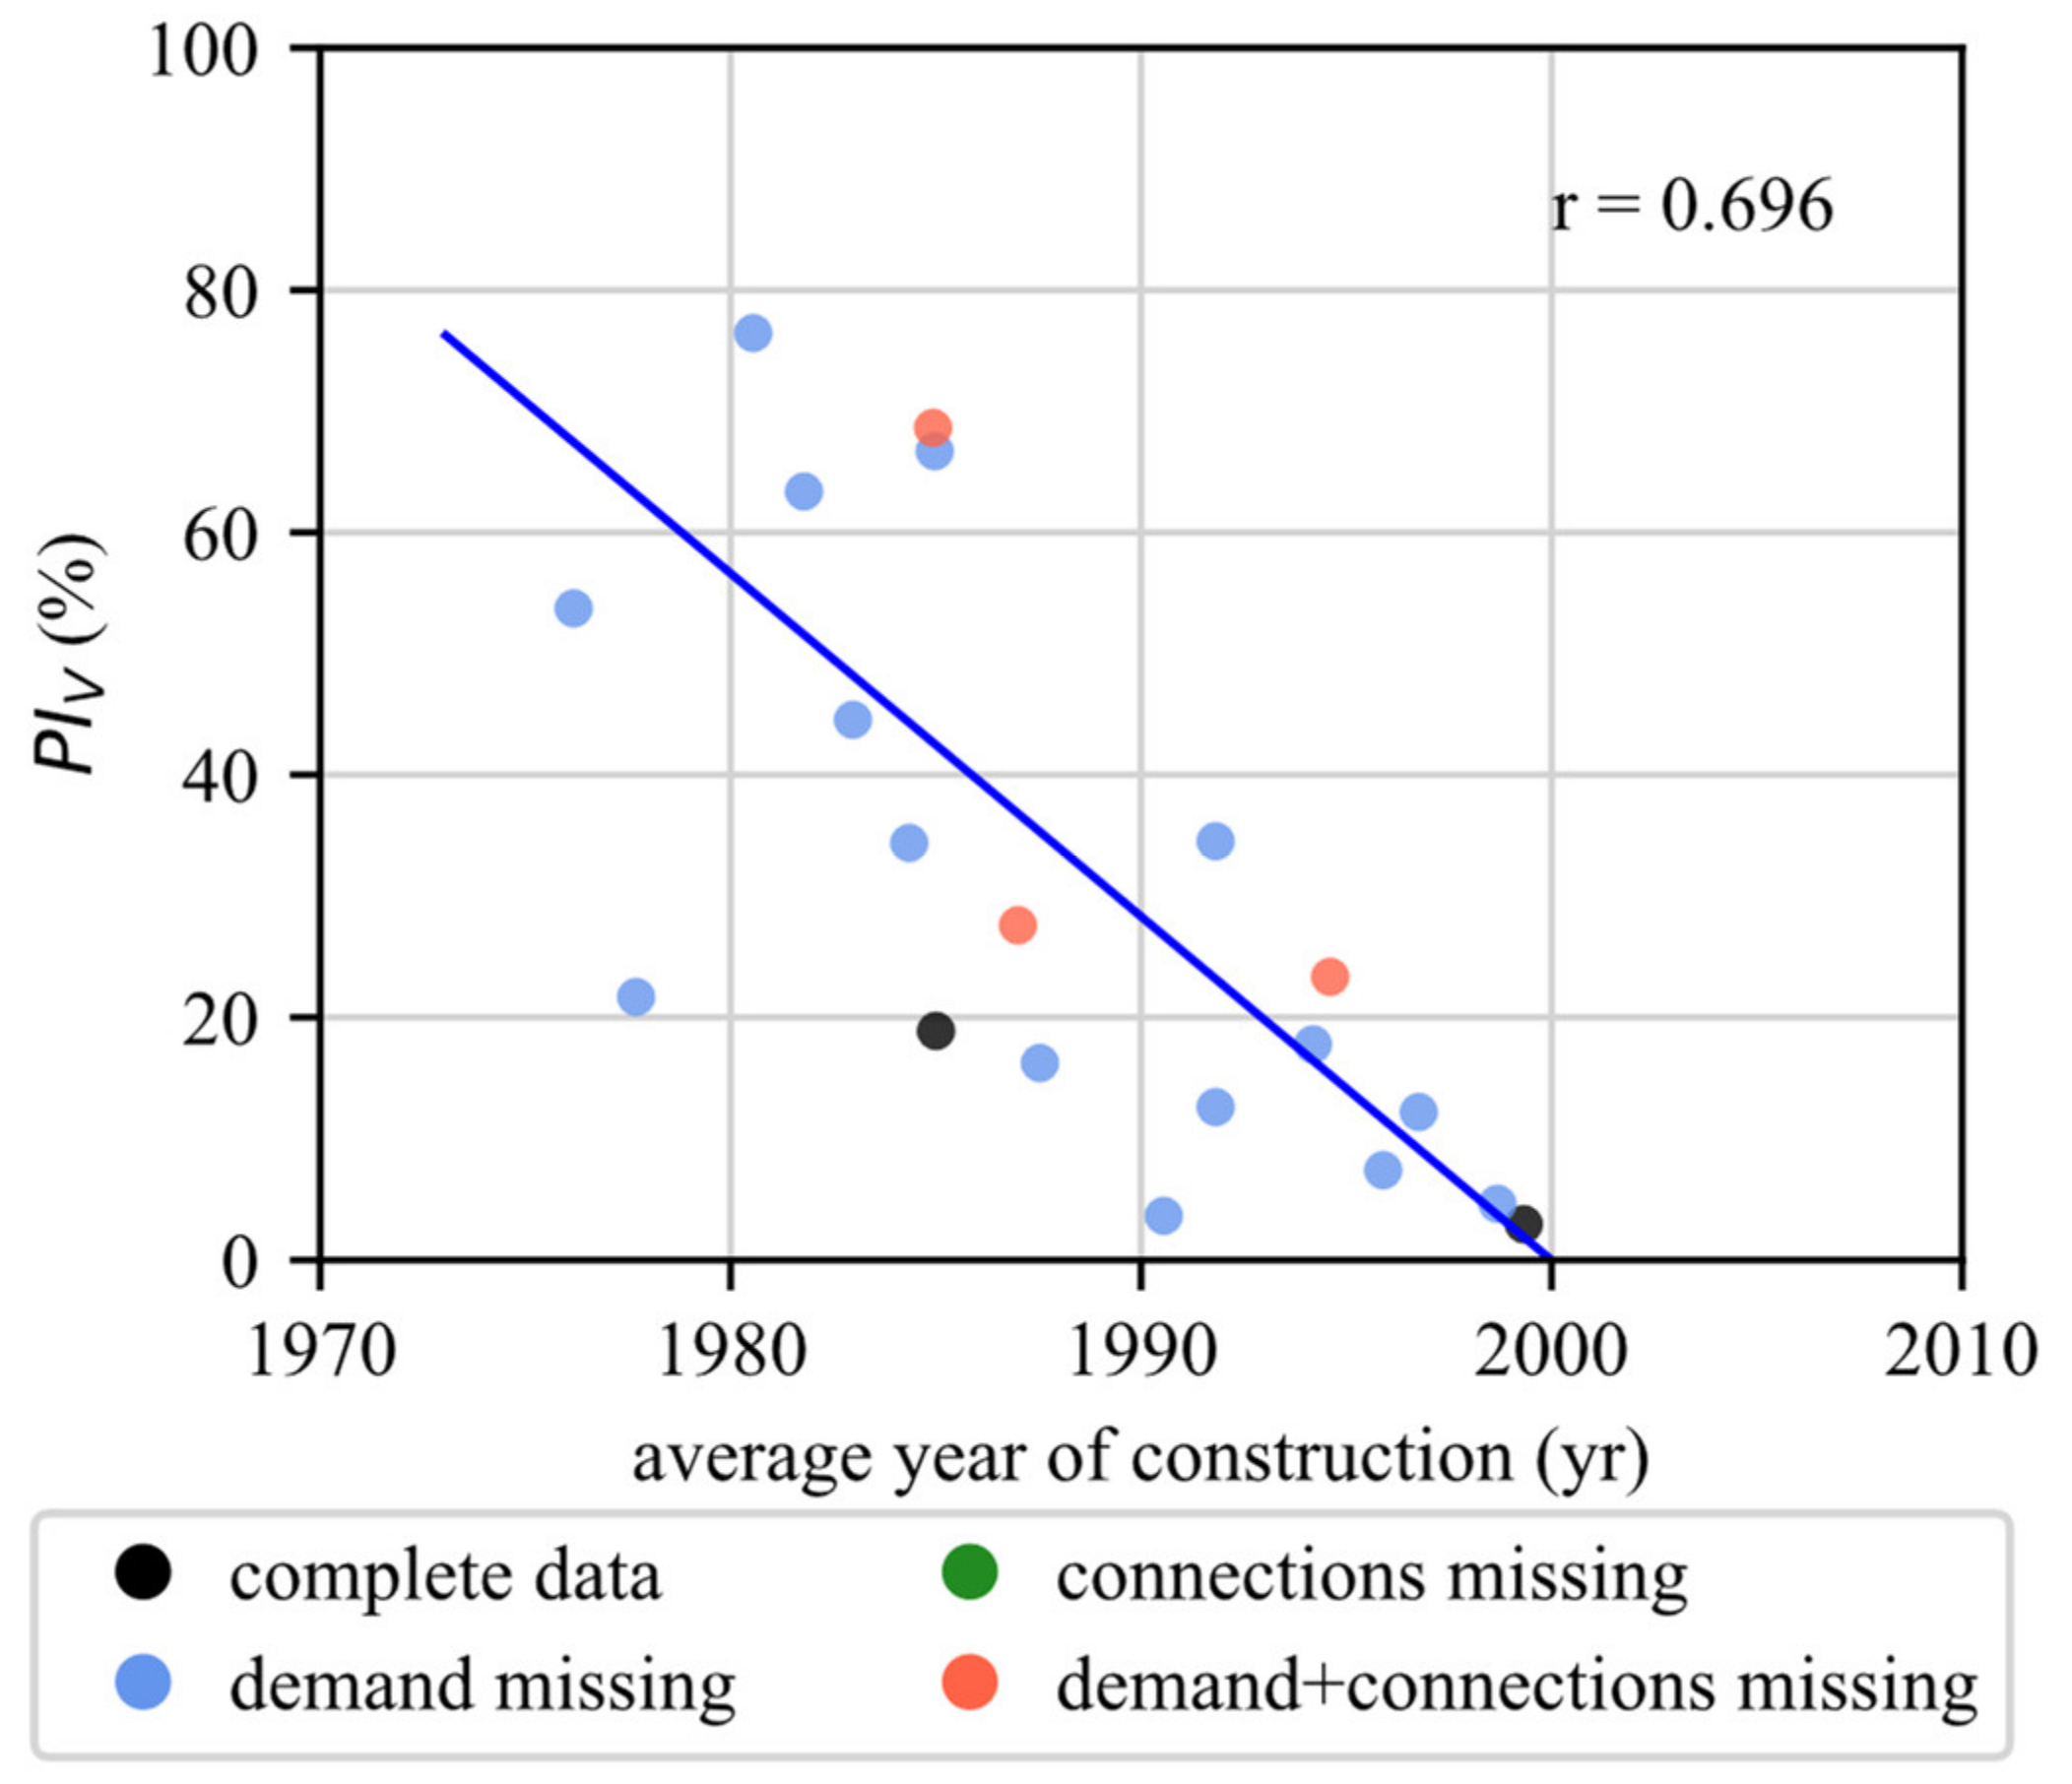
As shown before, the volume-related PIV represents a good substitution of the complex leakage infrastructure index PIILI for smaller WDNs and is therefore used to discuss experiences with rehabilitation measures in Tyrol. As expected, water losses show a clear correlation with average year of construction, as can be seen in Figure 4. The investigated WDNs were constructed on average between 1962 and 1999. With increasing age, water losses increase sharply, whereas on average younger WDNs show significantly lower water losses.
Further important findings are:
- Rehabilitation: Although one WDN was very old, it has the lowest PI (PIV is 7%). The initial WDN was constructed in the 1930s with first extensions and then renovations in the 1940s and 1950s, respectively. In the last few years, the network operators have put a lot of effort into renewing the system, reducing both average year of construction (now 1999) and water losses.
- Rehabilitation planning using survival curves: Only one of the investigated WDNs documented repair work due to bursts and leaks in a detailed way such that they could be used for estimating expected service life of pipes with the same construction year. Consequently, rehabilitation planning using survival curves does not provide statistically relevant information for network renewal as the data base is too small in small WDNs.
- On-line hydraulic monitoring: One WDN with less than 1000 connected inhabitants had water losses of 3% of the total water demand. To achieve such a low value, the network operator installed an online monitoring system several years ago. By continuously measuring the system inputs, irregularities and anomalies can be detected, and bursts and leaks can be repaired relatively quickly. In contrast, none of the investigated WDNs used pressure sensors for leakage detection as pressure fluctuation are low due to overdesigned pipes (e.g., regulations about fire flow and minimum pipe diameter) and low water extractions (e.g., distributed system with a low number of connected inhabitants).
- Leakage detection campaigns: Two larger WDNs had a PIV between 20 and 30%, corresponding to a PIILI between 2 and 3, although one of them had a very complex network structure with different pressure zones. To obtain these relatively low levels, leakage detection campaigns were carried out every year to detect failures in the WDNs. As reports from the network operators indicate, lower values of water losses were hard to achieve, but could be maintained through annual inspection. Additionally, repairing bursts and leakages, which are detected by applying leakage detection campaigns, can reduce water losses significantly. For example, a WDN with approximately 1500 inhabitants could reduce water losses from 45 to 7% within two months.
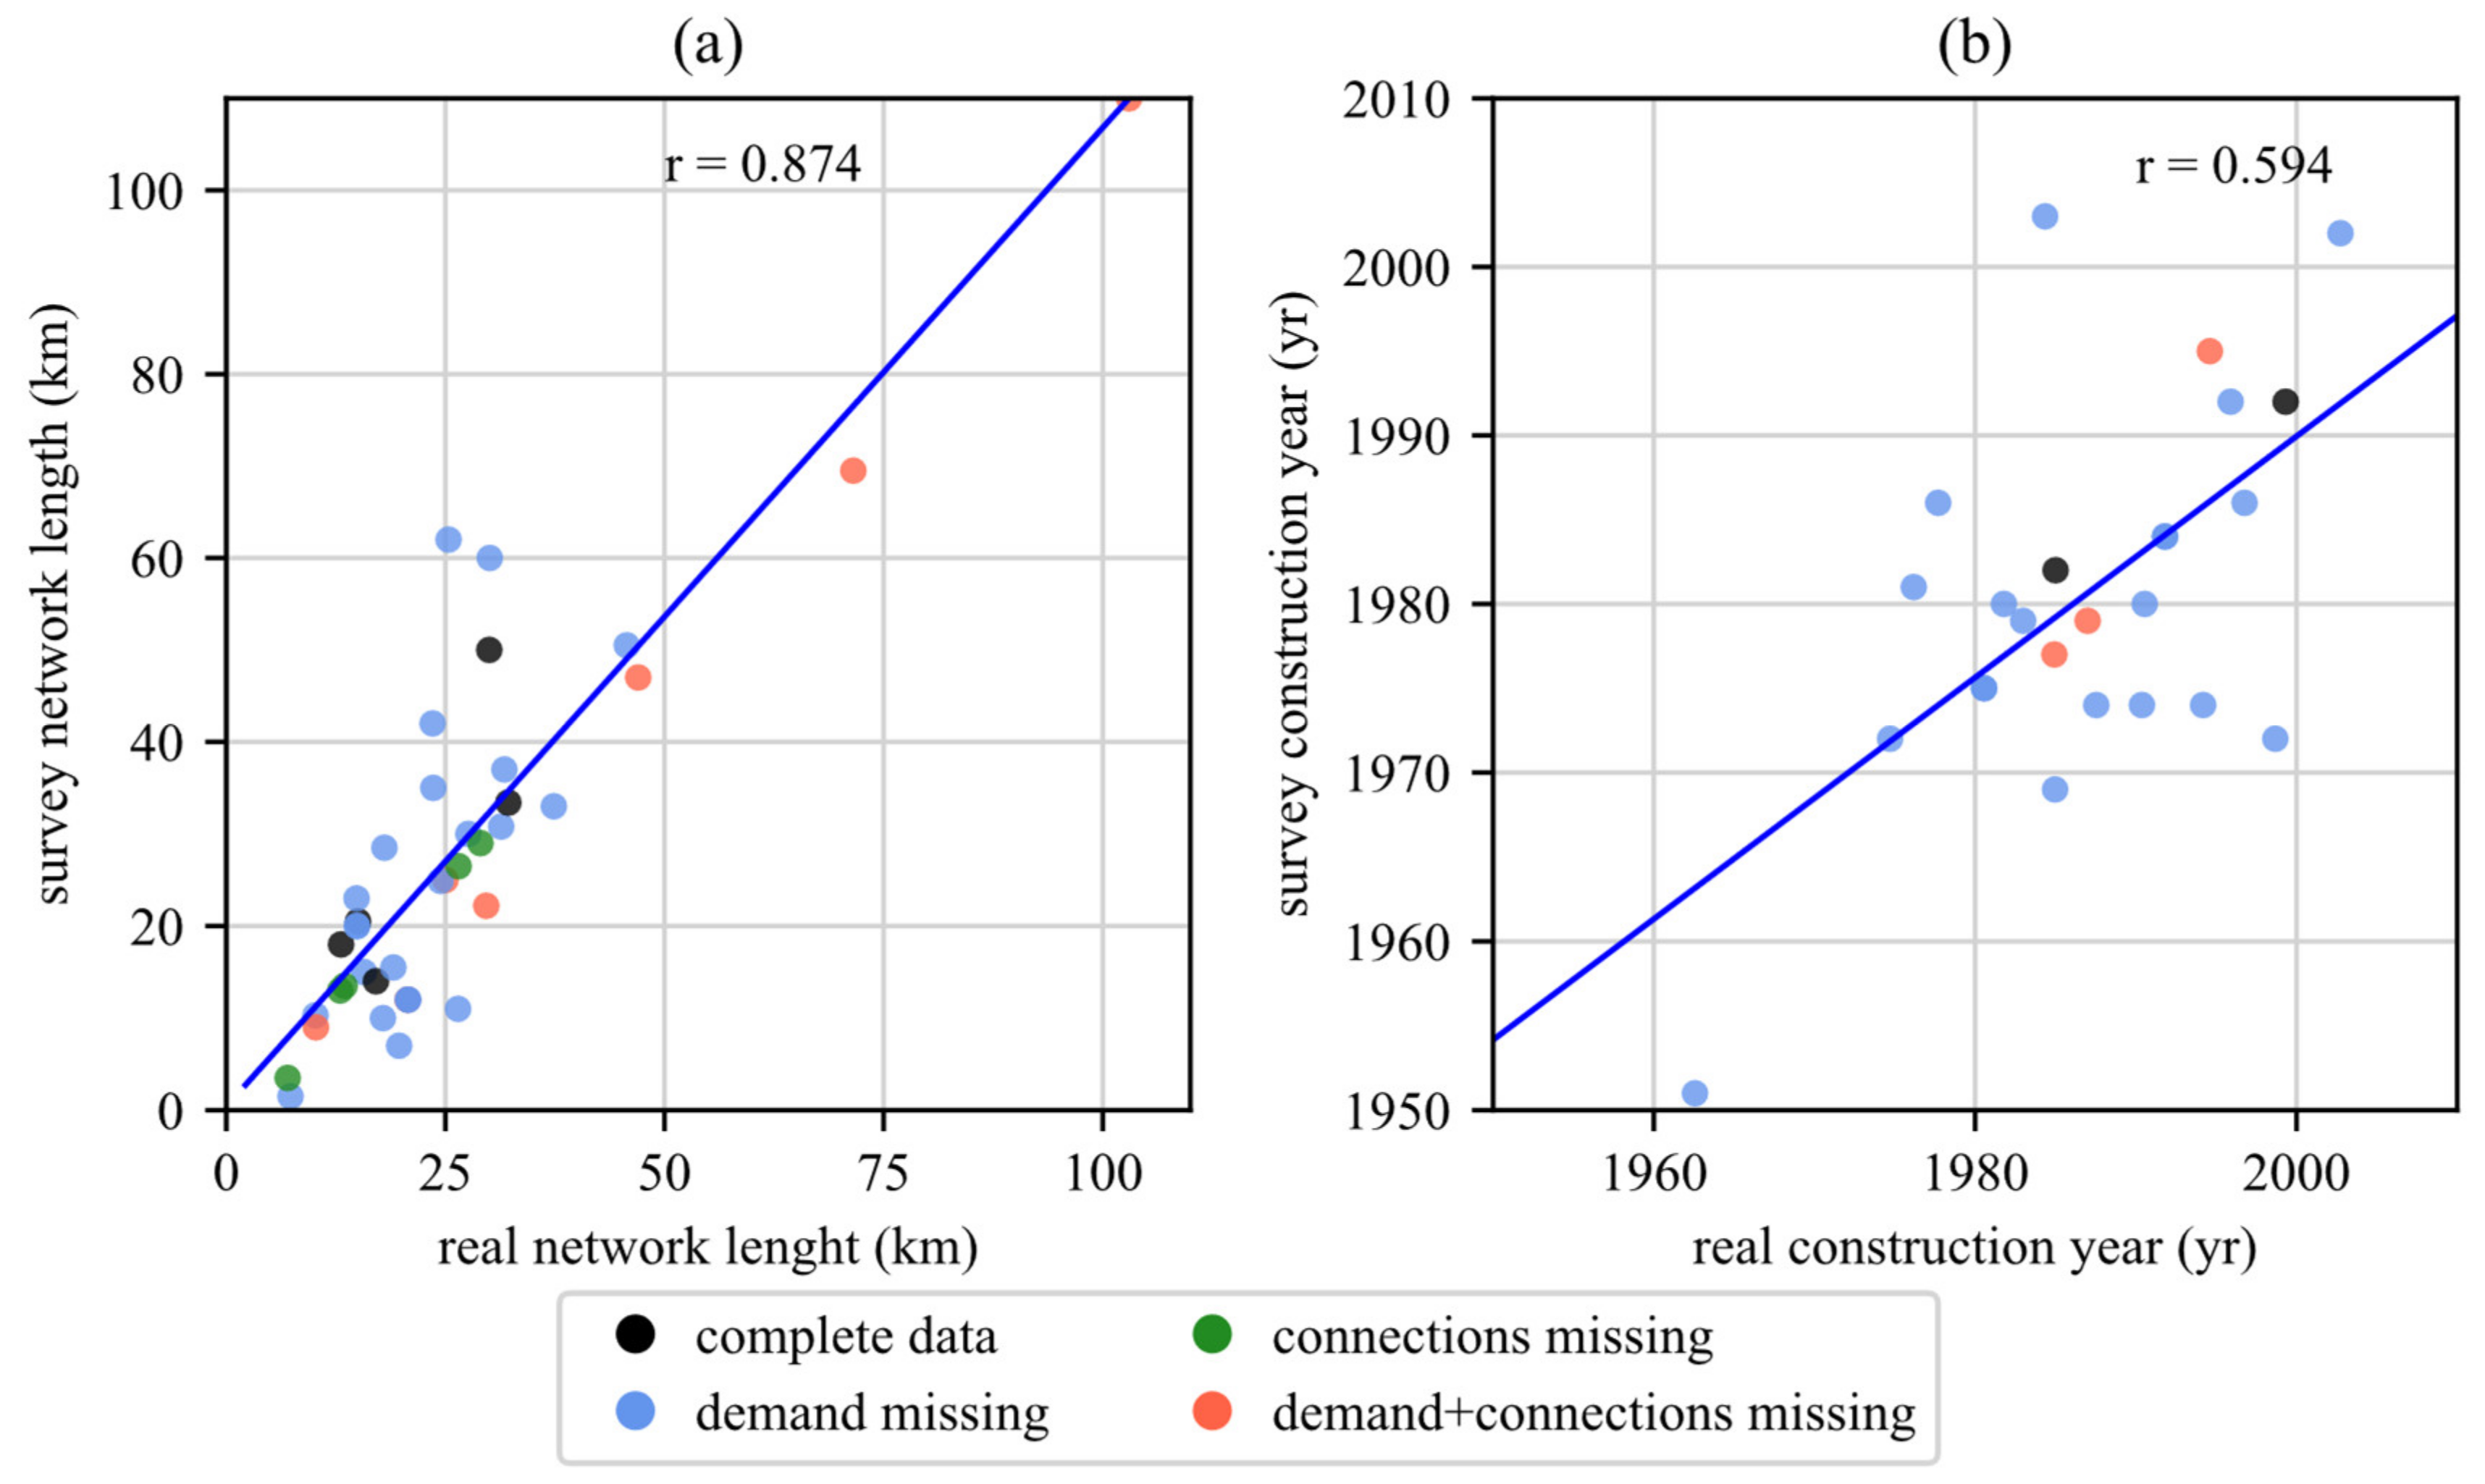
Figure 5a,b show the correlation of real network length and construction year from the pipe information system with results of the network survey in 2012. Interestingly, there is a difference between the level of knowledge of network operators and the actual WDN characteristics. For example, differences regarding network length were up to 36 km, whereas there was a considerable discrepancy in age of up to 18 years. As discussed above, average construction year can be related to amount of water losses, whereby older construction usually correlates with high water loss. Failure rates and associated leakages increase with pipe age [43] raising the amount of water loss. Consequently, values of PIs (e.g., PIILI, or PIV) also increase, showing a worsening of system performance. Therefore, the promotion of pipe information systems should be expanded further in future to obtain a conclusion on actual age and to implement appropriate measures.
3.4. Additional Problems Faced by Network Operators of Small Municipalities
Additionally, the network operators described the following problems in their reports, which they have to deal with during operation:
- Private swimming pools: One of the main stresses affecting small WDNs is the high increase of private swimming pools and the filling of them with drinking water in spring and refilling in summer, which increases required drinking water demand considerably. As mentioned above, online monitoring systems are used to monitor system performance, where an increase of system input can indicate leakages in the system. Therefore, it is difficult to distinguish pool fillings from real leakages, though the period for pool filling can be limited to warm weekends in spring and summer.
- Conflict between settlement expansion and source protection areas: In Tyrol, protection zones have been established for many drinking water sources, in which handling of harmful substances and constructions are restricted. Additionally, settlement area is increasing due to constant expansion. Consequently, an increased potential for conflict between protection of drinking water resources and urban use of the landscape has been identified, and this conflict will increase further in future.
- Limits of harmful substances: At this state of legislation, expansive countermeasures are needed to reduce harmful substances in drinking water. Currently, there is a discussion about decreasing the limits of harmful substances, mainly focusing on arsenic, antimony, and uranium. These substances can be of natural origin (e.g., granite and gneiss are sources of uranium and were common in the case study), but human influences, e.g., contaminated sites in the form of former landfills, can also be identified as possible causes. In this context, this ongoing process may help the water utilities.
4. Summary and Conclusions
In this work, experiences of water loss management in small water distribution networks (WDNs) located in the federal state of Tyrol (Austria) were presented. Tyrol has in total 279 municipalities with 757,850 inhabitants, and 150 municipalities have less than 1500 inhabitants. In this context, water loss management, with the key steps of water loss assessment, identification of the locations of water loss, and rehabilitation planning, is a major challenge for such small systems. In this regard, 40 WDNs with a supply area ranging from 0.36–120 km2 were investigated in detail, combined with a comprehensive discussion about Austrian standards and state funding regarding water loss management with a special focus on offerings and their practical applicability to small WDNs.
The results of water loss performance indicators (PI) (e.g., based on water loss volume, network characteristics (network length, number of service connection), or infrastructure leakage index) show a good correlation to each other. We therefore recommend the usage of water loss divided by water demand as a simple PI for small WDNs in Tyrol. The advantage is that this indicator is easier to determine than is the infrastructure leakage index recommended in the literature, but provides more or less the same evaluation criteria for local authorities. However, for larger systems (more than 10,000 inhabitants) the infrastructure leakage index should be additionally considered.
As the evaluation indicates, public funding helps to significantly reduce water losses in individual systems. Examples of state funding are leakage detection campaigns in combination with repair strategies or rehabilitation planning based on development of a pipe information systems. As the experiences demonstrate, these measurements should be established in future for larger WDNs in Tyrol. However, without appropriate state funding, these measurements to reduce water losses in WDNs would not have been such successful. In contrast, there is a lack of reliable data for rehabilitation planning for small WDNs. Additionally, small WDNs have neither enough qualified employees nor investment resources to carry out advanced water loss strategies. Therefore, we suggest an online flow metering system to monitor system inflows for small WDNs. Based on the measurement data, leakages and bursts can be detected and repaired swiftly.
The evaluations were carried out for a limited number of small WDNs in Austria. However, it is expected that results can generally be transferred to small WDNs in other countries in the case of similar initial conditions (large WDNs length compared to supplied inhabitants and low revenues). Additionally, upcoming digitization (e.g., digital water meters and daily water consumption data at household scale) and increasing citizen engagement (e.g., reporting of failures) can be used to develop and implement new operational approaches in urban water infrastructure. Consequently, water loss management can be improved too, and makes room for future research activities in the smart cities concept.
Author Contributions
Conceptualization, data curation and formal analyses, M.M.; writing—original draft preparation and visualization, M.O.; writing—review and editing, M.M. and R.S. All authors have read and agreed to the published version of the manuscript.
Funding
This publication was partly produced as part of the “Smart Water City” project. This project is funded by the Austrian Climate and Energy Fund and is part of the program “Smart Cities Demo - Living Urban Innovation 2018” (project 872123).
Conflicts of Interest
The authors declare no conflict of interest. The funders had no role in the design of the study; in the collection, analyses, or interpretation of data; in the writing of the manuscript, or in the decision to publish the results.
References
- Lambert, A.; Hirner, W. Losses from Water Supply Systems: Standard terminology and recommended performance measures. In Blue Pages; International Water Association: London, UK, 2000; Volume 10, pp. 320–338. [Google Scholar]
- Al-Washali, T.; Sharma, S.; Kennedy, M. Methods of assessment of water losses in water supply systems: A review. Water Resour. Manag. 2016, 30, 4985–5001. [Google Scholar] [CrossRef]
- Kingdom, B.; Liemberger, R.; Marin, P. The Challenge of Reducing Nonrevenue (NRW) Water in Developing Countries. How the Private Sector Can Help: A Look at Performance-Based Service Contracting; Technical Report 8; Water Supply and Sanitation Sector Board Discussion Paper Series; The World Bank: Washington, DC, USA, 2006. [Google Scholar]
- EurEau. Europe’s Water in Figures—An Overview of the European Drinking Water and Waste Water Sectors. Available online: http://www.eureau.org/resources/publications/1460-eureau-data-report-2017-1/file (accessed on 3 August 2020).
- Mutikanga, H.; Sharma, S.; Vairavamoorthy, K.; Cabrera, E. Using performance indicators as a water loss management tool in developing countries. J. Water Supply Res. Technol.-Aqua 2010, 59, 471–481. [Google Scholar] [CrossRef]
- EPA. Water Audits and Water Loss Control for Public Water Systems. Available online: https://www.epa.gov/sites/production/files/2015-04/documents/epa816f13002.pdf (accessed on 3 August 2020).
- Colombo, A.F.; Karney, B.W. Energy and costs of leaky pipes: Toward comprehensive picture. J. Water Resour. Plan. Manag. 2002, 128, 441–450. [Google Scholar] [CrossRef] [Green Version]
- Loureiro, D.; Alegre, H.; Silva, M.S.; Ribeiro, R.; Mamade, A.; Poças, A. Implementing tactical plans to improve water-energy loss management. Water Supply 2017, 17, 381–388. [Google Scholar] [CrossRef]
- Zyoud, S.H.; Kaufmann, L.G.; Shaheen, H.; Samhan, S.; Fuchs-Hanusch, D. A framework for water loss management in developing countries under fuzzy environment: Integration of Fuzzy AHP with Fuzzy TOPSIS. Expert Syst. Appl. 2016, 61, 86–105. [Google Scholar] [CrossRef]
- Laureti, T.; Benedetti, I.; Branca, G. Water use efficiency and public goods conservation: A spatial stochastic frontier model applied to irrigation in Southern Italy. Socio-Econ. Plan. Sci. 2020. [Google Scholar] [CrossRef]
- Benedetti, I.; Branca, G.; Zucaro, R. Evaluating input use efficiency in agriculture through a stochastic frontier production: An application on a case study in Apulia (Italy). J. Clean. Prod. 2019, 236. [Google Scholar] [CrossRef]
- Agovino, M.; Cerciello, M.; Gatto, A. Policy efficiency in the field of food sustainability. The adjusted food agriculture and nutrition index. J. Environ. Manag. 2018, 218, 220–233. [Google Scholar] [CrossRef]
- Liemberger, R.; Wyatt, A. Quantifying the global non-revenue water problem. Water Supply 2019, 19, 831–837. [Google Scholar] [CrossRef]
- Lambert, A.O.; Brown, T.G.; Takizawa, M.; Weimer, D. A review of performance indicators for real losses from water supply systems. J. Water Supply Res. Technol.-Aqua 1999, 48, 227–237. [Google Scholar] [CrossRef]
- Mutikanga, H.E.; Sharma, S.K.; Vairavamoorthy, K. Methods and tools for managing losses in water distribution systems. J. Water Resour. Plan. Manag. 2013, 139, 166–174. [Google Scholar] [CrossRef]
- Sanz, G.; Pérez, P.; Kapelan, Z.; Savic, D. Leak detection and localization through demand components calibration. J. Water Resour. Plan. Manag. 2016, 142, 04015057. [Google Scholar] [CrossRef] [Green Version]
- Sophocleous, S.; Savić, D.; Kapelan, Z. Leak localization in a real water distribution network based on search-space reduction. J. Water Resour. Plan. Manag. 2019, 145, 04019024. [Google Scholar] [CrossRef]
- Steffelbauer, D.B.; Fuchs-Hanusch, D. Efficient sensor placement for leak localization considering uncertainties. Water Resour. Manag. 2016, 30, 5517–5533. [Google Scholar] [CrossRef] [Green Version]
- Sun, C.; Parellada, B.; Puig, V.; Cembrano, G. Leak localization in water distribution networks using pressure and data-driven classifier approach. Water 2019, 12, 54. [Google Scholar] [CrossRef] [Green Version]
- Wu, Y.; Liu, S. A review of data-driven approaches for burst detection in water distribution systems. Urban Water J. 2017, 14, 972–983. [Google Scholar] [CrossRef]
- Wu, Y.; Liu, S.; Wu, X.; Liu, Y.; Guan, Y. Burst detection in district metering areas using a data driven clustering algorithm. Water Res. 2016, 100, 28–37. [Google Scholar] [CrossRef]
- Zaman, D.; Tiwari, M.; Gupta, A.; Sen, D. A review of leakage detection strategies for pressurised pipeline in steady-state. Eng. Fail. Anal. 2019, 109, 104264. [Google Scholar] [CrossRef]
- Puust, R.; Kapelan, Z.; Savic, D.A.; Koppel, T. A review of methods for leakage management in pipe networks. Urban Water J. 2010, 7, 25–45. [Google Scholar] [CrossRef]
- Salehi, S.; Jalili Ghazizadeh, M.; Tabesh, M. A comprehensive criteria-based multi-attribute decision-making model for rehabilitation of water distribution systems. Struct. Infrastruct. Eng. 2017, 14, 743–765. [Google Scholar] [CrossRef]
- Tscheikner-Gratl, F.; Egger, P.; Rauch, W.; Kleidorfer, M. Comparison of multi-criteria decision support methods for integrated rehabilitation prioritization. Water 2017, 9, 68. [Google Scholar] [CrossRef] [Green Version]
- Lambert, A.; Charalambous, B.; Fantozzi, M.; Kovac, J.; Rizzo, A.; St John, S.G. 14 years’ experience of using IWA best practice water balance and water loss performance indicators in Europe. In Proceedings of the Specialized Conference: Water Loss 2014, Vienna, Austria, 30 March–2 April 2014. [Google Scholar]
- Alegre, H.; Baptista, J.F.; Cabrera, E.; Cubillo, F.; Duarte, P.; Hirner, W.; Merkel, W.; Parena, R. Performance indicators for water supply services. In IWA Manual of Best Practice, 2nd ed.; International Water Association: London, UK, 2006. [Google Scholar]
- Möderl, M.; Sitzenfrei, R. Water loss management in very small municipalities—Bridging the gap from research to practice. Proceedings of World Environmental and Water Resources Congress, Pittsburgh, PA, USA, 19–23 May 2019; pp. 455–462. [Google Scholar] [CrossRef]
- Oviedo-Ocaña, E.R.; Dominguez, I.C.; Celis, J.; Blanco, L.C.; Cotes, I.; Ward, S.; Kapelan, Z. Water-loss management under data scarcity: Case study in a small municipality in a developing country. J. Water Resour. Plan. Manag. 2020, 146, 05020001. [Google Scholar] [CrossRef] [Green Version]
- Gangl, G.; Kölbl, J. Anwendbarkeit des infrastructure leakage index--ILI fur kleinere versorger und messzonen (DMAs). Das Gas-Und Wasserfach. Wasser Abwasser 2015, 150, 273. [Google Scholar]
- Lambert, A.; Kölbl, J.; Fuchs-Hanusch, D. Interpreting ILIs in small systems. In Proceedings of the IWA Water Ideas 2014: Intelligent Distribution for Efficient and Affordable Supplies, Bologna, Italy, 22–24 October 2014. [Google Scholar]
- BGBl. Nr 215/1959. Wasserrechtsgesetz—WRG. Water Law—WRG. Only available in German. Available online: https://www.ris.bka.gv.at/GeltendeFassung.wxe?Abfrage=Bundesnormen&Gesetzesnummer=10010290 (accessed on 26 August 2020).
- Amt der Tiroler Landesregierung. Trinkwasser und Abwasser in Tirol. Drinking Water and Wastewater in Tyrol. Only available in German. Available online: https://www.tirol.gv.at/fileadmin/themen/umwelt/wasser/wasserinfo/downloads/Wasserwirtschaft_20150203.pdf (accessed on 10 August 2020).
- Peel, M.C.; Finlayson, B.L.; McMahon, T.A. Updated world map of the Köppen-Geiger climate classification. Hydrol. Earth Syst. Sci. 2007, 11, 1633–1644. [Google Scholar] [CrossRef] [Green Version]
- Neunteufel, R.; Richard, L.; Perfler, R. Water demand: The Austrian end-use study and conclusions for the future. Water Sci. Technol. 2014, 14, 205–211. [Google Scholar] [CrossRef]
- Bundeskanzleramt Österreich. Österreichisches Programm zum Schutz kritischer Infrastrukturen (APCIP). Available online: https://www.bundeskanzleramt.gv.at/themen/sicherheitspolitik/schutz-kritischer-infrastrukturen.html (accessed on 13 October 2020).
- Eekhout, I.; de Boer, R.M.; Twisk, J.W.; de Vet, H.C.; Heymans, M.W. Missing data: A systematic review of how they are reported and handled. Epidemiology 2012, 23, 729–732. [Google Scholar] [CrossRef]
- Graham, J.; Cumsille, P.E.; Shevock, A.E. Methods for handling missing data. Handb. Psychol. Second Ed. 2012, 2. [Google Scholar] [CrossRef]
- Aleryani, A.; Wang, W.; De La Iglesia, B. Dealing with missing data and uncertainty in the context of data mining. In Proceedings of the Hybrid Artificial Intelligent Systems, Cham, Oviedo, Spain, 20–22 October 2018; pp. 289–301. [Google Scholar]
- Papageorgiou, G.; Grant, S.W.; Takkenberg, J.J.M.; Mokhles, M.M. Statistical primer: How to deal with missing data in scientific research? † Interact. Cardiovasc. Thorac. Surg. 2018, 27, 153–158. [Google Scholar] [CrossRef] [Green Version]
- Dong, Y.; Peng, C.-Y.J. Principled missing data methods for researchers. SpringerPlus 2013, 2, 222. [Google Scholar] [CrossRef] [Green Version]
- Saisana, M.; Saltelli, A.; Tarantola, S. Uncertainty and sensitivity analysis techniques as tools for the quality assessment of composite indicators. J. R. Statist. Soc. A 2005, 168, 307–323. [Google Scholar] [CrossRef]
- Barton, N.A.; Farewell, T.S.; Hallett, S.H.; Acland, T.F. Improving pipe failure predictions: Factors affecting pipe failure in drinking water networks. Water Res. 2019, 164, 114926. [Google Scholar] [CrossRef]
Figure 1.
Correlation between total network length and connected inhabitants for the investigated WDNs.
Figure 1.
Correlation between total network length and connected inhabitants for the investigated WDNs.

Figure 2.
Correlation between (a) calculated water demand based on water assumptions per inhabitant and overnight stays and measured water demand as a total inflow reduced by estimated water losses and (b) number of service connections and number of buildings.
Figure 2.
Correlation between (a) calculated water demand based on water assumptions per inhabitant and overnight stays and measured water demand as a total inflow reduced by estimated water losses and (b) number of service connections and number of buildings.

Figure 3.
Correlation of infrastructure leakage index (PIILI) with (a) total annual water demand, (b) volume related PI (PIV), (c) PIL, and (d) PIC.
Figure 3.
Correlation of infrastructure leakage index (PIILI) with (a) total annual water demand, (b) volume related PI (PIV), (c) PIL, and (d) PIC.

Figure 4.
Correlation of volume related PI (PIV) with average year of construction.

Figure 5.
Correlation of (a) real network length from the pipe information system and estimated network length form the survey and (b) real construction year from the pipe information system and estimated construction year from the survey.
Figure 5.
Correlation of (a) real network length from the pipe information system and estimated network length form the survey and (b) real construction year from the pipe information system and estimated construction year from the survey.


Table 1.
Primary characteristics of the 40 investigated water distribution networks (WDNs).
| Property | Minimum | Average | Maximum |
|---|---|---|---|
| Connected inhabitants (-) | 224 | 2951 | 15,747 |
| Total network length (km) | 7.0 | 25.6 | 103.0 |
| Number of connections (-) | 40.0 | 642.0 | 2945.0 |
| Average connection length (m) | 7.8 | 16.8 | 29.0 |
| Network pressure (m) | 50.0 | 79.2 | 110.0 |
| Year of construction | 1962 | 1987 | 2002 |
Table 2.
Correlations between different PIs with PIILI.
| PIV | PIL | PIC | |
|---|---|---|---|
| Complete dataset | 0.931 | - 1 | 0.969 |
| Available datasets (connections missing) | 0.952 | 1.000 2 | 0.952 |
| Available datasets (demand missing) | 0.954 | 0.998 | 0.965 |
| Estimation missing data (used approach) | 0.952 | 0.998 | 0.955 |
1 only one value; 2 two values.
Table 3.
Results of the leakage detection campaigns.
| Property | Network Elements | Minimum | Average | Maximum |
|---|---|---|---|---|
| Failures (-) | Main pipes | 0.0 | 1.6 | 4.0 |
| Service connections | 0.0 | 4.5 | 14.0 | |
| Hydrants | 0.0 | 1.9 | 5.0 | |
| Valves | 0.0 | 0.6 | 2.0 | |
| Water losses (l/s) | Main pipes | 0.0 | 1.2 | 4.2 |
| Service connections | 0.0 | 1.8 | 6.1 | |
| Hydrants | 0.0 | 0.2 | 0.8 | |
| Valves | 0.0 | 0.4 | 1.7 | |
| Total network | 0.0 | 3.8 | 13.0 |
Publisher’s Note: MDPI stays neutral with regard to jurisdictional claims in published maps and institutional affiliations. |
© 2020 by the authors. Licensee MDPI, Basel, Switzerland. This article is an open access article distributed under the terms and conditions of the Creative Commons Attribution (CC BY) license (http://creativecommons.org/licenses/by/4.0/).
Share and Cite
MDPI and ACS Style
Oberascher, M.; Möderl, M.; Sitzenfrei, R. Water Loss Management in Small Municipalities: The Situation in Tyrol. Water 2020, 12, 3446. https://doi.org/10.3390/w12123446
AMA Style
Oberascher M, Möderl M, Sitzenfrei R. Water Loss Management in Small Municipalities: The Situation in Tyrol. Water. 2020; 12(12):3446. https://doi.org/10.3390/w12123446
Chicago/Turabian StyleOberascher, Martin, Michael Möderl, and Robert Sitzenfrei. 2020. "Water Loss Management in Small Municipalities: The Situation in Tyrol" Water 12, no. 12: 3446. https://doi.org/10.3390/w12123446
Note that from the first issue of 2016, this journal uses article numbers instead of page numbers. See further details here.