Identification of Seasonal Sub-Regions of the Drought in the North China Plain
by
 ,
,
Yanqiang Cui
1 ,
,
Bo Zhang
1,*, 
Hao Huang
1,
Xiaodan Wang
1,
Jianjun Zeng
2,
Wenhui Jiao
1 and
Rongpeng Yao
1 1
College of Geography and Environmental Science, Northwest Normal University, Lanzhou 730070, China
2
College of Geography and Environmental Engineering, Lanzhou City University, Lanzhou 730070, China
*
Author to whom correspondence should be addressed.
Water 2020, 12(12), 3447; https://doi.org/10.3390/w12123447
Submission received: 26 October 2020
/
Revised: 28 November 2020
/
Accepted: 4 December 2020
/
Published: 8 December 2020
(This article belongs to the Special Issue Management of Hydro-Meteorological Hazards)
Abstract
:Regional climate variability assessment is of great significance in decision-making such as agriculture and water resources system management. The identification of sub-regions with similar drought variability can provide a basis for agricultural disaster reduction planning and water resource distribution. In this research, a modified daily Standardized Precipitation Evapotranspiration Index (SPEI) was used to monitor the spatial and temporal variation characteristics of agricultural drought in the North China Plain from 1960 to 2017, which was studied by using the rotated empirical orthogonal functions (REOF). Through the seasonal REOF process, 7–9 seasonal drought sub-regions are confirmed by applying time series and the correlation relationship of SPEI original data. The strong correlation of these sub-regions indicates that the climate and weather conditions causing the drought are consistent and the drought conditions are independent for the regions that show no correlation. In general, the results of the seasonal trend analysis show that there has been no significant trend value in most areas since 1960. However, it is worth noting that some regions have the positive and negative temporal trends in different seasons. These results illustrate the importance of seasonal analysis, particularly for agro-ecosystems that depend on timely rainfall during different growing seasons. If this trend continues, seasonal drought will become more complex, then a more elaborate water management strategy will be needed to reduce its impact.
1. Introduction
Drought is a recurring extreme climate event with a character of multiscale [1,2], which can cause the water shortage and threaten the food security [3,4]. Influenced by the global warming, it is getting much more frequent and serious [5,6,7]. Spatial and temporal variability of the regional drought is also a complicated and multi-scale issue. Assessment to regional climate variability plays quite an important significance in the management of water source and agricultural system [8,9,10,11].
As an important agricultural ecosystem, North China Plain is sensitive to the change of humidity and temperature [12]. Planting of wheat and corn in North China Plain account for 45% and 33% of the gross planting area of China respectively [13]. Currently, it is still a densely-populated area with a great pressure on the land use. Drought in this area has limited the regional economic development and may cause influence on the sustainable development of local agriculture and improvement of people’s living standards [14]. The past record shows that North China Plain has experienced variable droughts. During the 1980s, the drought happened in summer (June to August) and fall (September to November), then in the following decade it usually happened in fall and winter (December January and February), and in the recent ten years, it usually happened in winter and spring (March to May) [5,15]. Temperature rise is expected to increase the potential evapotranspiration and drought will get worse [16]. Ma (2007) and Shi et al. (2008) analyzed the annual and inter-decadal variation of the precipitation in North China Plain, by which they found that there has been a trend of reduction in recent several decades [16,17]. Due to the large demand of water resource and uneven distribution of surface water, groundwater is seriously over-pumped and therefore the effects of drought are also uncertain [18,19,20].
Presently, many drought indices have been applied to the study of drought in the North China Plain [21,22,23]. Research that has been done on this area mainly concentrated on the relationship between drought features and its environmental factors such as soil moisture content, crop water stress, and ENSO [24,25,26,27]. These studies suggest that there exist regional variations of drought. The North China Plain, a large area spanning several precipitation and temperature belts, cannot be evaluated by only a single metric for a unique sub-region that may exist. Day, month and year disturbances in weather and climate in the agricultural region have significant effects on local and regional scales. Analysis on drought of seasonal scale and seasonal EOF also show differences in the spatial patterns of sub-regions [15], providing insight into the different processes of seasonal drought variability that dominates the North China Plain. Drought in different seasons has different effects on crops. In order to identify drought risks and take effective defensive measures, the spatial and temporal patterns of drought changes in the North China Plain should be comprehensively analyzed.
The development of spatio-temporal structure separation technology for climatic variable field provides great support for analyzing the spatio-temporal structure in the history of regional drought variations. Empirical Orthogonal Function (EOF) analysis was firstly used in atmospheric science by Lorenz (1956) and has been widely used to analyze spatial and temporal variability of geophysical information [28,29]. EOF process constructs orthogonal linear combination to explain the maximum variance in space and time. Through the various rotations of these linear combinations, geographic regions with similar variability can be identified. In China, Cai et al. [30] studied the spatial pattern and temporal variability of drought in the Beijing-Tianjin-Hebei region by using the EOF method. In North America, Zachary et al. [31] identified the drought-monitoring seasonal hydro-climatic division of the Central Great Plains of the United States through the rotated empirical orthogonal function (REOF) method. Drought EOFs studies have also been carried out in Romania [32], Portugal [33] and other regions of Europe. In these studies, EOF analysis is mainly used to assess the applicability between drought indices and to identify spatial patterns and temporal variability of droughts. These studies are quite beneficial for us to know clearly about the spatial and temporal variability of drought characteristics. Identifying areas with similar drought variability is important for drought monitoring and disaster prevention.
Standardized Precipitation Evapotranspiration Index (SPEI) is one of the drought indexes widely used in recent years. Vicente-Serrano’s program is able to monitor drought processes on a time scale of one month or more [34]. Since continuous heavy rainfall over several days may mask previous precipitation deficiencies, this may limit the ability of the monthly drought index to capture more details of the drought. Therefore, the temporal resolution of drought monitoring needs to be refined. Although the choice of a basic unit of time for drought monitoring has been debated, some scholars have tried to develop daily SPEI for drought research [35,36,37]. Ma et al. [38] discussed the effect of different conditional probability distributions on SPEI calculations for daily time steps. In this calculation procedure, unbiased estimate was instead the plotting position in the probability-weighted moment parameter [38].
In this study, the improved daily SPEI calculation method [38] is used to evaluate the seasonal variability of drought characteristics in the North China Plain, and REOF is used to identify the sub-regions with seasonal variation of drought characteristics, so as to study the seasonal spatial and temporal variation structure. The important variable sub-regions from the spatial correlation of drought on a seasonal scale were identified and changes of this variability were analyzed over time. Trends in drought characteristics are identified by the modified Mann–Kendall test [39]. This study is expected to provide reasonable decision-making basis for drought risk management and spatial and temporal allocation of water resources.
2. Materials and Methods
2.1. Study Area and Data Source
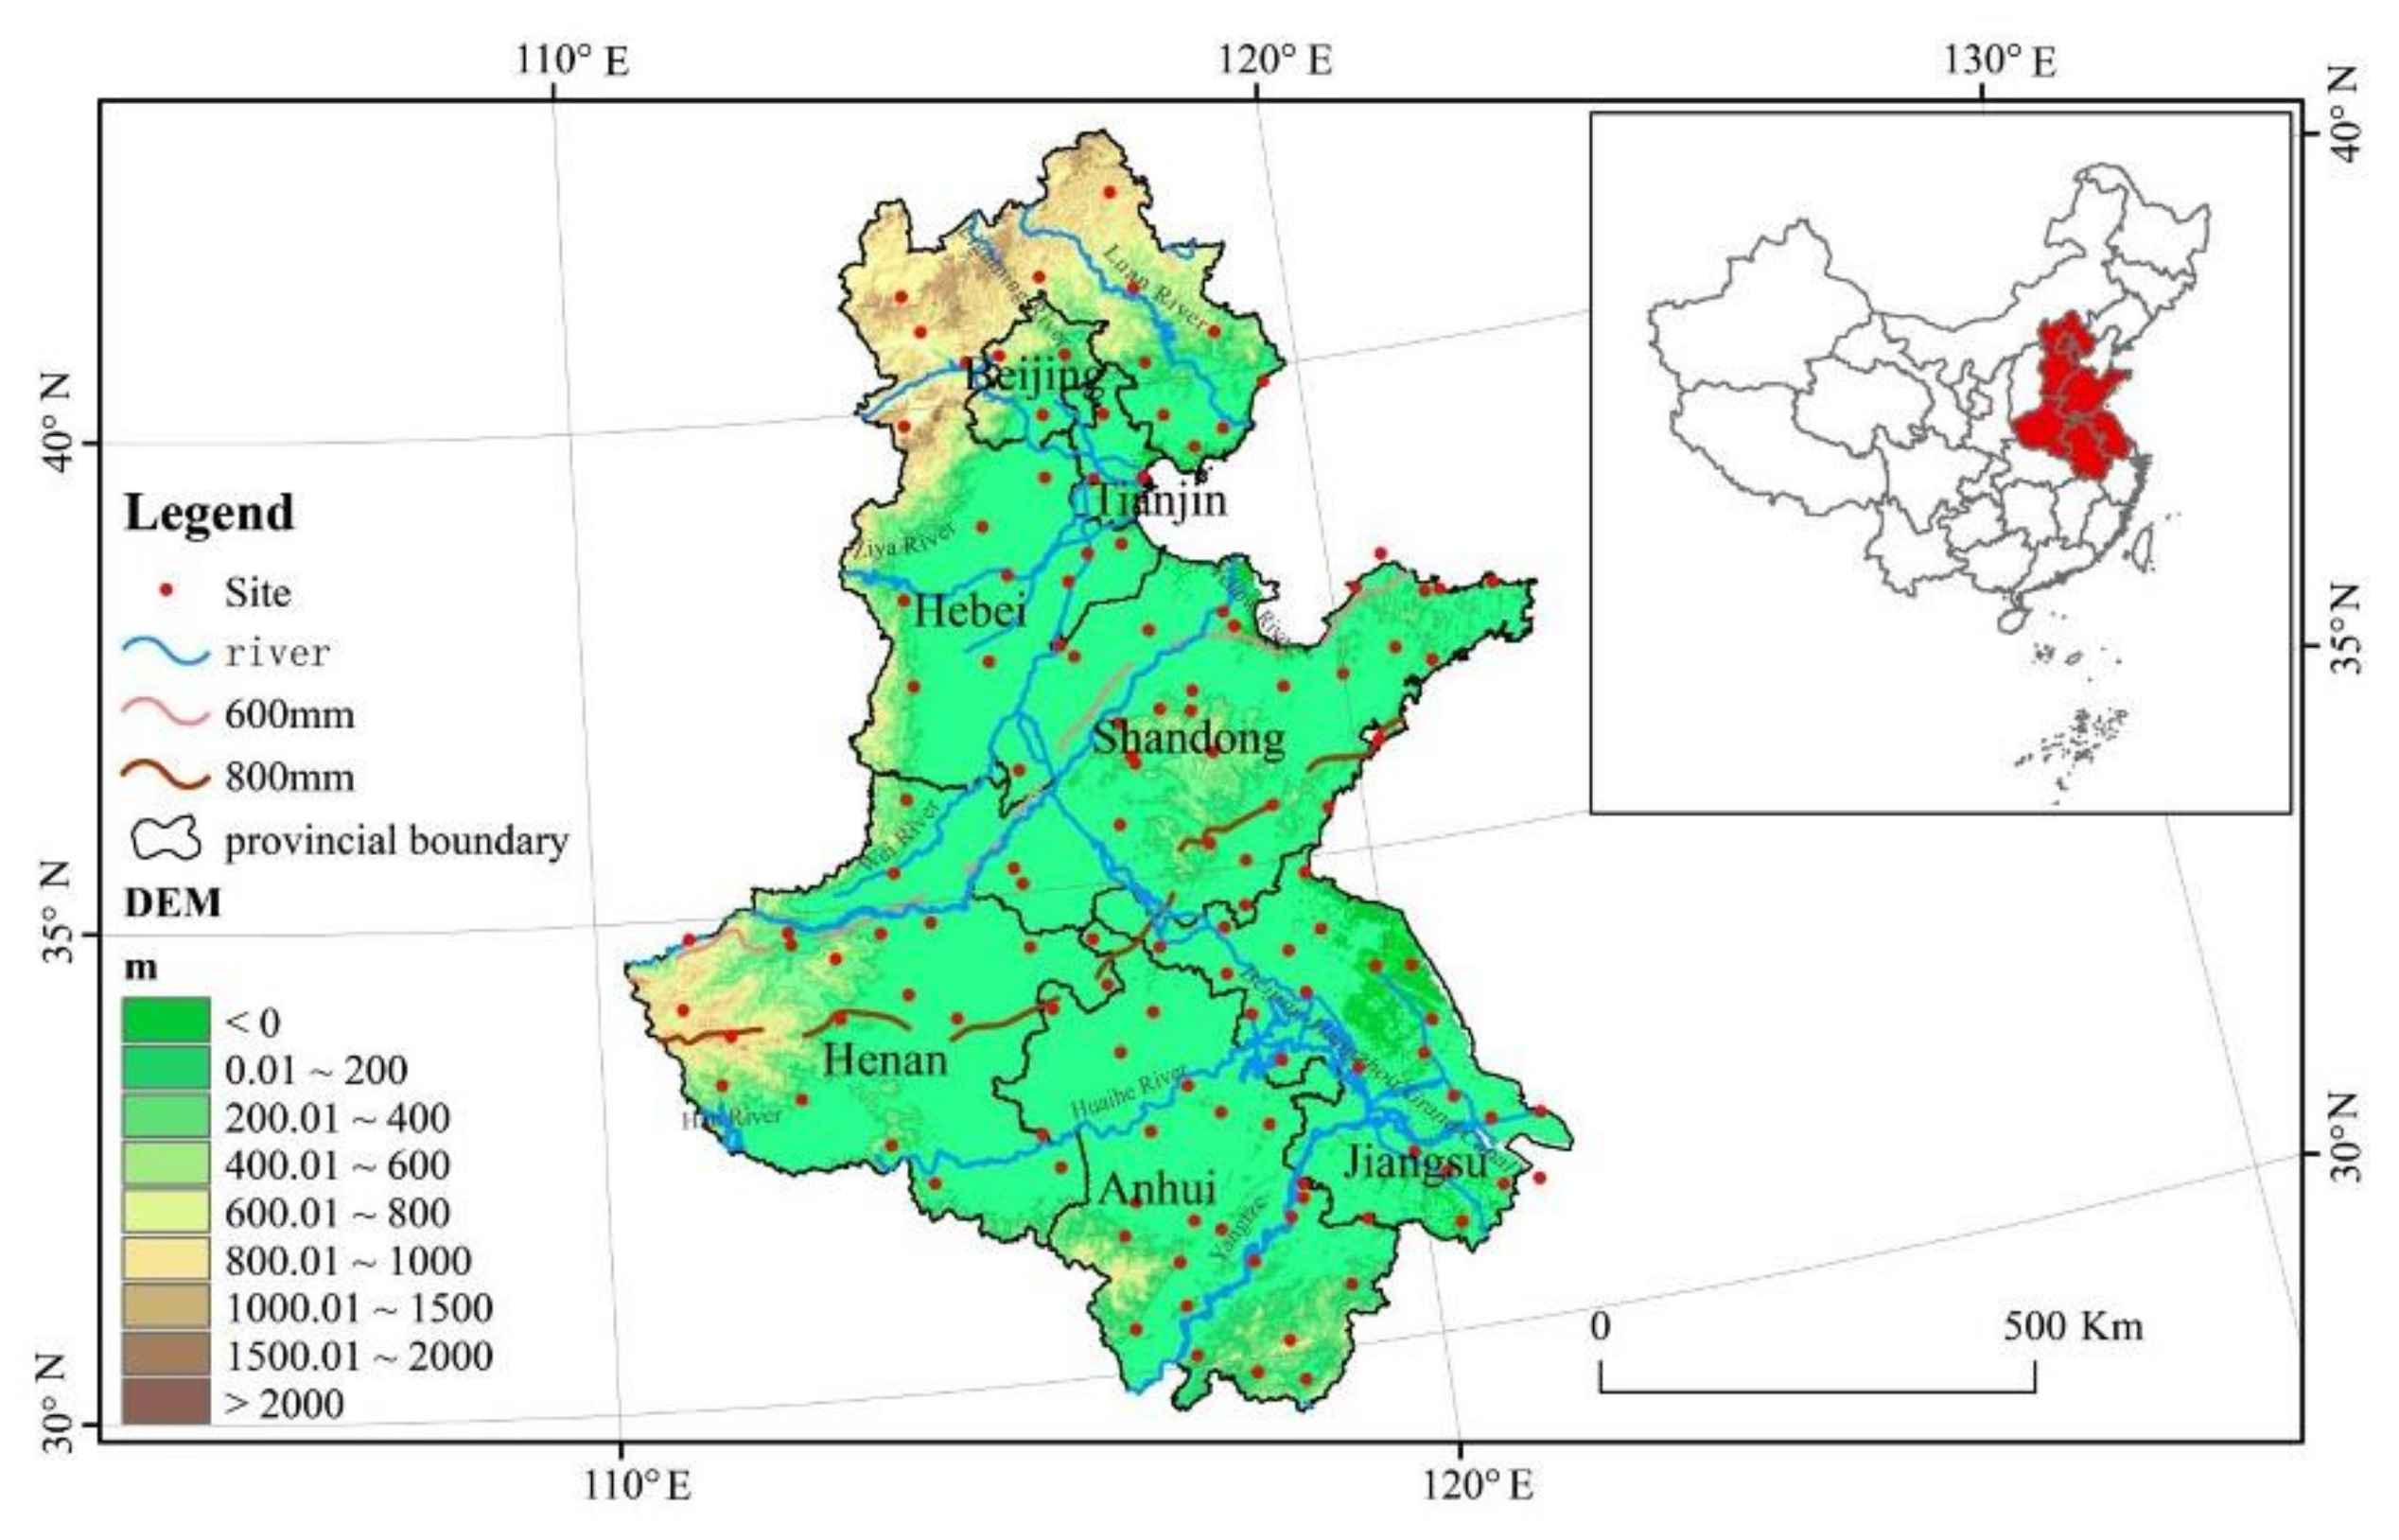
The North China Plain, with the Yellow River, the Huaihe River and the Haihe River as the main alluvial plain, is located in the semi-arid monsoon climate area of warm temperate zone. From March to May it is considered as spring, from June to August as summer, from September to November as fall and from December to January as winter. It is cold and dry in winter, hot and rainy in summer, and sensitive to climate change. The elevation of the North China plain is not large, but the latitude spans a wide range. The large span from south to north leads to great differences in temperature and precipitation. Isohyetal line of 600 mm and 800 mm cross the whole plain. Seventy percent of the annual rainfall is mainly in 4 months from June to September [13,40]. With a large population density, 1/6 of the national average quantity in per capita water resource, 1/10 of the national average quantity in per hectare water resource of cultivated land, the North China Plain is one of the regions with the poorest water resource. In this study, in order to correspond to the implementation of drought management policies, administrative units are wholly kept and 7 provinces and cities including Hebei, Beijing, Tianjin, Henan, Shandong, Anhui, and Jiangsu are selected as the main body of the study area (Figure 1).
The data in this study are from China Meteorological Data Network (https://data.cma.cn/site/index.html). Daily meteorological data from 127 national meteorological stations from the year 1960 to 2017 are selected. The meteorological elements are precipitation (mm), minimum and maximum temperature (°C), average wind speed (m/s), average relative humidity (%), sunshine duration. A stepwise regression analysis of the data from the surrounding weather stations is used to estimate the missing data of meteorological elements, less than 5% of which were missing. The quality matching adjustment method was used to adjust the error of the missing data [41]. Homogeneity test was carried out by using the RH-test package.
2.2. Standardized Precipitation Evapotranspiration Index
Potential Evapotranspiration (PET) was calculated by using the Penman–Monteith Formula recommended by FAO-56 [42], and the difference value was calculated every day in precipitation and PET.
In Equation (1), PET is the potential daily evapotranspiration (mm/d); G stands for soil heat flux density (MJm−2/d), when the calculated time step is less than 10 days, it can be ignored; Rn stands for net radiation (MJm−2/d); γ for hygroscope constant (kPa/°C); T is the daily average temperature (°C); u2 is the wind speed at 2 m above the ground (m/s); Δ is the slope between saturated vapor pressure and temperature curve under a given temperature (kPa/°C); es is the saturated vapor pressure (kPa), and ea is the actual vapor pressure in the air (kPa). Rn can be calculated by solar radiation (Rs) [40]. In Equation (2), n is sunshine hours (h), N is the maximum possible duration of sunshine or daylight (h), Ra is extraterrestrial radiation (MJm−2/d); as and bs stand for empirical coefficients of recommended values 0.25 and 0.5 respectively [42].
With a value for PET, the difference between the precipitation P and PET for the daily i is calculated using Di = P − PET. According to the procedure of Vicente-Serrano (2010), the three-parameter log-logistic probability distribution is used to simulate the rate of water equilibrium accumulation [34] but the probabilistic weighted moment of the original data sequence used in its calculation formula is replaced by unbiased estimation in this study [38]. The probability density function (Equation (3)) and probability distribution function (Equation (4)) of a three-parameter log-logistic are expressed as:
where α, β, and γ are scale, shape, and origin parameters, respectively, for Di values in the range (γ< Di < ∞). Parameters of the log-logistic distribution can be obtained following the L-moment procedure [43]. When L-moments are calculated, the parameters can be obtained following Singh et al. [44]:
where Γ(β) is the gamma function of β, ws is the probability weighted moments of order s, which can be estimated by unbiased estimation [34,45,46]:
where
and N is the chosen time scale (daily); P is the probability of exceeding a determined Di value, P = 1 − F(x). If P > 0.5, then P is replaced by 1 − P and the sign of the resultant SPEI is reversed. The constants are C0 = 2.515517, C1 = 0.802853, C2 = 0.010328, d1 = 1.432788, d2 = 0.189269, and d3 = 0.001308 [34]. The value range of SPEI is [−3~3]. Positive and negative values indicate wetness and drought, respectively. Kolmogorov–Smirnov test was performed on the fitting model between the difference between precipitation and PET and the expected value of the log-logical distribution. The data was proved to come from the same distribution, which indicates that the statistical assumptions will be proved to be valid in the North China Plain. The monitoring effect of this drought index was verified by using historical documents and reference materials [47].
2.3. Empirical Orthogonal Function Analysis
EOF is able to reduce a data set that contains many variables to one that contains a few new variables. These new variables are linear combinations of those original ones, which are selected to represent the highest possible proportion of the variation contained in the original sequence. In studies of meteorology and climate, EOF eigenvectors describe spatial modes, while principal components reflect time series that respond to the importance of spatial modes in the original data [28,29]. EOF expresses the space-time field of the variable through a matrix [28]:
where m is the observation station; n is the station in time, which represents the number of observations. xij is the jth observation value at the ith meteorological station. And Xm×n can be seen as a linear combination of k spatial feature vectors and corresponding time weight series:
where V is the space matrix, also known as spatial patterns; T is the time series matrix. Through this process, the spatial typical field and time series of the SPEI are extracted. When the interpretation of physical quantity is the main target of EOF, an EOF process is needed in order to get a simple structure. This is called REOF. During this process, it is often necessary to rotate a subset of the initial eigenvector and transform it to another set of the new coordinate vector [28]. Orthogonal rotation to eigenvectors is usually performed by the maximum variance method [29]. Meteorological station location and SPEI values are taken as variables and observed values respectively for EOF analysis, and EOFs are obtained, which point in the direction where the data vectors show the biggest variability. When they are projected onto the original SPEI data for principle components analysis (PCA), the results (PCs) show that EOFs evolve over time. EOFs usually show the characteristic of preventing them from isolating individual variation patterns, such as regional shape or something related with scale. Because the weather in the North China Plain is usually dominated by a large range of atmospheric processes, the orthogonal constraint on the eigenvectors makes the interpretation of its physical meaning difficult. A certain amount of EOF load is retained by means of varimax rotation, which redistributes the variance among rotated EOFs (rEOFs) and PCs (rPCs) and attempts to simplify the rEOFs by pushing loading coefficients toward 0 or ±1. In order to retain as much original variable information as possible, the eigenvectors whose contributing rate of cumulative variance is above 85% are selected. Then the North’s Rule of Thumb [48] is applied to confirm the amount of EOFs that are going to be rotated. After determining the amount of rEOFs that are going to be rotated, smooth boundaries between sub-regions can be drawn by interpolating the minimum correlations. The sub-region boundary should be expressed by correlation to illustrate the correlation strength between these rPC and original SPEI data. The final result of partition should be checked according to the principle of spatial continuity.
By multiplying each element to the square root of the corresponding eigenvalue, the eigenvectors are re-scaled so as to interpret the eigenvector elements more directly according to the relationship between principal components (rPC) and original SPEI data. Under this circumstance, each eigenvector element is numerically equal to the correlation coefficient between the corresponding principal component (rPC) and the standardized variable SPEI [29]. This kind of scaling keeps the eigenvectors and time coefficients constantly relative to the original data. The normalized rPCs of each partition can be interpreted numerically as drought indices with statistical properties similar to those of the input dataset. Therefore, the exponent that can be calculated for SPEI can also be calculated for rPC. In this study, monitoring and statistical analysis on drought and moisture are not conducted from the spatial scale of the study area, but only the correlation between SPEI value and Principal Components (rPC) is considered [31], and the drought characteristics of the North China Plain are partitioned from this perspective. The correlation coefficients between rPC and the original SPEI data were interpolated by the inverse distance weighting when doing partition [49].
3. Results
3.1. Seasonal rEOFs
3.1.1. Spring (March/April/May)
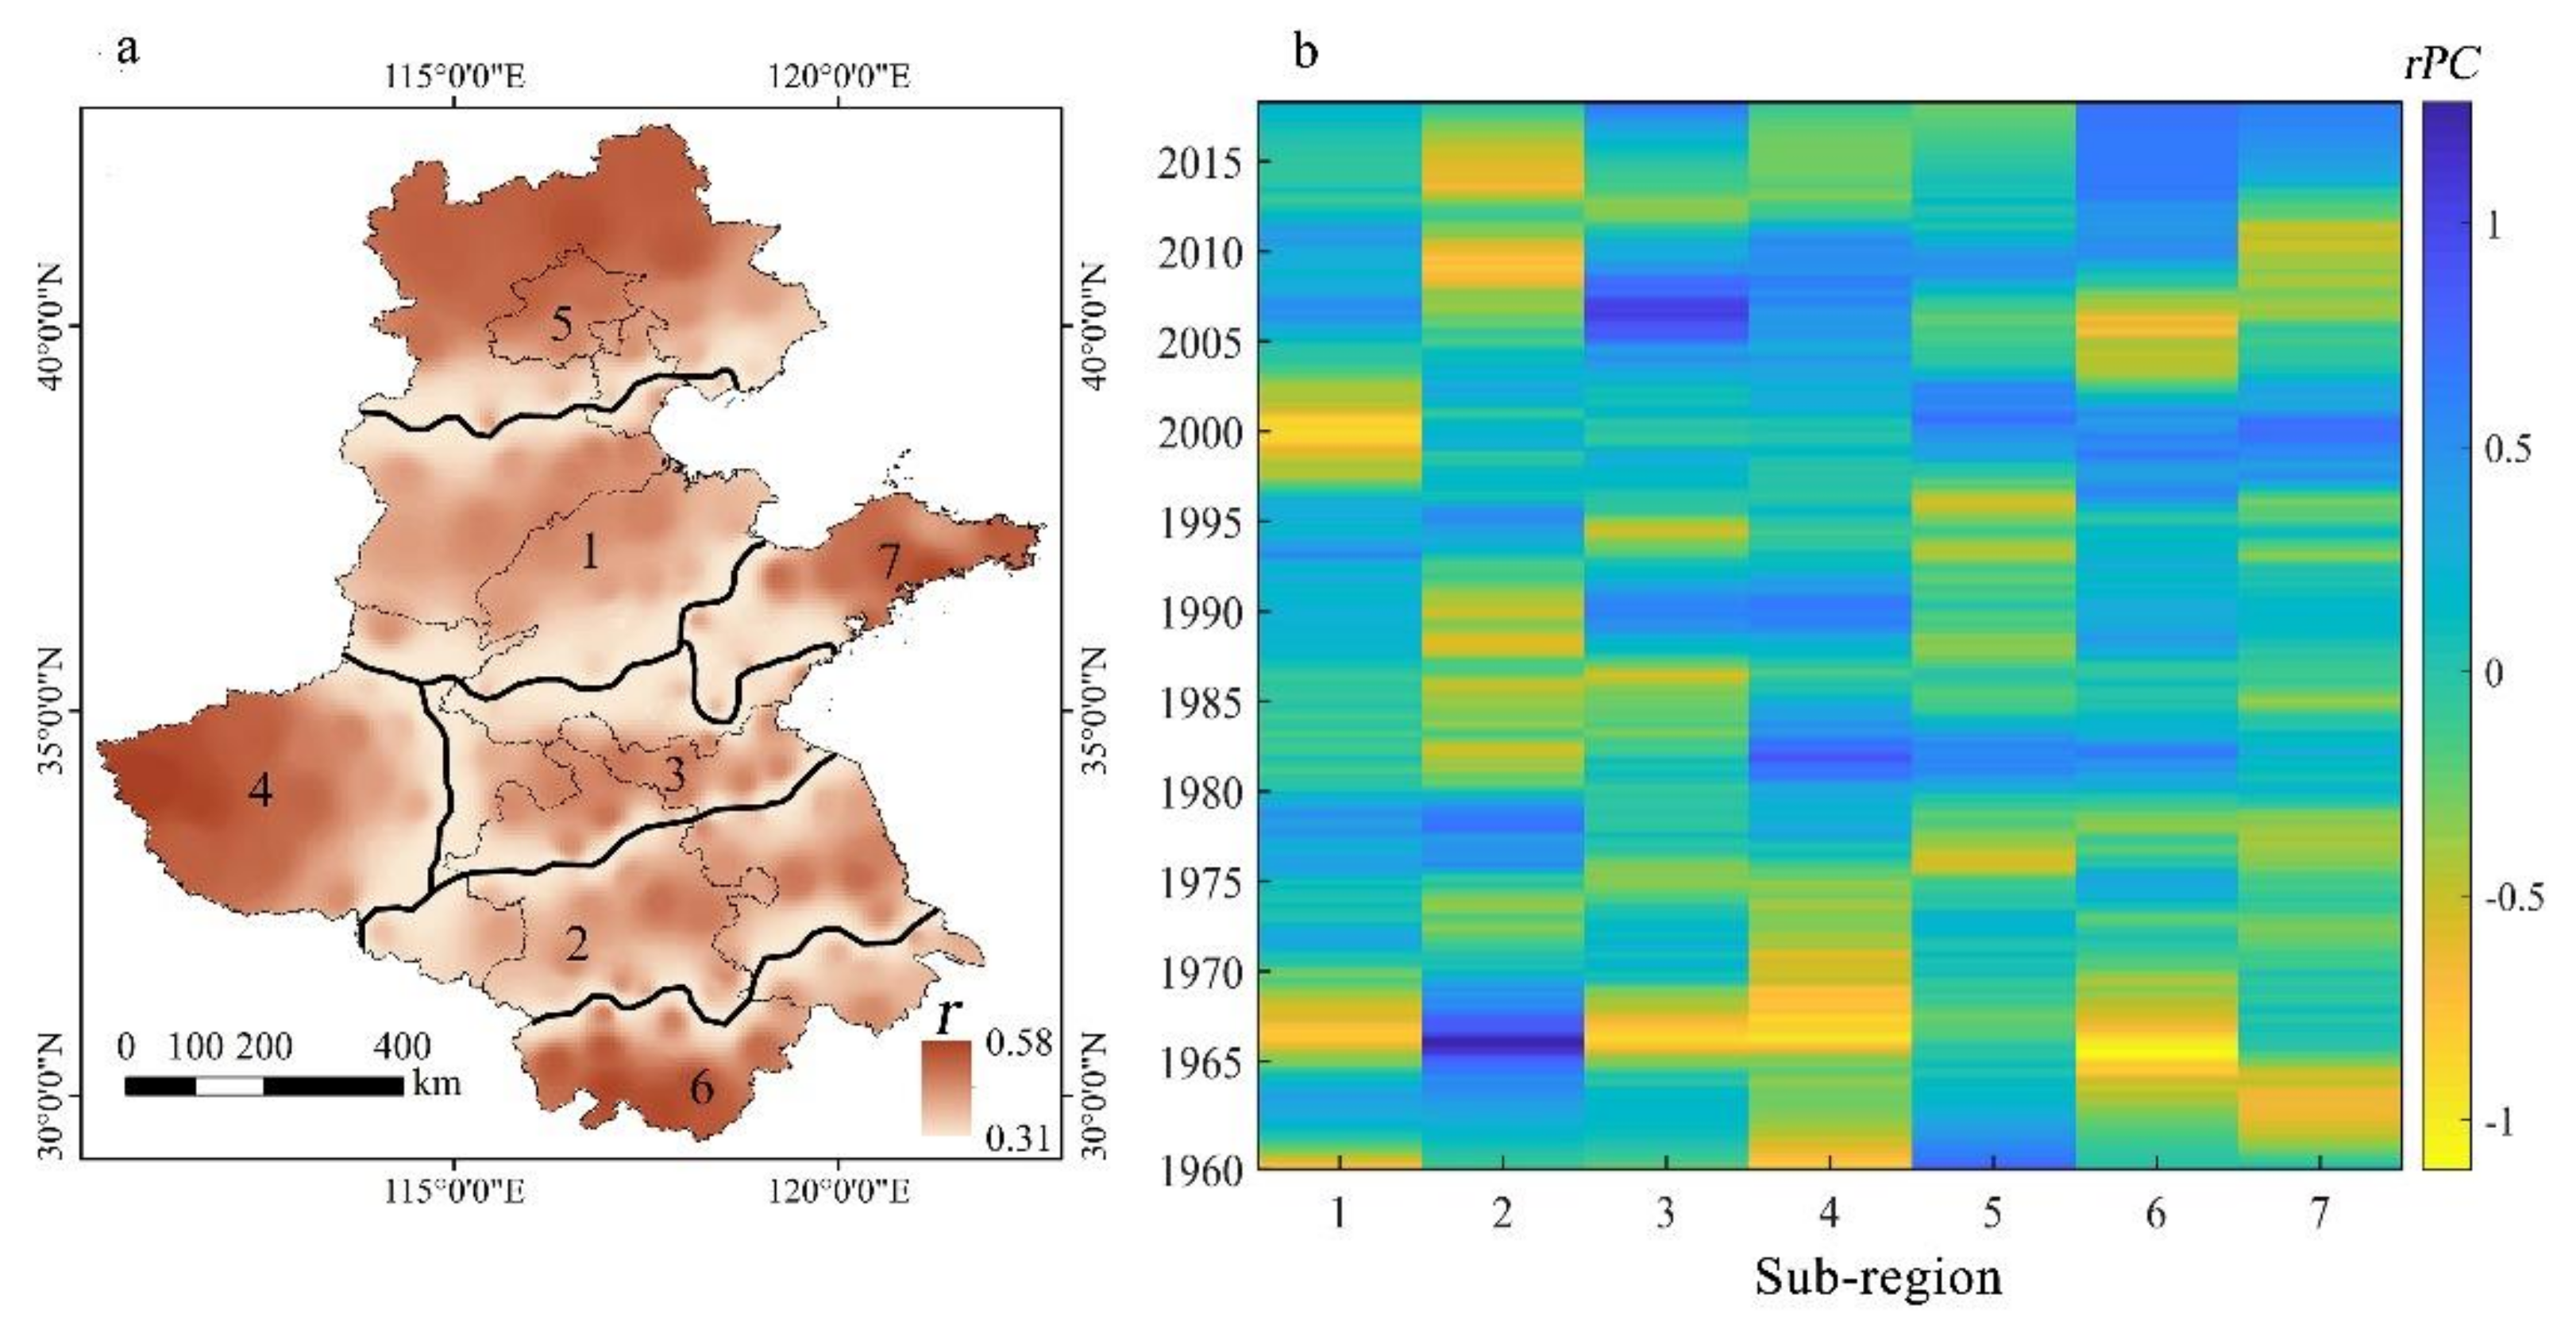
Seven EOFs were selected for spring SPEI rotation, and seven sub-regions similar to drought variability were obtained (Figure 2a), which explained 83.2% of drought variability. The contributing rate of cumulative variance of the first 8 eigenvectors reached 85.59%. North’s Rule of Thumb was used to select 7 eigenvectors that passed significance testing. The variance contribution rate of each selected EOFs was 55.84%, 15.15%, 5.54%, 2.16%, 1.87%, 1.49%, and 1.19%, respectively. The sub-regions identified by REOF cross the provincial boundaries. Every partition generally shows a zonal distribution in the east–west direction. For example, sub-region 1 includes the border of Henan, Shandong, Anhui, and Jiangsu provinces and the surrounding areas. It is just the transition area from the Huaihe River Plain to the Yellow River Plain and spans the whole plain. Sub-region 2 shows greater spatial variability, possibly due to its proximity to the adjacent plains of the middle and lower reaches of the Yangtze River to the south. Rain always comes early and goes late. Sub-regions 4, 3, and 5 are arranged from east to west on the same latitude, and the correlation between rPC and original SPEI of the three sub-regions here declines from east to west. Sub-region 7, which is the northern part of the north China plain and the extension part of Taihang Mountains and Yanshan Mountains, influenced by both elevation fluctuation and elevation of latitude.
The spring rPC time series show significant differences in the duration and severity of the seasonal drought and moisture process in the seven sub-regions (Figure 2b). It also shows a time period when the sub-regions experienced the similar drought conditions. Sub-region 1, 3, 5, and 6 experienced severe spring droughts between 1963 and 1968. Sub-region 1, 2, and 6 experienced more severe spring droughts between 1988 and 1993. It can be clearly seen from the yellow belt of most sub-regions in Figure 2b that sub-region 5 experienced severe spring drought in the early 1960s and late 1970s but showed the opposite wet trend since the 1990s. In general, the spring time series of each sub-region showed unique drought characteristics, with significant differences in drought severity and duration. When examining the rPC time series, the time period from 1960 to 1980 was the driest period in most sub-regions (Figure 2b), which is consistent with the historical records.
3.1.2. Summer (June/July/August)
Seven EOFs were selected for summer SPEI rotation, and seven sub-regions with drought variability were obtained (Figure 3a), which explained 74.38% of drought variability. The contributing rate of cumulative variance of the first 9 eigenvectors was up to 77.76%. North’s Rule of Thumb was used to select 7 eigenvectors that passed significance testing. The variance contribution rate of each selected EOFs was 40.53%, 18.53%, 6.32%, 3.31%, 2.89%, 1.53% and 1.25%, respectively. Sub-regions 1, 2, and 3 occupy a large area in central north China plain. Sub-region 4 covers most area of Henan Province, which lies in the west of the Qinling Mountains, showing a different spatial variability. Sub-regions 4, 5, 6, and 7 show stronger correlation than sub-regions 1, 2, and 3 in the margin of the North China plain, indicating that the summer drought variability in these sub-regions may be more affected by the influences from outside the region. Sub-region 5 is basically equivalent to sub-region 7 in spring, indicating that the spatial variability of this region is similar in spring and summer. The correlation coefficient of all sub-regions were above 0.3. The direction of the summer division is very similar to that of the spring, indicating that the drought variability in spring and summer is relatively stable (Figure 2a and Figure 3a).
For most of the North China Plain except sub-region 2, the summer drought (Figure 3b) from 1966 to 1968 was obviously extreme. The dry and hot growing season during 1966–1973 had a significant negative impact on crop production. During this period, most of the North China Plain experienced severe summer drought. In 2001 and 2002, the summer drought in sub-region 1 was prolonged and serious. Overall, summer droughts in the sub-regions were less severe than in the spring in terms of duration, severity, and extent of impact.
3.1.3. Fall (September/October/November)
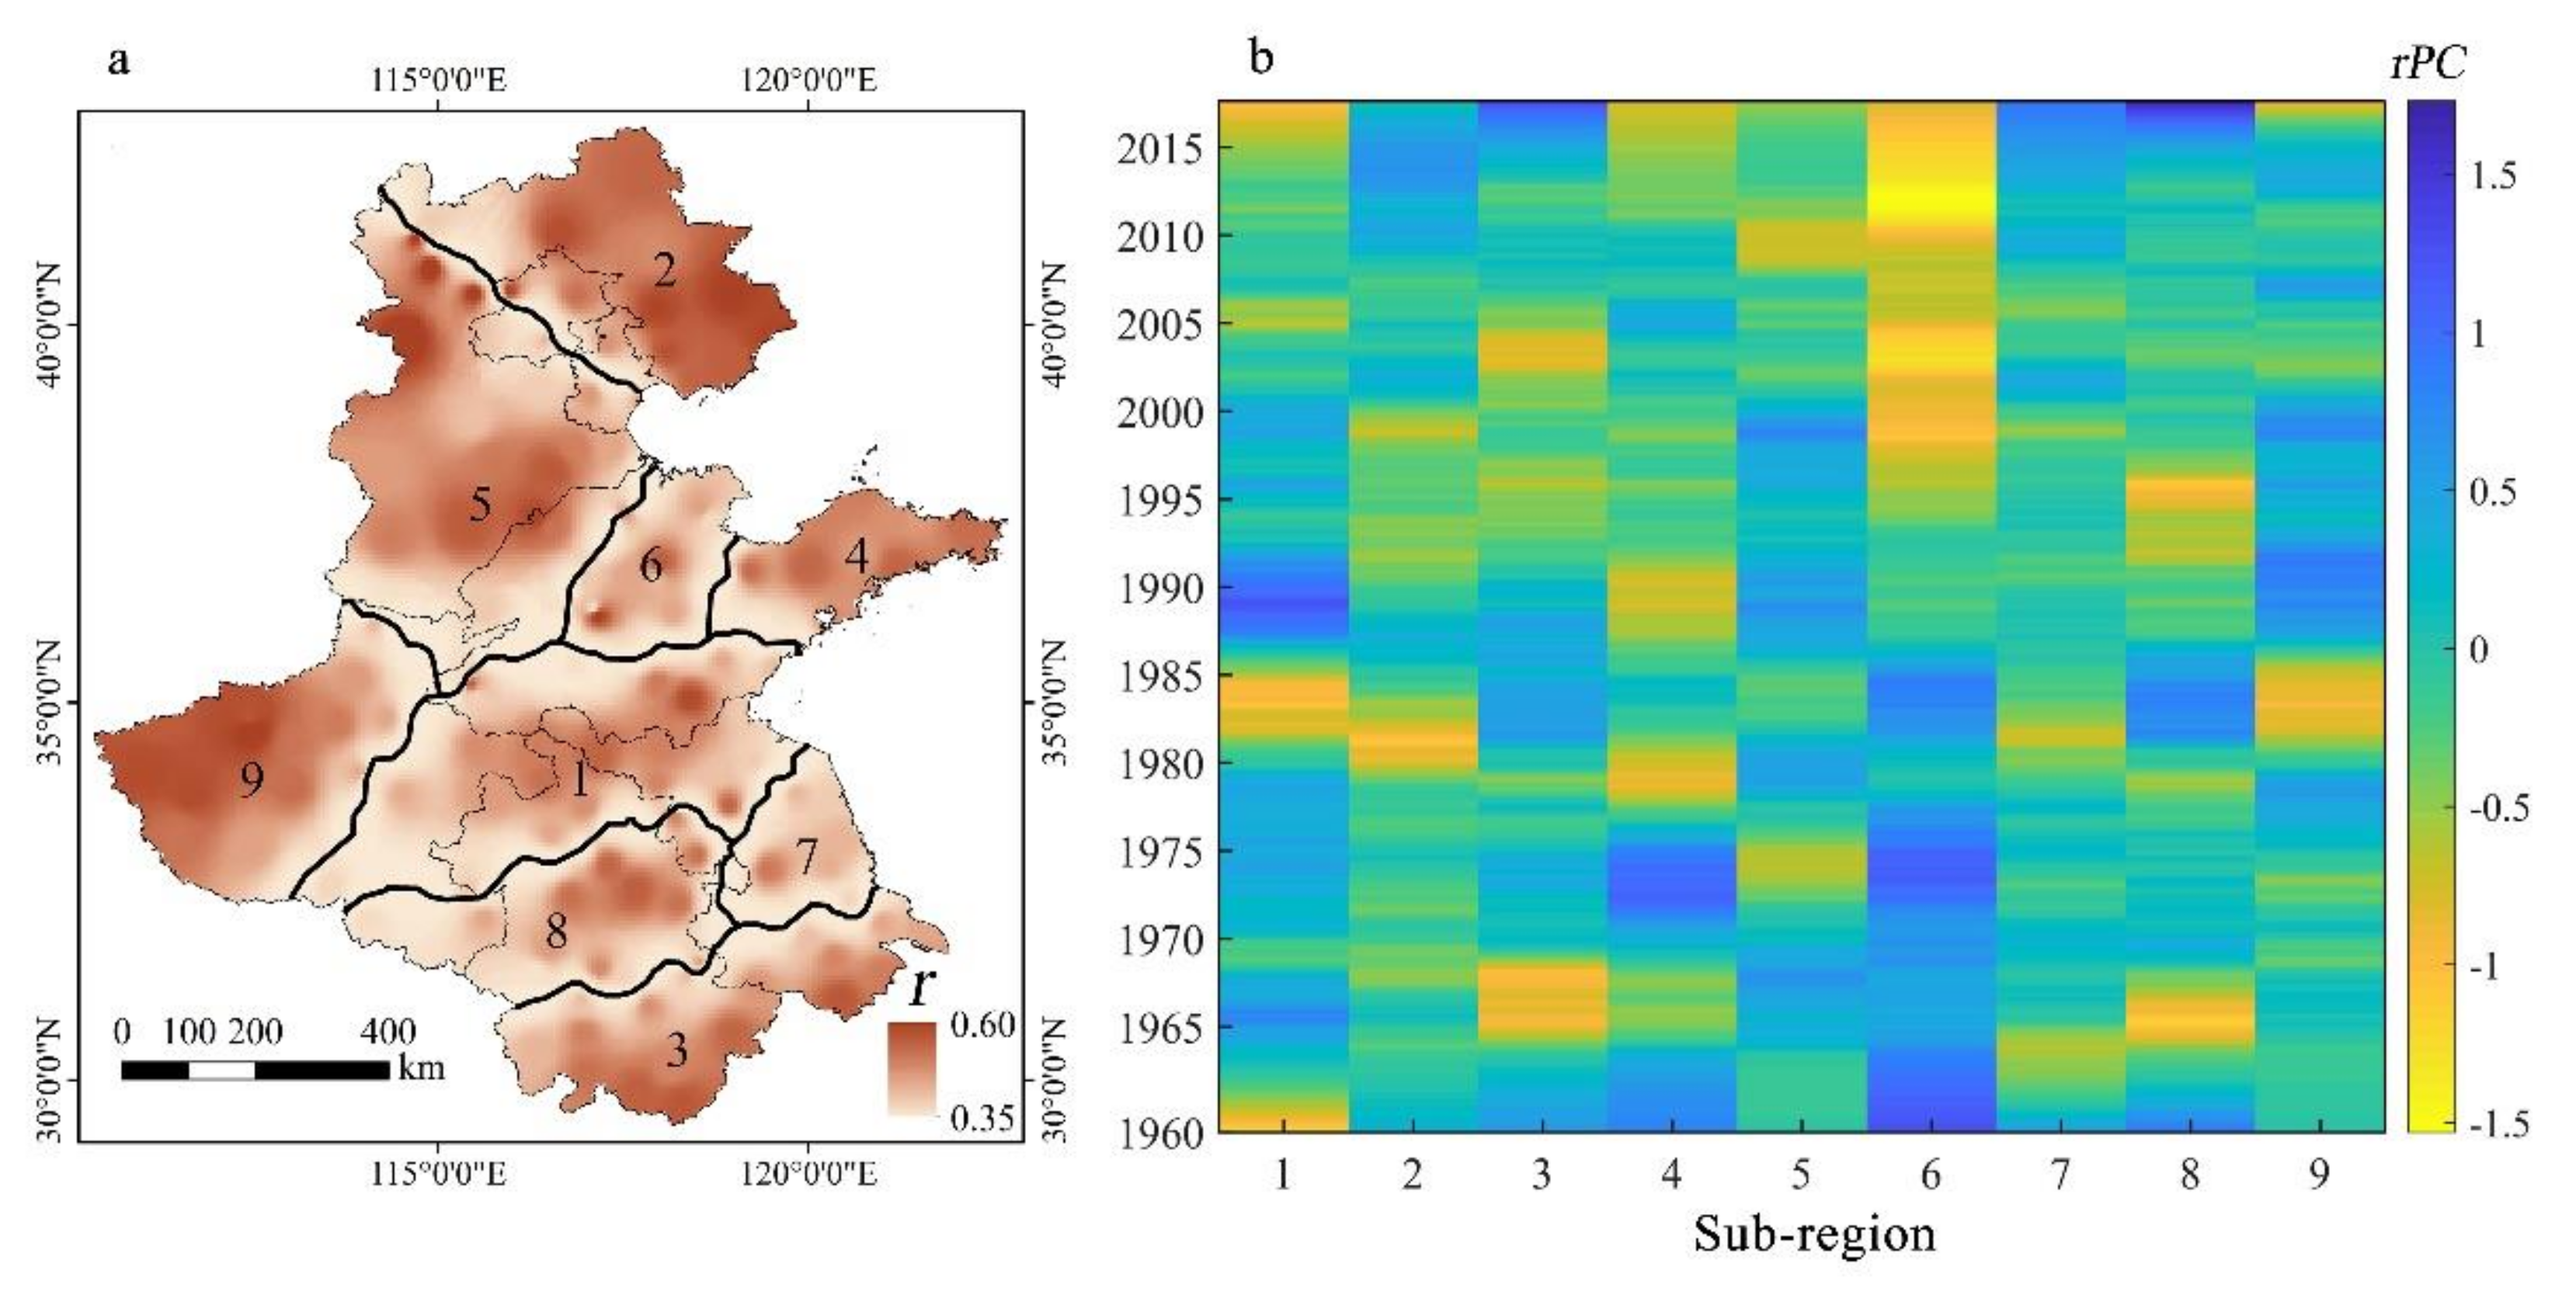
Nine EOFs were selected for fall SPEI rotation, and nine sub-regions with similar drought variability were identified (Figure 4a), which explained about 73.91% of original drought variability. The variance contribution rate of each selected EOFs was 33.29%, 15.89%, 8.85%, 5.26%, 3.35%, 2.39%, 1.98%, 1.6%, and 1.31%, respectively. Sub-region 1 is located at the junction area of Henan, Anhui, Jiangsu and Shandong provinces, and is similar to sub-region 1 in spring and Sub-region 3 in summer, indicating low drought-season variability in this region. Sub-region 2 highlights the difference between the spring/summer sub-region. The regional range of sub-region 3 corresponds to sub-region 2 in spring and sub-region 6 in summer. Sub-region 4 corresponding to sub-region 4 in spring and sub-region 7 in summer. Sub-region 9 occupies a large area of central and western Henan, and the high-value area of correlation coefficient is located at the extended area of Qinling Mountains, which is similar to Sub-region 4 in summer. The correlation coefficient in each sub-region is above 0.35. Sub-region 2, 5, and 9 are located in the west and north of the plain, showing stronger correlation than other sub-regions, which may be influenced by the combination of topography and summer monsoon.
The drought characteristics of fall are complex and diverse, but the condition in each sub-region is generally less severe and lasts shorter than that of spring and summer (Figure 4b). Sub-region 6 shows the most unique characteristics of fall drought, which has been experiencing severe drought since 1996. However, during the year 1960–1995, this region was more affected by wet events. Besides sub-region 6, sub-region 1 and 9 also experienced severe autumn droughts in the 1980s. RPCs for each sub-region indicate that the North China Plain has experienced less drought with a lower degree and shorter time duration in the in fall since 1960.
3.1.4. Winter (December/January/February)
Seven EOFs were selected for winter SPEI rotation, and seven sub-regions with similar drought variability were obtained (Figure 5a), which explained 84.62% of original drought variability. The contributing rate of cumulative variance of the first 7 eigenvectors was up to 84.62%, and all of them passed significance testing. The variance contribution rate of each selected EOFs was 57.46%, 13.39%, 5.09%, 3.04%, 2.57%, 1.69%, and 1.36%, respectively. The characteristics of winter drought in the North China Plain are completely different from that of the former three seasons and the sub-regions constructed in the southern plains are quite large comparing those for spring, summer and fall. Sub-region 1 and 2 account for almost half of the study area. It is really important for us to notice that two long and narrow sub-regions (sub-region 6 and 7) appears in a south–north direction in the western part of the plain as no sub-region with this kind of characteristic has ever emerged in other seasons. This suggests that the factors influencing the variability of winter drought have changed dramatically. Sub-region 3 includes Beijing, Tianjin and northeastern part of Hebei Province. Sub-region 4 covers the whole Shandong Peninsula, where the four seasons are all divided into this sub-region, making it have a lower drought variability. These large area sub-regions highlight its universality and homogeneity effects of the winter climatic characteristics in the southern plains, which provides a possibility for drought managers to integrate resources when making winter mitigation strategies.
When checking the rPC time series, we found that the most severe fall drought in most sub-regions happened during the year 1960 to 1980(Figure 5b), while sub-region 1 and 2 experienced relatively dry fall during the year 2000 to 2003. In the 1960s and early 1970s, sub-region 3 experienced serious drought and in the mid-1990s sub-region 4 and 6 had the same experience, followed by sub-region 1 in the mid-to-late 1980s. Based on the analysis of the four seasons, most of the sub-regions show an east–west zonal distribution. In different seasons, the boundaries and adjacent areas of Henan, Shandong, Anhui, and Jiangsu provinces and the Shandong Peninsula are stably divided into one region, which shows a lower drought variability. From the seasonal variation characteristics of rPC time series, it can be easily seen that spring drought the largest occurs in the largest area with the most severe degree and lasts for the longest time duration while fall drought has a relatively complex pattern. Each sub-region has its own unique time pattern.
3.2. Seasonal Trends
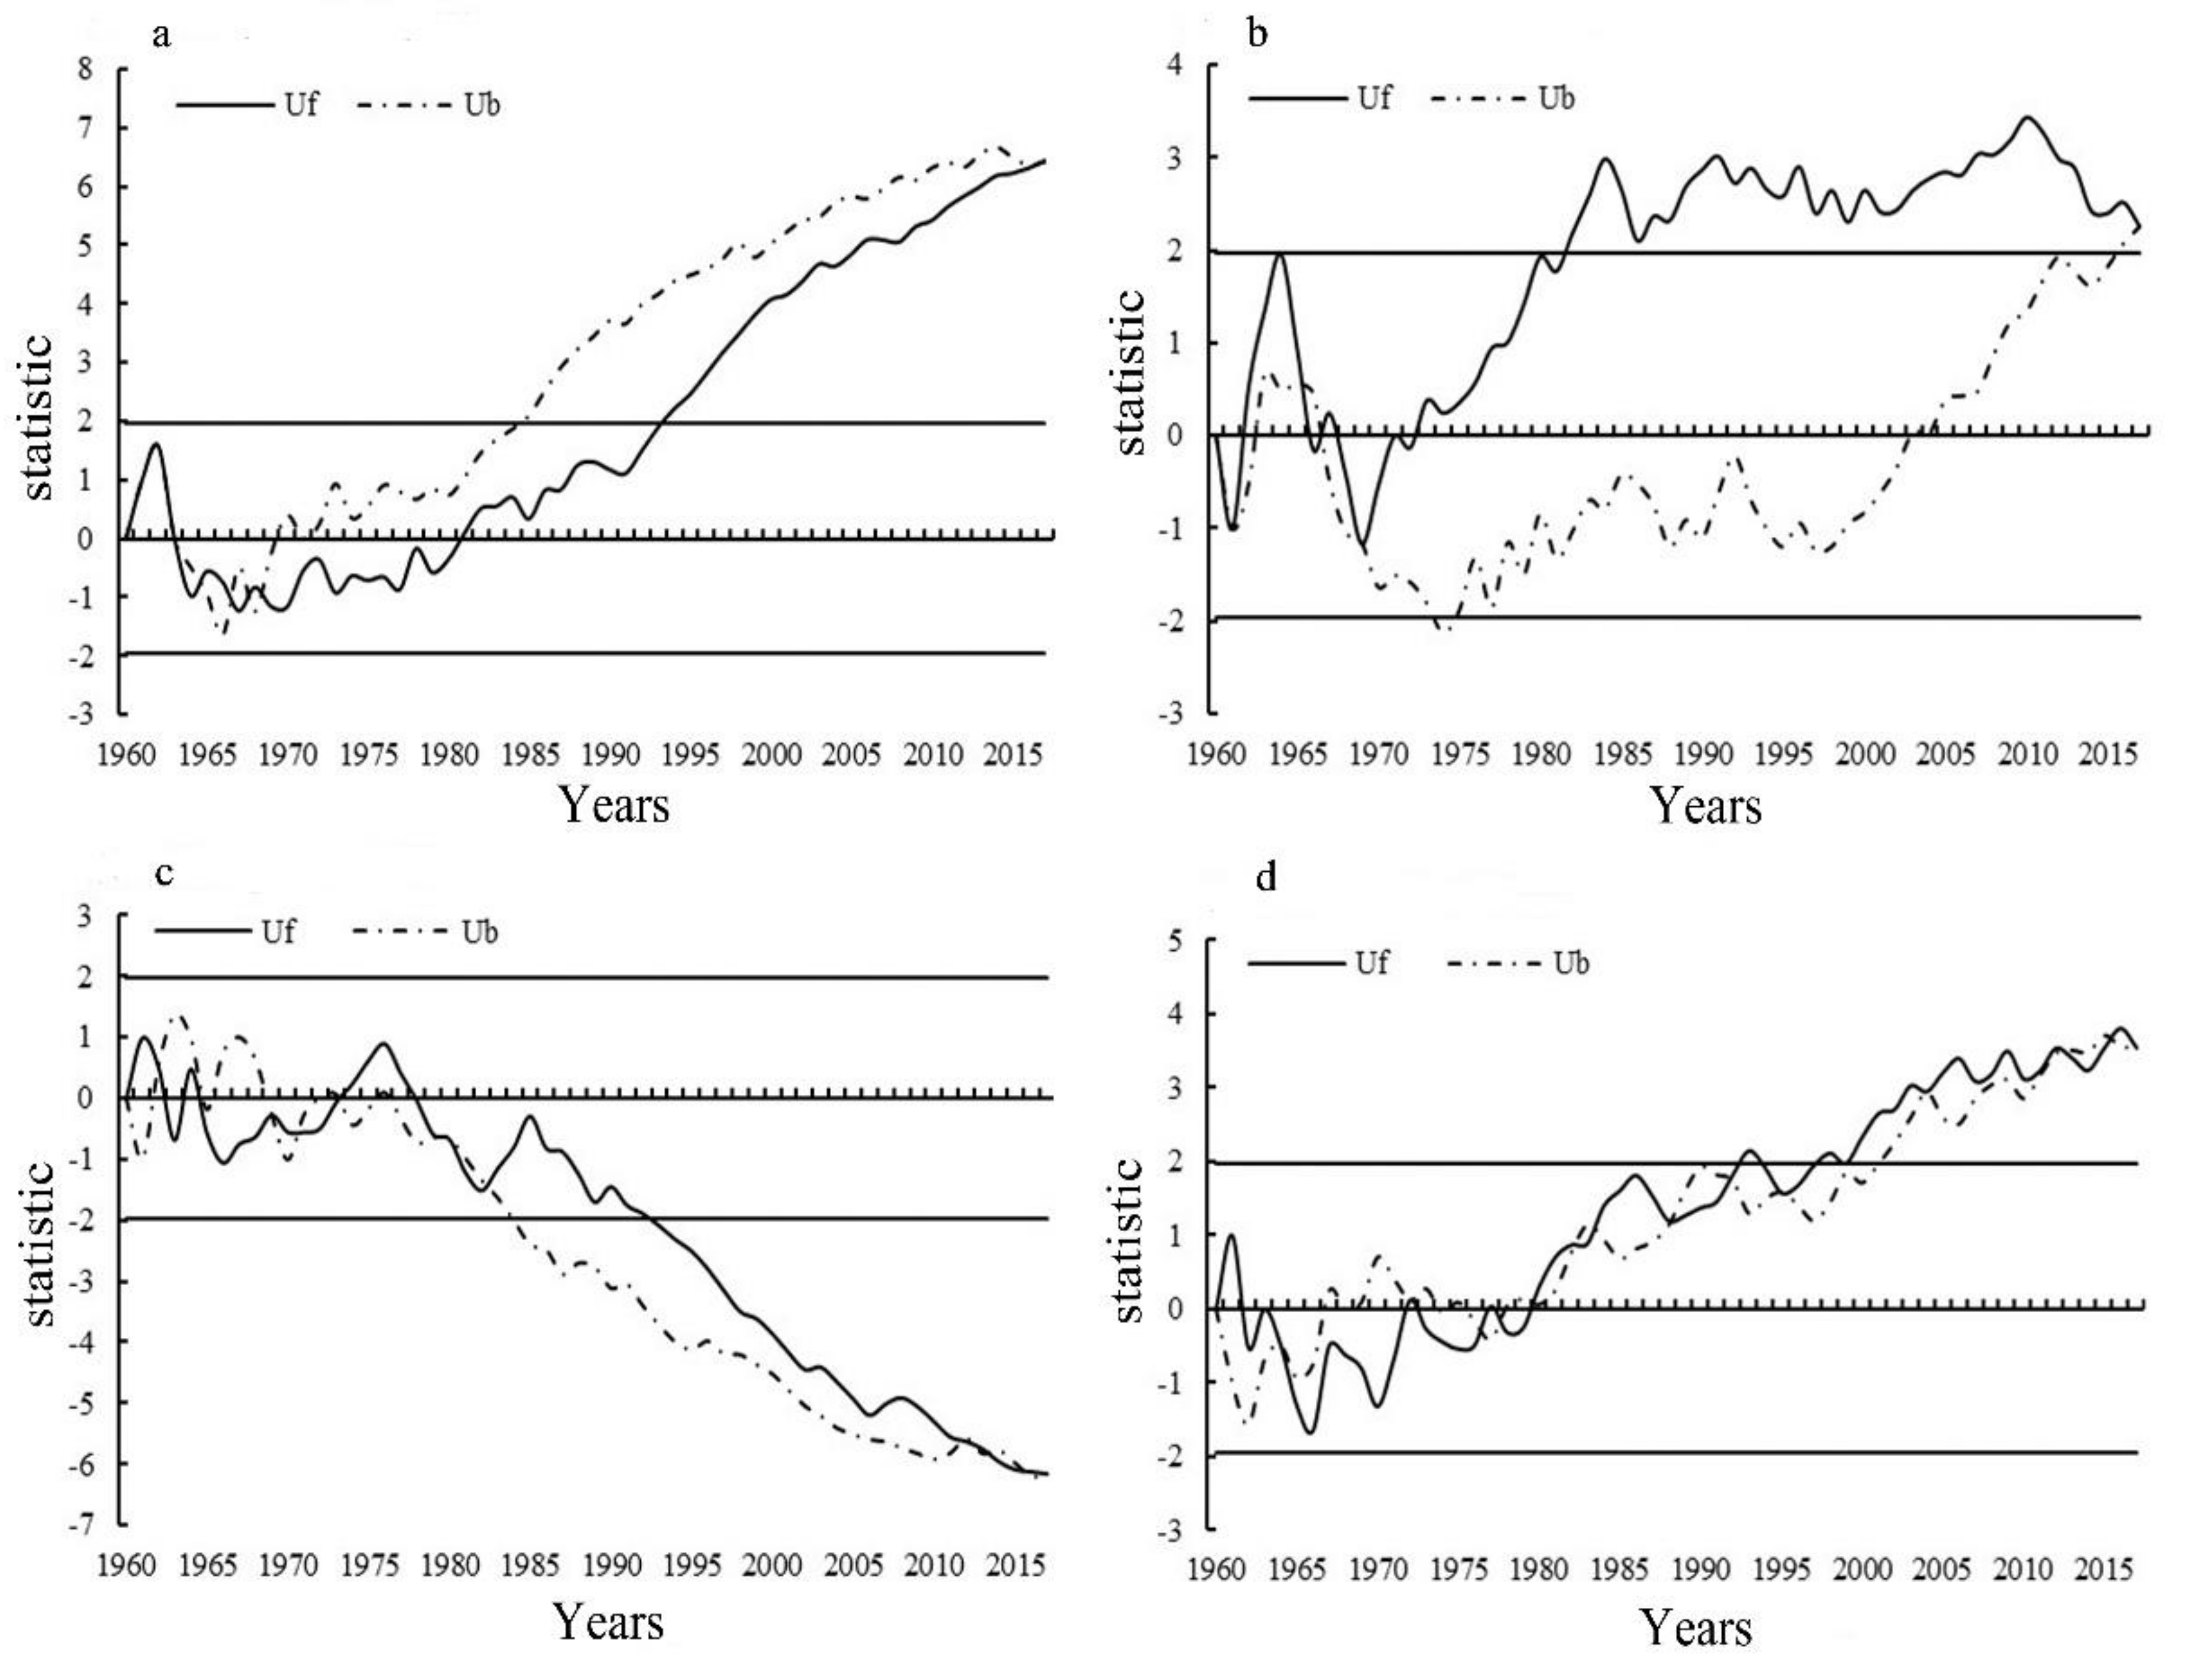
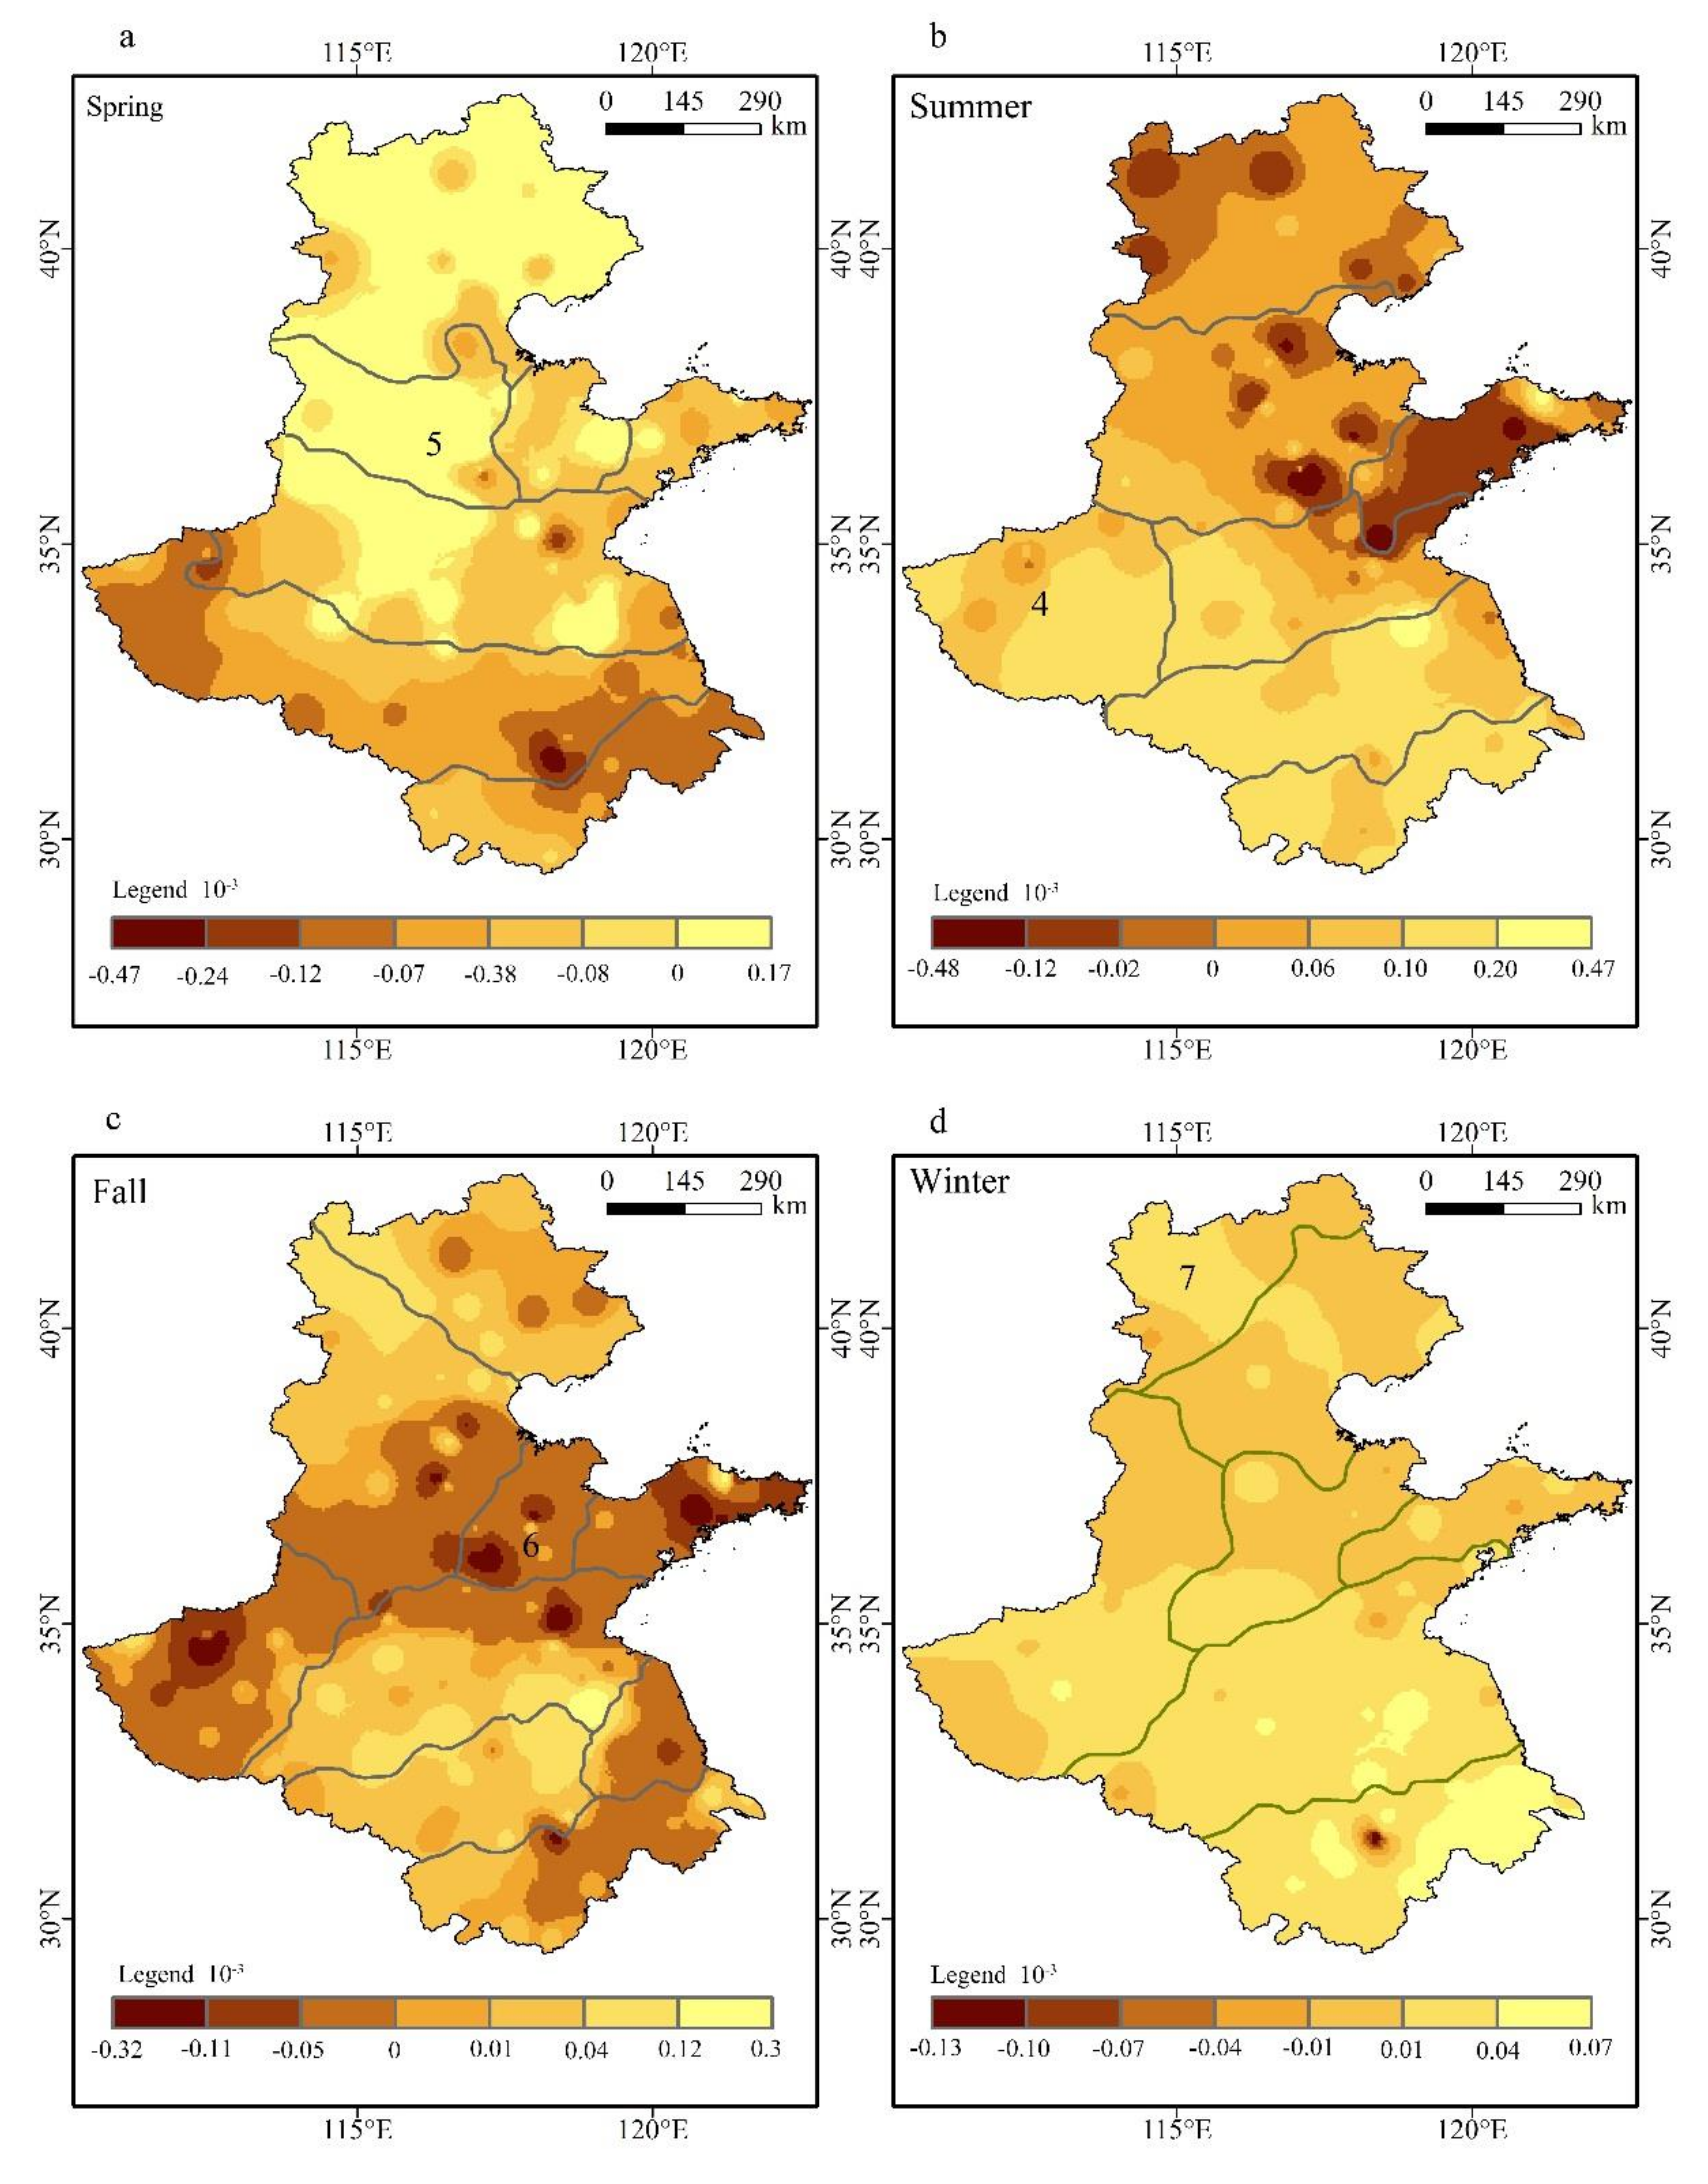
The modified Mann–Kendall test [39] was used to test the trend of rPCs in different seasons (significance level 0.05), and the results are as follows: In spring, there was a significant wet trend in sub-region 5 from 1985 to 2017 (Figure 2b and Figure 6a). In summer, sub-region 4 showed a significant wet trend from 1969 to 2017 (Figure 3b and Figure 6b). In fall, sub-region 6 had a significant drought trend from 1981 to 2017 (Figure 4b and Figure 6c). In winter, sub-region 7 had a significant wet trend from 1978 to 2017 (Figure 5b and Figure 6d). There was no clear spatial pattern in these four regions. No trend of significant change appears in other regions in each season, indicating that the drought conditions in the North China Plain are complex and changeable. In general, the results of the seasonal trend analysis show that there has been no significant trend value in most areas since 1960. However, it is worth noting that some regions have the positive and negative temporal trends in different seasons. For example, the northwest region of Shandong Province is wet in spring (sub-region 5) and dry in fall (sub-region 6). These results illustrate the importance of seasonal analysis, particularly for agro-ecosystems that depend on timely rainfall during different growing seasons.
Spatially, changes of SPEI in different seasons confirmed the results of rPC trend analysis in each sub-region. In spring, sub-region in the southern part of the plain tends to be dry, while the northern sub-region tends to be wet (Figure 7a). Only the southern part of Hebei Province and northwestern Shandong Province (Sub-region 5) show a significant wetting trend. In summer, Central Shandong Province and Northwestern Hebei Province tend to be dry, while most other areas tend to be wet. Only the Western Henan Province (Sub-region 4) show a significant wetting trend (Figure 7b). In fall, most areas in the northern and southern part of the plain tend to be wet, while the central part tends to be dry, among which the drought trend in the central part of Shandong Province (Sub-region 6) is significant (Figure 7c). In winter, most of the sub-regions show a wetting trend, but only the northwestern part of the plain (Sub-region 7) show a significant wetting trend (Figure 7d). On the whole, the variation trend of dry and wet in each season of North China plain is complex.
3.3. Correlation of Variation in Subregions
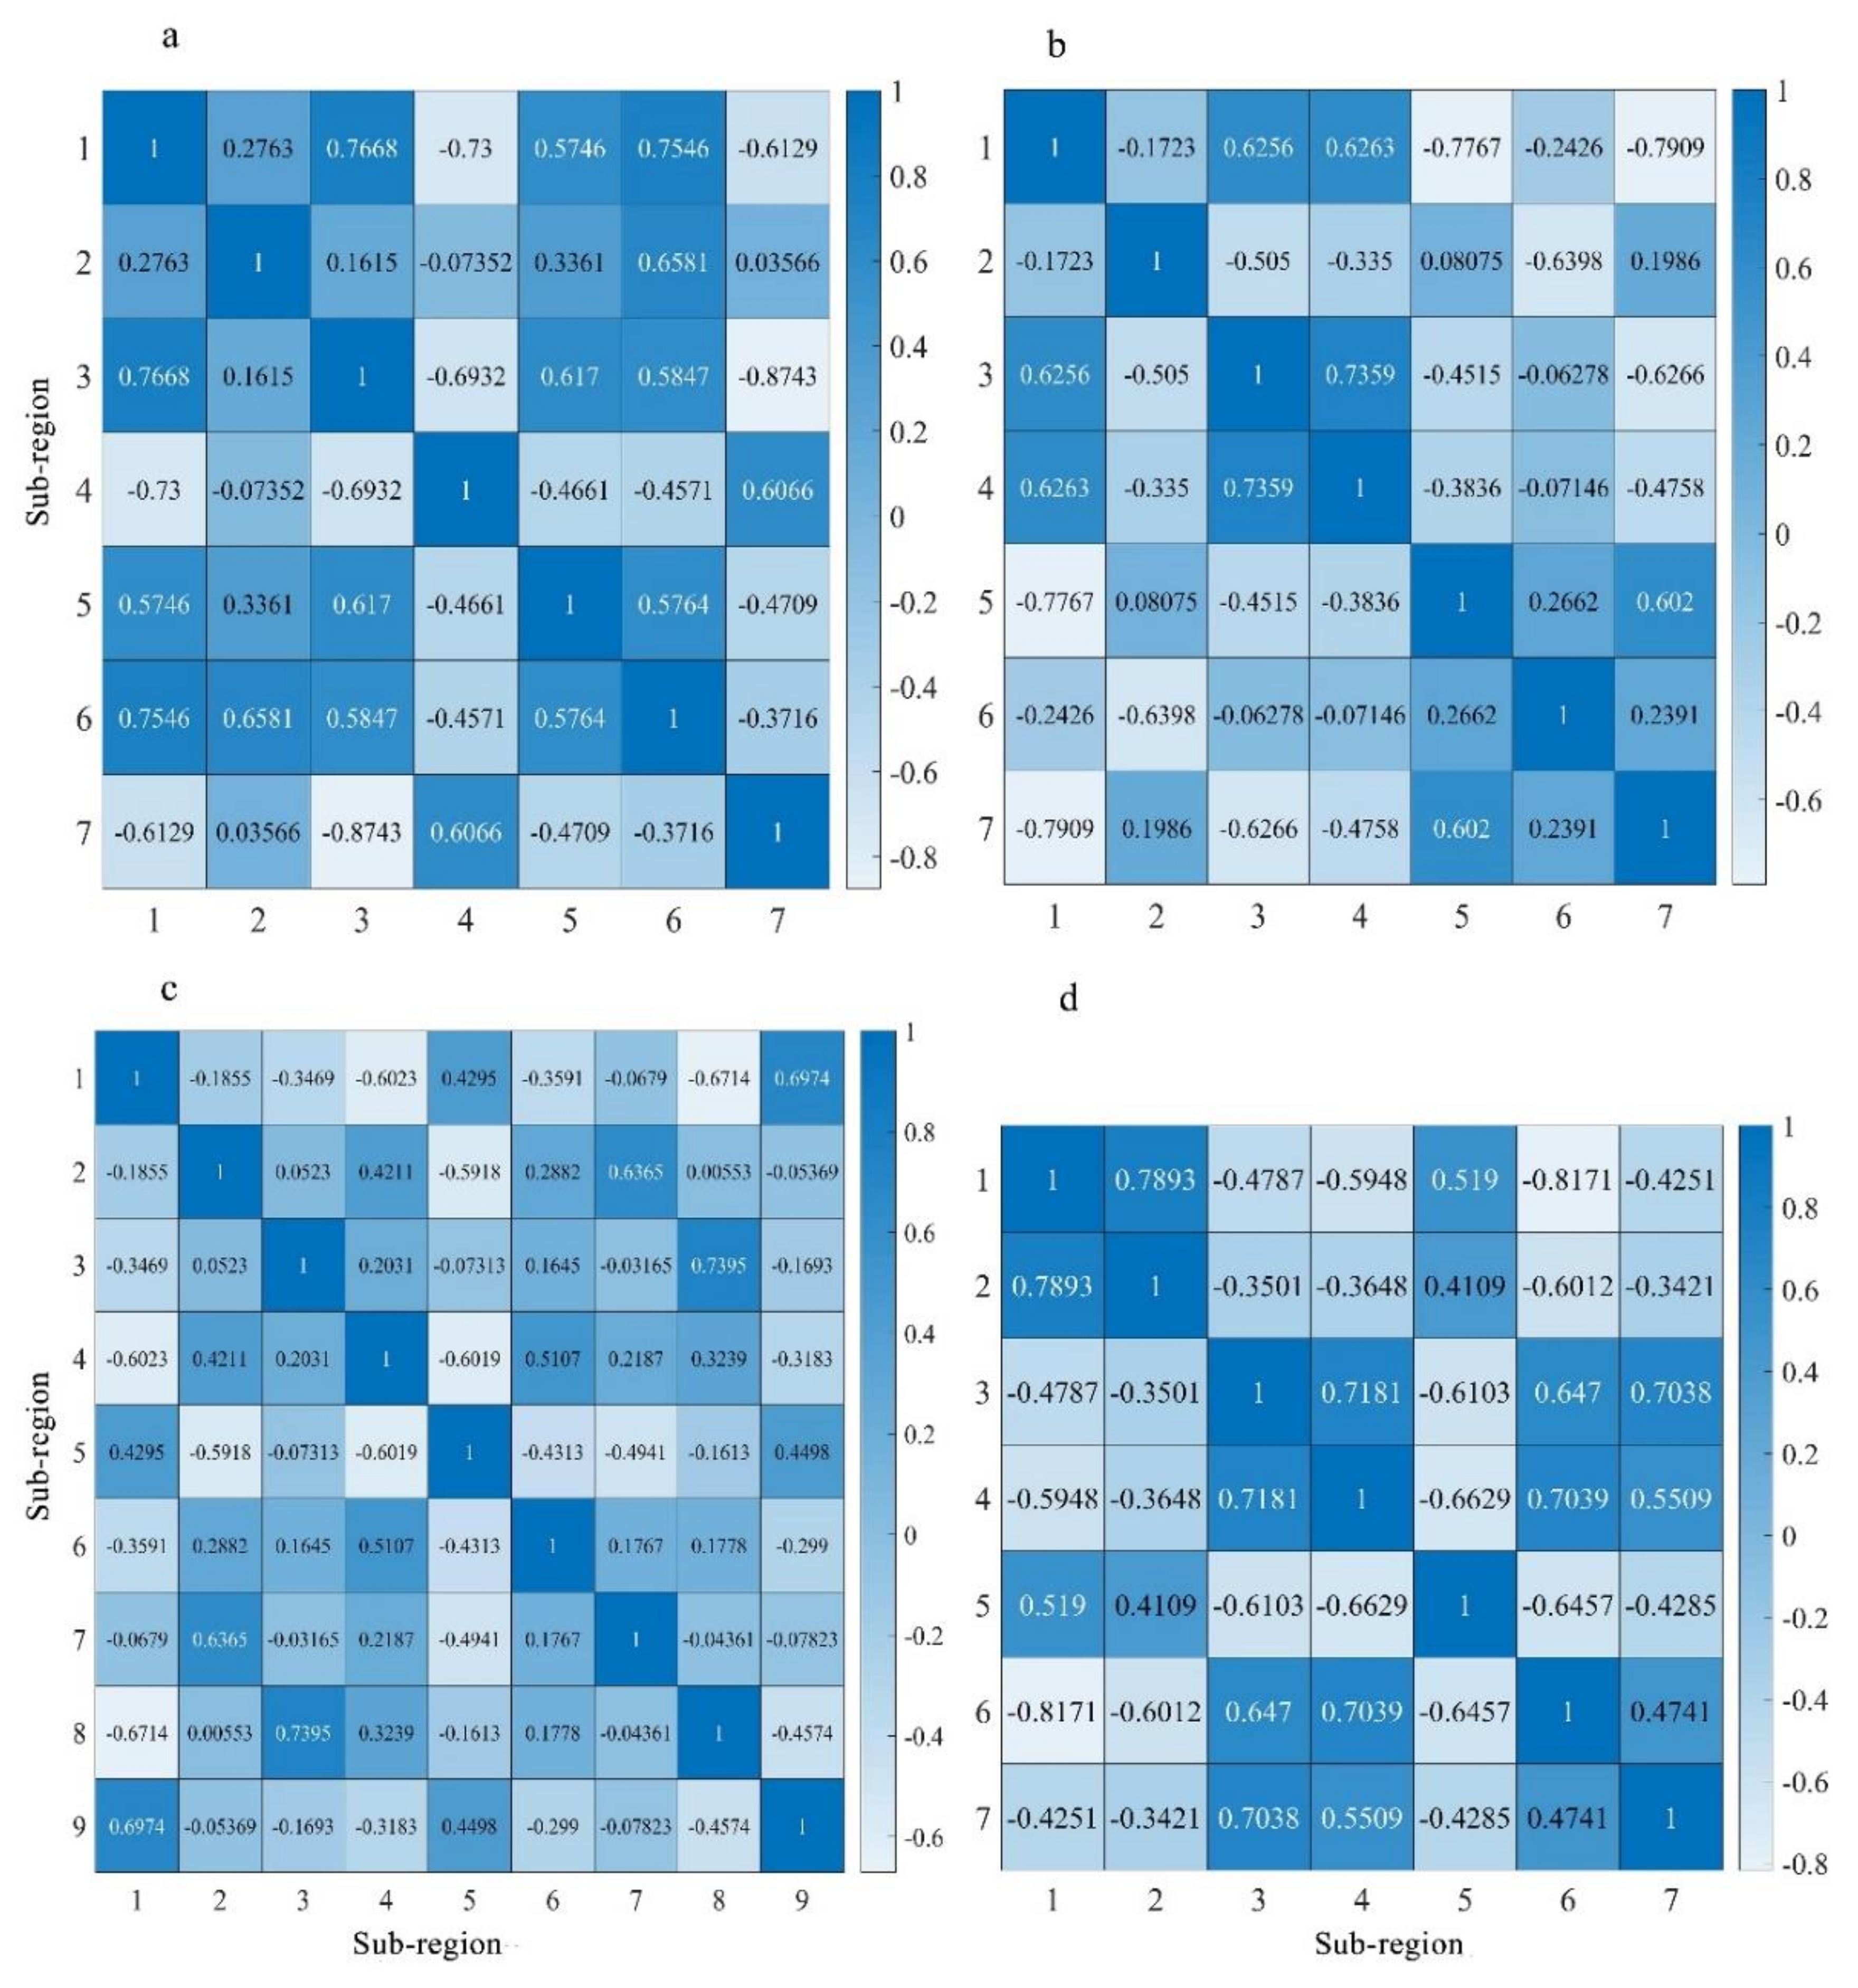
Spatially, the correlation matrix proved the significant correlation of rPC in most partitions of the North China Plain (significance level 0.05). In spring, the strongest positive correlations are sub-region 1, 3, and 6 (r > 0.75). The strongest negative correlations are sub-region 1 and 4, and sub-region 3 and 7 (r < −0.69). Sub-region 2 is irrelevant to Sub-region 4 and Sub-region 7 respectively (Figure 8a).
In summer, the strongest positive correlation is sub-region 3 and 4 (r > 0.73). The strongest negative correlations are sub-region 1, 5, and 7 (r < −0.77). Sub-region 3 and Sub-region 4 are irrelevant to Sub-region 6, respectively (Figure 8b). In autumn, the strongest positive correlation is sub-region 3 and 8 (r > 0.73). The strongest negative correlation is sub-region 1 and 8 (r < −0.67). In this season, a large number of sub-regions show no significant correlation (Figure 8c). In winter, the strongest positive correlation is sub-region 1 and 2 (r > 0.78). The strongest negative correlation is sub-region 1 and 6 (r < −0.81). No sub-region shows significant irrelevance (Figure 8d). On the whole, the strongly correlated partitions are close in space, while the weakly correlated or uncorrelated regions are far in space. This also indicates the difference in the factors that dominate the drought variability of the sub-regions. The positive correlation and negative correlation may be related to the time process of precipitation moving from south to north in the North China Plain. The strong correlation of these sub-regions indicates that the climate and weather conditions causing the drought are consistent and the drought conditions are independent to the regions that show no correlation. The drought variability of all the different monitored sub-regions suggest that a false perception of plain drought will come into being if the North China Plain is treated as a single region.
4. Discussion
SPEI has been widely used in drought monitoring. Some scholars have studied the applicability of SPEI in China and found that it is better in humid and sub-humid areas than in arid ones [50,51]. SPEI overestimated the effects of temperature changes, and the results were drier [50]. However, its advantages of multiple scales and considering potential evapotranspiration factors make it widely recognized. Although it is meaningless to extract daily SPEI separately, accumulation of daily SPEI can analyze drought events on week-scale, ten-day scale or larger time scale. During the critical period of vegetation growth, drought of week-scale may have adverse effects. Daily SPEI can monitor meteorological or hydrological droughts at all-time scales and identify different drought types [11,37,38].
The results of the study show that the drought characteristics in the North China Plain have evident seasonal differences. The rPC seasonal trend analyzed by EOF shows that the drought conditions of some sub-regions changed significantly (Figure 6) but the rPC trend of seasonal partition is not obvious in most regions. An obvious wet trend in the eastern, western, and northern parts of the North China Plain could be seen in different seasons, while in the middle of the plain an evident drought trend appears in autumn, which reflects both the temporal variability of SPEI and also its spatial variability. Although it is becoming warmer in the North China Plain [14,17], the wet and dry conditions have not been greatly changed, which highlights a fact that precipitation is likely to be the main driving factor of SPEI variability in this region. That is the same as the previous study [52,53]. The temporal variability of different seasonal sub-regions indicates that the differences of seasonal drying and wetting are widespread within one region. Based on these results, we can draw a conclusion that the seasonal rPC trend analysis explored the characteristics covered by the annual scale analysis, which has practical significance in adjusting the management strategies for agricultural water resources in different growing periods of crops. Although previous EOF studies on drought have tended to be more complete, seasonal variability study of drought shows the complexity of drought characteristics in greater details.
The strong correlation between seasonal regions proves the consistency of climatic and weather conditions that cause drought. The monitored regional drought variability suggests that the dry and wet variation characteristics of the North China Plain will not be fully understood if it is considered as a single region. One important issue we should mention is that the data from the observation stations we used and the spatial interpolation method we selected will have some influence on the range of partitions within a limited extend but without affecting the overall pattern of this study. Some studies have analyzed the drought in the North China Plain through the variation characteristics of temperature and precipitation [16,17,18,30]. The wet trend in fall in the North China Plain can be explained by the contribution of the summer monsoon [50,54] and the accumulation of precipitation. Some studies think that the wet trend in the western and northern part can be explained by the increased summer precipitation which is caused by the widespread expansion of irrigation and farmland and increasing atmospheric moisture [25,55]. Other studies suggest that changes in groundwater level may play a role in changes of precipitation patterns [19,20]. There are still some studies believe that changes in regional drought characteristics are caused by the changes in ecological protection measures, agricultural production, and irrigation methods. Some other studies think the warming that caused by the increasing global greenhouse gas did not lead to the increase of evaporation in this plain but this kind of paradox still need to be further studied. The difference of these results is related to the time and space scale of the study. Our study cannot directly explain the trends we observed, but our results are consistent with the dry and wet processes recorded in the historical references of the region. Although we did not do a more in-depth exploration in this field, it will be quite helpful for us to have a better understanding about the leading drought variability characteristics of the North China Plain presented in the observed records if we apply a monthly EOF analysis to inspect the changes of the regional patterns over time.
According to the drought variability in the North China Plain, 7–9 sub-regions are decided based on the selection rules proposed in this study. The number of this partition is more than the three ones identified by Lu et al. [56], and even close to the eight sub-regions identified by Wu et al. [57] which are sensitive to climate change all over China. Some researchers used different selection rules when selecting the number of EOFs to rotate, which may have contributed to the differences in research results. However, we have not tried any other ways other than North’s Rule to determine the number of rotating EOFs. The statistical analysis of rPCs in this study also shows that the sub-regions have different drought or wet trends, which is also the value of the partition in drought monitoring. The high correlation between rPCs and the original SPEI data in this study suggests that the optimal drought variation sub-region can be obtained by EOF analysis. For those regions with low correlation, the reason may be caused by the poor effect of the data dimension reduction of drought variability and thus the large dry and wet variability rate and unstable characteristics should be taken into account. It may also be related to the selection of spatial interpolation method. Since the drought index is usually standardized, rPCs can be interpreted as a meaningful drought index. RPCs, which are interpreted as drought indices, are really practical for monitoring droughts across sub-regions. For the identified sub-regions, the wet-dry variation signals can be identified by analyzing the rPC of high correlation, which effectively expands the decision-making basis of drought management. REOF analysis is applicable to the analysis of drought monitoring or other hydro-climatologic data at different temporal and spatial scales. This property makes it applicable to larger and smaller spatial scales in other regions to determine the variability partition of geophysical variables that vary over time. Since the nature of REOF analysis enables it to identify sub-regions of physical significance in weather structures that cause drought variability, the information of these sub-regions can provide evidence for the future drought management strategies and disaster prevention planning.
5. Conclusions
From 1960 and 2017, the drought variability in the North China Plain had different seasonal characteristics. In North China Plain, SPEI monitored the most variable drought happened in spring and summer, while these two seasons are just the most critical periods for crop growth. The frequent droughts during these periods make it hard for the water to satisfy the demand of crops growing, which would have a serious impact on agriculture. The use of REOF analysis to identify the main sub-regions in the North China Plain can be used to integrate drought monitoring information and provide a basis for drought management decisions on a local scale, especially when the difference between spatial and temporal distribution of water resources is big. The sub-regions identified by the REOF analysis are consistent with weather characteristics and can be easily explained by management decision makers. The results show that the number and spatial range of sub-regions vary with the seasonal change, reflecting the differences in atmospheric physical processes that dominate the drought variability. The seasonal trend shows significant wetting in several sub-regions, and the distribution of drought and wetting events changed in some sub-regions during the period 1960–2017. Natural variations in climate patterns and the influence of human activities have the potential to alter drought variability in the North China Plain. Decision-makers in water management agencies and drought-prevention agencies need to integrate historical climate change characteristics into their analysis to provide reliable information for scientific decision-making. The analysis shows that the change of drought in the North China Plain is not stable in the past 58 years. In general, the results of the seasonal trend analysis show that there has been no significant trend value in most areas since 1960. However, it is worth noting that some regions have the positive and negative temporal trends in different seasons. These results illustrate the importance of seasonal analysis, particularly for agro-ecosystems that depend on timely rainfall during different growing seasons. Policymakers should interpret these changes in variability as an increase or decrease in the complexity of space droughts. If the drought and wet processes have the tendency of becoming more viable both temporally and spatially, greater cooperation will be needed in order to cope with the possible disasters. The decision-makers in the North China Plain should master these variability characteristics to adapt long-term resource management strategies, which have important significance for reducing the economic and agricultural impacts of drought.
Author Contributions
Conceptualization, B.Z. and Y.C.; methodology, Y.C.; software, H.H.; validation, X.W. and W.J.; formal analysis, Y.C.; investigation, Y.C.; resources, Y.C.; data curation, J.Z.; writing—original draft preparation, Y.C.; writing—review and editing, Y.C.; visualization, R.Y.; supervision, B.Z.; funding acquisition, B.Z. All authors have read and agreed to the published version of the manuscript.
Funding
This research was funded by the National Natural Science Foundation of China, grant number 41561024.
Conflicts of Interest
The authors declare no conflict of interest.
References
- Dai, A. Drought under global warming: A review. WIREs Clim. Chang. 2011, 2, 45–65. [Google Scholar] [CrossRef] [Green Version]
- Sönmez, F.K.; Kömüscü, A.L.I.Ü.; Erkan, A.; Turgu, E. An Analysis of Spatial and Temporal Dimension of Drought Vulnerability in Turkey Using the Standardized Precipitation Index. Nat. Hazards 2005, 35, 243–264. [Google Scholar] [CrossRef]
- AghaKouchak, A.; Farahmand, A.; Melton, F.S.; Teixeira, J.; Anderson, M.C.; Wardlow, B.D.; Hain, C.R. Remote sensing of drought: Progress, challenges and opportunities. Rev. Geophys. 2015, 53, 452–480. [Google Scholar] [CrossRef] [Green Version]
- Hao, Z.; Singh, V.P. Drought characterization from a multivariate perspective: A review. J. Hydrol. 2015, 527, 668–678. [Google Scholar] [CrossRef]
- Liu, X.; Zhu, X.; Pan, Y.; Zhao, A.; Li, Y. Spatiotemporal changes of cold surges in Inner Mongolia between 1960 and 2012. J. Geogr. Sci. 2015, 25, 259–273. [Google Scholar] [CrossRef]
- Salinger, M.J.; Stigter, C.J.; Das, H.P. Agrometeorological adaptation strategies to increasing climate variability and climate change. Agric. For. Meteorol. 2000, 103, 167–184. [Google Scholar] [CrossRef]
- Wu, J.; Zhou, L.; Mo, X.; Zhou, H.; Zhang, J.; Jia, R. Drought monitoring and analysis in China based on the Integrated Surface Drought Index (ISDI). Int. J. Appl. Earth Obs. 2015, 41, 23–33. [Google Scholar] [CrossRef]
- Bonaccorso, B.; Bordi, I.; Cancellire, A.; Rossi, G.; Sutera, A. Spatial variability of drought-an analysis of the SPI in sicily. Water Resour. Manag. 2003, 17, 273–296. [Google Scholar] [CrossRef]
- Omondi, P.; Ogallo, L.A.; Anyah, R.; Muthama, J.M.; Ininda, J. Linkages between global sea surface temperatures and decadal rainfall variability over Eastern Africa region. Int. J. Climatol. 2013, 33, 2082–2104. [Google Scholar] [CrossRef]
- Piao, S.; Ciais, P.; Huang, Y.; Shen, Z.; Peng, S.; Li, J.; Zhou, L.; Liu, H.; Ma, Y.; Ding, Y.; et al. The impacts of climate change on water resources and agriculture in China. Nature 2010, 467, 43–51. [Google Scholar] [CrossRef]
- Wang, Q.; Wu, J.; Lei, T.; He, B.; Wu, Z.; Liu, M.; Mo, X.; Geng, G.; Li, X.; Zhou, H.; et al. Temporal-spatial characteristics of severe drought events and their impact on agriculture on a global scale. Quat. Int. 2014, 349, 10–21. [Google Scholar] [CrossRef]
- Shi, W.; Tao, F.; Liu, J. Regional temperature change over the Huang-Huai-Hai Plain of China: The roles of irrigation versus urbanization. Int. J. Climatol. 2014, 34, 1181–1195. [Google Scholar] [CrossRef]
- Guo, R.; Lin, Z.; Mo, X.; Yang, C. Responses of crop yield and water use efficiency to climate change in the North China Plain. Agric. Water Manag. 2010, 97, 1185–1194. [Google Scholar] [CrossRef]
- Fu, C.; Wen, G. Research on the Characteristics of Interdecadal Variability of Summer Climate in China and its Possible Cause. Clim. Environ. Res. 2002, 7, 22–29. [Google Scholar]
- Liu, X.; Pan, Y.; Zhu, X.; Yang, T.; Bai, J.; Sun, Z. Drought evolution and its impact on the crop yield in the North China Plain. J. Hydrol. 2018, 564, 984–996. [Google Scholar] [CrossRef]
- Ma, Z. The interdecadal trend and shift of dry/wet over the central part of North China and their relationship to the Pacific Decadal Oscillation (PDO). Chin. Sci. Bull. 2007, 52, 2130–2139. [Google Scholar] [CrossRef]
- Shi, Y.; Yao, X.; Yang, X.; Li, Z. Characteristic analysis of unusual summer precipitation in North China. Sci. Meteorol. Sin. 2008, 28, 377–383. [Google Scholar]
- Li, X.; Ju, H.; Liu, Q.; Li, Y.; Qin, X. Analysis of drought characters based on the SPEI-PM index in Huang-Huai-Hai Plain. Acta Ecol. Sin. 2017, 37, 2054–2066. [Google Scholar] [CrossRef] [Green Version]
- Sun, H.; Zhang, X.; Liu, X.; Liu, X.; Shao, L.; Chen, S.; Wang, J.; Dong, X. Impact of different cropping systems and irrigation schedules on evapotranspiration, grain yield and groundwater level in the North China Plain. Agric. Water Manag. 2019, 211, 202–209. [Google Scholar] [CrossRef]
- Zhao, Q.; Zhang, B.; Yao, Y.; Wu, W.; Meng, G.; Chen, Q. Geodetic and hydrological measurements reveal the recent acceleration of groundwater depletion in North China Plain. J. Hydrol. 2019, 575, 1065–1072. [Google Scholar] [CrossRef]
- Zhong, R.; Chen, X.; Lai, C.; Wang, Z.; Lian, Y.; Yu, H.; Wu, X. Drought monitoring utility of satellite-based precipitation products across mainland China. J. Hydrol. 2018, 568, 343–359. [Google Scholar] [CrossRef]
- Liu, Q.; Zhang, G.; Shahzad, A.; Wang, X.; Wang, G.; Pan, Z.; Zhang, J. SPI-based drought simulation and prediction using Arma-Garch model. Appl. Math. Comput. 2019, 355, 96–107. [Google Scholar] [CrossRef]
- Wu, J.; Zhou, L.; Liu, M.; Zhang, J.; Leng, S.; Diao, C. Establishing and assessing the Integrated Surface Drought Index (ISDI) for agricultural drought monitoring in mid-eastern China. Int. J. Appl. Earth Obs. 2013, 23, 397–410. [Google Scholar] [CrossRef]
- Yang, X.; Xie, Q.; Zhu, Y.; Sun, X.; Guo, Y. Decadal-to-interdecadal variability of precipitation in North China and associated atmospheric and oceanic anomaly patterns. Chin. J. Geophys. 2005, 48, 789–797. [Google Scholar]
- Chen, Q.; Liu, Y.; Ge, Q.; Pan, T. Impacts of historic climate variability and land use change on winter wheat climatic productivity in the North China Plain during 1980–2010. Land Use Policy 2018, 76, 1–9. [Google Scholar] [CrossRef]
- Li, P.; Ren, L. Evaluating the effects of limited irrigation on crop water productivity and reducing deep groundwater exploitation in the North China Plain using an agro-hydrological model: II. Scenario simulation and analysis. J. Hydrol. 2019, 574, 715–732. [Google Scholar] [CrossRef]
- Xiao, D.; Qi, Y.; Li, Z.; Wang, R.; Moiwo, J.P.; Liu, F. Impact of thermal time shift on wheat phenology and yield under warming climate in the Huang-Huai-Hai Plain, China. Front. Earth Sci. 2017, 11, 148–155. [Google Scholar] [CrossRef]
- Hannachi, A.; Jolliffe, I.T.; Stephenson, D.B. Empirical orthogonal functions and related techniques in atmospheric science (A review). Int. J. Climatol. 2007, 27, 1119–1152. [Google Scholar] [CrossRef]
- Richman, M.B. Rotation of principal components. J. Climatol. 1986, 6, 293–335. [Google Scholar] [CrossRef]
- Cai, W.; Zhang, Y.; Chen, Q.; Yao, Y. Spatial Patterns and Temporal Variability of Drought in Beijing-Tianjin-Hebei Metropolitan Areas in China. Adv. Meteorol. 2015, 2015, 289471. [Google Scholar] [CrossRef]
- Zambreski, Z.T.; Lin, X.; Aiken, R.M.; Kluitenberg, G.J.; Pielke, R.A.S. Identification of hydroclimate subregions for seasonal drought monitoring in the U.S. Great Plains. J. Hydrol. 2018, 567, 370–381. [Google Scholar] [CrossRef]
- Cheval, S.; Busuioc, A.; Dumitrescu, A.; Birsan, M.V. Spatiotemporal variability of meteorological drought in Romania using the standardized precipitation index (SPI). Clim. Res. 2014, 60, 235–248. [Google Scholar] [CrossRef]
- Martins, D.S.; Raziei, T.; Paulo, A.A.; Pereira, L.S. Spatial and temporal variability of precipitation and drought in Portugal. Nat. Hazards Earth Syst. Sci. 2012, 12, 1493–1501. [Google Scholar] [CrossRef] [Green Version]
- Vicente-Serrano, S.M.; Begueri’a, S.; Pez-Moreno, J.I.L. A multiscalar drought index sensitive to global warming-the standardized precipitation evapotranspiration index. J. Clim. 2010, 23, 1696–1718. [Google Scholar] [CrossRef] [Green Version]
- Jia, Y.; Zhang, B. Spatial-temporal Variability Characteristics of Extreme Drought Events Based on Daily SPEI in the Southwest China in Recent 55 Years. Sci. Geogr. Sin. 2018, 38, 474–483. [Google Scholar] [CrossRef]
- Lu, E.; Cai, W.; Jiang, Z.; Zhang, Q.; Zhang, C.; Higgins, R.W.; Halpert, M.S. The day-to-day monitoring of the 2011 severe drought in China. Clim. Dyn. 2013, 43, 1–9. [Google Scholar] [CrossRef]
- Wang, Q.; Shi, P.; Lei, T.; Geng, G.; Liu, J.; Mo, X.; Li, X.; Zhou, H.; Wu, J. The alleviating trend of drought in the Huang-Huai-Hai Plain of China based on the daily SPEI. Int. J. Climatol. 2015, 35, 3760–3769. [Google Scholar] [CrossRef]
- Ma, B.; Zhang, B.; Jia, L.; Huang, H. Conditional distribution selection for SPEI-daily and its revealed meteorological drought characteristics in China from 1961 to 2017. Atmos. Res. 2020, 246, 105108. [Google Scholar] [CrossRef]
- Hamed, K.H.; Rao, A.R. The modified Mann-Kendall trend test for autocorrelated data. J. Hydrol. 1998, 204, 182–196. [Google Scholar] [CrossRef]
- Sun, H.; Shen, Y.; Yu, Q.; Flerchinger, G.N.; Zhang, Y.; Liu, C.; Zhang, X. Effect of precipitation change on water balance and WUE of the winter wheat–summer maize rotation in the North China Plain. Agric. Water Manag. 2010, 97, 1139–1145. [Google Scholar] [CrossRef]
- Wang, X.L.; Wen, Q.H.; Wu, Y. Penalized maximal t test for detecting undocumented mean change in climate data series. J. Appl. Meteorol. Climatol. 2007, 46, 916–931. [Google Scholar] [CrossRef]
- Allen, R.G.; Pereira, L.S.; Raes, D.; Smith, M. Crop Evapotranspiration: Guidelines for Computing Crop Water Requirements; FAO Irrigation and Drainage Paper No. 56; FAO: Rome, Italy, 1998; pp. 1–15. [Google Scholar]
- Ahmad, M.I.; Sinclair, C.D.; Werritty, A. Log-logistic flood frequency analysis. J. Hydrol. 1988, 98, 205–224. [Google Scholar] [CrossRef]
- Singh, V.P.; Guo, H.; Yu, F.X. Parameter estimation for 3-parameter log-logistic distribution (LLD3) by Pome. Stoch. Hydrol. Hydraul. 1993, 7, 163–177. [Google Scholar] [CrossRef]
- Hosking, J.R.M. The Theory of Probability Weighted Moments; RC12210; IBM Research Division: Yorktown Heights, NY, USA, 1986. [Google Scholar]
- Beguería, S.; Vicente-Serrano, S.M.; Reig, F.; Latorre, B. Standardized precipitation evapotranspiration index (SPEI) revisited: Parameter fitting, evapotranspiration models, tools, datasets and drought monitoring. Int. J. Climatol. 2014, 34, 3001–3023. [Google Scholar] [CrossRef] [Green Version]
- Wen, K.; Ding, Y. China Disaster Canon-Comprehensive; China Meteorological Press: Beijing, China, 2008; pp. 157–229. [Google Scholar]
- North, G.R.; Bell, T.L.; Cahalan, R.F.; Moeng, F.J. Sampling errors in the estimation of empirical orthogonal functions. Mon. Weather Rev. 1982, 110, 699–706. [Google Scholar] [CrossRef]
- Daly, C. Guidelines for assessing the suitability of spatial climate data sets. Int. J. Climatol. 2006, 26, 707–721. [Google Scholar] [CrossRef]
- Yang, Q.; Li, M.; Zheng, Z.; Ma, Z. Regional applicability of seven meteorological drought indices in China. Sci. China Earth Sci. 2017, 60, 745–760. [Google Scholar] [CrossRef]
- Wang, L.; Chen, W. Applicability Analysis of Standardized Precipitation Evapotranspiration Index in Drought Monitoring in China. Plateau Meteorol. 2014, 33, 423–431. [Google Scholar]
- Chen, L.; Duan, J.; Ma, Z. Objective analysis on large-scale circulation type and its links to precipitation over China. Adv. Earth Sci. 2018, 33, 396–403. [Google Scholar] [CrossRef]
- Huang, H.; Cao, M.; Song, J.; Han, Y.; Chen, S. Temporal and spatial changes of potential evapotranspiration and its influencing factors in China from 1957 to 2012. J. Nat. Resour. 2015, 30, 315–326. [Google Scholar] [CrossRef]
- Jiang, D.; Wang, H. Natural interdecadal weakening of East Asian summer monsoon in the late 20th century. Chin. Sci. Bull. 2005, 50, 2256–2262. [Google Scholar] [CrossRef]
- Rashid, M.A.; Jabloun, M.; Andersen, M.N.; Zhang, X.; Olesen, J.E. Climate change is expected to increase yield and water use efficiency of wheat in the North China Plain. Agric. Water Manag. 2019, 222, 193–203. [Google Scholar] [CrossRef]
- Lu, H.; Mo, X.; Hu, S. Spatiotemporal variation characteristics of meteorological droughts in North China Plain during 1960–2009. J. Nat. Disaster 2012, 21, 72–82. [Google Scholar] [CrossRef]
- Wu, S.; Pan, T.; Liu, Y.; Deng, H.; Jiao, K.; Lu, Q.; Feng, A.; Yue, X.; Yin, Y.; Zhao, D.; et al. Comprehensive climate change risk regionalization of China. Acta Geogr. Sin. 2017, 72, 3–17. [Google Scholar] [CrossRef]
Figure 1.
Study area of the North China Plain region with red dots that illustrate meteorological station.
Figure 1.
Study area of the North China Plain region with red dots that illustrate meteorological station.

Figure 2.
Sub-regions recognized in the North China Plain for spring drought variability (a) and the standardized rotated principal component (rPC) time series for sub-regions in spring (b). Each sub-region in (a) has a number that corresponds to its rPC time series in (b), respectively. Sub-region boundaries are thick black lines. The color bar on (a) represents the correlation coefficient between the time series of rPC and the original drought data set of each meteorological station (interpolation using inverse distance weighted method). The color bar on the right represents the magnitude and sign of each rPC time series from 1960 to 2017. Negative and positive rPC values indicate dry and wet conditions, respectively. Time series of rPC are 9-year running average filtered.

Figure 3.
Sub-regions recognized in the North China Plain for summer drought variability (a) and the standardized rotated principal component (rPC) time series for sub-regions in summer (b). Each sub-region in (a) has a number that corresponds to its rPC time series in (b), respectively.
Figure 3.
Sub-regions recognized in the North China Plain for summer drought variability (a) and the standardized rotated principal component (rPC) time series for sub-regions in summer (b). Each sub-region in (a) has a number that corresponds to its rPC time series in (b), respectively.

Figure 4.
Sub-regions recognized in the North China Plain for fall drought variability (a) and the standardized rotated principal component (rPC) time series for sub-regions in fall (b). Each sub-region in (a) has a number that corresponds to its rPC time series in (b), respectively.
Figure 4.
Sub-regions recognized in the North China Plain for fall drought variability (a) and the standardized rotated principal component (rPC) time series for sub-regions in fall (b). Each sub-region in (a) has a number that corresponds to its rPC time series in (b), respectively.

Figure 5.
Sub-regions recognized in the North China Plain for winter drought variability (a) and the standardized rotated principal component (rPC) time series for sub-regions in winter (b). Each sub-region in (a) has a number that corresponds to its rPC time series in (b), respectively.
Figure 5.
Sub-regions recognized in the North China Plain for winter drought variability (a) and the standardized rotated principal component (rPC) time series for sub-regions in winter (b). Each sub-region in (a) has a number that corresponds to its rPC time series in (b), respectively.

Figure 6.
Sub-regions show significant trends in seasonal analysis. The symbol (a–d) stands for sub-region 5 of spring, sub-region 4 of summer, sub-region 6 of fall, and sub-region 7 of winter, respectively. Uf is a sequence of statistics calculated in chronological sequence. Ub is a sequence of statistics calculated in reverse chronological sequence. If the value of Uf or Ub is greater than 0, it indicates an upward trend while is shows a downward trend when the value is less than 0. When they pass a critical line, it indicates a significant upward or downward trend.

Figure 7.
Trends for Standardized Precipitation Evapotranspiration Index (SPEI) between 1960 and 2017 for (a) (spring), (b) (summer), (c) (fall), and (d) (winter). Only sub-regions with statistically significant trends using the modified Mann–Kendall test (significance level 0.05) are indicated in the sub-region code. The trend is interpolated by inverse distance weighting.

Figure 8.
The correlation coefficients between sub-region rPC time series. The symbol (a–d) stands for spring, summer, fall, and winter, respectively.
Figure 8.
The correlation coefficients between sub-region rPC time series. The symbol (a–d) stands for spring, summer, fall, and winter, respectively.

Publisher’s Note: MDPI stays neutral with regard to jurisdictional claims in published maps and institutional affiliations. |
© 2020 by the authors. Licensee MDPI, Basel, Switzerland. This article is an open access article distributed under the terms and conditions of the Creative Commons Attribution (CC BY) license (http://creativecommons.org/licenses/by/4.0/).
Share and Cite
MDPI and ACS Style
Cui, Y.; Zhang, B.; Huang, H.; Wang, X.; Zeng, J.; Jiao, W.; Yao, R. Identification of Seasonal Sub-Regions of the Drought in the North China Plain. Water 2020, 12, 3447. https://doi.org/10.3390/w12123447
AMA Style
Cui Y, Zhang B, Huang H, Wang X, Zeng J, Jiao W, Yao R. Identification of Seasonal Sub-Regions of the Drought in the North China Plain. Water. 2020; 12(12):3447. https://doi.org/10.3390/w12123447
Chicago/Turabian StyleCui, Yanqiang, Bo Zhang, Hao Huang, Xiaodan Wang, Jianjun Zeng, Wenhui Jiao, and Rongpeng Yao. 2020. "Identification of Seasonal Sub-Regions of the Drought in the North China Plain" Water 12, no. 12: 3447. https://doi.org/10.3390/w12123447
Note that from the first issue of 2016, this journal uses article numbers instead of page numbers. See further details here.