Perforated Baffles for the Optimization of Disinfection Treatment


Faculty of Engineering and Architecture, University of Enna “Kore”, Cittadella Universitaria, 94100 Enna, Italy
*
Author to whom correspondence should be addressed.
Water 2020, 12(12), 3462; https://doi.org/10.3390/w12123462
Submission received: 20 November 2020
/
Revised: 30 November 2020
/
Accepted: 7 December 2020
/
Published: 9 December 2020
(This article belongs to the Special Issue Advanced Optimization of Wastewater Treatment Processes)
Abstract
:Water disinfection is one of the main treatments aimed at maintaining human health. Traditionally, the treatment takes place inside multichamber tanks that facilitate the contact between disinfectant and pathogenic microorganisms to be removed. However, the traditional contact tanks used for disinfection have geometric characteristics causing the formation of dead or recirculation zones that reduce treatment efficiency with potentially harmful effects on human health. This study proposes the creation of holes in the baffles that divide the various chambers in order to increase the mixing inside the reactor. In particular, various configurations with holes of different sizes were considered. The results obtained through fluid dynamics simulations based on the LES (large eddy simulation) model show that the jet emerging from the holes penetrates the recirculation zones, transforming them into areas of active mixing. The analysis of the hydraulic mixing indices traditionally used to evaluate the performance of these tanks shows that the presence of the holes allows a significant increase in the mixing efficiency by reducing the short-circuit phenomena and the entrapment of the disinfectant inside the dead zones. Parameters of fundamental importance are the size of the holes, the arrangement of the holes within the baffles and the perforation percentage.
1. Introduction
Disinfection represents the last unit to which the water is subjected inside a treatment plant before spilling into the receiving water bodies or entering the distribution network. The purpose of this unit is to remove the pathogenic microorganisms naturally present in the water, reducing the risks to ecosystem and human health. Traditional disinfection treatments make use of chemical reagents such as chlorine or ozone that are added to the water inside multichamber contact tanks. In these tanks, the chambers are separated by parallel baffles that force the flow to follow a serpentine path with 180° flow inversions in order to increase the contact time of the disinfectant with the bacteria to be killed [1].
Due to the rectangular geometric configuration, traditional contact tanks have numerous angles in which the flow velocity decreases or even vanishes (dead zones) and areas in which stable recirculation phenomena occur [2]. The presence of these low speed zones also involves short-circuit phenomena as the flow follows a preferential path at high velocity that extends near the walls of the chambers. These phenomena modify the flow from the ideal plug-flow condition, resulting in considerable variations in the real hydraulic residence time compared to the theoretical one, with important consequences on disinfection efficiency [3]. The presence of short circuits causes, in fact, a reduction in contact time and therefore a poor disinfection, while the dead and recirculation zones trap the disinfectant inside them, increasing the contact time with the possible development of unwanted by-products dangerous for human health. In addition to health problems, the reduction in disinfection efficiency determines a greater consumption of disinfectant and energy, with the increase of the plant’s operating costs.
Numerous literature studies propose new designs for disinfection systems with the purpose of optimizing the hydrodynamics inside the contact tank in order to reduce the consumption of energy and chemical reagents and to increase the overall efficiency of disinfection treatment. These studies propose to improve the disinfection efficiency by reducing the distance between the baffles [2,4,5,6], modifying the configuration of the inlet [1,3,4,7], inserting rounded corners and placing turning vanes near the corners of the chamber [1], adding horizontal baffles to vertical ones or creating slots [8,9,10,11] and holes [12,13] in the baffles.
All these technical and constructive devices are designed to bring the flow closer to the ideal plug-flow condition in which longitudinal dispersion is almost zero, and a uniform distribution of the tracer in each cross-section is verified, thus ensuring an optimal hydraulic and sanitary performance [14,15]. Furthermore, in the ideal plug-flow configuration the hydraulic residence time (HRT) is uniform and equal to the theoretical average one chosen during the design phase, to ensure adequate disinfection efficiency and to reduce the required chemical dosage and energy consumption [8]. The efficiency of a contact tank can be evaluated through the analysis of the hydraulic efficiency indicators (HEI) obtained from the residence time distribution (RTD) plots in tracer studies [13]. Numerous literature studies, in fact, have shown that HEI analysis gives important information regarding the hydraulic and sanitary performance of disinfection tanks [16,17]. Moreover, considering the flow of a tracer inside the tanks, it is possible to evaluate the hydrodynamic efficiency of all the units of a water treatment plant and consequently the efficiency of the sanitary treatment that takes place inside them [18,19,20]. The baffling factor t10/τ can be used for the global assessment of the hydraulic efficiency of contact tanks, where t10 is the time necessary for the passage through the outlet section of the tank of 10% of the tracer mass injected and τ is the theoretical mean residence time based on the assumption of plug-flow conditions. The Morrill index (Mo = t90/t10) and the dispersion index (σ) may be used to evaluate the mixing performance of a contact system, where t90 is the time necessary for the passage of 90% of the mass of the tracer injected, while σ is the dispersion index of RTD curve [7].
Thanks to the technological developments of recent years, today it is possible to analyze mixing efficiency of contact tanks more precisely using computational fluid dynamics (CFD) methods [21]. Different turbulence models have been used in the various literature studies to perform tracer and flow simulations inside the contact tanks. These studies were mainly focused on the accuracy and on the capability of the numerical experiments to simulate the turbulent phenomena occurring inside the tank and to capture the mixing of the disinfectant with the flow. Many studies have compared the numerical results with the experimental ones in order to evaluate the accuracy of the numerical model used, highlighting that turbulence models employed in numerical simulations have significant effects on the results obtained [22,23,24]. In particular, Reynolds averaged Navier–Stokes (RANS) based turbulence models such as k-ε, k-ω and low Reynolds number models have been shown to be able to accurately predict the mean flow through the multichamber [6,25]. Recent technological advances lead to a preference for more accurate large eddy simulation (LES) based models, which require higher computational costs due to the need for a finer mesh. Despite this, it is preferred to use the LES models since, unlike the RANS models, they are able to better simulate the time-varying turbulent eddies in the vicinity of the baffle corners [26,27,28]. Recent studies have postulated that these time-varying turbulent eddies affect the mixing of the disinfectant with the flow, therefore, LES models are preferred in mixing studies since RANS based turbulence models only consider time-averaged values of the flow [2,10,22]. For all these reasons, in the present study it was decided to perform fluid dynamics simulations based on the LES turbulence model, in order to study the hydrodynamic behavior of reactors with perforated baffles characterized by a different number of holes, percentage of perforation and arrangement of the holes in the baffles.
2. Numerical Model
Efficiency of the contact tank is evaluated by means of tracer simulations for a conservative tracer. A second-order accurate numerical model in the open source CFD code OpenFOAM (CFD Direct Ltd., Reading, UK) is used in numerical simulations conducted in this study. Numerical simulations of the turbulent flow inside the contact tank is performed employing the LES turbulence model previously validated by the authors.
2.1. Computational Domain
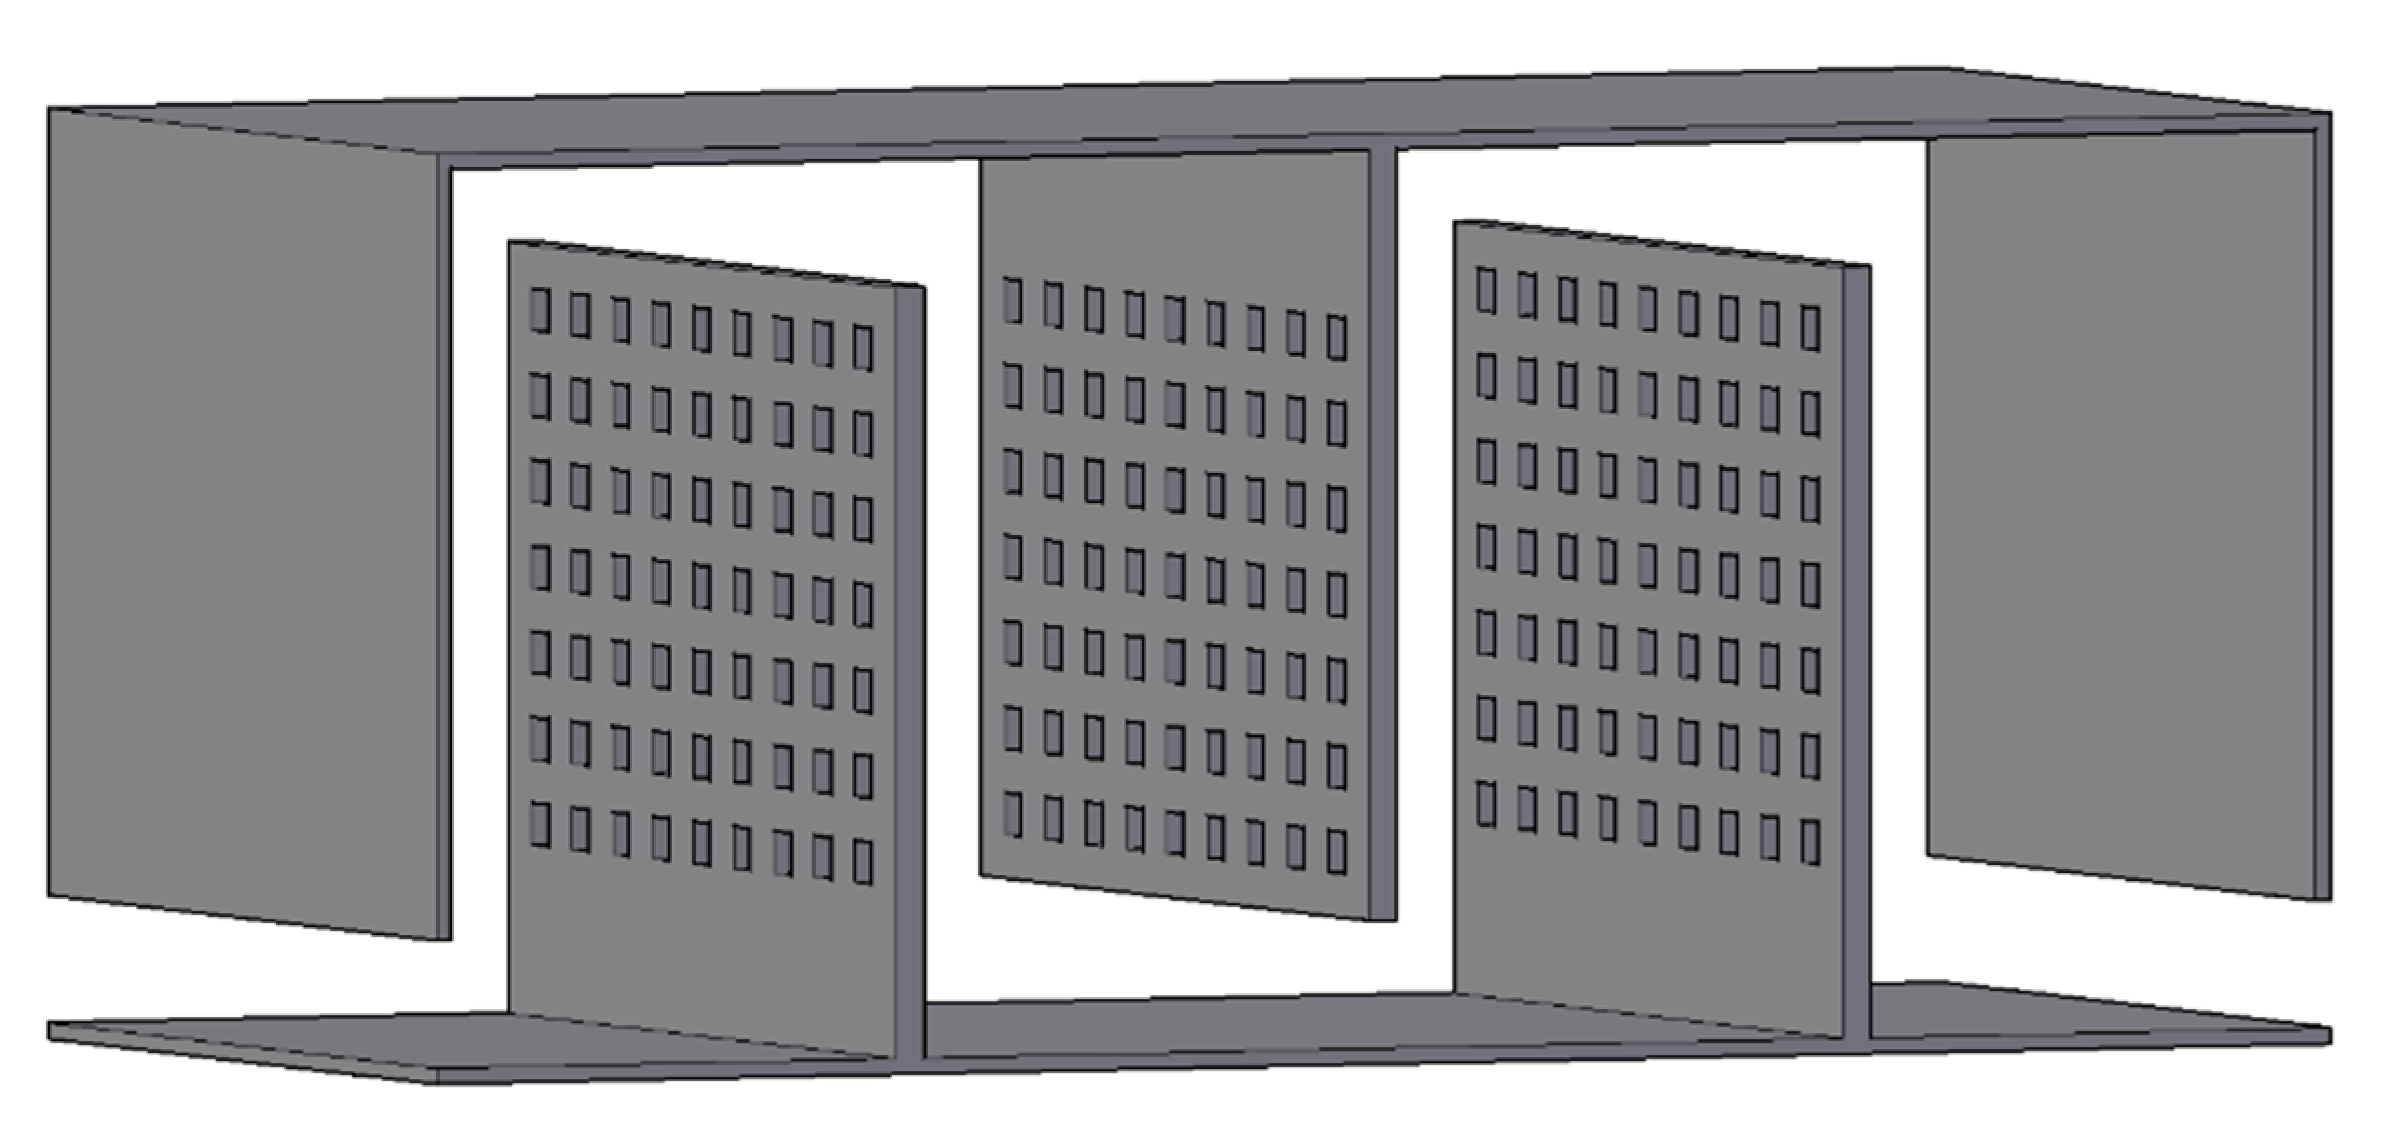
Figure 1 shows the reactor model used to perform simulations. The reactor has the same geometric characteristics as the one studied by Kim et al. [26] with the only difference that the baffles are not solid but perforated. Water enters the tank from the inlet on the left with a constant discharge Q = 0.2 L/s and emerges from the outlet on the right to maintain an approximately constant water level inside the tank.
In order to reduce the computational time, numerical simulations were performed on a truncated version of the physical domain studied by Kim et al. [26]. In the truncated reactor, the number of chambers is reduced from 12 to 4 while maintaining the same chamber width equal to 0.113 m. In this way, the reactor has an overall longitudinal length of 0.48 m and a width of 0.23 m. The deflectors have a height of 0.18 m while the water reaches a height of 0.21 m inside the reactor. Periodic boundary conditions are used in the streamwise direction for velocity to simulate an infinitely long domain: in this way, velocities at the outlet are copied to the inlet after each time step. Theses boundary conditions make the results independent on the inlet turbulence intensity avoiding unwanted flow disturbances that occur when different boundary conditions are applied to the inlet and outlet [26].
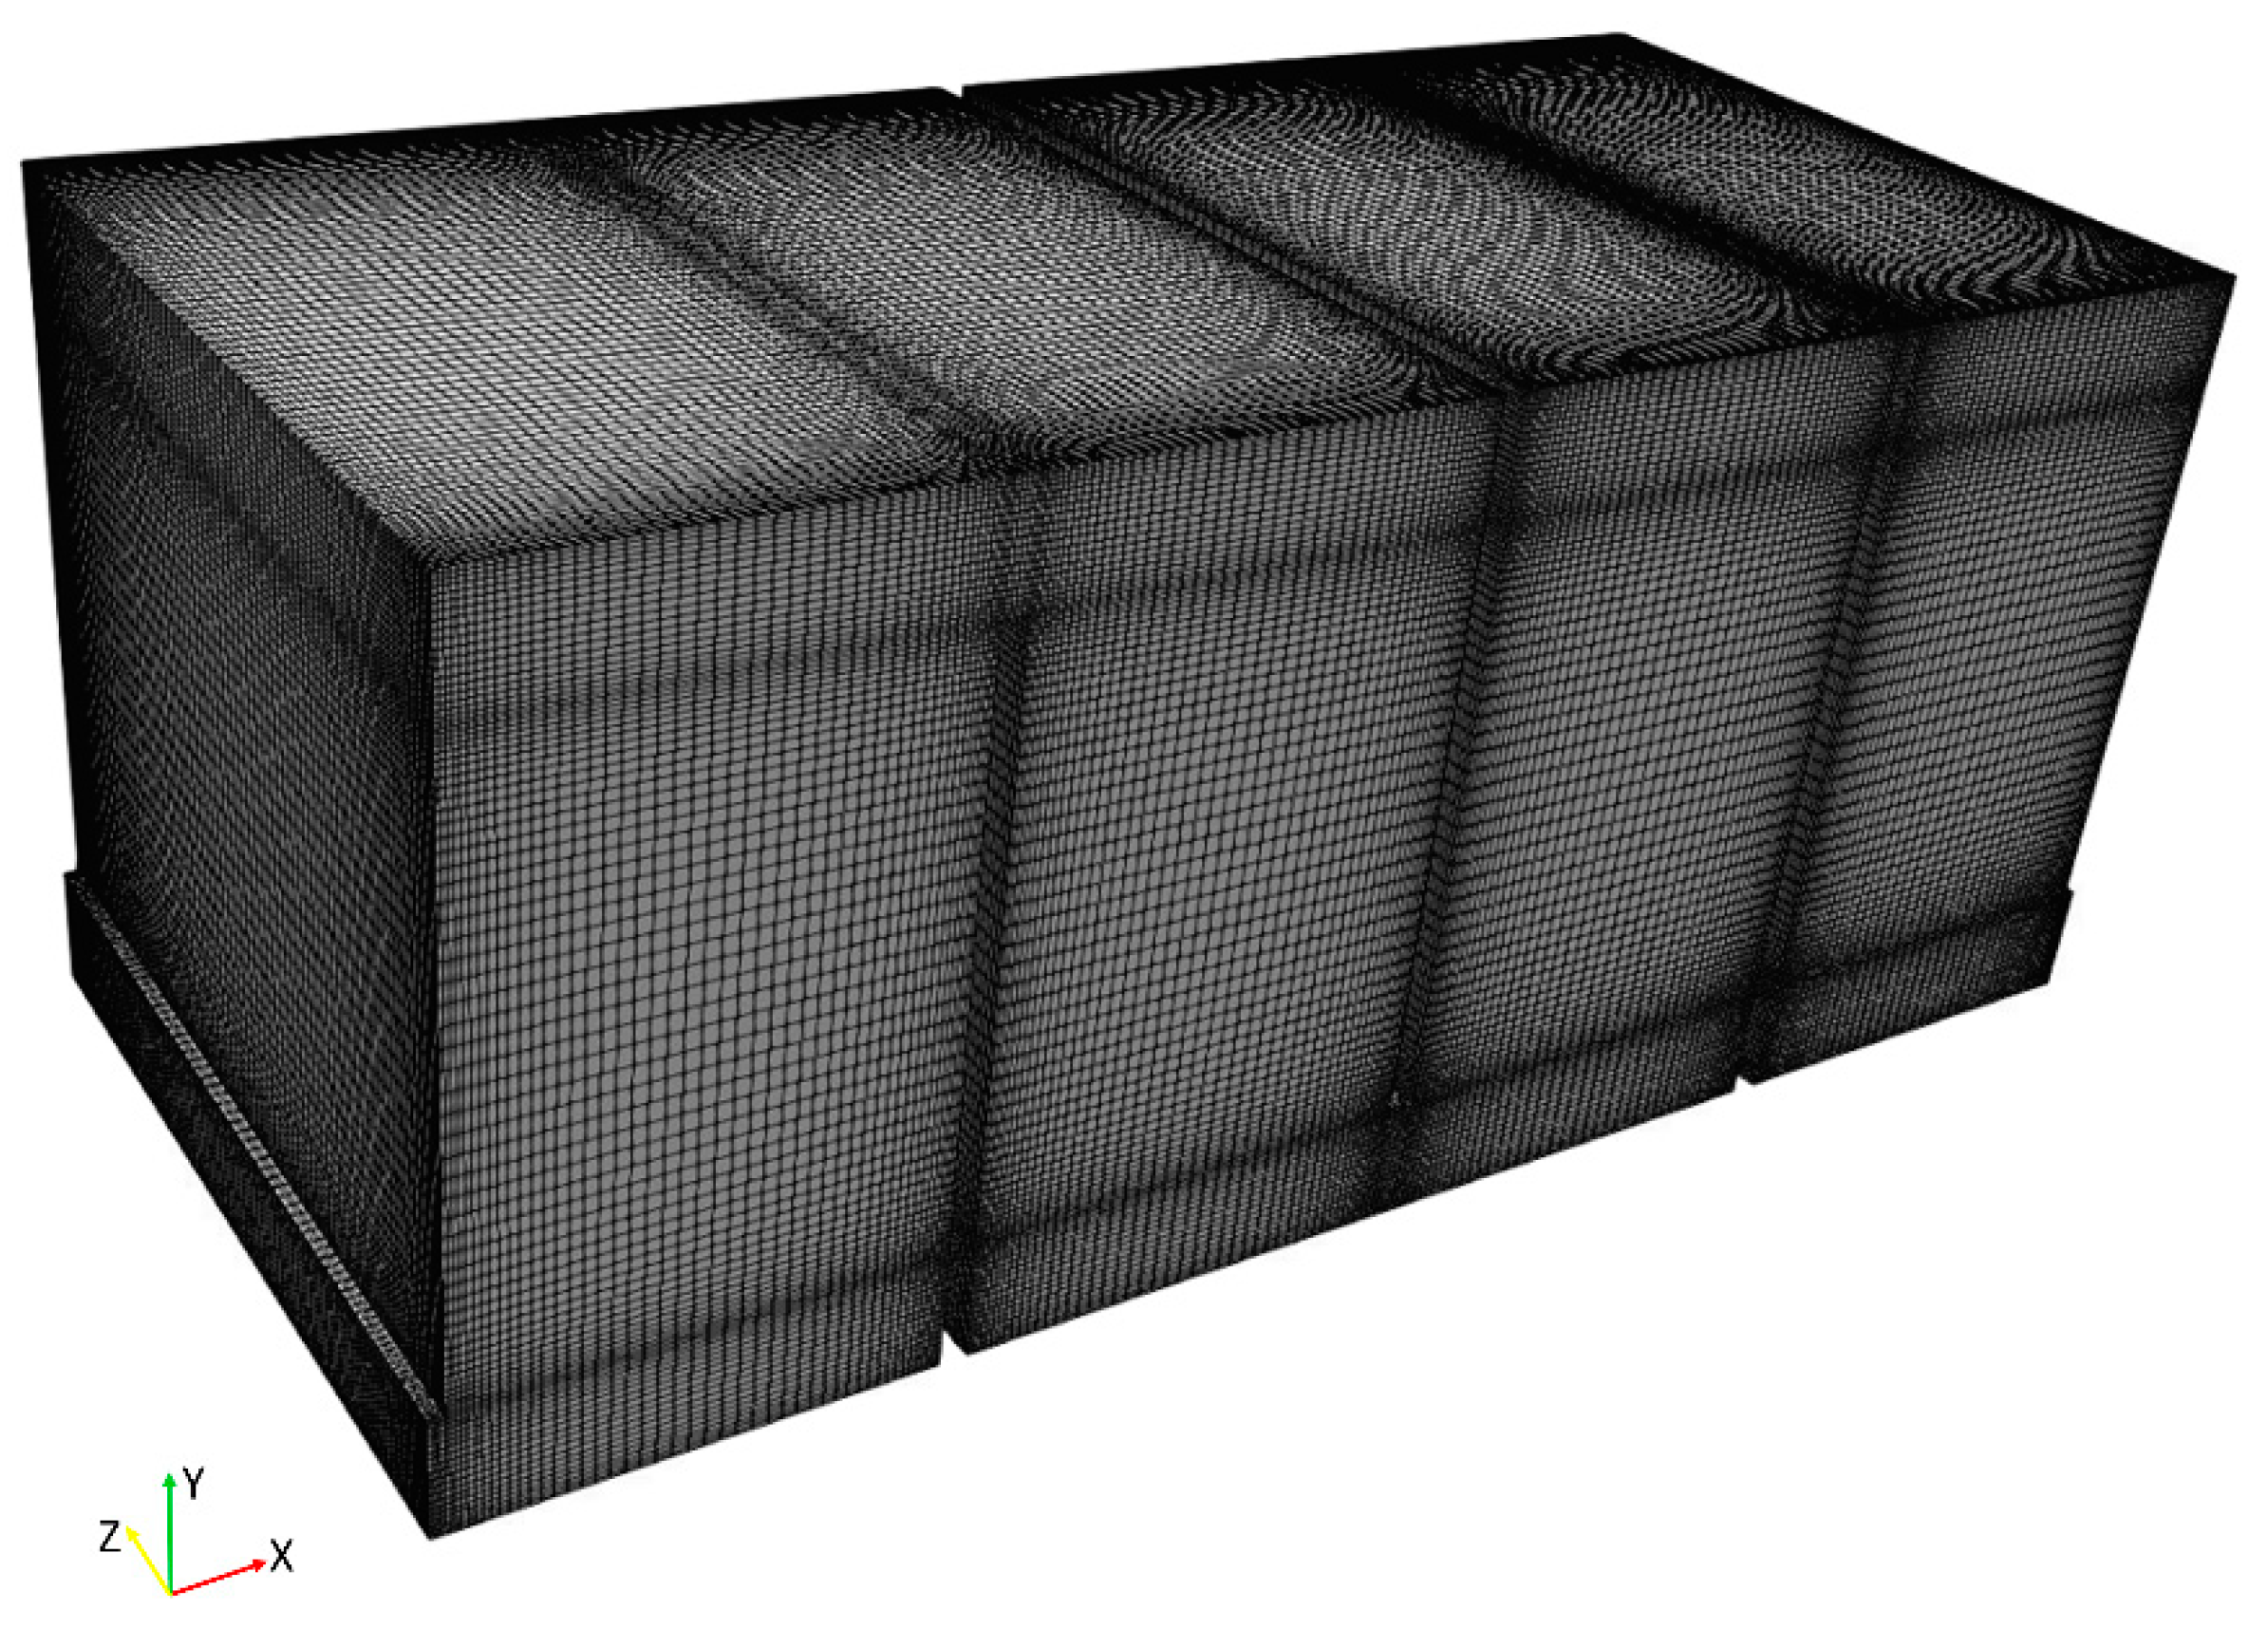
In order to simulate flow through the multichamber reactor, a three-dimensional computational mesh has been generated. Due to the specific geometry of the chambers, a Cartesian grid is used (Figure 2). The computational domain is decomposed using 210 × 90 × 90 cells in the streamwise, spanwise and wall-normal directions respectively, for a total of 1,701,000 cells, with a greater refinement close to the bottom and baffle walls in order to resolve steep velocity gradients. The cell resolution near the solid walls has been chosen following a sensitivity analysis and is fine enough to capture boundary layer effects.
2.2. Mathematical Formulation
A LES model is used to simulate the flow and transport of the passive scalar in order to predict the mixing of the tracer with the fluid inside the computational domain due to turbulence. The mass, momentum, and transport equations for the incompressible fluid are in the conservative form here reported:
where ui and xi are velocity and position in the i-th direction, t is time, ρ is fluid density, p is pressure, ν is the kinematic viscosity, fi represents the body force per unit of mass in the i-th direction, is the velocity component along the j-direction (x, y and z), xj represents the Cartesian coordinate, is the filtered concentration, D is molecular diffusivity, negligible compared to turbulent diffusivity Dt. The turbulent diffusivity can be computed as Dt = μt/Sc, where μt is eddy viscosity calculated in (4) while Sc is the turbulent Schmidt number which is set to 1000 in order to maintain the same ratio between the water molecular viscosity and the tracer mass diffusivity used in the experiments by Kim et al. [26,29].
The governing equations are resolved using the transient solver pimpleFoam available for incompressible and turbulent flow of Newtonian fluids. This solver is a combination of PISO (pressure-implicit split operator) and SIMPLE (semi-implicit method for pressure-linked equations) solvers and is composed of an implicit momentum predictor and several pressure-velocity correctors. In the PIMPLE (pressure-implicit method for pressure-linked equations) loop, the velocity equations are firstly solved by using the velocity and pressure fields of the previous time step, known as momentum predictor. The velocity and pressure are corrected several times afterwards to satisfy mass conservation. Different LES subgrid models are available for incompressible flows. In this case, wall-adapting local eddy-viscosity (WALE) model was used, where the eddy viscosity is modeled by:
where μt is the subgrid-scale turbulent viscosity, Ls is the mixing length for subgrid scales, is the rate-of-strain tensor for the resolved scale defined by:
In the WALE model Ls and are respectively defined as:
where k is the von Kármán constant, d is the distance to the closest wall, Cw is the WALE constant equal to 0.325 and V is the volume of the computational cell.
with
Residence time distribution (RTD) and cumulative RTD (CRTD) curves are used to determine the hydraulic and mixing efficiency of the tank. In the conservative tracer analysis, a non-reactive tracer is injected at the inlet for a time selected to be less than 5% of the mean residence time (MRT) calculated in (9) and the temporal variation of the concentration is observed at the outlet [30].
where ∀ is the volume of the tank and Q is the flow rate. The tracer and cumulative concentrations are nondimensionalized through the following equations:
where Cinit is the injected tracer concentration (Cinit = 1), Trelease is the injection period, θ = t/τ is the dimensionless time and τ is the MRT [13].
2.3. Boundary Conditions
As regards the passive scalar tracer, a uniform concentration is injected into the tank for 2.5 s applying a fixedValue boundary condition, in such a way that the tracer enters uniformly from the entire inlet cross section. The zeroGradient boundary condition is used at the outlet and walls indicating zero diffusive flux across these boundaries and symmetry boundary condition is imposed on the upper face of the domain since free-surface effects are negligible.
Numerical simulations are conducted using OpenFOAM code, which solves the governing equations through the finite volume method. For the temporal discretization of the governing equations, the second-order backward scheme is used. A 0.005 s time step is set to maintain the Courant–Friedrich–Levy (CFL) number below 0.5. As regards the space, linearUpwind and Gauss linear schemes are used for the treatment of the convective and diffusive terms respectively, so that the overall accuracy of the numerical method is second order.
The boundary conditions applied on the walls to characterize the physics of the problem are no-slip condition for the velocity, zero Gradient for the pressure, kqRWallFunction for the turbulence kinetic energy, nutkWallFunction for the turbulence viscosity, and nutUSpaldingWallFunction for the nuSGS. As mentioned, periodic boundary conditions were used at the inlet and outlet to reduce the computational time. A symmetry boundary condition is finally imposed on the upper face of the domain since free-surface effects are negligible [2,25].
Initially, the flow inside the reactor was simulated without the tracer for a time of 300 s in order to allow the flow field stabilization excluding the wake fluctuations generally observed during the initial phases of a simulation [8]. Once the flow field is established, the tracer is released inside the tank for a period of 2.5 s and the simulation is run for an additional 330 s to ensure that almost all the injected tracer passes through the outlet.
3. Results and Discussion
Recent studies suggest that the presence of slots or holes in the baffles improves the overall efficiency of the contact tank as it reduces short circuits increasing fluid-fluid contact mixing in both the recirculation and jet zones of the chambers [10,24]. In particular, the fundamental work of Kizilaslan et al. [13] presents a geometry characterized by perforated baffles with an increasing percentage of perforation in the flow direction and with a perforation that in some sections reaches values close to 95%. When the flow exits from the hole, it hits the recirculation zone and increases the mixing, avoiding the excessive permanence of the disinfectant trapped in the recirculation and dead zones. In order to better understand this issue, in the present research square holes with increasing hole side and increasing perforation percentage are investigated.
3.1. Perforated Baffles Geometry
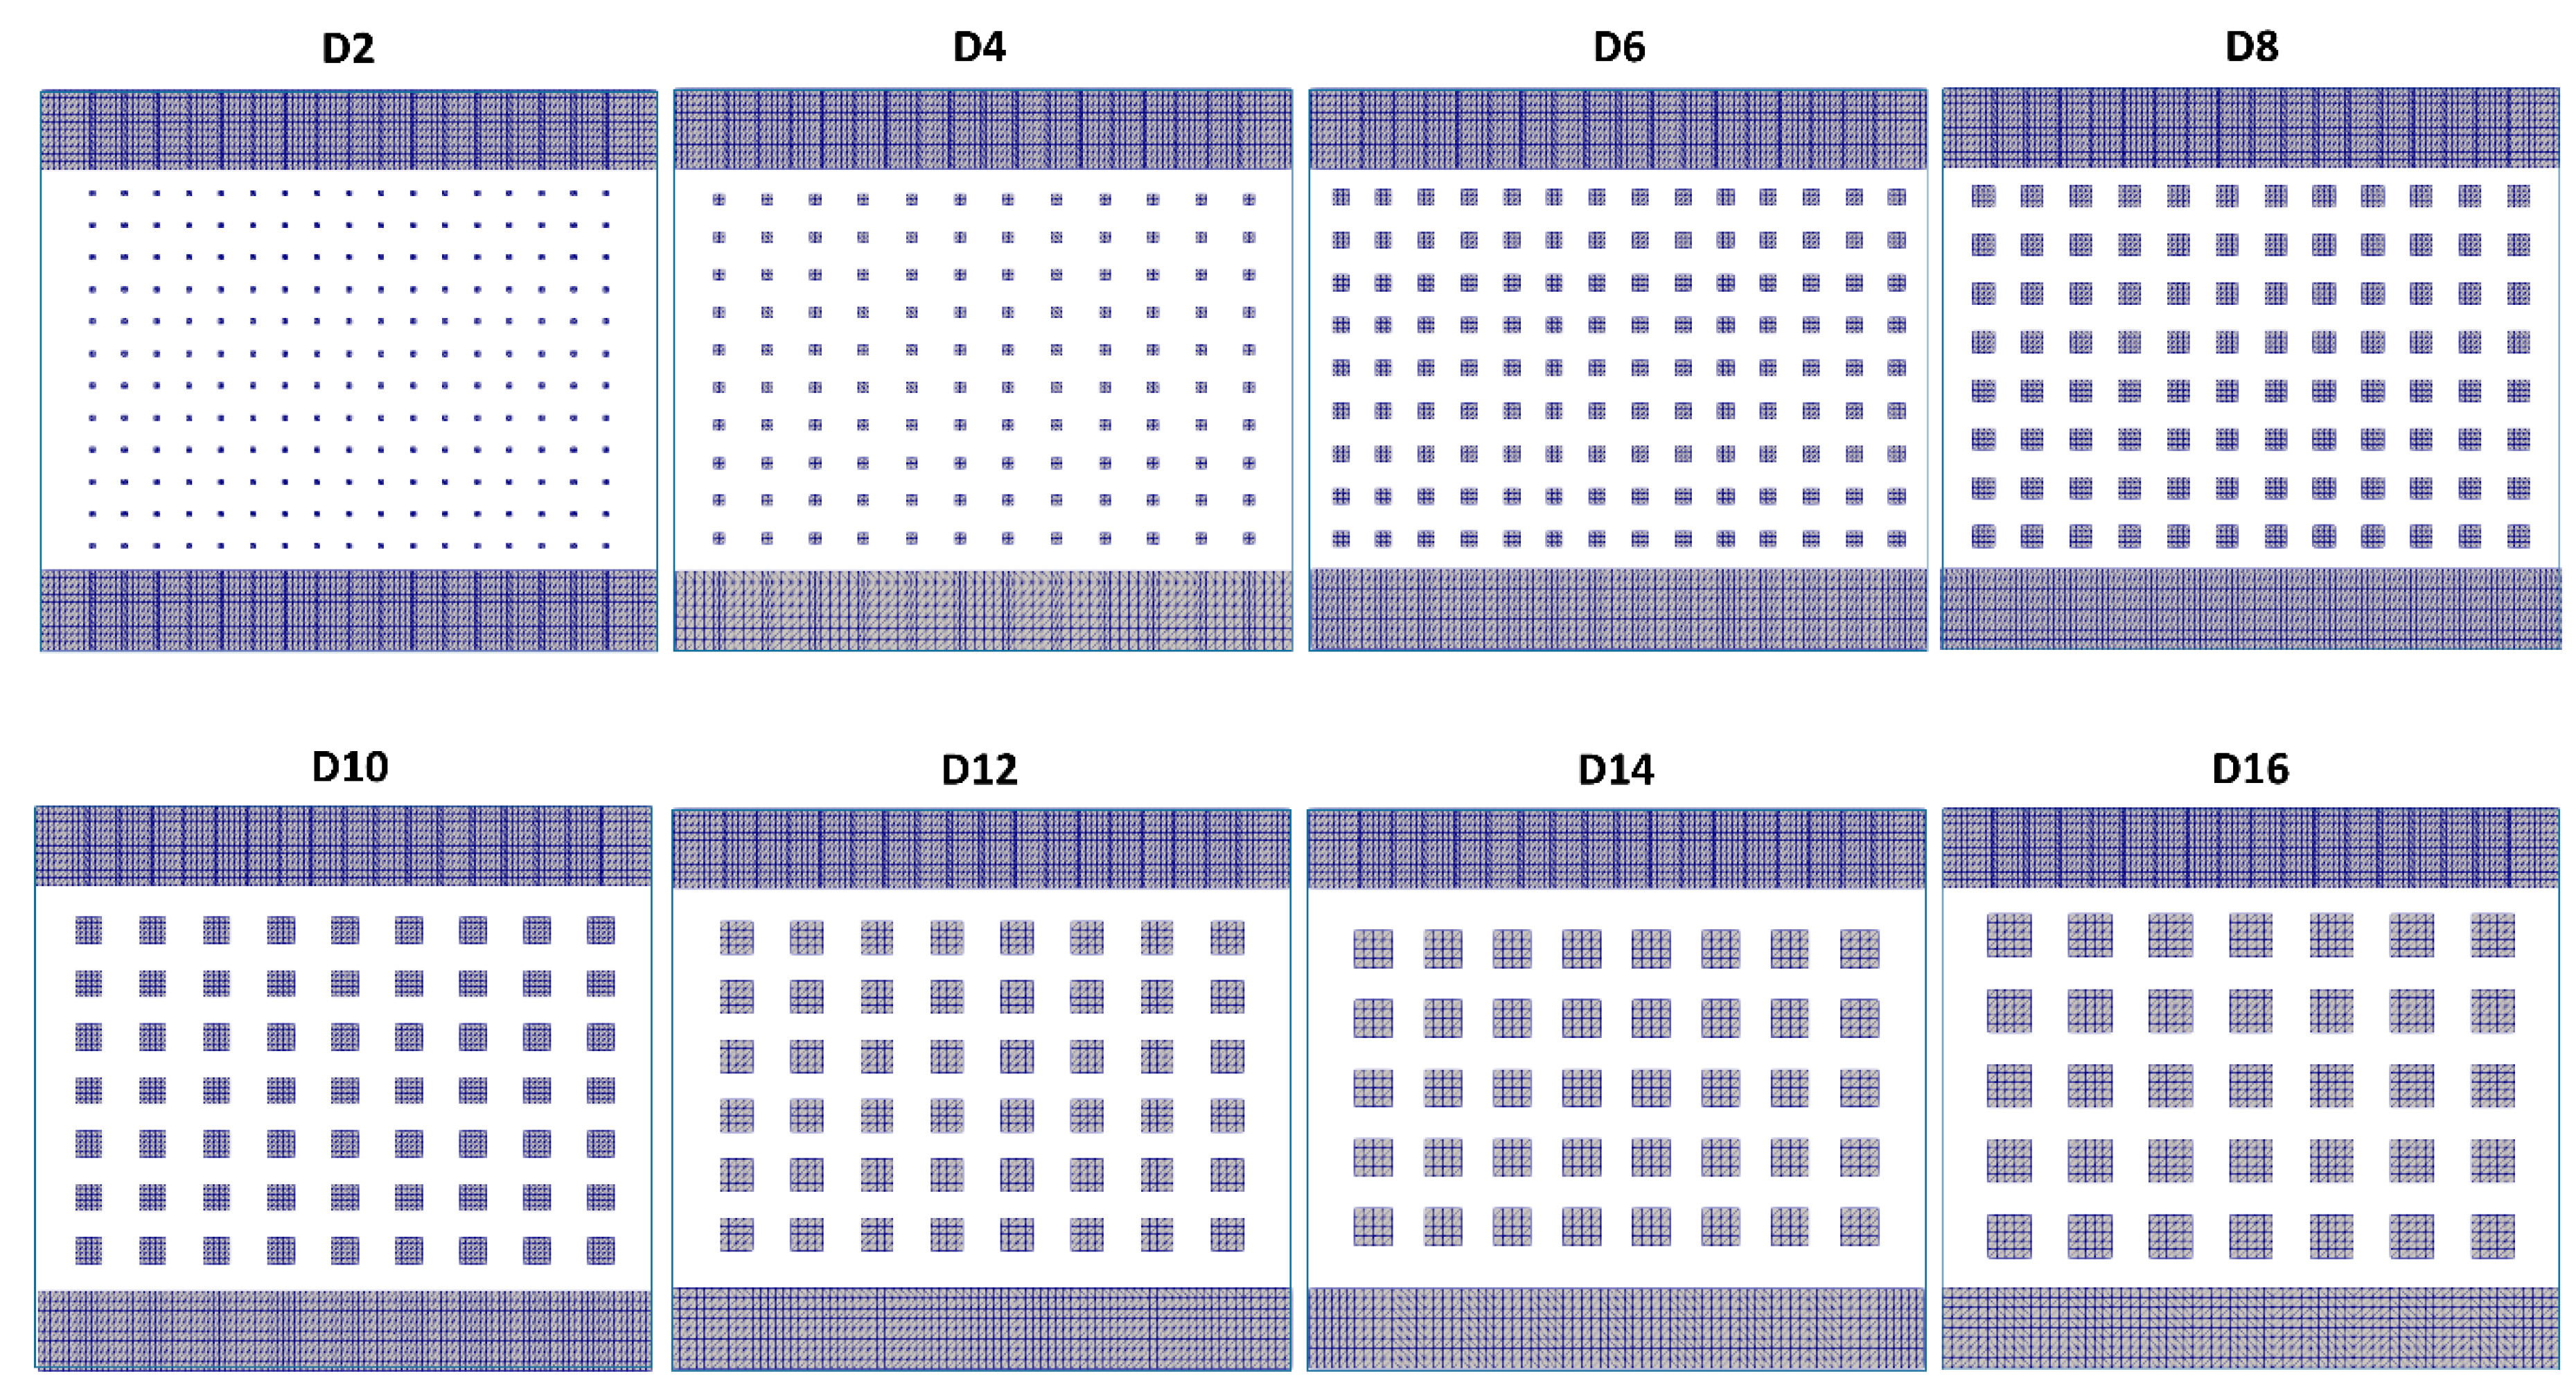
The present study therefore focused on determining the variation of the hydraulic and sanitary efficiency of contact tanks characterized by different perforated baffles geometries. The novelty of this study consists in the square geometry of the holes in order to simplify the possible application in full-scale disinfection tanks. For each of the eight designs analyzed, Figure 3 shows the holes distribution on the baffle, whereas Table 1 reports the main parameters obtained by varying the size and number of square holes. The design name refers to the size of the holes side expressed in [mm]. In the last column of the table is reported the perforation percentage given by the ratio between the areas of all the holes normal to the flow and the area of the baffle. Table 1 shows that the proposed geometry is characterized by low baffles perforation percentages, spanning in the range of 2.0–21.0%. This value is clearly lower than those investigated by previous research [13], where a value of solidity ratio in the range 65–90% was investigated. In the present research, it was decided to adopt much lower perforation values than the other literature studies in order to facilitate the eventual realization at full scale.
3.2. Flow Analysis
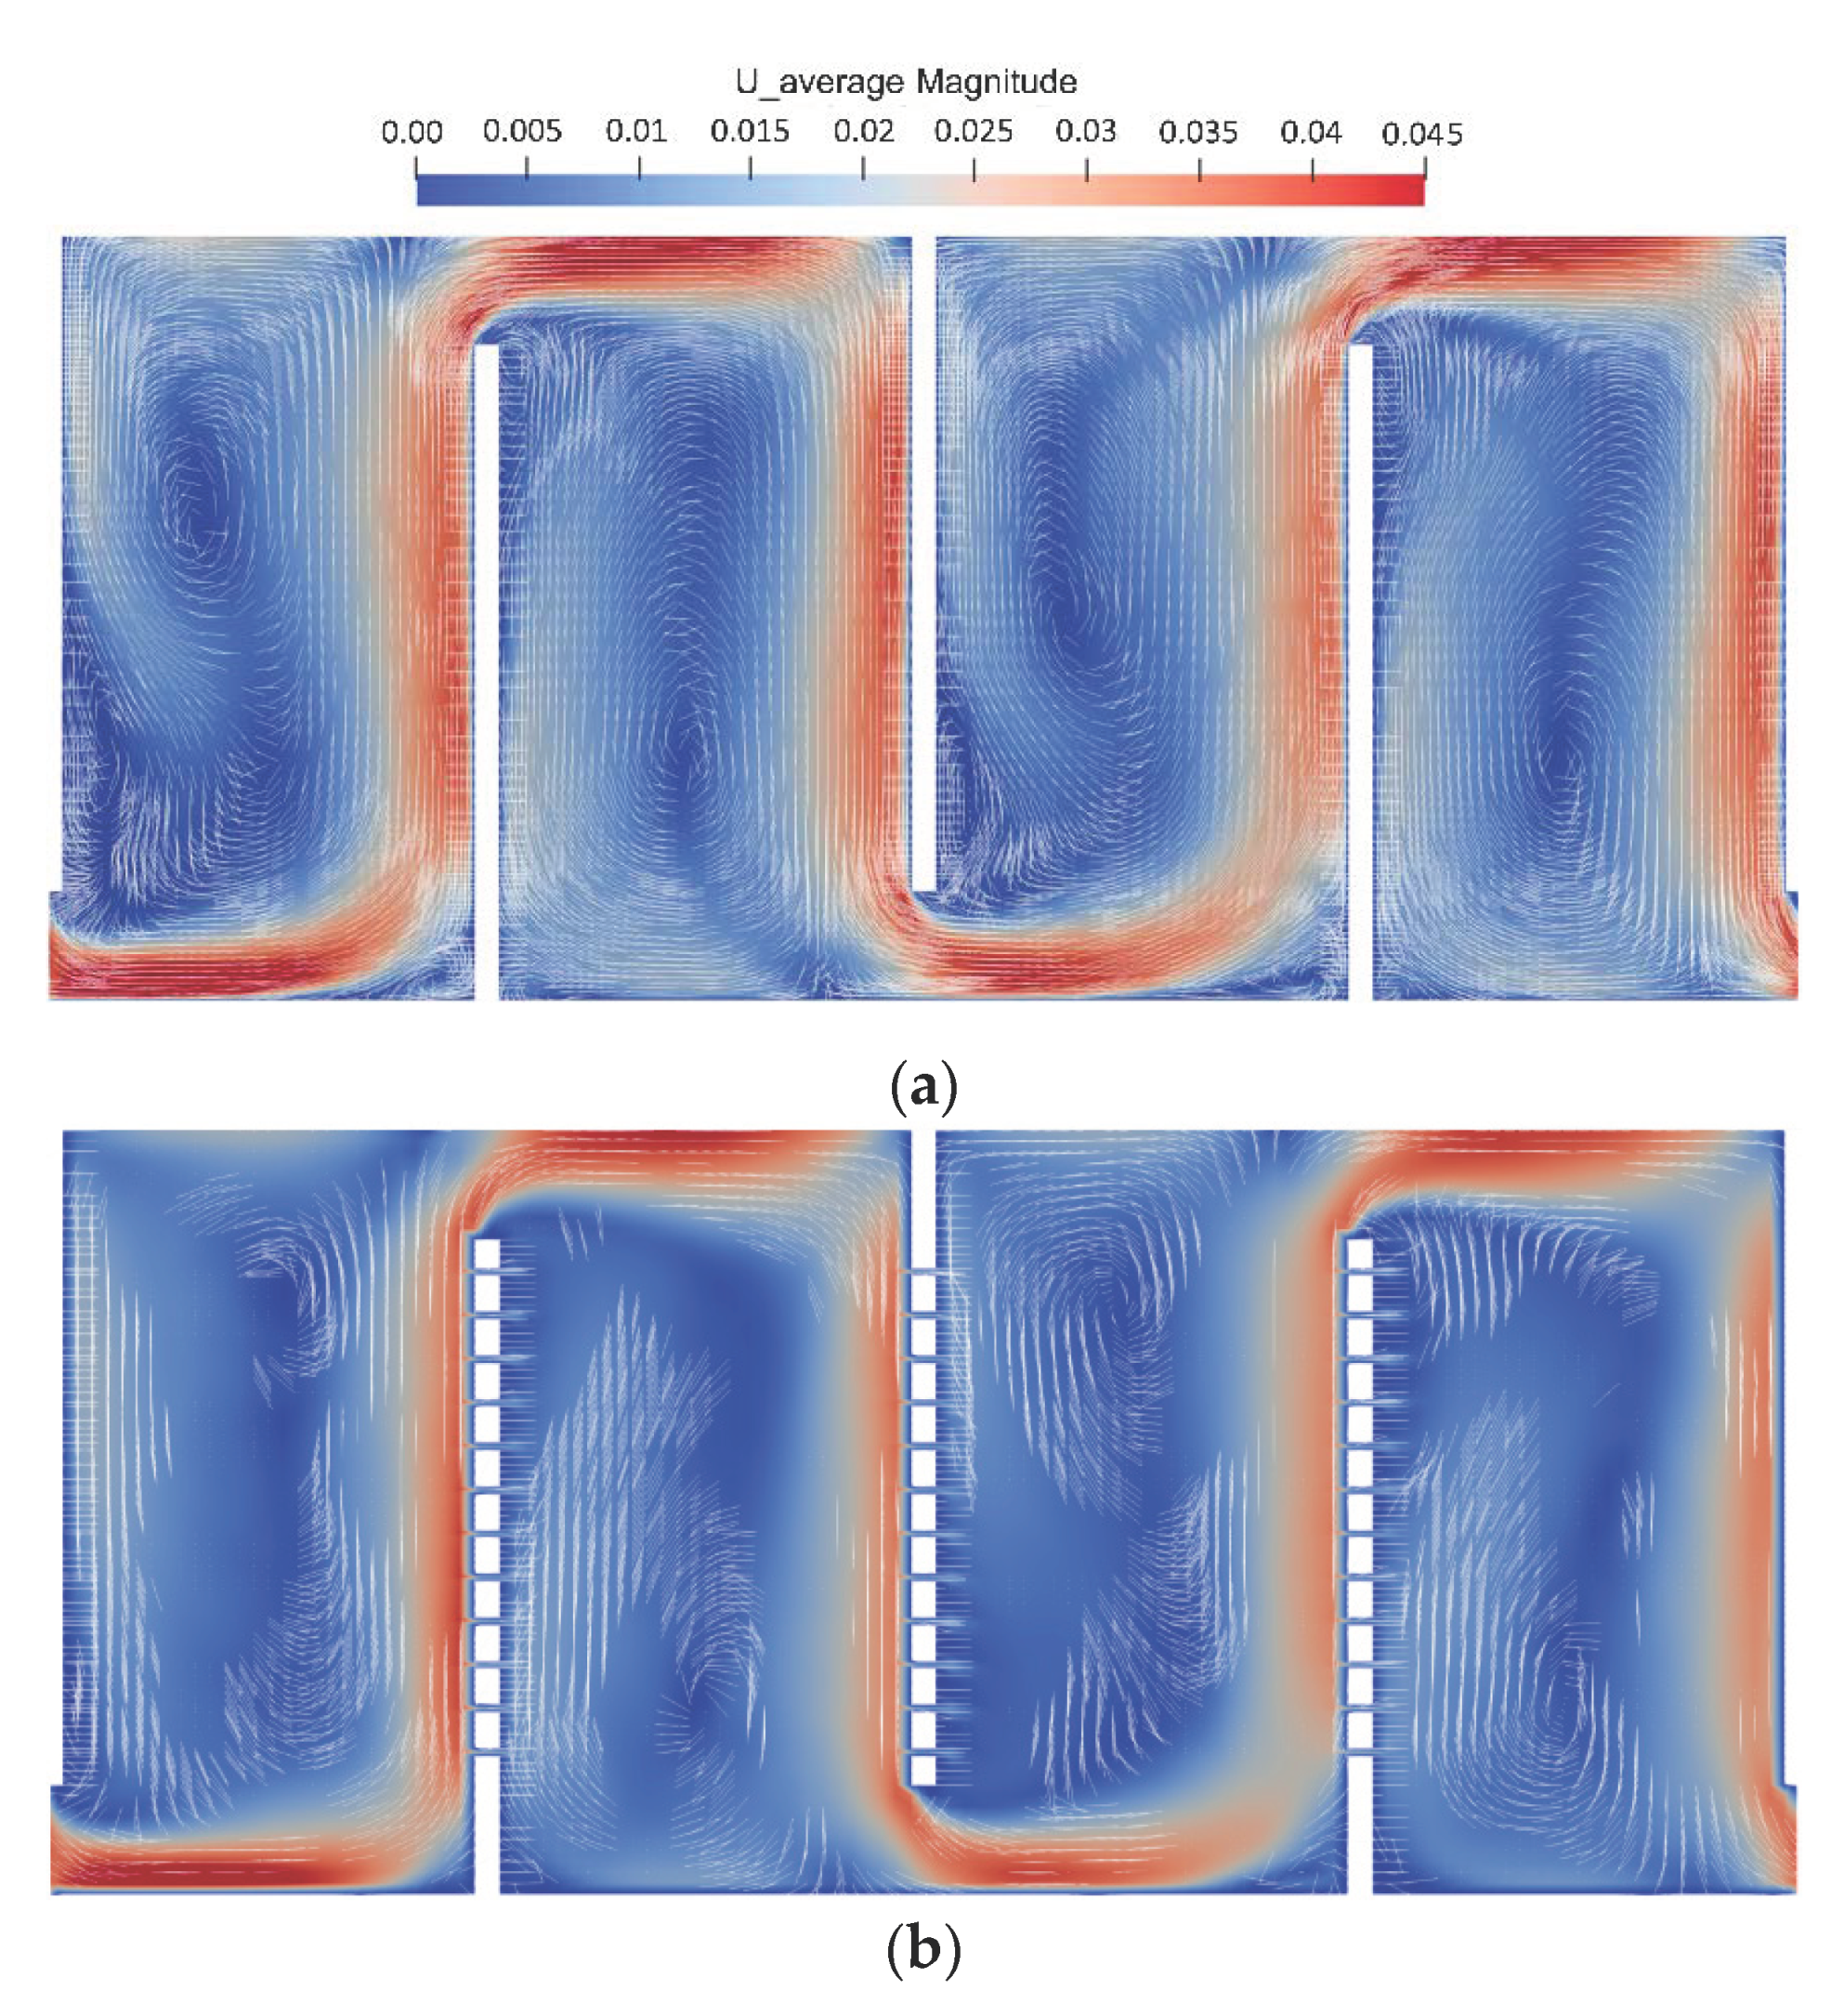
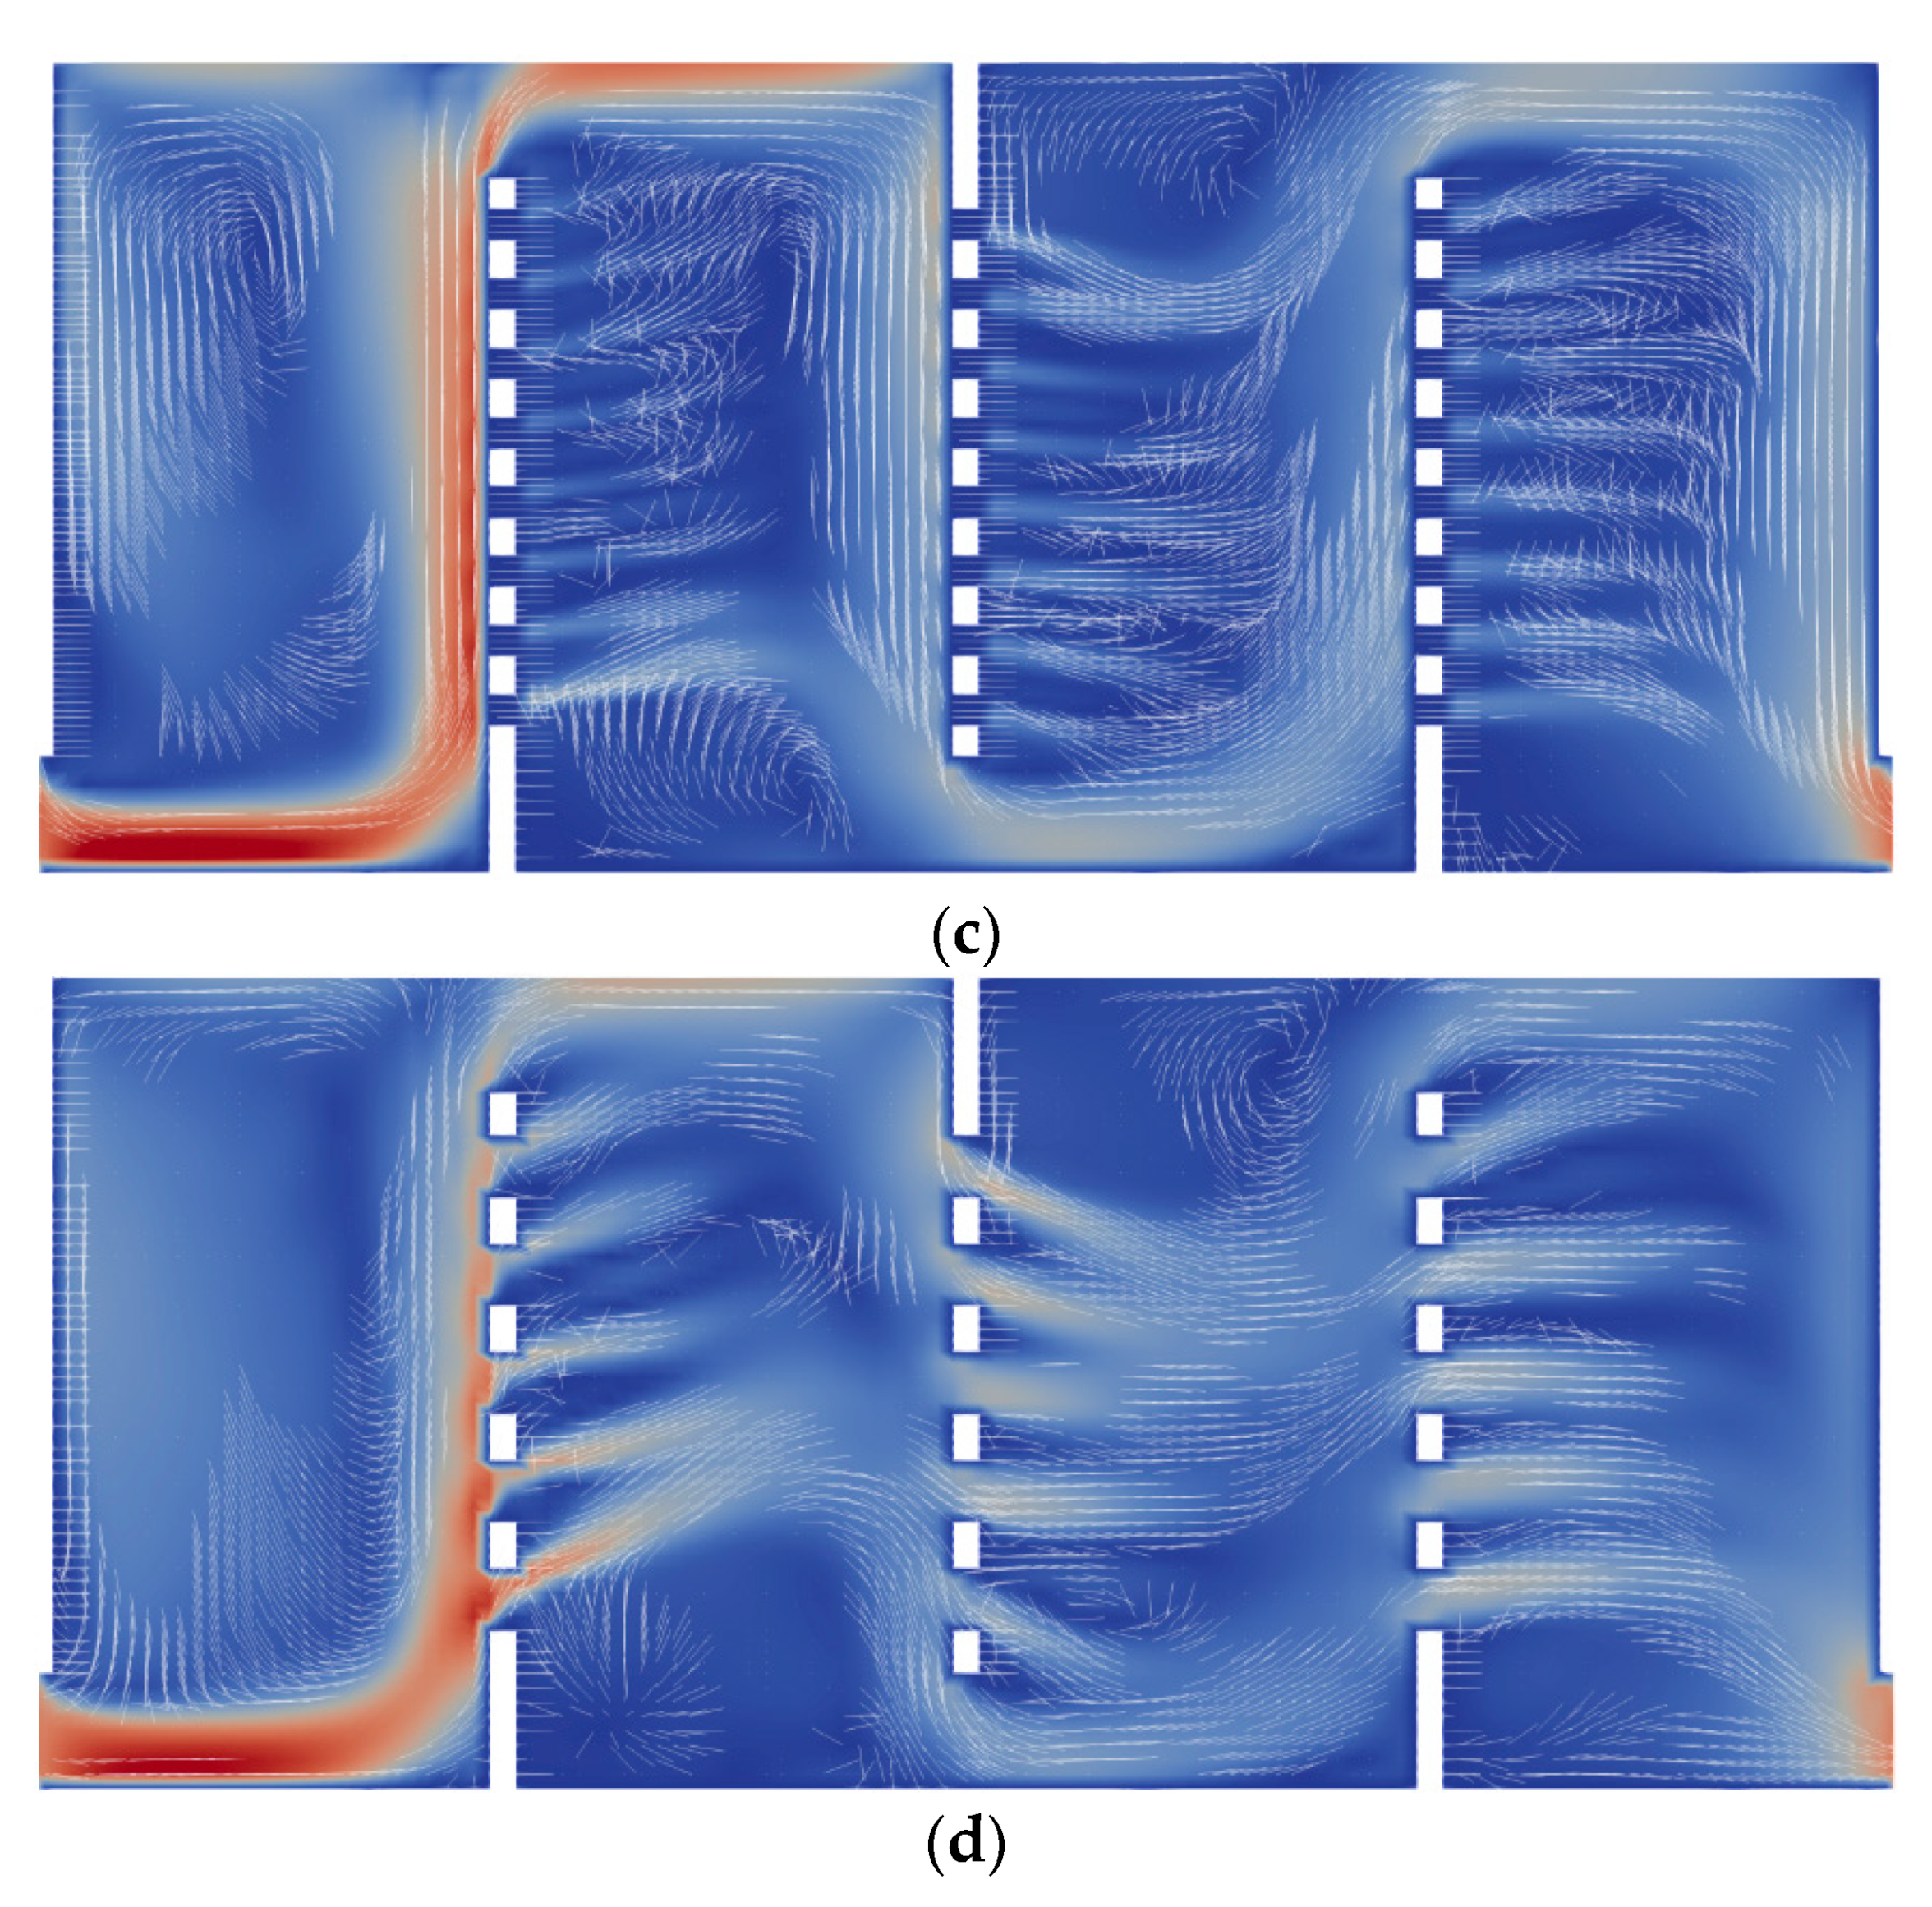
For each of the perforated designs, flow simulations to analyze the effect of perforation on mixing performance were performed. Figure 4 presents the distribution of the time-averaged absolute velocity on a horizontal plane located at the mid-depth of the tank. In particular, the figure compares the velocity vectors of the conventional design with those of three perforated models: the one with smaller holes (D2), the one with larger holes (D16) and one with intermediate sized holes within the investigated range (D8).
The purpose of the perforated baffles is to increase the mixing inside the recirculation and dead areas. However, this mixing induced by the flow exiting the holes obviously depends on the size of the holes themselves. Figure 4b shows that extremely small holes do not substantially move the flow condition away from that of traditional contact tanks depicted in Figure 4a. Due to the low operating speeds, in fact, the water is unable to enter the holes and to penetrate the recirculation areas, but continues to follow a preferential path at higher velocity that extends near the walls of each chamber. The high flow velocity determines the passage of a portion of water through the entire length of the contactor in much shorter times than the average hydraulic residence time (HRT), with consequent short circuit and therefore a reduction in disinfection efficiency. As it is possible to observe in Figure 4c,d, as the size of the holes increases, the flow is able to pass through the perforated baffles. The jet emerging from the holes penetrates the recirculation areas in the adjacent chambers and eliminates the dead zones while creating new mixing zones in these regions. Large-scale turbulent eddies generated by the square holes on the perforated baffle also contribute to mixing within the chambers. At the same time, the presence of the holes interrupts the preferential path followed by the flow near the walls of the chambers, thus reducing short circuits and increasing HRT. In this way, the perforated baffles improve the hydraulic and sanitary efficiency of the disinfection reactor as they increase the contact time of the disinfectant with the bacteria, while avoiding the excessive permanence of the disinfectant trapped in the recirculation and dead zones.
3.3. Tracer Analysis
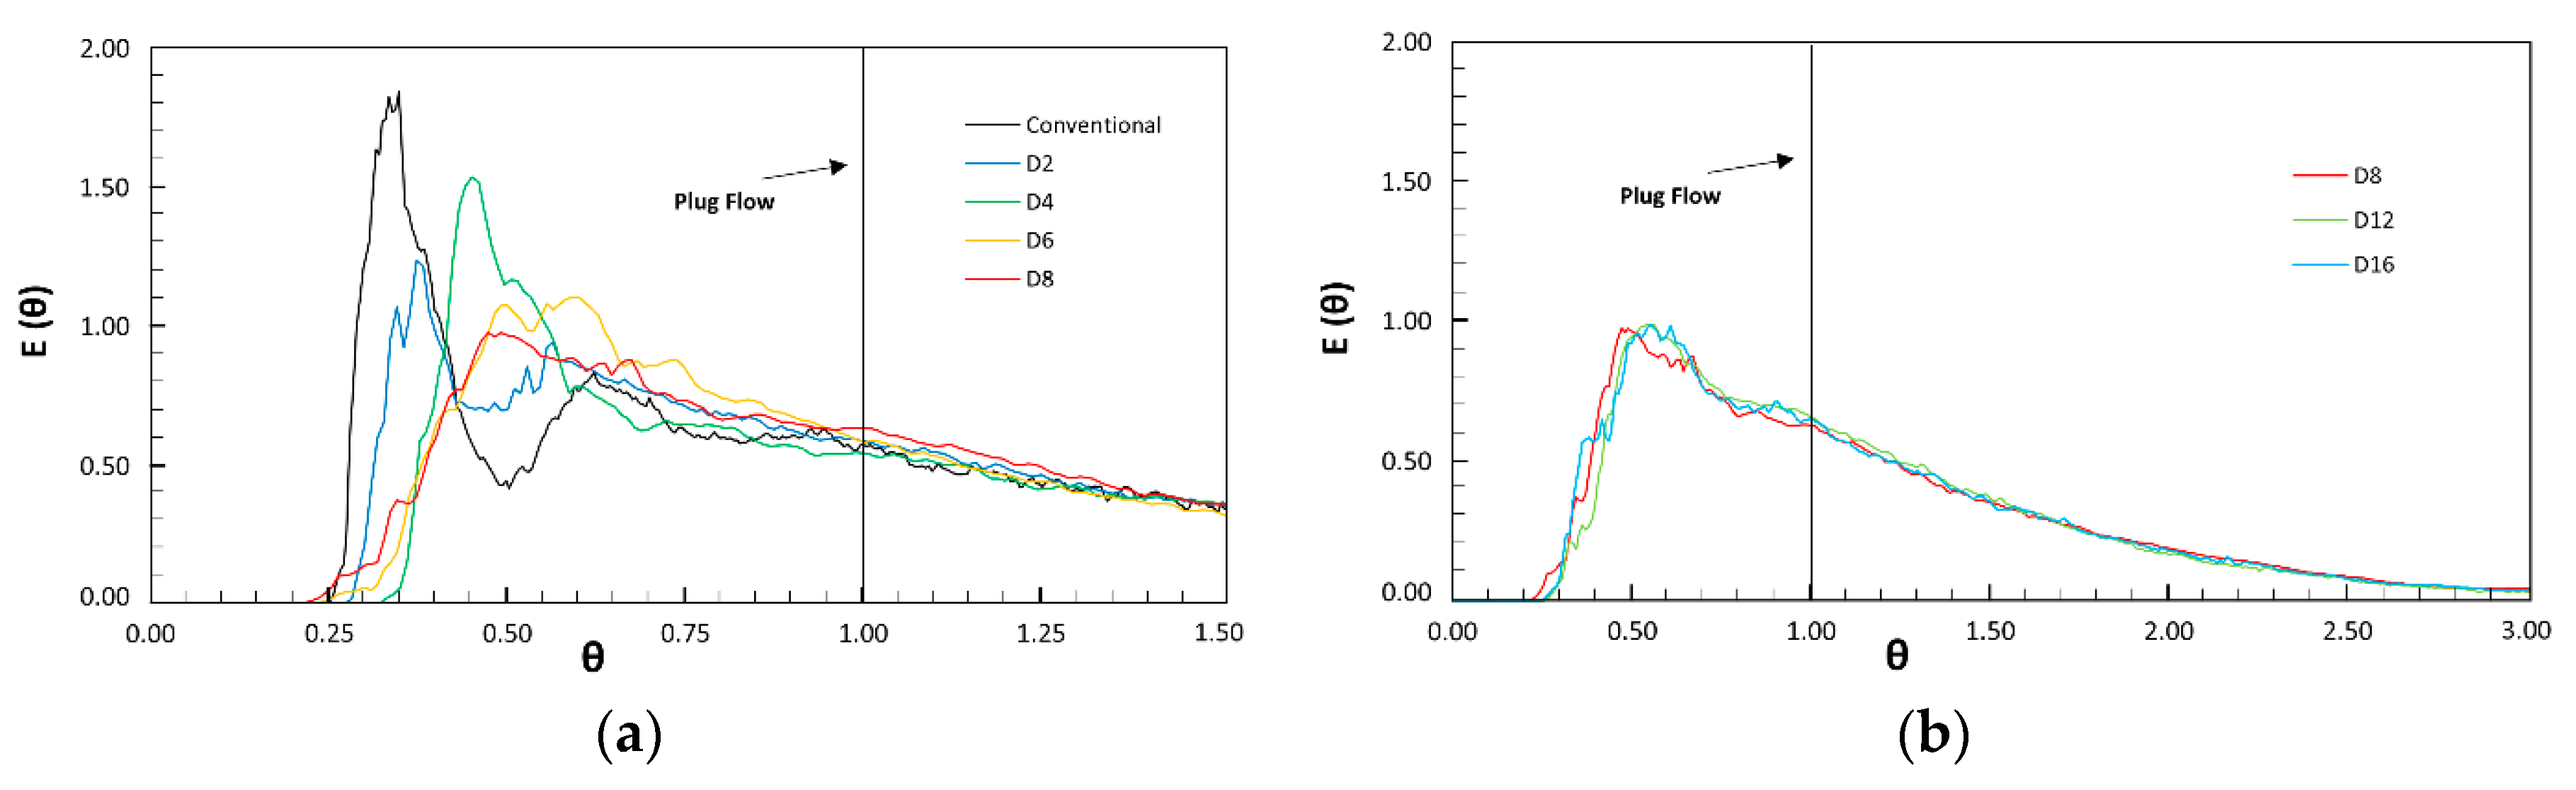
Disinfection capacity of the contact tanks has been evaluated considering the flow of a passive scalar tracer injected inside the tank from the inlet. Figure 5 compares the RTD curves obtained for conventional and perforated designs. In the reactor with conventional solid baffles, the first peak value occurs at approximately θ = 0.35 suggesting that a large quantity of the injected tracer leaves the reactor after a shorter time than the ideal contact one. The second peak value is instead observed at approximately θ = 0.65 due to the delayed release of the tracer trapped in the dead zones. As it is possible to observe from the RTD curves related to the perforated designs, the holes allow to reduce short-circuits, since the first peak moves to the right and approaches to θ = 1. On the other hand, the disappearance or attenuation of the second peak is an indicator of the reduction of dead and recirculation zones allowed by the jet coming out of the holes.
Figure 5a shows the first portion of RTD curves for conventional, D2, D4, D6 and D8 designs. As it is possible to observe, the design with the smallest holes (D2) leads to a reduction of the first peak and shifts it slightly to the right, indicating a partial reduction of the short circuit effect. The second peak, on the other hand, remains since the recirculation areas downstream of the baffles are not adequately mixed by the small amount of flow coming out of the holes. In the D4 model, the first peak moves more to the right, still maintaining high values, while the second peak disappears almost completely because the jet coming out of the holes impacts the dead zones, transforming them into mixing zones. The D6 and D8 RTD curves show that as the size of the holes increases, the first peak significantly goes down and the second peak completely disappears. Figure 5b shows that moving from the D8 model to the models with larger holes, the RTD curves have a very similar trend and therefore the hydraulic behavior of the reactors is practically identical.
There are slight differences in the baffling factor t10/τ which, as suggested by the US EPA (United States Environmental Protection Agency) [31], can be used as a parameter to classify hydraulic performance of a contact tank based on the values reported in Table 2.
General regulations instead suggest that for a perfect mixing system the Morril (Mo = t90/t10) and dispersion (σ2) coefficients should be close to 2 and 0, respectively. As previously mentioned, t10/τ and t90/τ represent the normalized times, starting from the introduction of the tracer, respectively necessary for the passage of 10% and 90% of the mass of the tracer injected through the monitoring section. The dispersion index is instead defined as:
with
and
where σt2 is the variance of the RTD curve and tg is the normalized time to reach the centroid of the effluent curve [32].
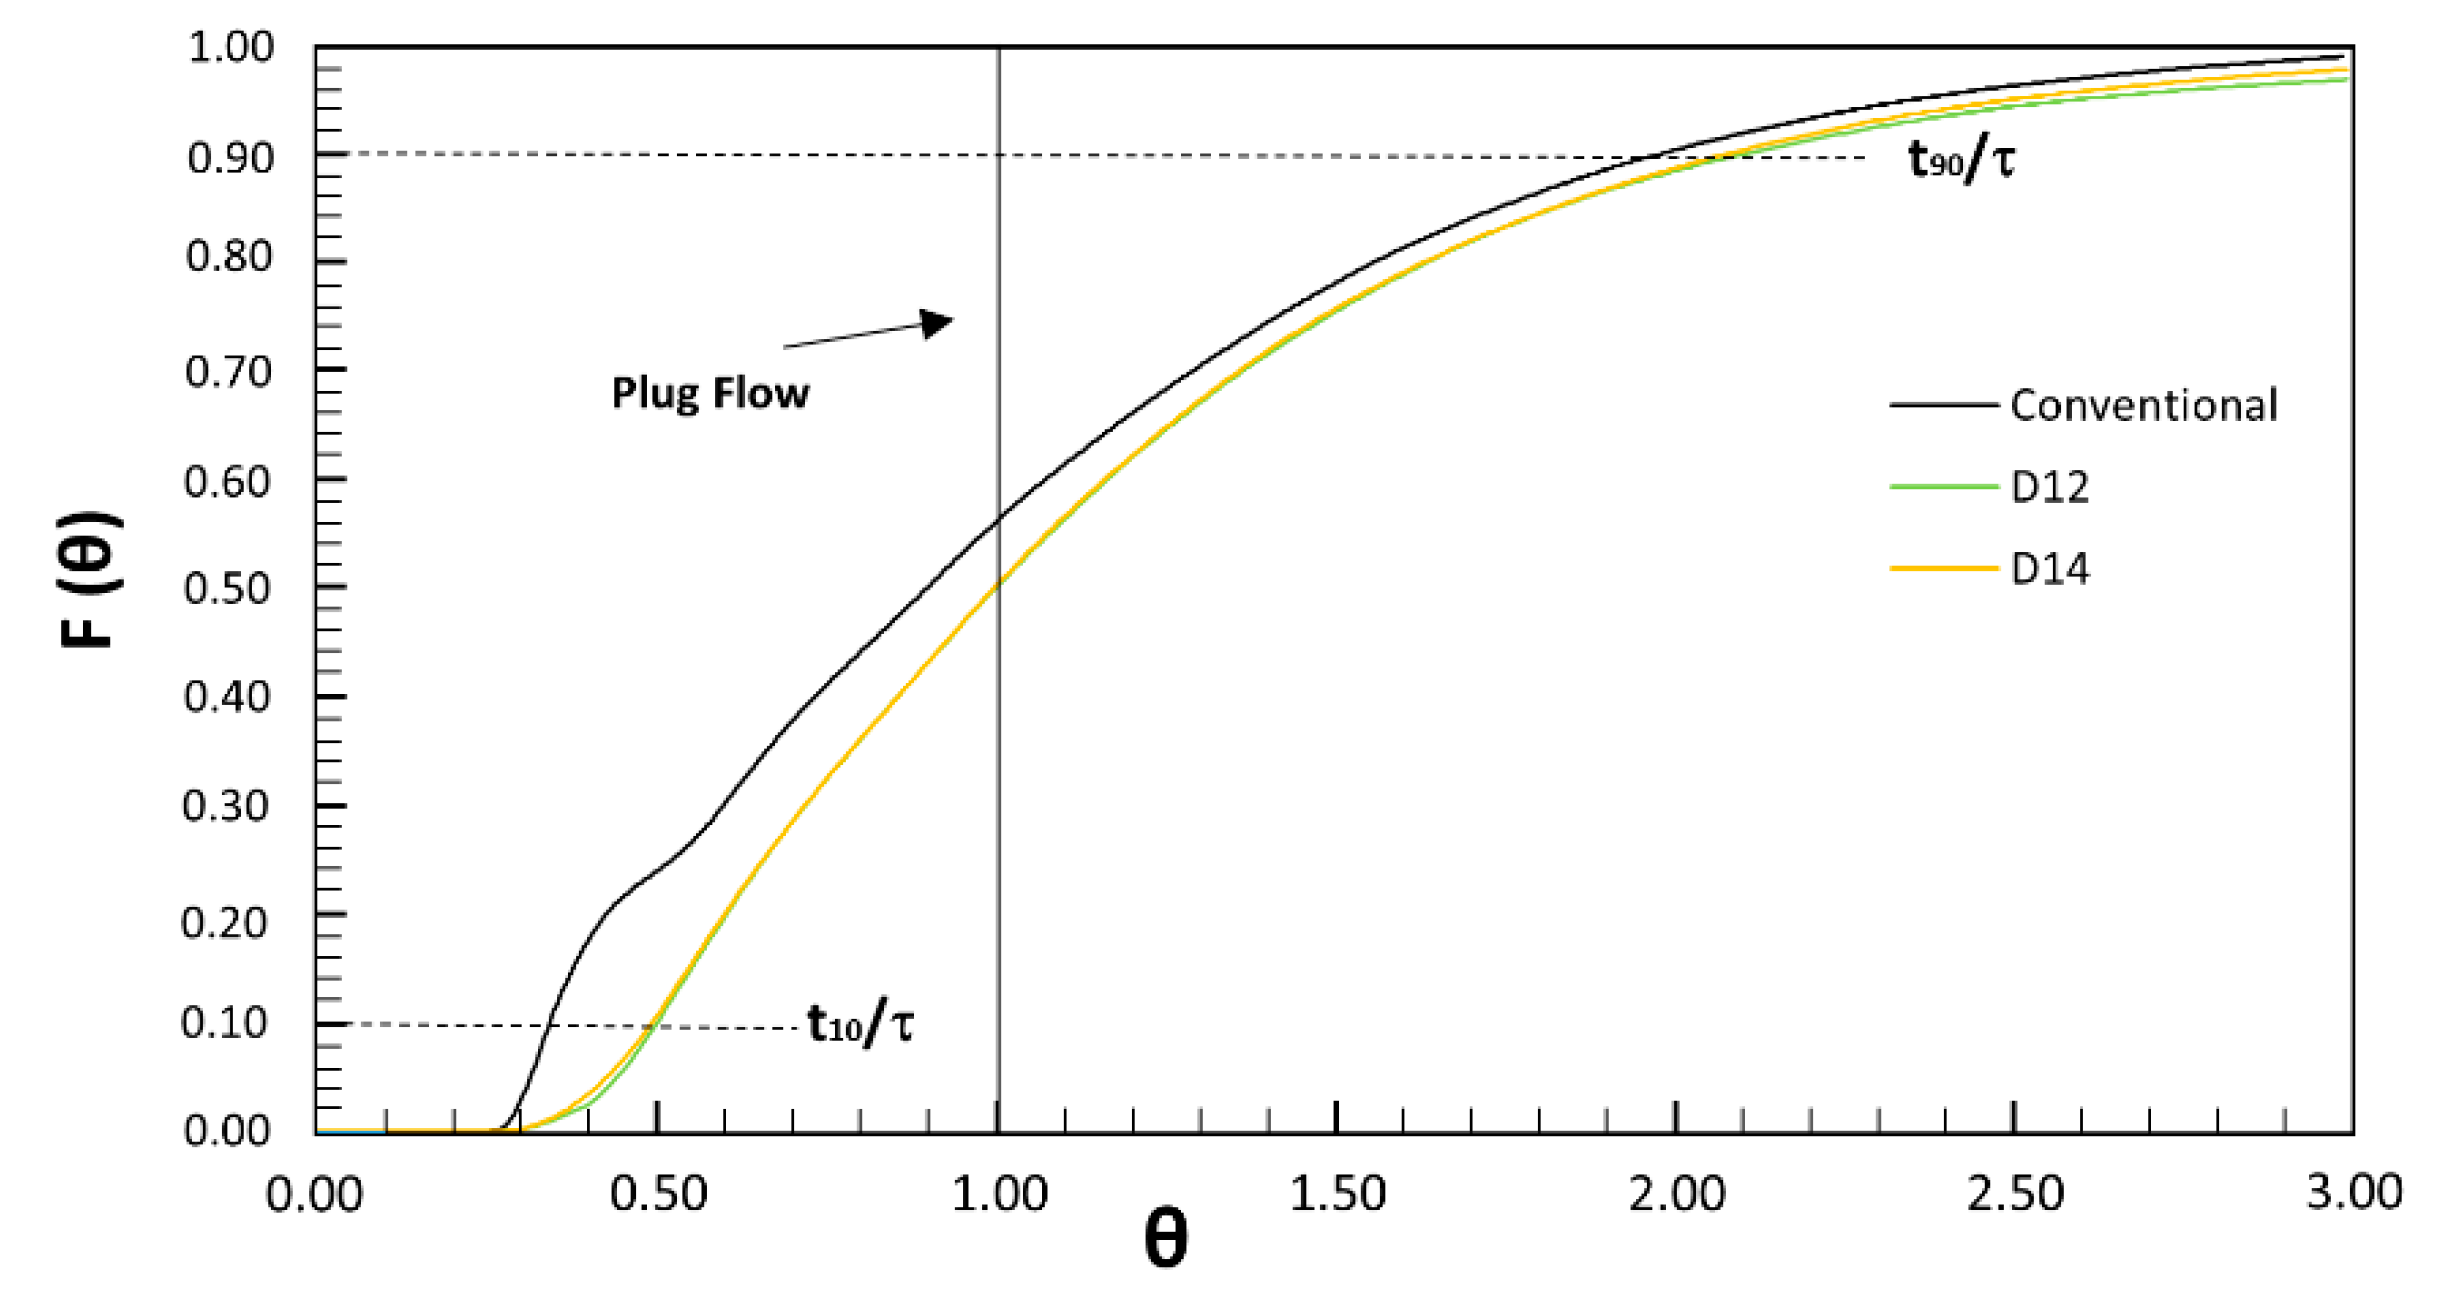
From the analysis of the HEI values determined by the CRTD curves and reported in Table 3, was obtained that Design 12 shows the highest performance in terms of the baffling factor (t10/τ = 0.509), while Design D14 allows the highest mixing efficiency (Mo = 4.127 and σ2 = 1.268). Figure 6 compares the CRTD curve of conventional solid baffles design with the CRTD obtained for D12 and D14 perforated designs and shows that the differences between the two perforated baffles designs are so small that the two curves almost perfectly overlap.
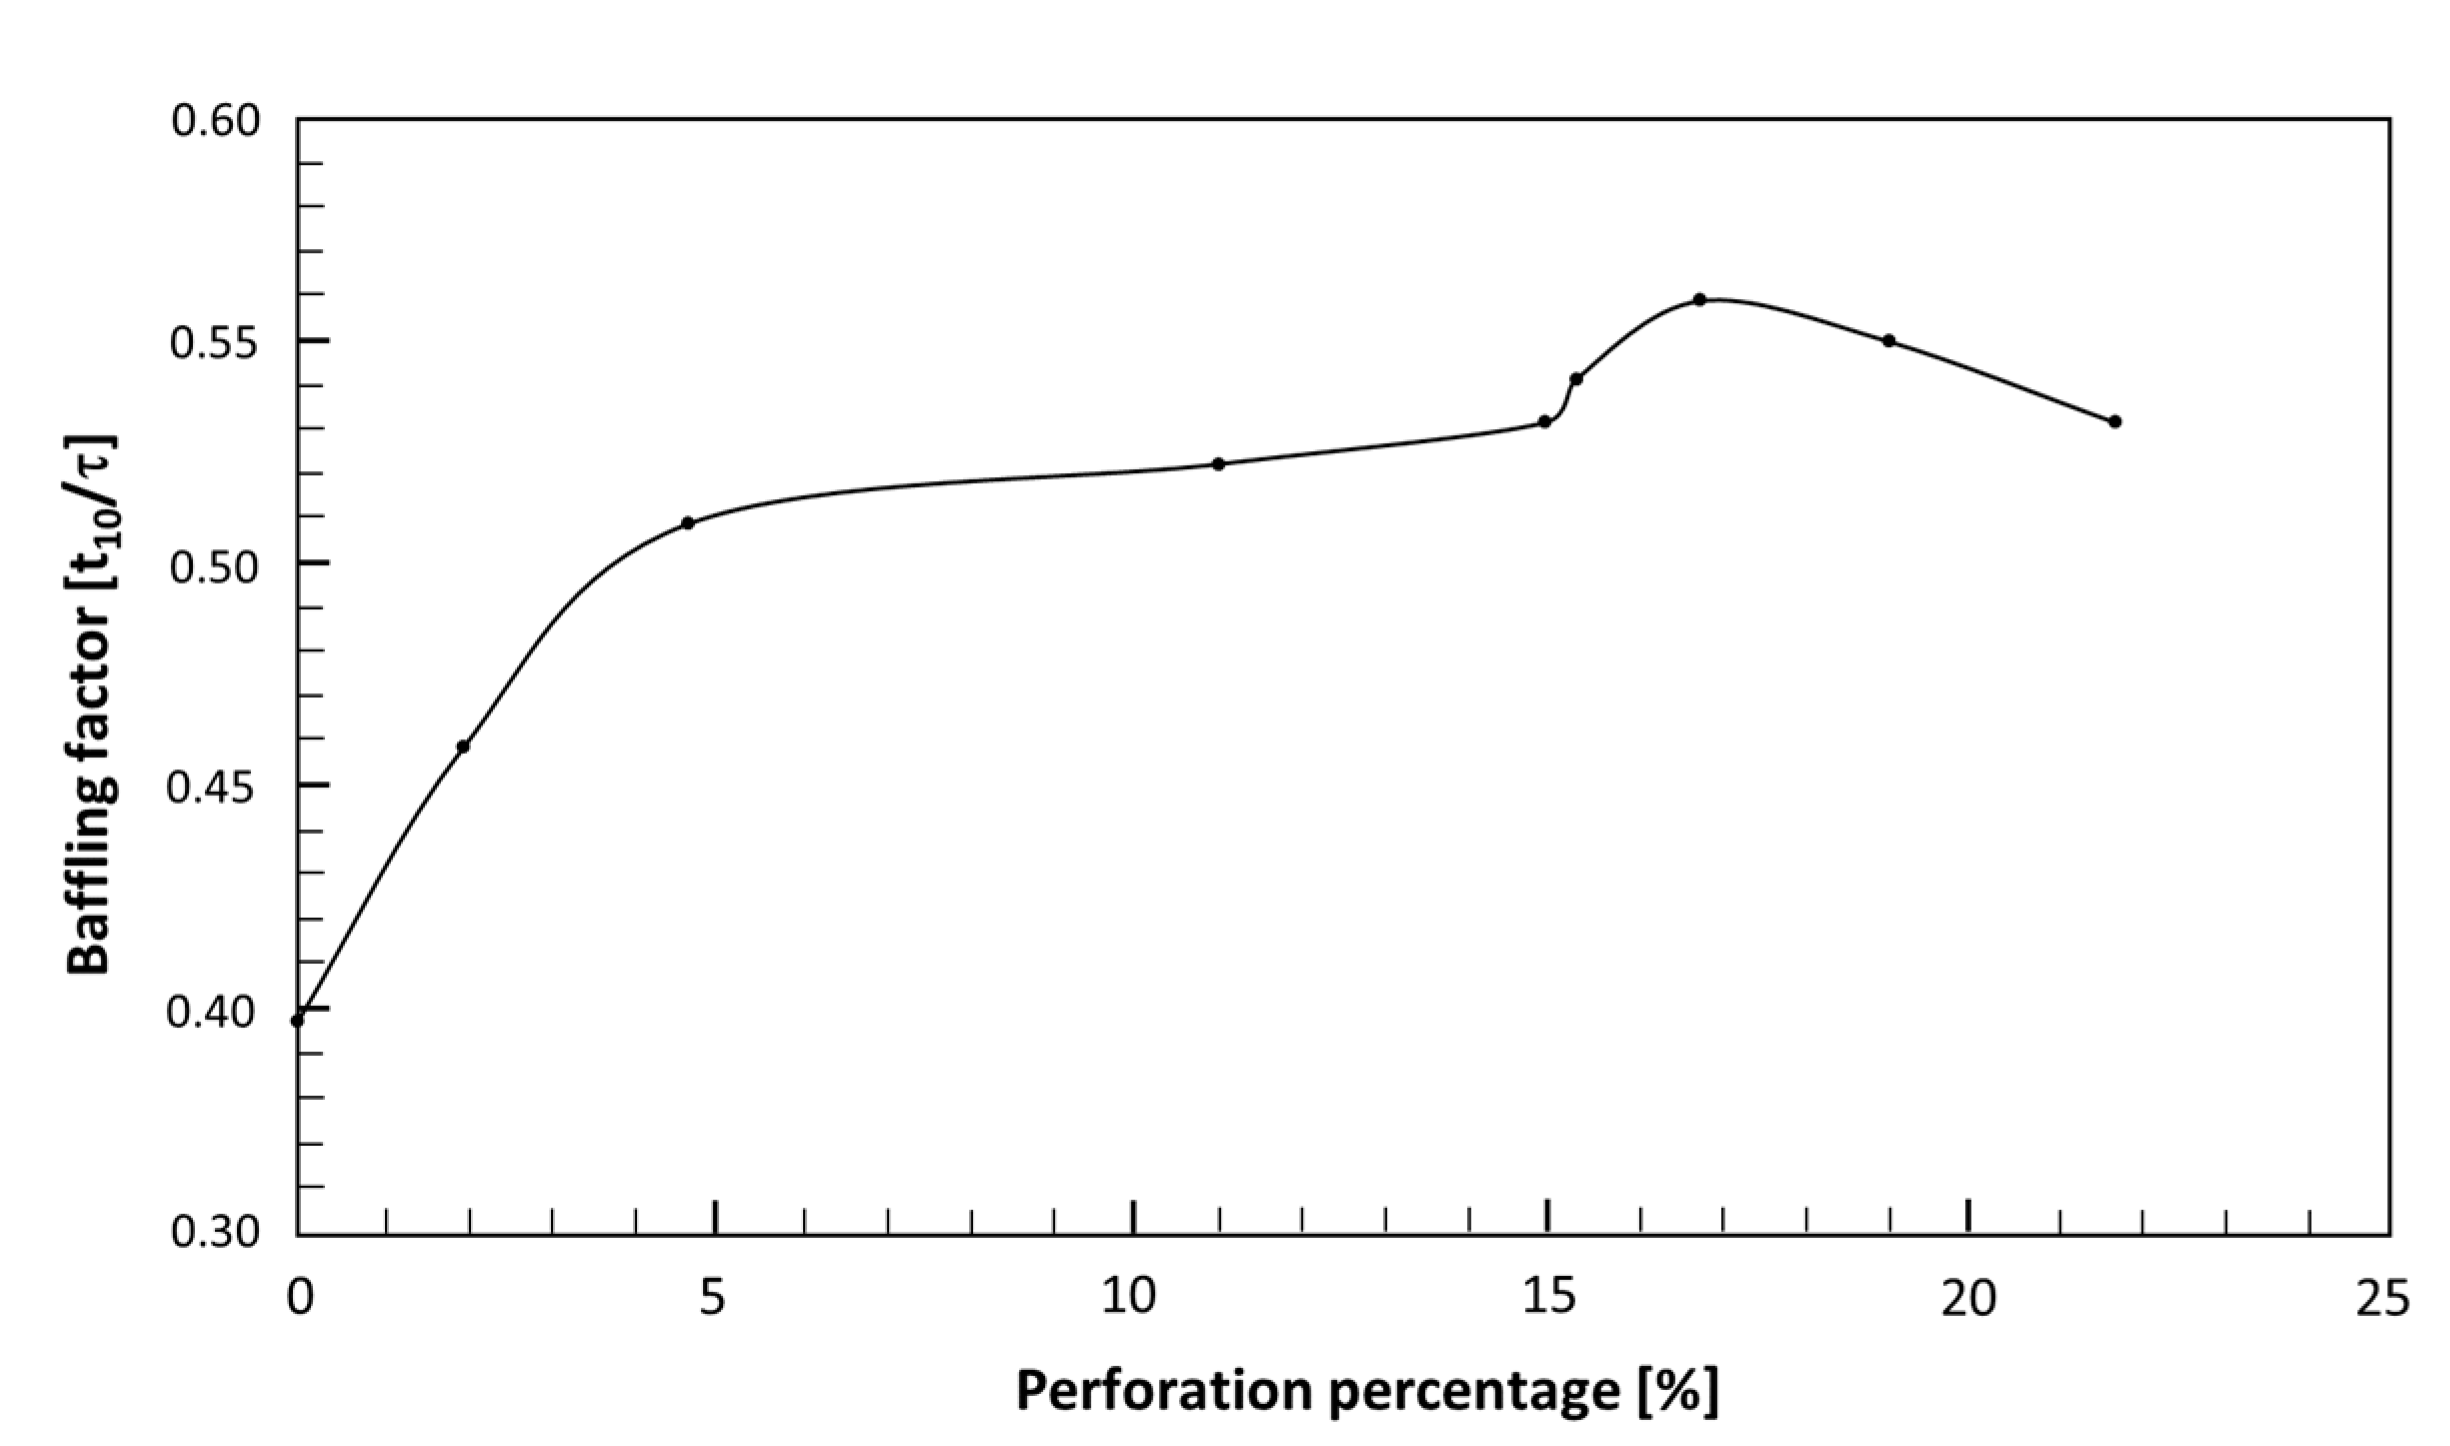
Figure 7 shows the variation of the baffling factor t10/τ value with the perforation percentage. For low perforation values, corresponding to very small holes sizes, the baffling condition is very similar to that of the conventional solid baffles design. As the perforation percentage increases, the mixing efficiency increases, reaching the maximum value for D12 design that corresponds to an average baffling condition. By further increasing the perforation, there is a reduction in reactor performance because high quantities of tracer pass through the larger holes, causing short-circuit effects that lower the HRT.
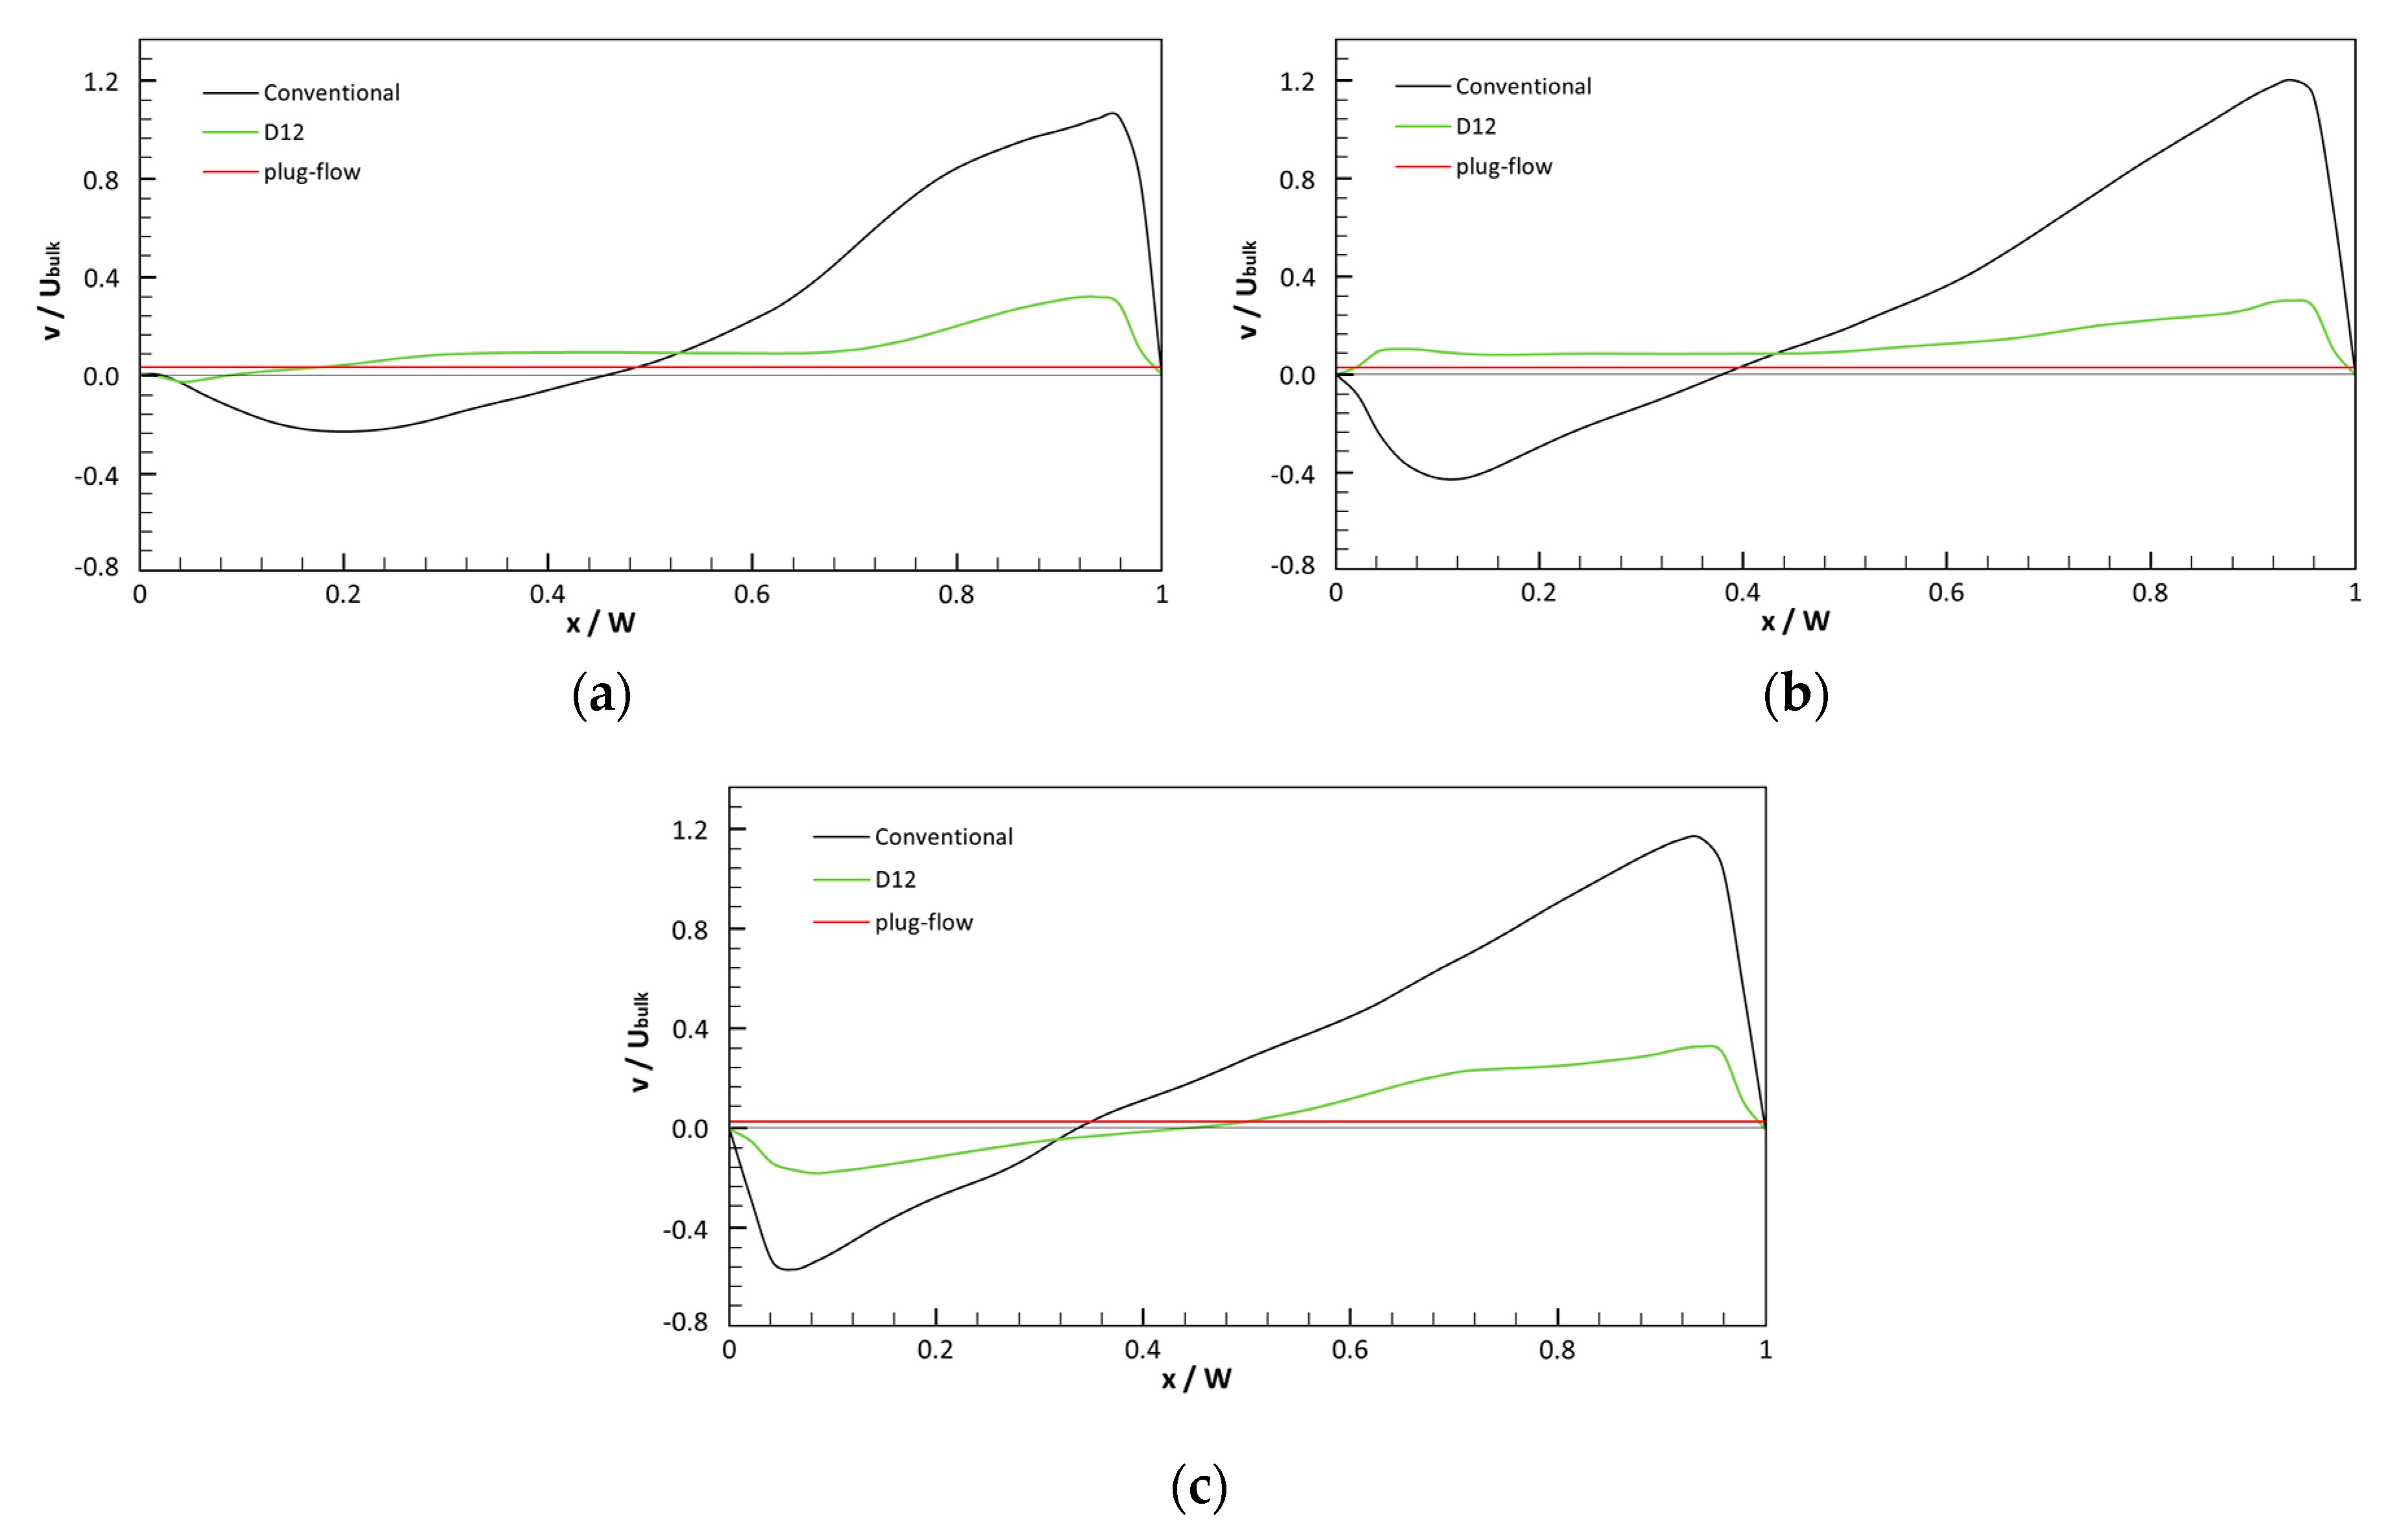
Finally, Figure 8 shows the normalized vertical velocity profiles for conventional and D12 designs predicted at three different vertical locations of a chamber. At all three depths investigated in the conventional model, the y-velocity value varies from negative to positive along the chamber width, in accordance with the presence of recirculation or dead zones occupying a large part of the chamber. In the D12 design, on the other hand, the jet coming out of the holes reduces the direction change of the y-velocity vector at all the depths investigated and the velocity profiles show a trend towards that of an ideal plug-flow reactor (PFR).
4. Conclusions
The efficiency and energy consumption of water disinfection treatment strongly depends on the tank hydrodynamics. In this study, numerical simulations are presented for the flow and tracer transport inside disinfection tanks with different geometric characteristics compared to traditional designs. In particular, the increase in hydraulic efficiency of the multichamber reactor due to the creation of square holes on the vertical partitions has been evaluated. A number of geometric configurations characterized by different hole sizes and different perforation percentages have been analyzed. All simulations show that the holes allow an increase in the mixing efficiency of the tank as the flow coming out of the holes impacts the recirculation areas downstream of the deflectors, transforming them into active mixing zones. A careful preliminary study in the design phase can therefore lead to an optimization of the reactor’s hydraulic and sanitary efficiency with a consequent reduction in the consumption of chemical disinfectants and economic savings in terms of energy required to guide the flow inside the reactor. It is important to emphasize that it is possible to obtain satisfactory increases in hydraulic and sanitary performances even with not excessive baffles perforation percentages. This is an advantage of the proposed geometry because the square shape of the holes and the low perforation percentage makes it easier to realize this perforated geometry in real tanks of new construction or for the improvement of existing disinfection tanks.
By varying the holes size, it is possible to increase the baffling factor approaching the optimal value t10/τ = 1 characteristic of the ideal plug-flow condition. The D12 design allowed to pass from a “poor” to an “average” hydraulic condition thus defined according the baffling factor. The perforated baffles configuration also allows increasing the overall efficiency of the contact system by enhancing the mixing effects. In fact, the Morril index passes from values close to six, obtained for the traditional configuration, to values just over four approaching the ideal condition (Mo = 2). By increasing the size of the holes beyond a certain value, there is instead a reduction in the baffling factor since too large holes cause the passage through the entire reactor of a significant portion of tracer in a shorter time than the theoretical hydraulic residence time. The large holes, therefore, do not reduce the detrimental short-circuit effects while allowing an increase in mixing in the tank. It is, therefore, necessary to carry out a preliminary study in order to identify the optimal configuration that allows transforming the dead zones into areas of active mixing while avoiding the short circuit in the tank.
Author Contributions
Conceptualization, P.B., G.D.B. and M.D.M.; Data curation, P.B., G.D.B. and M.D.M.; Formal analysis, P.B.; Investigation, P.B.; Methodology, P.B. and M.D.M.; Project administration, G.D.B. and M.D.M.; Software, P.B.; Supervision, G.D.B. and M.D.M.; Validation, M.D.M.; Visualization, P.B.; Writing—original draft, P.B.; Writing—review & editing, G.D.B. and M.D.M. All authors have read and agreed to the published version of the manuscript.
Funding
This research received no external funding.
Conflicts of Interest
The authors declare no conflict of interest.
References
- Angeloudis, A.; Stoesser, T.; Gualtieri, C.; Falconer, R.A. Contact tank design impact on process performance. Environ. Model. Assess. 2016, 21, 563–576. [Google Scholar] [CrossRef] [Green Version]
- Kim, D.; Kim, D.-I.; Kim, J.; Stoesser, T. Large eddy simulation of flow and tracer transport in multichamber ozone contactors. J. Environ. Eng. 2010, 136. [Google Scholar] [CrossRef] [Green Version]
- Angeloudis, A.; Stoesser, T.; Falconer, R.A. Predicting the disinfection efficiency range in chlorine contact tanks through a CFD-based approach. Water Res. 2014, 60, 118–129. [Google Scholar] [CrossRef] [PubMed]
- Wang, H.; Shao, X.; Falconer, R.A. Flow and transport simulation models for prediction of chlorine contact tank flow-through curves. Water Environ. Res. 2003, 75, 455–471. [Google Scholar] [CrossRef]
- Amini, R.; Taghipour, R.; Mirgolbabaei, H. Numerical assessment of hydrodynamic characteristics in chlorine contact tank. Int. J. Numer. Methods Fluids 2011, 67, 885–898. [Google Scholar] [CrossRef]
- Zhang, J.; Asce, M.; Tejada-Martínez, A.E.; Zhang, Q. Hydraulic efficiency in RANS of the flow in multichambered contactors. J. Hydraul. Eng. 2013. [Google Scholar] [CrossRef]
- Teixeira, E.C.; Do, R. Nascimento Siqueira, performance assessment of hydraulic efficiency indexes. J. Environ. Eng. 2008, 134, 851–859. [Google Scholar] [CrossRef]
- Demirel, E.; Aral, M.M. Unified analysis of multi-chamber contact tanks and mixing efficiency based on vorticity field. part I: Hydrodynamic analysis. Water 2016, 8, 495. [Google Scholar] [CrossRef] [Green Version]
- Aral, M.M.; Demirel, E. Novel slot-baffle design to improve mixing efficiency and reduce cost of disinfection in drinking water treatment. J. Environ. Eng. 2017, 143, 06017006. [Google Scholar] [CrossRef]
- Demirel, E.; Aral, M.M. An efficient contact tank design for potable water treatment. Tek. Dergi 2018, 29, 8279–8294. [Google Scholar] [CrossRef]
- Demirel, E.; Aral, M.M. Liquid sloshing damping in an accelerated tank using a novel slot-baffle design. Water 2018, 10, 1565. [Google Scholar] [CrossRef] [Green Version]
- Kizilaslan, M.A.; Demirel, E.; Aral, M.M. Effect of porous baffles on the energy performance of contact tanks in water treatment. Water 2018, 10, 1084. [Google Scholar] [CrossRef] [Green Version]
- Kizilaslan, M.A.; Nasyrlayev, N.; Demirel, E. A perforated baffle design to improve mixing in contact tanks. Water 2020, 12, 1022. [Google Scholar] [CrossRef] [Green Version]
- Rauen, W.B.; Angeloudis, A.; Falconer, R.A. Appraisal of chlorine contact tank modelling practices. Water Res. 2012, 46, 5834–5847. [Google Scholar] [CrossRef]
- Zhang, J.; Tejada-Martínez, A.E.; Zhang, Q. Developments in computational fluid dynamics-based modeling for disinfection technologies over the last two decades: A review. Environ. Model. Softw. 2014, 58, 71–85. [Google Scholar] [CrossRef]
- Angeloudis, A.; Stoesser, T.; Kim, D.; Falconer, R.A. Modelling of flow, transport and disinfection kinetics in contact tanks. Proc. Inst. Civ. Eng. Water Manag. 2014, 167, 532–546. [Google Scholar] [CrossRef]
- Pfeiffer, V.; Barbeau, B. Validation of a simple method for predicting the disinfection performance in a flow-through contactor. Water Res. 2014, 49, 144–156. [Google Scholar] [CrossRef]
- Zhang, J.; Xu, X.; Tejada-Martinez, A.; Zhang, Q.; Wicklein, E. Evaluating reactor hydraulics in a cost-effective and environment-friendly way: Numerical tracer study. AWWA Water Sci. 2019, 1, e1163. [Google Scholar] [CrossRef]
- Okhravi, S.; Eslamian, S.; Fathianpour, N. Assessing the effects of flow distribution on the internal hydraulic behavior of a constructed horizontal subsurface flow wetland using a numerical model and a tracer study. Ecohydrol. Hydrobiol. 2017, 17, 264–273. [Google Scholar] [CrossRef]
- Shahrokhi, M.; Rostami, F.; Said, M.A.M.; Yazdi, S.R.S.; Syafalni. The effect of number of baffles on the improvement efficiency of primary sedimentation tanks. Appl. Math. Model. 2012, 36, 3725–3735. [Google Scholar] [CrossRef]
- Zhang, J.; Tejada-Martinez, A.E.; Lei, H.; Zhang, Q. Indicators for technological, environmental and economic sustainability of ozone contactors. Water Res. 2016, 101. [Google Scholar] [CrossRef] [PubMed]
- Zhang, J.; Tejada-Martínez, A.E.; Zhang, Q. Evaluation of large eddy simulation and RANS for determining hydraulic performance of disinfection systems for water treatment. J. Fluids Eng. 2014, 136, 121102. [Google Scholar] [CrossRef]
- Angeloudis, A.; Stoesser, T.; Falconer, R.A.; Kim, D. Flow, transport and disinfection performance in small- and full-scale contact tanks. J. Hydro Environ. Res. 2015, 9, 15–27. [Google Scholar] [CrossRef]
- Kizilaslan, M.A.; Demirel, E.; Aral, M.M. Efficiency enhancement of chlorine contact tanks in water treatment plants: A full-scale application. Processes 2019, 7, 551. [Google Scholar] [CrossRef] [Green Version]
- Zhang, J.; Tejada-Martínez, A.E.; Zhang, Q. Reynolds-averaged Navier-Stokes Simulation of the flow and tracer transport in a multichambered ozone contactor. J. Environ. Eng. 2013, 139, 450–454. [Google Scholar] [CrossRef]
- Kim, D.; Elovitz, M.; Roberts, P.J.W.; Kim, J.H. Using 3D LIF to investigate and improve performance of a multichamber ozone contactor. J. Am. Water Work. Assoc. 2010, 102, 61–70. [Google Scholar] [CrossRef]
- Bruno, P.; Di Bella, G.; De Marchis, M. Large Eddy Simulation of Contact Tanks for Disinfection in Drinking Water Treatment. In Direct and Large Eddy Simulation XII; García-Villalba, M., Kuerten, H., Salvetti, M., Eds.; DLES 2019 ERCOFTAC Series; Springer: Cham, Switzerland, 2020; Volume 27, pp. 503–508. [Google Scholar] [CrossRef]
- De Marchis, M. Large eddy simulations of roughened channel flows: Estimation of the energy losses using the slope of the roughness. Comput. Fluids 2016, 140, 148–157. [Google Scholar] [CrossRef]
- Kim, D.; Stoesser, T.; Kim, J.H. Modeling aspects of flow and solute transport simulations in water disinfection tanks. Appl. Math. Model. 2013, 37, 8039–8050. [Google Scholar] [CrossRef]
- Zhang, J.; Pierre, K.C.; Tejada-Martinez, A.E. Impacts of flow and tracer release unsteadiness on tracer analysis of water and wastewater treatment facilities. J. Hydraul. Eng. 2019, 145. [Google Scholar] [CrossRef]
- United States Environmental Protection Agency. Disinfection Profiling and Benchmarking Guidance Manual; Appendix A Rep. No. EPA 816-R-03-004 EPA; USEPA: Cincinnati, OH, USA, 1999.
- Marske, D.M.; Boyle, J.D. Chlorine contact chamber design—A field evaluation. Water Sew. Work. 1973, 120, 70–77. [Google Scholar]
Figure 1.
Three-dimensional schematic view of the computational domain.

Figure 2.
Three-dimensional view of the structural mesh.

Figure 3.
Hole distribution on the baffle for each of the six designs analyzed.

Figure 4.
Time-averaged absolute velocity vectors in the center-plane (z/L = 0.5) of (a) conventional reactor and (b) D2, (c) D8 and (d) D16 perforated designs.
Figure 4.
Time-averaged absolute velocity vectors in the center-plane (z/L = 0.5) of (a) conventional reactor and (b) D2, (c) D8 and (d) D16 perforated designs.


Figure 5.
Residence time distribution (RTD) curves of (a) conventional, D2, D4, D6 and D8 designs and (b) from D8 to D16 models.
Figure 5.
Residence time distribution (RTD) curves of (a) conventional, D2, D4, D6 and D8 designs and (b) from D8 to D16 models.

Figure 6.
Comparison of cumulative RTD (CRTD) curves of conventional, D12 and D14 designs.

Figure 7.
Variation of the baffling factor t10/τ value with the perforation percentage.

Figure 8.
Distribution of vertical velocity component across the chamber width of conventional and D12 designs at different depths: (a) y/H = 0.27; (b) y/H = 0.5; (c) y/H = 0.72.
Figure 8.
Distribution of vertical velocity component across the chamber width of conventional and D12 designs at different depths: (a) y/H = 0.27; (b) y/H = 0.5; (c) y/H = 0.72.


Table 1.
Perforation parameters of baffle designs.
| Design | Hole Side (mm) | Number of Holes | Perforation Percentage (%) |
|---|---|---|---|
| D2 | 2 | 204 | 2.0 |
| D4 | 4 | 120 | 4.6 |
| D6 | 6 | 126 | 11.0 |
| D8 | 8 | 96 | 14.8 |
| D10 | 10 | 63 | 15.2 |
| D12 | 12 | 48 | 16.7 |
| D14 | 14 | 40 | 18.9 |
| D16 | 16 | 35 | 21.6 |
| Baffling Condition | t10/τ |
|---|---|
| Unbaffled (mixed flow) | 0.1 |
| Poor | 0.3 |
| Average | 0.5 |
| Superior | 0.7 |
| Perfect (plug-flow) | 1.0 |
Table 3.
Hydraulic efficiency indicators for conventional and perforated baffle designs.
| Design | t10/τ | t90/τ | Mo | σ2 |
|---|---|---|---|---|
| Conventional | 0.347 | 2.000 | 5.758 | 0.105 |
| D2 | 0.409 | 2.052 | 5.022 | 1.313 |
| D4 | 0.459 | 2.275 | 4.960 | 1.308 |
| D6 | 0.472 | 2.152 | 4.560 | 1.300 |
| D8 | 0.481 | 2.116 | 4.396 | 1.285 |
| D10 | 0.491 | 2.098 | 4.273 | 1.279 |
| D12 | 0.509 | 2.116 | 4.161 | 1.272 |
| D14 | 0.499 | 2.061 | 4.127 | 1.268 |
| D16 | 0.481 | 2.070 | 4.302 | 1.280 |
Publisher’s Note: MDPI stays neutral with regard to jurisdictional claims in published maps and institutional affiliations. |
© 2020 by the authors. Licensee MDPI, Basel, Switzerland. This article is an open access article distributed under the terms and conditions of the Creative Commons Attribution (CC BY) license (http://creativecommons.org/licenses/by/4.0/).
Share and Cite
MDPI and ACS Style
Bruno, P.; Di Bella, G.; De Marchis, M. Perforated Baffles for the Optimization of Disinfection Treatment. Water 2020, 12, 3462. https://doi.org/10.3390/w12123462
AMA Style
Bruno P, Di Bella G, De Marchis M. Perforated Baffles for the Optimization of Disinfection Treatment. Water. 2020; 12(12):3462. https://doi.org/10.3390/w12123462
Chicago/Turabian StyleBruno, Paolo, Gaetano Di Bella, and Mauro De Marchis. 2020. "Perforated Baffles for the Optimization of Disinfection Treatment" Water 12, no. 12: 3462. https://doi.org/10.3390/w12123462
Note that from the first issue of 2016, this journal uses article numbers instead of page numbers. See further details here.