Genome-Resolved Metagenomics and Antibiotic Resistance Genes Analysis in Reclaimed Water Distribution Systems


Water Desalination and Reuse Center, Division of Biological and Environmental Science and Engineering, King Abdullah University of Science and Technology, Thuwal 23955-6900, Saudi Arabia
*
Author to whom correspondence should be addressed.
Water 2020, 12(12), 3477; https://doi.org/10.3390/w12123477
Submission received: 19 October 2020
/
Revised: 7 December 2020
/
Accepted: 8 December 2020
/
Published: 10 December 2020
(This article belongs to the Section Wastewater Treatment and Reuse)
Abstract
:Water reuse is increasingly pursued to alleviate global water scarcity. However, the wastewater treatment process does not achieve full removal of biological contaminants from wastewater, hence microorganisms and their genetic elements can be disseminated into the reclaimed water distribution systems (RWDS). In this study, reclaimed water samples are investigated via metagenomics to assess their bacterial diversity, metagenome-assembled genomes (MAGs) and antibiotic resistance genes (ARGs) at both point of entry (POE) and point of use (POU) in 3 RWDS. The number of shared bacterial orders identified by metagenome was higher at the POE than POU among the three sites, indicating that specific conditions in RWDS can cause further differentiation in the microbial communities at the end of the distribution system. Two bacterial orders, namely Rhizobiales and Sphingomonadales, had high replication rates in two of the examined RWDS (i.e., site A and B), and were present in higher relative abundance in POU than at POE. In addition, MAG and ARG relative abundance exhibited a strong correlation (R2 = 0.58) in POU, indicating that bacteria present in POU may have a high incidence of ARG. Specifically, resistance genes associated with efflux pump mechanisms (e.g., adeF and qacH) increased in its relative abundance from POU to POE at two of the RWDS (i.e., site A and B). When correlated with the water quality data that suggests a significantly lower dissolved organic carbon (DOC) concentration at site D than the other two RWDS, the metagenomic data suggest that low DOC is needed to maintain the biological stability of reclaimed water along the distribution network.

1. Introduction
Water scarcity is predicted to affect at least 45 countries worldwide by the year 2050 [1]. To alleviate water scarcity, alternative water resources like treated wastewater are increasingly being used for both indirect potable (e.g., drinking water in Singapore and California) and non-potable (e.g., irrigating agricultural crops in California) purposes. Prior to reuse, wastewater is conventionally treated through multiple barriers comprising of various technologies, for example clarifiers, activated sludge tanks, sand filters, and/or disinfection. Depending on the reuse purpose, local guidelines allow permissible levels of biochemical oxygen demand (BOD5, an indicator of organic carbon content), total suspended solids (TSS) and pH in the reuse water. For example, the United States Environmental Protection Agency (US-EPA) suggests ≤ 10 mg/L BOD5 and 2 NTU (for turbidity) in treated wastewater to be used for surface or spray irrigation of any food crops [2].
In addition to the presence of organic carbon and nutrients, treated wastewater still contains remnant microorganisms, with reported concentrations varying from 104 to 106 per L of treated wastewater depending on the log removal values achieved by the wastewater treatment plant (WWTP) [3]. Genetic elements associated with the microorganisms are also present due to both the upstream WWTP unable to remove them effectively or because of microbial die-off events that resulted in the dissemination of these elements [4].
The treated wastewater, including remnant microbial and chemical contaminants, is transported through distribution networks to either water reclamation plants for further treatment before it can be reused as potable water, or directly to the point-of-use (POU) (e.g., agricultural fields). In both instances, the treated wastewater may be transported over long distances depending on the spatial proximity between the WWTP and POU. Since organic carbon, nutrients and microorganisms are present, those portions of microorganisms that remain viable may regrow throughout the distribution network [5,6].
To mitigate microbial regrowth in the distribution system, residual chlorine is usually added as an oxidizing agent to impose antibacterial effect [7]. For example, in instances where the treated wastewater is used for irrigation of food crops, residual chlorine was suggested to be maintained at an optimal level of ≥1 mg/L to prevent microbial regrowth [2]. However, ammonia and organics can impose chlorine demand which would mean less residual chlorine is available to suppress microbial regrowth. The use of chlorine at the sublethal dosage can also co-select for antibiotic resistance genes (ARGs) [8,9]. Therefore, concerns arise when certain pathogenic species and/or other detrimental functional genes (e.g., antibiotic resistance genes) increase in relative abundance from the distribution point of entry (POE) to the POU. To illustrate, viable pathogenic species present in reclaimed waters can infect workers or consumers through accidental exposure, while functional genes can potentially be transformed into naturally competent soil bacterium to gain new functional gene traits [10].
Therefore, monitoring reclaimed water for both its bacterial community and functional diversity at both POE and POU would provide insights into potential changes in reclaimed water quality [11]. In recent years, an increasing number of studies has demonstrated the use of metagenomics to assess changes in bacteria, virus and gene diversity in various types of ecosystems. The strength of metagenomics is that it can generate a large dataset in a short time. With sufficient sequencing depth, one is able to provide comprehensive information related to bacteria, virus and genes present in the sample. To illustrate, bulk water samples from different reclaimed water distribution systems (RWDS) were collected, and ARGs abundance and diversity were analyzed through metagenomics [12]. Garner et al. observed that bacterial community was weakly correlated with ARGs. Instead, strong correlations were noted between 193 ARGs and plasmid-associated genes, suggesting that reclaimed water may be a potential source for disseminating plasmid-encoded ARGs at POU. A follow-up study further used quantitative PCR (qPCR) and metagenomics to identify opportunistic pathogens that are present in reclaimed water [13]. However, earlier studies only focused on characterizing the resistome and did not correlate the presence of these resistance genes to the microbial communities. In addition, changes in the microbial communities from POE to POU were not profiled. Additional bioinformatic analysis (for instance, genome binning) can be applied to provide additional insights into these two areas.
In this study, we downloaded the metagenomic sequencing data from the three RWDS (i.e., sites A, B and D) studied by Garner and et al., and reanalyzed the data through advanced genome-resolved metagenomic pipelines that can elucidate alterations in ARGs along with bacterial community from POE to POU. Specifically, metagenome assembled genomes (MAGs) was performed to determine relative abundance of each MAG, their replication indices, and the ARGs (including coverage and proportion of detection) in samples collected from POE vs. POU at each site. The assembly of contigs is anticipated to provide a better resolution of phylogenetic associations and at a potentially greater reliability than by only assigning identities to databases using only short reads. Subsequently, the water chemistry data made available by Garner et al. was used to determine correlation with changes in dynamics identified via metagenomics [12,13]. This study aims to demonstrate the use of metagenomics and appropriate bioinformatics to assess potential changes in reclaimed water quality.
2. Materials and Methods
2.1. Datasets Collection and Description
Datasets analyzed in this study are from an earlier publication [12], and include only those with sufficient sample size per study site to facilitate comparisons between POE and POU. Specifically, reclaimed bulk water samples were collected in three different reclaimed water distribution systems (RWDS), namely sites A, B and D. Overview for the WWTPs of three sites were as described, and all three WWTPs used chlorine or monochloramine as disinfectants [12]. At each site, water samples at POE and POU were first flushed for 30 s and collected in sterile 1 L polypropylene containers. All bottles were prepared with 48 mg sodium thiosulfate per liter to quench chlorine, and with 292 mg ethylenediaminetetraacetic acid per liter to chelate metals. Collected water samples were shipped overnight on ice and processed immediately upon arrival within 24 h [12]. Water chemistry measurement was as described [12]. Reclaimed water samples were concentrated by filtration (0.22 μm filter) and DNA was extracted from filter by FastDNA SPIN Kit (MP Biomedicals, Solon, OH, USA) [12]. Shotgun metagenomic sequencing for reclaimed water samples was conducted on Illumina HiSeq with 2 × 100-cycle paired end reads [12]. All sequenced datasets above 100 MB (23 in total) were downloaded from MG-RAST [14] in fasta format with the respective sample ID number shown in Supplementary Table S1, and all these datasets were pretreated by Garner et al., including adapter trimming, denoising and removal of sequencing artifacts. Specifically, a total of 11 POE and 12 POU samples were downloaded.
2.2. Identification of Bacterial Community Compositions and Metagenome Assembled Genomes (MAG)
Phylogenetic identification of the bacterial community of each sample was conducted by MetaPhlAn (3.0) [15] with default parameters. Output metagenome description tables were filtered according to taxonomical level of order. Non-metric multidimensional scaling (nMDS) of each sample was created by ggplot2 [16] packages in R. Heatmap of samples were created by ComplexHeatmap [17] packages in R. Average relative abundance of bacterial orders were computed. Bacterial orders with average relative abundance above 0.5% were defined as positive detection, and the Shannon’s diversity index for bacterial community in each water sample were computed by Vegan package [18] in R. Coefficient for linear regression between POU diversity index and water chemistry parameters were computed to establish correlation between water quality and microbiome. Bacterial orders detected from all three sampling sites (i.e., A, B, D) of sample type (i.e., POE, POU) were defined as shared bacterial order, indicating they are commonly detected in our sampling sites. A Venn diagram created by InteractiVenn [19] was performed for the detected bacterial orders across POE or POU samples.
Assembly was performed for all 23 samples independently using MEGAHIT (1.1.4) [20] with default parameters. Assembled contigs were conducted to genome binning on Anvi’o (6.2) [21]. Long contigs (>1 kbp) were filtered to perform read-mapping information on original sequenced datasets by Bowtie2 [22] and Samtools [23]. Bacterial single-copy genes of datasets were scanned by HMMER (3.3) [24] to estimate the genome completeness and redundancy throughout the binning process. Open-reading frames (ORF) of contigs were predicted by prodigal (2.6.3) [25], and functions (from database National Center for Biotechnology Information (NCBI) COGs [26]) related to the ORFs were annotated by DIAMOND (0.9.14) [27]. The taxonomy were assigned by Centrifuge (1.0.3-beta) [28]. Genome binning was first performed by Metabat2 (2.12.1) [29] and then manually performed on Anvi’o [21] relying on completeness and contamination parameters computed by HMMER (3.3) [24]. Genome bins that showed >50% completion and with <10% redundancy was exported from Anvi’o [21]. Quality of exported genome bins was evaluated by CheckM (1.0.9) [30] to further filter out those with >70% completeness and <10% contamination criteria within lineage-specific workflow. Genome bins that passed the abovementioned criteria were clustered within each sampling site for comparison and dereplication by dRep (1.4.3) [31]. The criteria used include those with 90% average nucleotide identity (ANI) in primary clustering, 99% ANI in secondary clustering and 70% coverage of the larger genome in each pairwise comparison. These dereplicated genome bins were termed as final “metagenome assembled genomes (MAGs)” and they were classified by GTDB-Tk (1.0.2) [32].
2.3. Relative Abundance and Indices of Replication of Metagenome Assembled Genomes
Short sequencing reads derived from the samples were mapped to MAGs by Bowtie2 [22] using default settings. Read mapping files were input into mapped.py (https://github.com/christophertbrown/bioscripts/blob/master/ctbBio/mapped.py) to select mappings with ≤1 mismatch. Recovered read mapping files and MAGs were imported into Anvi’o [21] to calculate the ‘mean coverage Q2Q3′ (defined as average depth of coverage across contig excluding nucleotide positions with coverage values falling outside of the interquartile range for that contig) as relative abundance of MAGs in samples. Read mapping files were also used to calculate the indices of replication (iRep value) [33] for each MAG in samples with default settings. The iRep is a quantitative measurement based on the function of both the percentage of the population that is replicating, and the number of simultaneous replication events [33], with values ≥1.5 defined as replication.
2.4. Antibiotic Resistance Gene Detection for MAGs and Read Contigs
Contigs in MAGs were translated into protein sequences and annotated by Prokka (1.13) [34]. Nucleotide sequence of proteins were exported to detect antibiotic resistance genes (ARGs) via Resistance Gene Identifier (RGI) (https://card.mcmaster.ca/analyze/rgi) [35] against CARD [35] database with ‘perfect and strict hits only’ and ‘high quality/coverage’ criteria. Heatmap of MAGs analysis including MAG relative abundance, indices of replication and ARG contents were created by ComplexHeap [17] packages in R.
Results from RGI [35] were also collated with Prokka [34] predicted protein sequence as the input for tag ‘external-gene-calls’ in Anvi’o [21]. Collated nucleotide sequences were imported to build up Anvi’o [21] analysis input with tag ‘ignore-internal-stop-codons’. Short reads of MAG from each water sample were extracted by Samtools [23] and they were mapped to nucleotide sequences of ARG by Bowtie2 [22]. Results were imported into Anvi’o [21] to compute the proportion of detection and coverage of ARGs across samples. Dotplots for ARG in each utility were created by Tidyverse [36] and Cowplot [37] packages in R. Correlation between ARG coverage of each MAG and MAG coverage of each sample were computed and plotted by ggplot2 [16].
Entire assembled read contigs of water sample were also analyzed for ARGs. These assembled read contigs do not form into MAGs, and were analyzed separately for this purpose in similar manner as that described earlier for MAGs. Student’s t-test (α = 0.05) was applied to determine the significant difference for ARG coverage between POE and POU.
2.5. Horizontal Gene Transfer Detection for ARGs from MAGs
Plasmids from contigs in MAGs were identified by PlasFlow [38] with threshold of 0.95. ARGs in plasmids were detected via RGI [35] against CARD [35] database with ‘perfect and strict hits only’ and ‘high quality/coverage’ criteria. Mobile genetic elements (MGEs) from contigs in MAGs were detected by BLASTX [39] against ACLAME [40] database with E-value 1 × 10⁻¹⁰. Contigs with MGEs were collated to detect ARGs via RGI [35] against CARD [35] database with ‘perfect and strict hits only’ and ‘high quality/coverage’ criteria.
2.6. Statistical Analyses for Water Chemistry Data
Water chemistry data of reclaimed water was derived from the earlier study by Garner et al. [12] Ten parameters, namely temperature, total chlorine, free chlorine, pH, turbidity, conductivity, dissolved oxygen concentration, total organic carbon, dissolved organic carbon and biodegradable dissolved organic carbon were measured. ANOVA (analysis of variance) [41] was applied to determine significant variable parameters through F-test with 95% confidence interval in global level.
3. Results and Discussion
3.1. Water Quality across Different Utility
A comparison of the water quality measured showed that site D has the lowest level of dissolved organic carbon (DOC), while other water quality parameters do not differ significantly from at least one or two of the other sites (Table 1). In contrast, site A has a significantly higher water temperature and higher pH than the other two sites. The total chlorine measured at site A was also significantly lower, while site B has significantly higher free chlorine. However, all measured forms of organic carbon at site B (i.e., TOC, DOC, BDOC) were significantly higher than the other two sites. The conductivity and dissolved oxygen concentration in site B were also significantly lower than that measured at sites A and D. Considering all parameters, especially DOC, this suggests that reclaimed water quality at site D may be better than that in site A and B.
A previous study revealed that microbial communities in ecosystems exposed to reclaimed water experienced significant shifts due to the presence of organic carbon contents [42]. In addition, the frequency of detecting E. coli and total coliforms increases in positive correlation with higher assimilable organic carbon content. It was further reported that chlorination can increase the level of BDOC by ca. 25 ± 16% and enhance the potential for microbial regrowth in the distribution networks. [43] It is therefore hypothesized that variation in the water quality observed among three sites, especially for variation of DOC, will likely account for differences in bacterial populations from POE to POU at these three sites. This is further elucidated by metagenome-assembled genome (MAGs) and annotations of the functional genes described in the following subsections.
3.2. Bacterial Composition across Different Samples and Sites
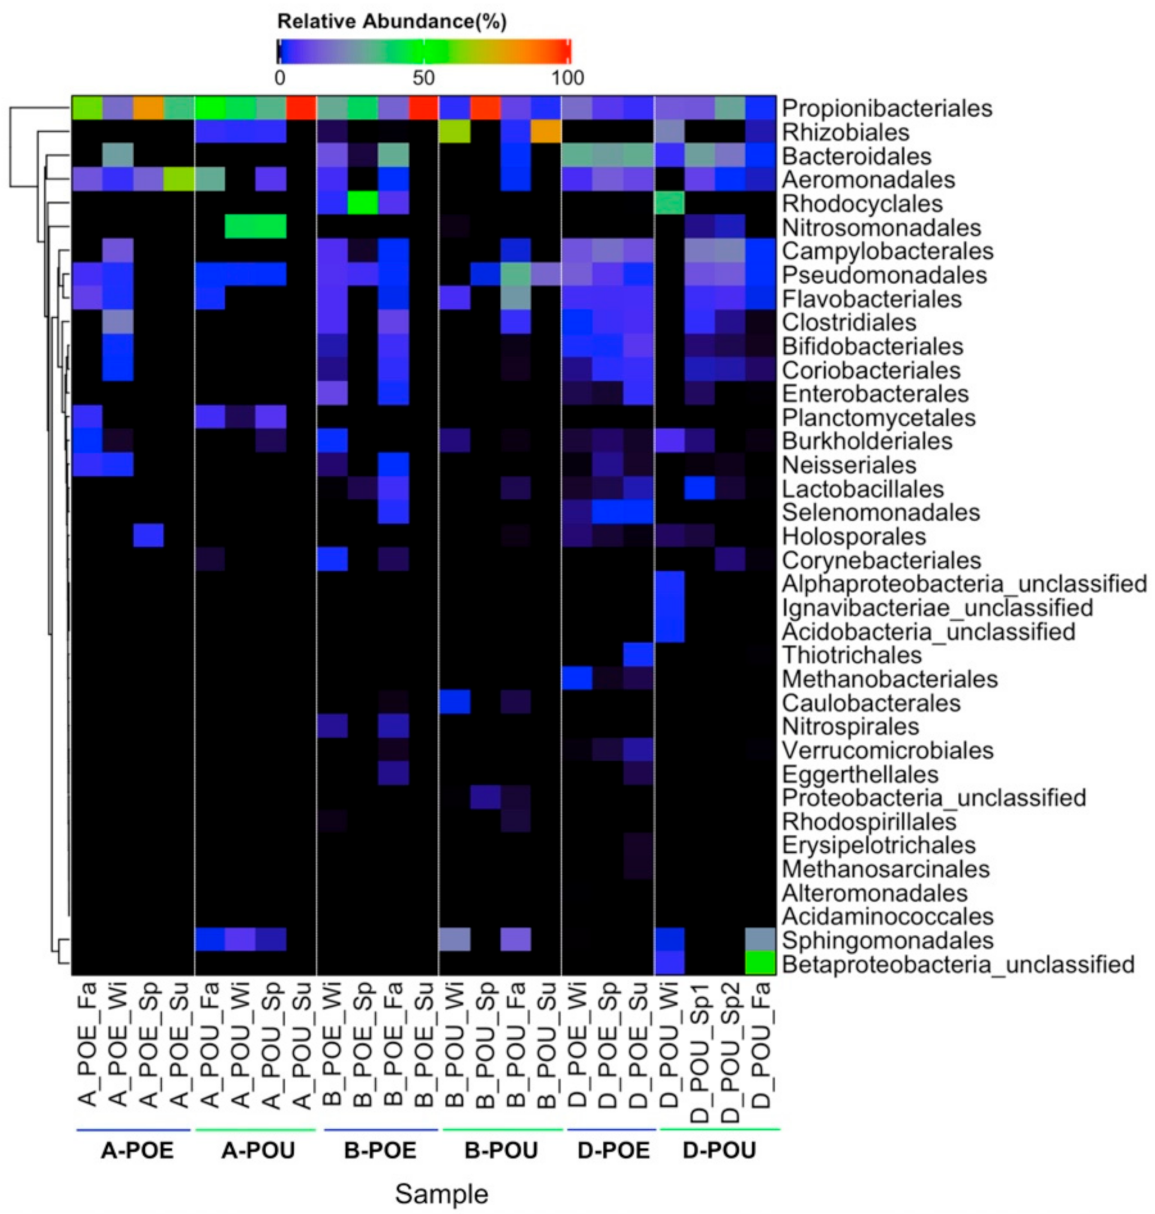
Based on MetaPhlAn, 37 bacterial orders were detected from the 23 bulk water samples. Detected bacteria were clustered into six groups based on sites (i.e., A, B and D) and type (i.e., POE vs. POU) (Supplementary Figure S1). Based on the average of the Shannon’s diversity index of each group, bacterial community became less diverse in POU compared to POE (Supplementary Table S2). Five bacterial orders: Propionibacteriales, Rhizobiales, Sphingomonadales, Pseudomonadales and Flavobacteriales were detected at average relative abundance above 0.5% in POU samples of all three sampling sites (Table 2). The number of shared bacterial orders were higher in the POE than POU samples (Supplementary Figure S2), suggesting that each site has different operating and/or environmental conditions for their RWDS that differentiated the microbial communities across the sites at POU.
Propionibacteriales was the only one which was present ubiquitously in all POE and POU samples. Through comparison between POE and POU samples, most bacterial orders decreased in relative abundance at each site from POE to POU (Supplementary Table S2). However, Sphingomonadales and Rhizobiales were more abundant in POU samples for all three sampling sites, and Pseudomonadales and Flavobacteriales were present in higher relative abundance in POU than POE samples from site B (Figure 1). Some bacteria were not detected in all three sampling sites but they had higher relative abundance in POU sample from particular site. For example, Nitrosomonadales were more abundant in POU water of site A, and unclassified Betaproteobacteria was more abundant in only POU of site D (Supplementary Table S2). The earlier study that elucidated the bacterial community of same set of POU samples at phylum level also observed that the bulk water was mainly comprised of proteobacteria [13], for which both Rhizobiales and Sphingomonadales belong to.
The correlation analysis for chemistry data indicated three parameters: conductivity (R2 = 0.52), TOC (R2 = 0.57), DOC (R2 = 0.58) potentially correlated with bacterial diversity in POU samples (Supplementary Table S3). Comparing the changes in the relative abundance of bacterial order between POE and POU, water samples in site D did not change as much as that observed in site A and B (Figure 1) and may be more biologically stable along the RWDS. This can potentially be explained by the high total chlorine and relatively low DOC present in reclaimed water samples collected at site D than A and B (Table 1).
3.3. Metagenome Assembled Genomes (MAG) across Different Samples
There were in total 36 MAGs recovered from assembly of contigs (Supplementary Table S4) but only 24 MAGs had passed several criteria including quality evaluation and dereplication (Supplementary Table S5). These recovered MAGs were classified and annotated into 10 different bacterial orders, namely Rhizobiales, Sphingomonadales, Flavobacteriales, Caulobacterales, Burkholderiales, Obscuribacterales, Planctomycetales, Mycobacteriales, Gemmatimonadales and Levybacterales (Supplementary Table S6).
There are three parameters applied to investigate those MAGs: log10 of mean coverage Q2Q3 per 10 million reads to denote the relative abundance of MAG; replication indices (iRep [33] value) as the replication rate of each MAG; detection of ARG by RGI [35] against CARD [35] database as the antibiotic resistance associated with the MAG.
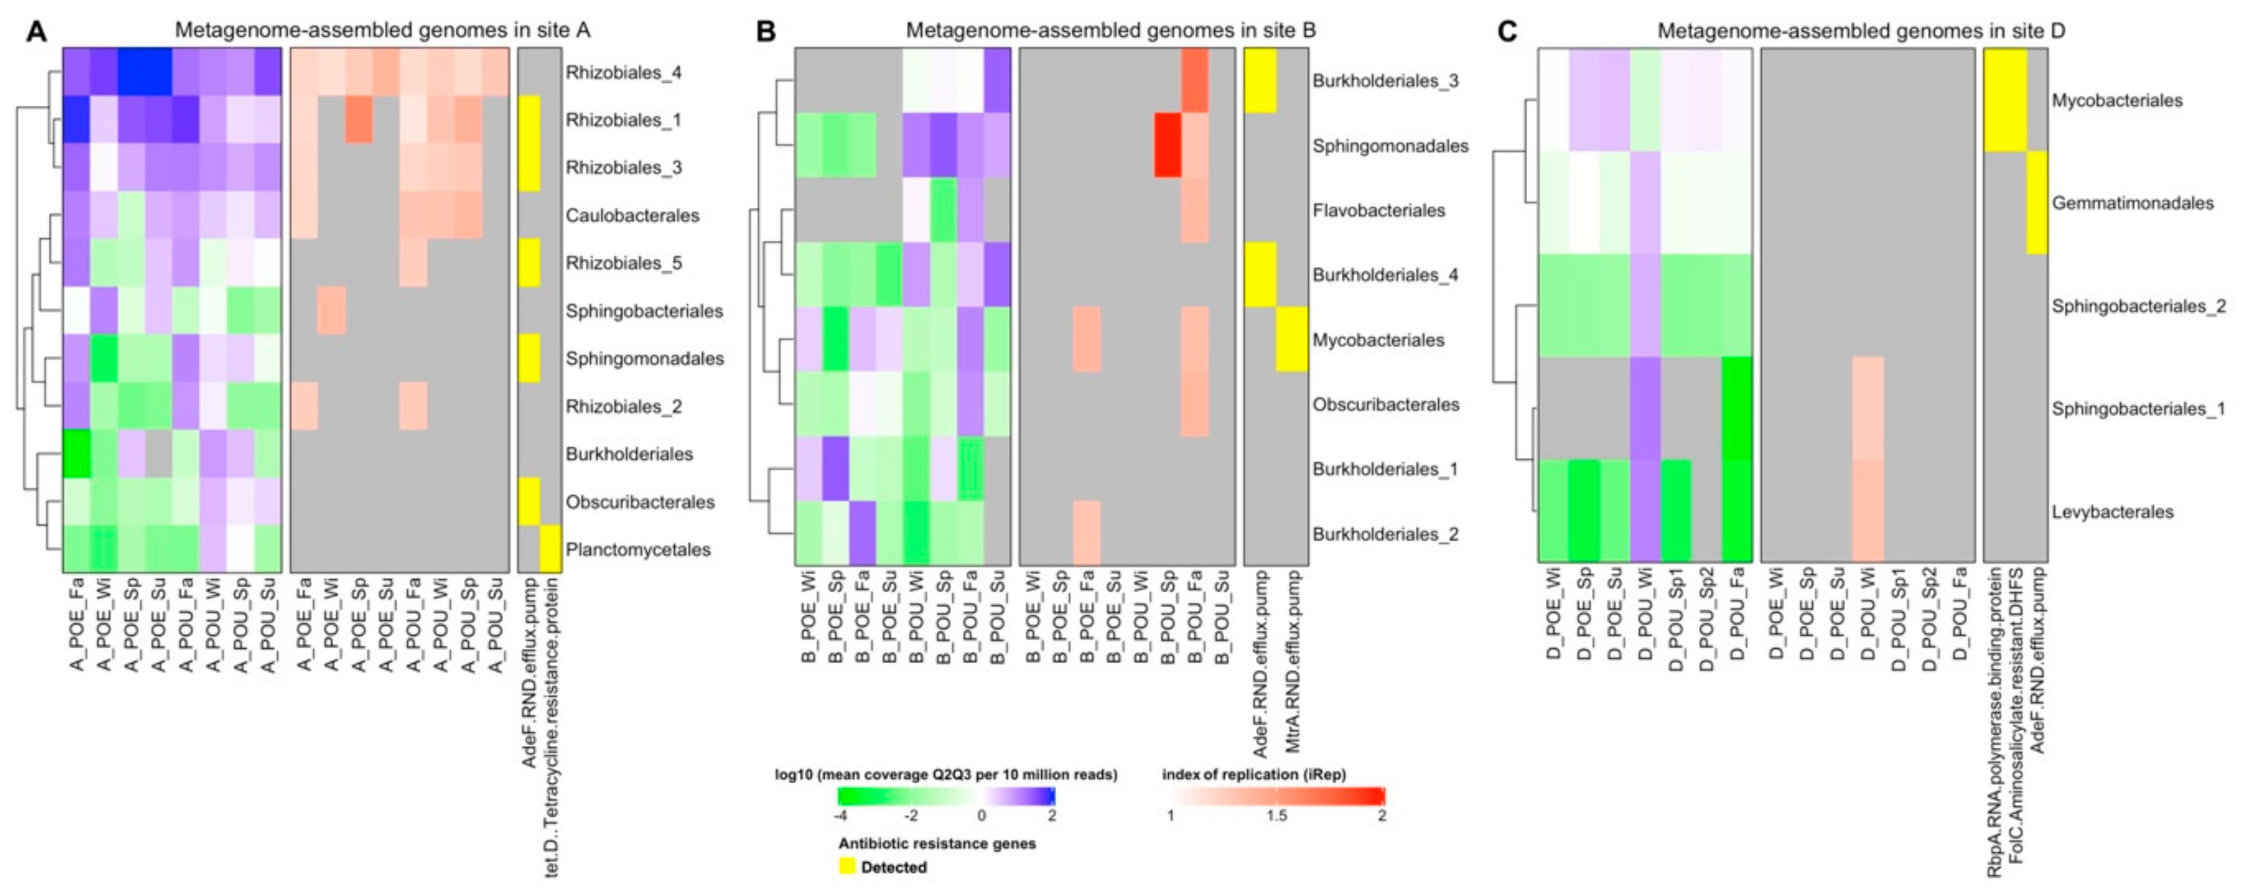
Through the comparison between POE and POU samples in each site (Figure 2), it was observed that three Rhizobiales MAGs in site A (Rhizobiales_1, Rhizobiales_3, Rhizobiales_4) had consistently high coverage across both POE and POU samples (Figure 2A). Five MAGs in site A (Sphingomonadales, Rhizobiales_2, Burkholderiales, Obscuribacterales, Plancotomycetales) and four MAGs in site B (Burkholderiales_3, Sphingomonadales, Flavobacteriales, Burkholderiales_4) had higher coverage across POU samples than POE samples (Figure 2B, Supplementary Table S7). In contrast, relatively fewer MAGs with high coverage were identified at site D except for a single sample: ‘D_POU_Wi’ (Figure 2C).
The replication rates of MAGs were evaluated by iRep value, and most MAGs had little or low replication process (iRep value < 1.5). However, three MAGs were detected with iRep above 1.5, namely Rhizobiales_1 in sample A_POE_Sp, Burkholderiales_3 in sample B_POU_Sp and Sphingomonadales in sample B_POU_Fa (Figure 2, Supplementary Table S7). Rhizobiales was also reported as a member of consistent microbial community in reclaimed water microbiome [44]. In this instance, the iRep value suggests they were actively replicating in water samples. Our observations of these MAGs and their high iRep values agree with that reported by a separate study, which successfully isolated viable Sphingomonas and Flavobacterium from reclaimed water systems. [45] Specifically, Sphinogomonas and Flavobacterium regrew and remain viable after the wastewater treatment process by utilizing various sources of organic carbon (e.g., polymers, carbohydrates, esters) that are present in the reclaimed water [45].
In summary, we identified fewer MAGs in site D. On the contrary, site A and site B identified MAGs with active replication in POU samples (Sphingomonadales and Burkholderiales_3 in site B), reiterating that the RWDS of site D is likely more biologically stable than that in Site A and B. Considering that site A and B had higher DOC than site D (Table 1) and DOC has relatively high correlation (R2 = 0.58) with bacterial diversity in POU samples, the DOC may have contributed to the observed regrowth of Rhizobiales, Sphingomonadales and Burkholderiales in site A and B.
The detection of ARG in MAGs was based on RGI [35] with ‘perfect and strict hits only’ criteria as quality control (Supplementary Table S8). Five ARGs from four AMR (antimicrobial resistance) gene families: RND efflux pump (adeF; mtrA), tetracycline resistance (tet(D)), RNA polymerase binding protein (rbpA), and amino-salicylate resistant dihydropteroate synthase (folC) were detected. Specifically, adeF was detected in 8 MAGs across all three sites.
Two parameters, namely the proportion of detection and coverage per 10 million reads, were applied to describe the relative abundance of detected ARGs in MAGs. It was observed that these two parameters related to ARGs varied across POE/POU samples and across sampling sites (Supplementary Table S9, Supplementary Figure S3). In site A, five MAGs from three bacterial orders (Rhizobiales_1, Rhizobiales_3, Rhizobiales_5, Sphingomonadales, Obscuribacterales) were detected positive with adeF. AdeF was present in high relative abundance in three Rhizobiales MAGs of POE and POU samples. It was only detected in MAGs associated with Sphingomonadales, Obscuribacterales of POU samples (Supplementary Figure S3A). This suggests different bacterial orders were acting host to the same resistance gene adeF at different points of the distribution network, and that a mere correlation or network analysis of ARG with bacterial orders derived from short-read annotation analysis of metagenomics data like that performed in earlier studies [46,47] may not depict accurately which bacterial population is associated with that specific ARG.
In site B, adeF from two Burkholderiales MAGs were detected with high coverage in POU samples, while another ARG, mtrA, which is also an RND efflux pump, was not detected with high coverage in POU samples of Mycobacteriales (Supplementary Figure S3B). In site D, ARGs had much lower coverage than those in site A and site B, but adeF was still detected in Gemmatimonadales from sample D_POU_Wi (Supplementary Figure S3C).
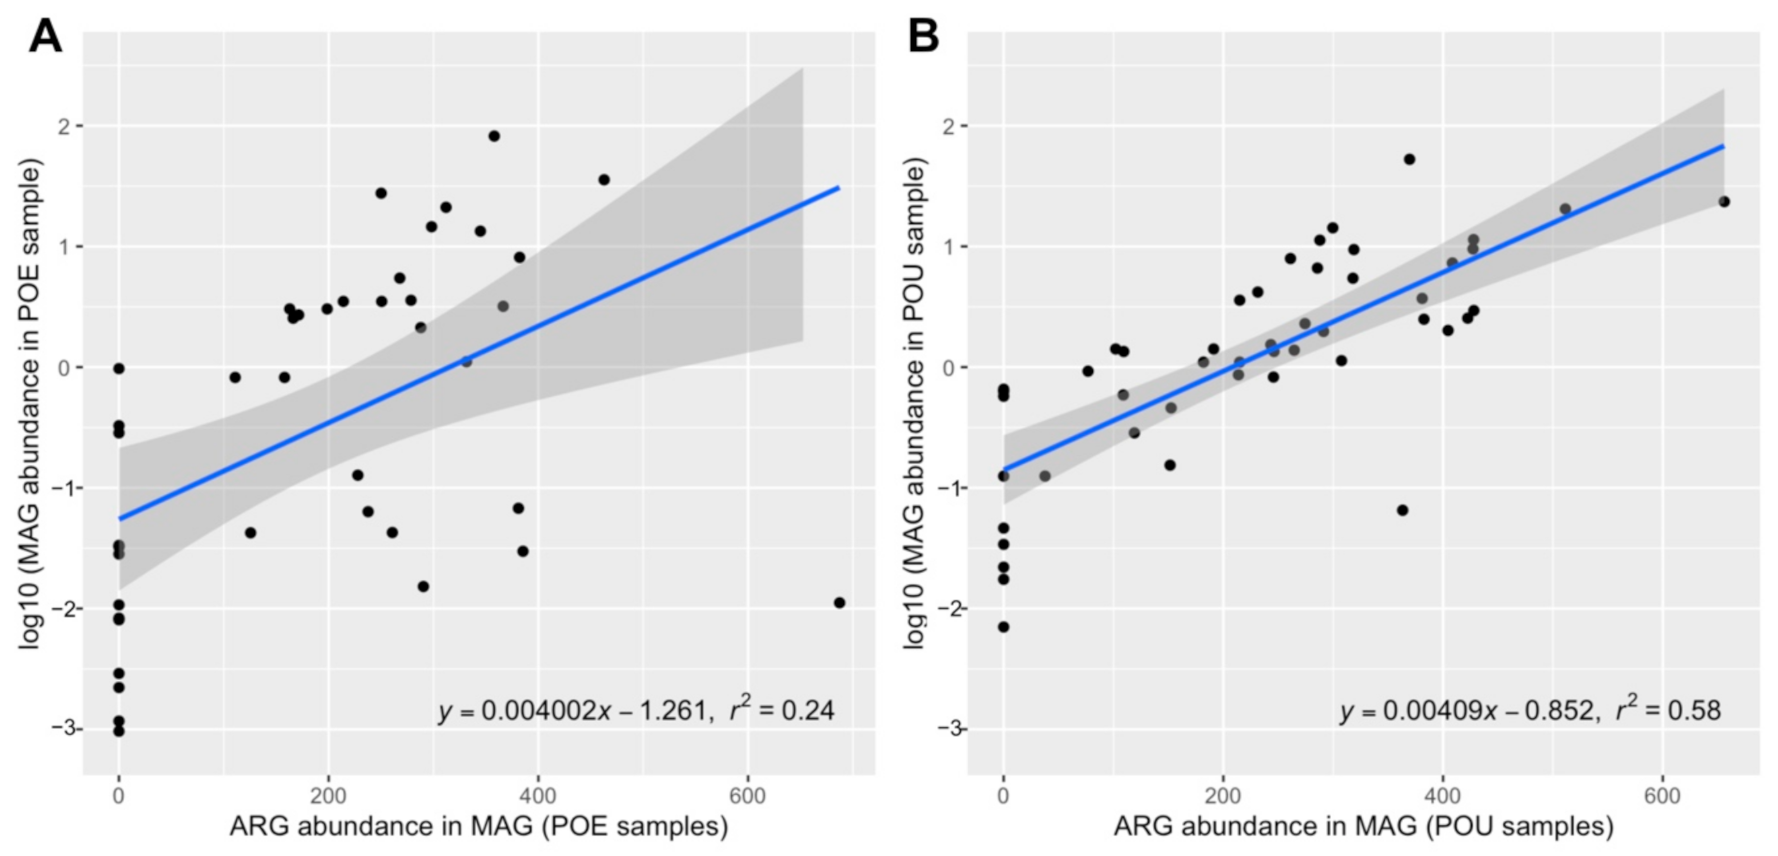
Correlation between ARG relative abundance (coverage per 10 million reads) in MAGs and MAGs’ relative abundance (log10 of mean coverage Q2Q3) in POE and POU samples were obtained (Figure 3). A weakly positive correlation was observed in POE samples (R2 = 0.24), suggesting ARGs have very weak association with bacterial populations in the POE samples. Furthermore, a positive correlation was observed in POU samples (R2 = 0.58). This indicates that bacterial populations present in the POU samples may be more associated with ARGs than that in POE samples. In addition, analysis of bacterial composition revealed bacterial communities in POE was more diverse than that in POU samples (Supplementary Table S2). Considering that POE and POU had similar depth in terms of metagenome sequencing data, this might account for why it was harder to identify ARG features in POE MAGs and to establish a strong correlation.
Lastly, a large number of mobile genetic elements were detected in MAG contigs (Supplementary Table S10), but none of the ARGs were detected near to the flanking regions of these contigs, suggesting no clear evidence of horizontal transfer of ARGs.
In summary, through a genome-resolved approach that was based on MAGs, ARGs and MGEs associated with bacteria were evaluated and in turn provided a more in-depth characterization across both POE and POU of three RWDS compared to the earlier studies.
3.4. ARG Performance across Water Samples
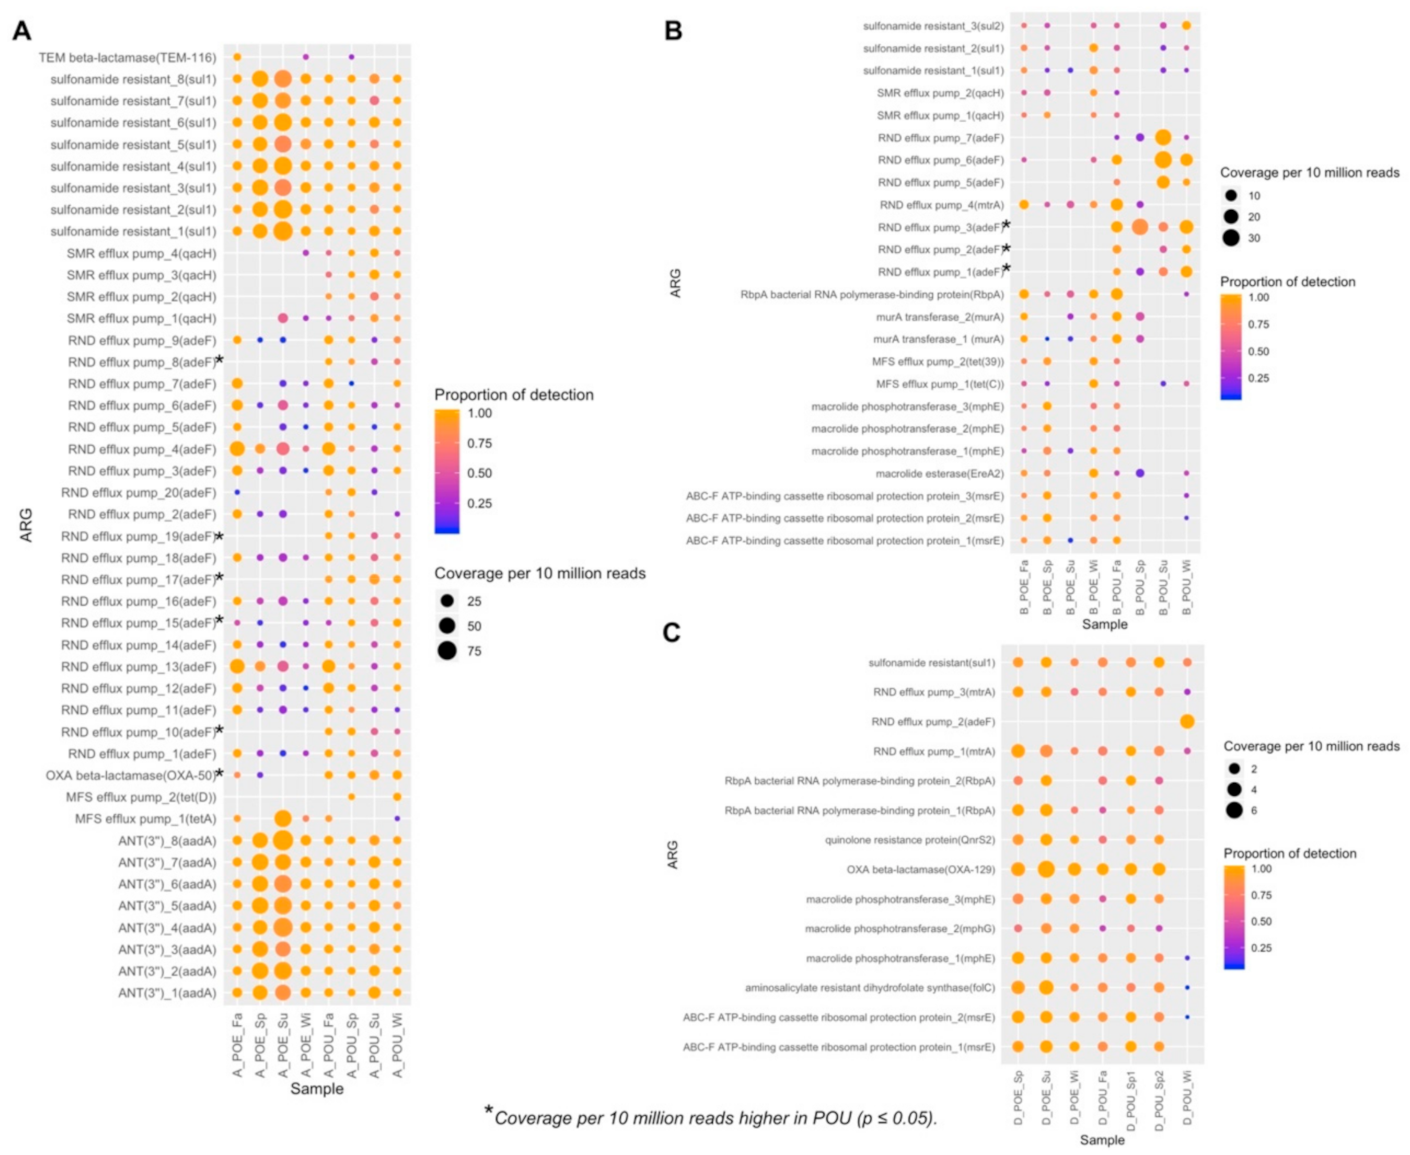
Besides correlating ARG relative abundance with MAGs, we also detected ARGs from assembled contigs by RGI [35] and evaluated ARG relative abundance in each sample (Figure 4) to provide an evaluation of metagenome-resolved ARGs. Detailed information on the detected ARGs are listed in Supplementary Table S11, and the detected coverage and proportion of detection for the ARGs are listed in Supplementary Table S12.
In utility A (Figure 4A), 44 ARGs from 7 AMR gene families were detected, and they were dominated by adeF (RND efflux pump), at a relative abundance of 45.5% across all detected ARGs. Through student’s t-test (α = 0.05), 5 adeF: RND efflux pump_8 (p-value = 0.001); RND efflux pump 10 (p-value = 0.01); RND efflux pump_15 (p value = 0.04); RND efflux pump_17 (p-value = 0.04); RND efflux pump_19 (p-value = 0.001) and 1 OXA-50 (p-value = 0.004) were detected with greater coverage in POU than POE. In contrast, all the other ARGs were not detected with significant change in their coverage (Figure 4A).
In utility B (Figure 4B), 24 ARGs were identified from 9 AMR families. The majority of the detected AMR families was predominantly detected in POE samples. However, through student’s t-test (α = 0.05), 3 adeF: RND efflux pump_1 (p-value = 0.04); RND efflux pump_2 (p-value = 0.03); RND efflux pump_3 (p-value = 0.01) had higher coverage in POU samples at this site.
In utility D (Figure 4C), 14 ARGs from 8 AMR families were identified, with coverage that did not vary differently across POE and POU samples. This is with the exception of adeF gene, which had a high coverage and was detected only in sample ‘D_POU_Wi’. Through student’s t-test (α = 0.05), no ARG had higher coverage in POU samples at this site.
From results of Garner et al., three ARGs (sul1, blaTEM, qnrA) were elevated in POU samples than potable samples [12]. Although potable water samples were excluded in our analysis, we still observed adeF with increased relative abundance in POU samples in sites A and B (Figure 4). Most ARGs detected in our study at the POU samples are associated with the efflux pump mechanisms (e.g., adeF, qacH and tetD), similar to what was also observed in reclaimed water irrigation networks located in China [48]. The reason to account for this relative ubiquity of efflux pump-associated ARGs in reclaimed water at different geographical locations is unknown. However, we postulate that it might be due to chemical stressors that had favored for the enrichment of efflux pump mechanisms. For example, site B has the highest free chlorine level measured among the three sites (Table 1). Coincidentally, gene copies of tetZ, which was associated with efflux pump mechanism, when normalized against 16S rRNA gene copies, was also reported to increase by more than 17-fold after chlorination of final treated wastewater [49]. A proposed mechanism for bacteria to survive oxidative stress is through up-regulation of the efflux pumps to maintain an acceptable intracellular concentration of the reactive oxidative species [50,51]. This may in turn result in the enrichment of ARGs associated with efflux pump mechanisms at site B. Alternatively, although concentrations of antibiotic residues and heavy metals in the reclaimed water were not measured, efflux pump mechanisms can also be co-selected by these chemical stressors that are present.
4. Conclusions
In summary, this study demonstrates the use of metagenomics and relevant bioinformatics to assess reclaimed water quality along the distribution networks. Specifically, a combination of both genome-resolved and metagenome-resolved approaches was used to determine which bacterial order and their ARGs had increased relative abundance from POE to POU. By coupling the data derived from metagenomics with water quality measurements, the results obtained from this study imply that the water quality remain as an important parameter to monitor in a RWDS. Better water quality, especially a low DOC, could be essential to maintain biologically stabile reclaimed water. This is based on the observation that a relatively higher concentration of DOC can account for the regrowth of Rhizobiales and Sphingomonadales along the RWDS of A and B. In addition, ARGs that work based on efflux pump mechanisms were widely detected in reclaimed water. In particular, adeF was detected in increased relative abundance from POE to POU samples across RWDS of A and B and in one POU sample collected from D. As water reuse rates increase globally, metagenomics and analysis like that demonstrated in this study can be used to provide non-targeted and comparative analysis of the bacterial diversities along the distribution networks, in turn providing information on the reclaimed water quality to facilitate safe reuse.
Supplementary Materials
The following are available online at https://www.mdpi.com/2073-4441/12/12/3477/s1, Figure S1: Bacterial community (order level) similarity by sample type and sampling site, Figure S2: Venn diagram depicting the number of unique and shared bacterial orders, Figure S3: Coverage and proportion of detection for ARG across MAGs, Table S1: List of shotgun metagenomics sequenced samples analyzed in this study, Table S2: Average relative abundance of detected bacterial order, Table S3: Correlation coefficient between POU bacterial diversity (Shannon index) with water chemistry, Table S4: List of high quality recovered metagenome-assembled genomes (MAGs), Table S5: List of dereplicated MAGs, Table S6: Classification for MAGs, Table S7: Information on MAGs, Table S8: List of antibiotic resistance genes from MAGs, Table S9: Information on ARGs in MAGs, Table S10: Annotation for mobile genetic elements in MAGs, Table S11: Information on ARG detection in water samples by location, Table S12: Information on ARG coverage and proportion of detection in water samples.
Author Contributions
Conceptualization, C.W. and P.-Y.H.; methodology, C.W.; formal analysis, C.W.; resources, P.-Y.H.; writing—original draft preparation, C.W.; writing—review and editing, C.W. and P.-Y.H.; supervision, P.-Y.H.; funding acquisition, P.-Y.H. All authors have read and agreed to the published version of the manuscript.
Funding
This research was funded by KAUST baseline funding BAS/1/1033-01-01 awarded to P.-Y. Hong.
Acknowledgments
The authors would like to acknowledge Amy Pruden and Emily Garner for providing the datasets and additional information pertaining to the samples.
Conflicts of Interest
The authors declare no conflict of interest.
References
- Boretti, A.; Rosa, L. Reassessing the projections of the World Water Development Report. NPJ Clean Water 2019, 2, 2. [Google Scholar] [CrossRef]
- Jimenez, B.; Asano, T. Water Reuse: An International Survey of current practice, issues and needs. Water Intell. Online 2015, 7. [Google Scholar] [CrossRef]
- Hong, P.-Y.; Wang, C.; Mantilla-Calderon, D. Mitigating Antimicrobial Resistance Risks When Using Reclaimed Municipal Wastewater for Agriculture. In Antibiotic Resistance in the Environment: A Worldwide Overview; Springer Nature: Cham, Switzerland, 2020; pp. 245–265. [Google Scholar]
- Hong, P.-Y.; Al-Jassim, N.; Ansari, M.I.; Mackie, R.I. Environmental and Public Health Implications of Water Reuse: Antibiotics, Antibiotic Resistant Bacteria, and Antibiotic Resistance Genes. Antibiotics 2013, 2, 367–399. [Google Scholar] [CrossRef] [PubMed] [Green Version]
- Lu, W.; Zhang, X.-J. Biological stability in drinking water: A regression analysis of influencing factors. J. Environ. Sci. 2005, 17, 395–398. [Google Scholar]
- Urgun-Demirtas, M.; Sattayatewa, C.; Pagilla, K.R. Bioavailability of Dissolved Organic Nitrogen in Treated Effluents. Water Environ. Res. 2008, 80, 397–406. [Google Scholar] [CrossRef] [PubMed]
- Bertelli, C.; Courtois, S.; Rosikiewicz, M.; Piriou, P.; Aeby, S.; Robert, S.; Loret, J.-F.; Greub, G. Reduced Chlorine in Drinking Water Distribution Systems Impacts Bacterial Biodiversity in Biofilms. Front. Microbiol. 2018, 9, 2520. [Google Scholar] [CrossRef] [Green Version]
- Lin, W.; Zhang, M.; Zhang, S.; Yu, X. Can chlorination co-select antibiotic-resistance genes? Chemosphere 2016, 156, 412–419. [Google Scholar] [CrossRef]
- Zhang, Y.; Gu, A.Z.; He, M.; Li, D.; Chen, J. Subinhibitory Concentrations of Disinfectants Promote the Horizontal Transfer of Multidrug Resistance Genes within and across Genera. Environ. Sci. Technol. 2017, 51, 570–580. [Google Scholar] [CrossRef]
- Aminov, R.I. Horizontal Gene Exchange in Environmental Microbiota. Front. Microbiol. 2011, 2, 158. [Google Scholar] [CrossRef] [Green Version]
- Hong, P.-Y.; Mantilla-Calderon, D.; Wang, C. Metagenomics as a Tool to Monitor Reclaimed-Water Quality. Appl. Environ. Microbiol. 2020, 86, 86. [Google Scholar] [CrossRef]
- Garner, E.; Chen, C.; Xia, K.; Bowers, J.; Engelthaler, D.M.; McLain, J.; Edwards, M.A.; Pruden, A. Metagenomic Characterization of Antibiotic Resistance Genes in Full-Scale Reclaimed Water Distribution Systems and Corresponding Potable Systems. Environ. Sci. Technol. 2018, 52, 6113–6125. [Google Scholar] [CrossRef]
- Garner, E.; McLain, J.; Bowers, J.; Engelthaler, D.M.; Edwards, M.A.; Pruden, A. Microbial Ecology and Water Chemistry Impact Regrowth of Opportunistic Pathogens in Full-Scale Reclaimed Water Distribution Systems. Environ. Sci. Technol. 2018, 52, 9056–9068. [Google Scholar] [CrossRef] [PubMed]
- Meyer, F.; Paarmann, D.; Souza, M.D.; Olson, R.; Glass, E.M.; Kubal, M.; Paczian, T.; Rodriguez, A.; Stevens, R.L.; Wilke, A.; et al. The metagenomics RAST server—A public resource for the automatic phylogenetic and functional analysis of metagenomes. BMC Bioinform. 2008, 9, 386. [Google Scholar] [CrossRef] [PubMed] [Green Version]
- Segata, N.; Waldron, L.; Ballarini, A.; Narasimhan, V.; Jousson, O.; Huttenhower, C. Metagenomic microbial community profiling using unique clade-specific marker genes. Nat. Methods 2012, 9, 811–814. [Google Scholar] [CrossRef] [PubMed]
- Wickham, H. Ggplot2: Elegant Graphics for Data Analysis; Springer: New York, NY, USA, 2009. [Google Scholar]
- Gu, Z.; Eils, R.; Schlesner, M. Complex heatmaps reveal patterns and correlations in multidimensional genomic data. Bioinformatics 2016, 32, 2847–2849. [Google Scholar] [CrossRef] [PubMed] [Green Version]
- Oksanen, J.; Blanchet, F.G.; Kindt, R.; Legendre, P.; Minchin, P.R.; O’hara, R.; Simpson, G.L.; Solymos, P.; Stevens, M.H.H.; Wagner, H. Package ‘vegan’. Community Ecol. Package Version 2013, 2, 1–295. [Google Scholar]
- Heberle, H.; Meirelles, G.V.; Da Silva, F.R.; Telles, G.P.; Minghim, R. InteractiVenn: A web-based tool for the analysis of sets through Venn diagrams. BMC Bioinform. 2015, 16, 1–7. [Google Scholar] [CrossRef]
- Li, D.; Liu, C.-M.; Luo, R.; Sadakane, K.; Lam, T.W. Megahit: An ultra-fast single-node solution for large and complex metagenomics assembly via succinct de Bruijn graph. Bioinformatics 2015, 31, 1674–1676. [Google Scholar] [CrossRef] [Green Version]
- Eren, A.M.; Esen, Ö.C.; Quince, C.; Vineis, J.H.; Morrison, H.G.; Sogin, M.L.; Delmont, T.O. Anvi’o: An advanced analysis and visualization platform for ‘omics data. PeerJ 2015, 3, e1319. [Google Scholar] [CrossRef]
- Langmead, B.; Salzberg, S.L. Fast gapped-read alignment with Bowtie 2. Nat. Methods 2012, 9, 357–359. [Google Scholar] [CrossRef] [Green Version]
- Li, H.; Handsaker, B.; Wysoker, A.; Fennell, T.; Ruan, J.; Homer, N.; Marth, G.; Abecasis, G.; Durbin, R.; 1000 Genome Project Data Processing Subgroup. The Sequence Alignment/Map format and SAMtools. Bioinformatics 2009, 25, 2078–2079. [Google Scholar] [CrossRef] [PubMed] [Green Version]
- Eddy, S.R. Accelerated Profile HMM Searches. PLoS Comput. Biol. 2011, 7, e1002195. [Google Scholar] [CrossRef] [PubMed] [Green Version]
- Hyatt, D.; Chen, G.-L.; Locascio, P.F.; Land, M.L.; Larimer, F.W.; Hauser, L.J. Prodigal: Prokaryotic gene recognition and translation initiation site identification. BMC Bioinform. 2010, 11, 119. [Google Scholar] [CrossRef] [PubMed] [Green Version]
- Tatusov, R.L.; Galperin, M.Y.; Natale, D.A.; Koonin, E.V. The COG database: A tool for genome-scale analysis of protein functions and evolution. Nucleic Acids Res. 2000, 28, 33–36. [Google Scholar] [CrossRef] [Green Version]
- Buchfink, B.; Xie, C.; Huson, D.H. Fast and sensitive protein alignment using diamond. Nat. Methods 2015, 12, 59–60. [Google Scholar] [CrossRef]
- Kim, D.; Song, L.; Breitwieser, F.P.; Salzberg, S.L. Centrifuge: Rapid and sensitive classification of metagenomic sequences. Genome Res. 2016, 26, 1721–1729. [Google Scholar] [CrossRef] [Green Version]
- Kang, D.D.; Li, F.; Kirton, E.; Thomas, A.; Egan, R.; An, H.; Wang, Z. MetaBAT 2: An adaptive binning algorithm for robust and efficient genome reconstruction from metagenome assemblies. PeerJ 2019, 7, e7359. [Google Scholar] [CrossRef]
- Parks, D.H.; Imelfort, M.; Skennerton, C.T.; Hugenholtz, P.; Tyson, G.W. CheckM: Assessing the quality of microbial genomes recovered from isolates, single cells, and metagenomes. Genome Res. 2015, 25, 1043–1055. [Google Scholar] [CrossRef] [Green Version]
- Olm, M.R.; Brown, C.T.; Brooks, B.; Banfield, J.F. dRep: A tool for fast and accurate genomic comparisons that enables improved genome recovery from metagenomes through de-replication. ISME J. 2017, 11, 2864–2868. [Google Scholar] [CrossRef] [Green Version]
- Chaumeil, P.-A.; Mussig, A.J.; Hugenholtz, P.; Parks, D.H. GTDB-Tk: A toolkit to classify genomes with the Genome Taxonomy Database. Bioinformatics 2019. [Google Scholar] [CrossRef]
- Brown, C.T.; Olm, C.T.B.M.R.; Thomas, B.C.; Banfield, J.F. Measurement of bacterial replication rates in microbial communities. Nat. Biotechnol. 2016, 34, 1256–1263. [Google Scholar] [CrossRef] [Green Version]
- Seemann, T. Prokka: Rapid prokaryotic genome annotation. Bioinformatics 2014, 30, 2068–2069. [Google Scholar] [CrossRef]
- Alcock, B.P.; Raphenya, A.R.; Lau, T.T.Y.; Tsang, K.K.; Bouchard, M.; Edalatmand, A.; Huynh, W.; Nguyen, A.-L.V.; Cheng, A.A.; Liu, S.; et al. CARD 2020: Antibiotic resistome surveillance with the comprehensive antibiotic resistance database. Nucleic Acids Res. 2020, 48, D517–D525. [Google Scholar] [CrossRef]
- Wickham, H.; Averick, M.; Bryan, J.; Chang, W.; McGowan, L.D.; François, R.; Grolemund, G.; Hayes, A.; Henry, L.; Hester, J.; et al. Welcome to the Tidyverse. J. Open Source Softw. 2019, 4, 1686. [Google Scholar] [CrossRef]
- Wilke, C.O.; Wickham, H.; Wilke, M.C.O. Package ‘Cowplot’. Streamlined Plot Theme and Plot Annotations for ‘ggplot2’. 2019. Available online: https://cran.r-project.org/web/packages/cowplot/index.html (accessed on 20 October 2020).
- Krawczyk, P.S.; Lipinski, L.; Dziembowski, A. PlasFlow: Predicting plasmid sequences in metagenomic data using genome signatures. Nucleic Acids Res. 2018, 46, e35. [Google Scholar] [CrossRef] [Green Version]
- Camacho, C.; Coulouris, G.; Avagyan, V.; Ma, N.; Papadopoulos, J.S.; Bealer, K.; Madden, T.L. BLAST+: Architecture and applications. BMC Bioinform. 2009, 10, 421. [Google Scholar] [CrossRef] [Green Version]
- Leplae, R.; Lima-Mendez, G.; Toussaint, A. ACLAME: A CLAssification of Mobile genetic Elements, update 2010. Nucleic Acids Res. 2010, 38, D57–D61. [Google Scholar] [CrossRef] [Green Version]
- Geck, C.E. Wiley StatsRef: Statistics Reference Online. Choice Rev. Online 2015, 52, 52. [Google Scholar] [CrossRef]
- Zaouri, N.; Jumat, M.R.; Cheema, T.; Hong, P.Y. Metagenomics-based evaluation of groundwater microbial profiles in response to treated wastewater discharge. Environ. Res. 2020, 180, 108835. [Google Scholar] [CrossRef]
- Weinrich, L.; Jjemba, P.K.; Giraldo, E.; Lechevallier, M. Implications of organic carbon in the deterioration of water quality in reclaimed water distribution systems. Water Res. 2010, 44, 5367–5375. [Google Scholar] [CrossRef]
- Kantor, R.S.; Miller, S.E.; Nelson, K.L. The Water Microbiome Through a Pilot Scale Advanced Treatment Facility for Direct Potable Reuse. Front. Microbiol. 2019, 10, 993. [Google Scholar] [CrossRef] [Green Version]
- Thayanukul, P.; Kurisu, F.; Kasuga, I.; Furumai, H. Characterization of bacterial isolates from water reclamation systems on the basis of substrate utilization patterns and regrowth potential in reclaimed water. Water Sci. Technol. 2013, 68, 1556–1565. [Google Scholar] [CrossRef] [PubMed]
- Zhang, G.; Guan, Y.; Zhao, R.; Feng, J.; Huang, J.; Ma, L.; Li, B. Metagenomic and network analyses decipher profiles and co-occurrence patterns of antibiotic resistome and bacterial taxa in the reclaimed wastewater distribution system. J. Hazard. Mater. 2020, 400, 123170. [Google Scholar] [CrossRef] [PubMed]
- Liu, X.; Yang, S.; Wang, Y.; Zhao, H.-P.; Song, L. Metagenomic analysis of antibiotic resistance genes (ARGs) during refuse decomposition. Sci. Total Environ. 2018, 634, 1231–1237. [Google Scholar] [CrossRef] [PubMed]
- Wang, F.-H.; Qiao, M.; Su, J.-Q.; Chen, Z.; Zhou, X.; Zhu, Y.-G. High Throughput Profiling of Antibiotic Resistance Genes in Urban Park Soils with Reclaimed Water Irrigation. Environ. Sci. Technol. 2014, 48, 9079–9085. [Google Scholar] [CrossRef]
- Al-Jassim, N.; Ansari, M.I.; Harb, M.; Hong, P.-Y. Removal of bacterial contaminants and antibiotic resistance genes by conventional wastewater treatment processes in Saudi Arabia: Is the treated wastewater safe to reuse for agricultural irrigation? Water Res. 2015, 73, 277–290. [Google Scholar] [CrossRef] [Green Version]
- Al-Jassim, N.; Mantilla-Calderon, D.; Scarascia, G.; Hong, P.-Y. Bacteriophages to Sensitize a Pathogenic New Delhi Metallo β-Lactamase-Positive Escherichia coli to Solar Disinfection. Environ. Sci. Technol. 2018, 52, 14331–14341. [Google Scholar] [CrossRef] [Green Version]
- AlJassim, N.I.; Mantilla-Calderon, D.; Wang, T.; Hong, P.-Y. Inactivation and Gene Expression of a Virulent Wastewater Escherichia coli Strain and the Nonvirulent Commensal Escherichia coli DSM1103 Strain upon Solar Irradiation. Environ. Sci. Technol. 2017, 51, 3649–3659. [Google Scholar] [CrossRef]
Figure 1.
Heatmap for bacterial composition of water samples. Relative abundance of 37 bacterial orders (rows, including five unclassified orders) across 23 water samples (columns) is obtained based on assembled contigs of metagenomes. Names of water samples were based on Supplementary Table S1, and indicate the sampling sites, sample type and sampling season of each water sample. Cell color indicated the percentage of relative abundance for each bacterial order, and black cells indicated non-detection of bacterial order in the sample. Heatmap was separated through sampling sites (A, B, D) and sample type (POE vs. POU).

Figure 2.
Metagenome assembled genomes (MAGs) from (A) site A, (B) site B, and (C) site D. Names of MAGs (row) are based on their classification at order level. Cell color in purple and green indicates relative abundance of each MAG, while the replication index is shown in shades of red. Positive presence of the mentioned antibiotic resistant genes (ARG) is indicated with a yellow cell.

Figure 3.
Correlation between genome-resolved ARG relative abundance (mean coverage Q2Q3 per 10 million reads in metagenome-assembled genomes (MAG)) and MAG relative abundance (log10 of mean Q2Q3 coverage per 10 million reads in water microbiome) in (A) POE samples and (B) point of use (POU samples). Shade zone indicated correlation within 95% confidence interval.

Figure 4.
Coverage and proportion of detection for ARGs across samples in (A) site A, (B) site B and (C) site D. Coverage (relative abundance) of metagenome-resolved ARG were computed through mean coverage Q2Q3 and larger circle indicated a higher coverage. Proportion of detection indicated the fraction of coverage, and bigger proportion of detection meant more complete detection of the ARG in that particular sample. Names of ARGs (row) are based on their antimicrobial resistance AMR gene family and their gene name.


Table 1.
Water quality (average ± standard deviation) for the reclaimed water collected at sites A, B and D. Red arrow denotes significantly higher parameters at that site compared to other sites, while green denotes significantly lower. Data was obtained from earlier study by Garner et al. [12] for further statistical analysis.
| Utility (Number of Samples) | Temperature (°C) | Total Cl (mg/L) | Free Cl (mg/L) | pH | Turbidity (NTU) | Conductivity (S/m) | Dissolved Oxygen (mg/L) | Total Organic Carbon (μg/L) | Dissolved Organic Carbon (μg/L) | Biodegradable Dissolved Organic Carbon (μg/L) |
|---|---|---|---|---|---|---|---|---|---|---|
| A (n = 20) | 26.7 ± 4.3 ↑ | 0.4 ± 0.4 ↓ | 0.2 ± 0.2 | 7.7 ± 0.3 ↑ | 5.4 ± 10.8 | 1354.4 ± 215.4 | 6.5 ± 1.3 | 5714 ± 2564 | 6351 ± 2761 | 2137 ± 2321 |
| B (n = 19) | 19.6 ± 2.9 | 2.3 ± 3.1 | 1.1 ± 2.1 ↑ | 7.3 ± 0.2 | 2.5 ± 2.6 | 736.9 ± 80.3 ↓ | 4 ± 1.4 ↓ | 10,123 ± 6173 ↑ | 11,087 ± 7014 ↑ | 6094 ± 8777 ↑ |
| D (n = 20) | 20 ± 1.8 | 2.7 ± 2.3 | 0.2 ± 0.2 | 7.2 ± 0.1 | 2 ± 1 | 1542.9 ± 283.1 | 6.8 ± 2.4 | 3961 ± 2120 | 4333 ± 2069 ↓ | 2621 ± 1238 |
Table 2.
The bacterial orders detected in all point-of-use (POU) samples across three sites and their relative abundance in percentage.
Table 2.
The bacterial orders detected in all point-of-use (POU) samples across three sites and their relative abundance in percentage.
| A-POE | A-POU | B-POE | B-POU | D-POE | D-POU | |
|---|---|---|---|---|---|---|
| Propionibacteriales | 49.1 ± 28.0 | 56.9 ± 29.8 | 46.7 ± 37.0 | 28.6 ± 45.8 | 10.0 ± 6.7 | 14.9 ± 10.9 |
| Rhizobiales | -- | 3.1 ± 2.1 | 0.2 ± 0.3 | 37.7 ± 41.5 | -- | 6.0 ± 11.0 |
| Sphingomonadales | -- | 2.7 ± 3.3 | -- | 8.9 ± 10.7 | 0.02 ± 0.04 | 6.8 ± 12.8 |
| Pseudomonadales | 2.2 ± 2.7 | 1.8 ± 1.2 | 3.8 ± 3.0 | 12.5 ± 15.0 | 8.4 ± 5.8 | 7.2 ± 6.9 |
| Flavobacteriales | 3.3 ± 4.3 | 0.8 ± 1.6 | 2.1 ± 3.0 | 8.2 ± 12.7 | 5.4 ± 0.1 | 3.2 ± 2.7 |
Publisher’s Note: MDPI stays neutral with regard to jurisdictional claims in published maps and institutional affiliations. |
© 2020 by the authors. Licensee MDPI, Basel, Switzerland. This article is an open access article distributed under the terms and conditions of the Creative Commons Attribution (CC BY) license (http://creativecommons.org/licenses/by/4.0/).
Share and Cite
MDPI and ACS Style
Wang, C.; Hong, P.-Y. Genome-Resolved Metagenomics and Antibiotic Resistance Genes Analysis in Reclaimed Water Distribution Systems. Water 2020, 12, 3477. https://doi.org/10.3390/w12123477
AMA Style
Wang C, Hong P-Y. Genome-Resolved Metagenomics and Antibiotic Resistance Genes Analysis in Reclaimed Water Distribution Systems. Water. 2020; 12(12):3477. https://doi.org/10.3390/w12123477
Chicago/Turabian StyleWang, Changzhi, and Pei-Ying Hong. 2020. "Genome-Resolved Metagenomics and Antibiotic Resistance Genes Analysis in Reclaimed Water Distribution Systems" Water 12, no. 12: 3477. https://doi.org/10.3390/w12123477
Note that from the first issue of 2016, this journal uses article numbers instead of page numbers. See further details here.