Article

Application of an Index-Based Approach in Geospatial Techniques for the Mapping of Flood Hazard Areas: A Case of Cape Coast Metropolis in Ghana

1
College of Geomatics, Shandong University of Science and Technology, Qingdao 266590, China
2
First Institute of Oceanography, Ministry of Natural Resources, Qingdao 266061, China
3
Department of Geography and Regional Planning, Faculty of Social Sciences, College of Humanities and Legal Studies, University of Cape Coast, Cape Coast University Post Office, Cape Coast, Ghana
4
Center for Social Research in Health, University of New South Wales, Sydney 2052, Australia
*
Authors to whom correspondence should be addressed.
Water 2020, 12(12), 3483; https://doi.org/10.3390/w12123483
Submission received: 16 October 2020 / Revised: 18 November 2020 / Accepted: 7 December 2020 / Published: 11 December 2020
(This article belongs to the Section Hydrology)

Abstract

:
Floods remain one of the disasters that destroy properties, livelihoods, and in extreme situations, take lives. As a way of prevention, geospatial applications have been employed in many cities to map flood zones and predict floods. For a country such as Ghana, floods have been ranked as the second fatal disaster after epidemics leading to several kinds of research to resolve them. To date, the Cape Coast Metropolis (CCM) has received little attention in terms of research, though flood cases in the area continue to escalate. This study, therefore, examines the use of geospatial techniques as tools in addressing flood problems in the CCM of Ghana. From a Digital Elevation Model, hydrologic variables were generated using the ArcGIS software (Esri, Redlands, CA, USA). The soil drainage classification for the study was generated from a downloaded African Soil Grid Drainage map, while other important factors that influenced flooding in the CCM were obtained from Landsat 8 imagery. Over 21% of the CCM was classified as high flood hazard zones with areas around the river Kakum estuary being flood hotspots. It is, therefore, recommended that the CCM Assembly fund dredging of streams/rivers and promote afforestation along river banks to reduce the risk of flooding within the metropolis.

Graphical Abstract

1. Introduction

Globally, floods remain among the most common and dangerous disasters that do not only displace and kill people but also destroy livelihoods, personal properties, and public infrastructure [1,2,3]. Floods often affect victims’ mental health and disrupt the social functioning of communities [4]. However, research has shown that the devastating impact of floods can be reduced through the application of proactive technology [5].
Modern technological applications, notably remote sensing (RS) and geographic information system (GIS), together known as geospatial techniques, are emerging as effective methods for preventing flood hazards [5]. In contemporary societies, for instance, geospatial techniques can be used for mapping areas of flood hazard and for predicting flood occurrences [2,6,7,8]. Accurate prediction of areas of flood hazard remains an important priority in flood risk reduction initiatives [9]. Even before a flood disaster strikes, it behooves authorities to have readily available maps detailing hazardous zones [10]. When authorities correctly map flood hazard areas, it facilitates not only the timely rescue of potential victims from the flood-related crisis but also prevents post-crisis difficulties, such as issues related to insurance claims [11,12]. Several studies, including the works of Aja et al., Asare–Kyei et al., Baishya and Sahariah, Danumah et al., and Elkhrachy [7,11,13,14,15] have argued for the use of geospatial techniques in mapping areas of flood hazards. The Sendai UN Conference on Disaster Risk Reduction in 2015 also highlights the importance of using geospatial techniques by states/local actors to implement programs designed to prevent and reduce disasters and their consequences [16,17].
Many sub–Saharan African countries are highly susceptible to floods [18]. Ghana, Nigeria, Burkina Faso, Cote d’Ivoire, and Senegal continue to experience flood problems annually [13,14,19]. In 2012, for instance, three million homes in Nigeria were inundated by floodwaters, and an estimated 1.4 million people were displaced [20]. In 2013, flood disasters in the sub-region led to the death of 84 people, displaced 40,445, and destroyed about 34,000 hectares of farmlands [20]. It is important to note that even dry areas in West Africa are not spared by floods as flood disasters displaced 27,289 people in Niger (a drought-prone country), between 1970 and 2000 [21]. Factors that have accounted for flood cases in the sub-region include erratic rainfall patterns, geographic location, and low elevations [13].
Developing nations mostly have constraints with access to high-quality data for effective flood hazard monitoring [22]. In West African countries, many districts do not have flood hazard maps [11]. With a few exceptions, the available flood hazard maps are not updated periodically. Consequently, local state agencies mandated to manage floods resort to obsolete and less-effective methods, such as measuring watermarks on structures, ground surveys, aerial observations, and media reports [12,23]. Such measures are insufficient as there could be the creation of new flood hazard areas [23]. This may come at a high cost and can be labor-intensive when floods cover large areas [12].
Ghana is among the countries in West Africa affected by devastating floods [19]. The cost of damage due to floods in Ghana between 1990 and 2014 amounted to over USD 780 million [24]. Floods were ranked as the second most fatal disaster type after epidemics in Ghana [24]. In 2015, for instance, more than 150 people died because of a combined flood and fire disaster in Accra [25]. While the majority of flood cases in Ghana often occur in cities, some towns and villages have also had difficult experiences with floods. The year 2010 saw over 2300 people displaced at Swedru in the Agona West Municipality due to flooding [26]. The Upper East Region in October 2019 recorded flood disasters that claimed the lives of 19 people and forced over 26,000 residents out of their homes when over 5000 dwellings were affected [27].
In the Cape Coast Metropolis (CCM), which is widely recognized as a major tourism and education hub in the country, flooding is a serious problem that keeps escalating because the area continues to attract many migrants coupled with heavy annual rains [28]. In June 2016, a continuous heavy rainfall over ten days claimed ten lives. This reoccurred within the metropolis in 2019 [29,30]. Studies have shown that the common causes of floods in Ghana result from natural factors (e.g., rainfall) and anthropogenic factors (e.g., poor physical planning, improper waste disposal system, and lack of or poorly designed drainage systems) [24,31]. Annual flood events in Ghana aside from their toll on human lives, socio-economic activities, and the environment, tend to affect the government’s overall budget as the government invests a lot of money into relief operations whenever scores of people are affected [31].
Although flood problems continue to escalate in Ghana, particularly in the CCM, most empirical studies aimed at helping to address the problem have focused on the national capital, Accra, and little has been done on the assessment and mapping of the flood problem using geospatial techniques [8,23,32,33]. Using a modified flood index approach to mapping flood hotspots in CCM, this study seeks to exemplify and justify the importance of using geospatial techniques in addressing flood problems in Ghana and West Africa as a whole. The findings in this study have the potential of being a valuable reference document for flood control authorities and experts in the fight against flooding in the Cape Coast Metropolis and Ghana as a whole.

2. Materials and Methods
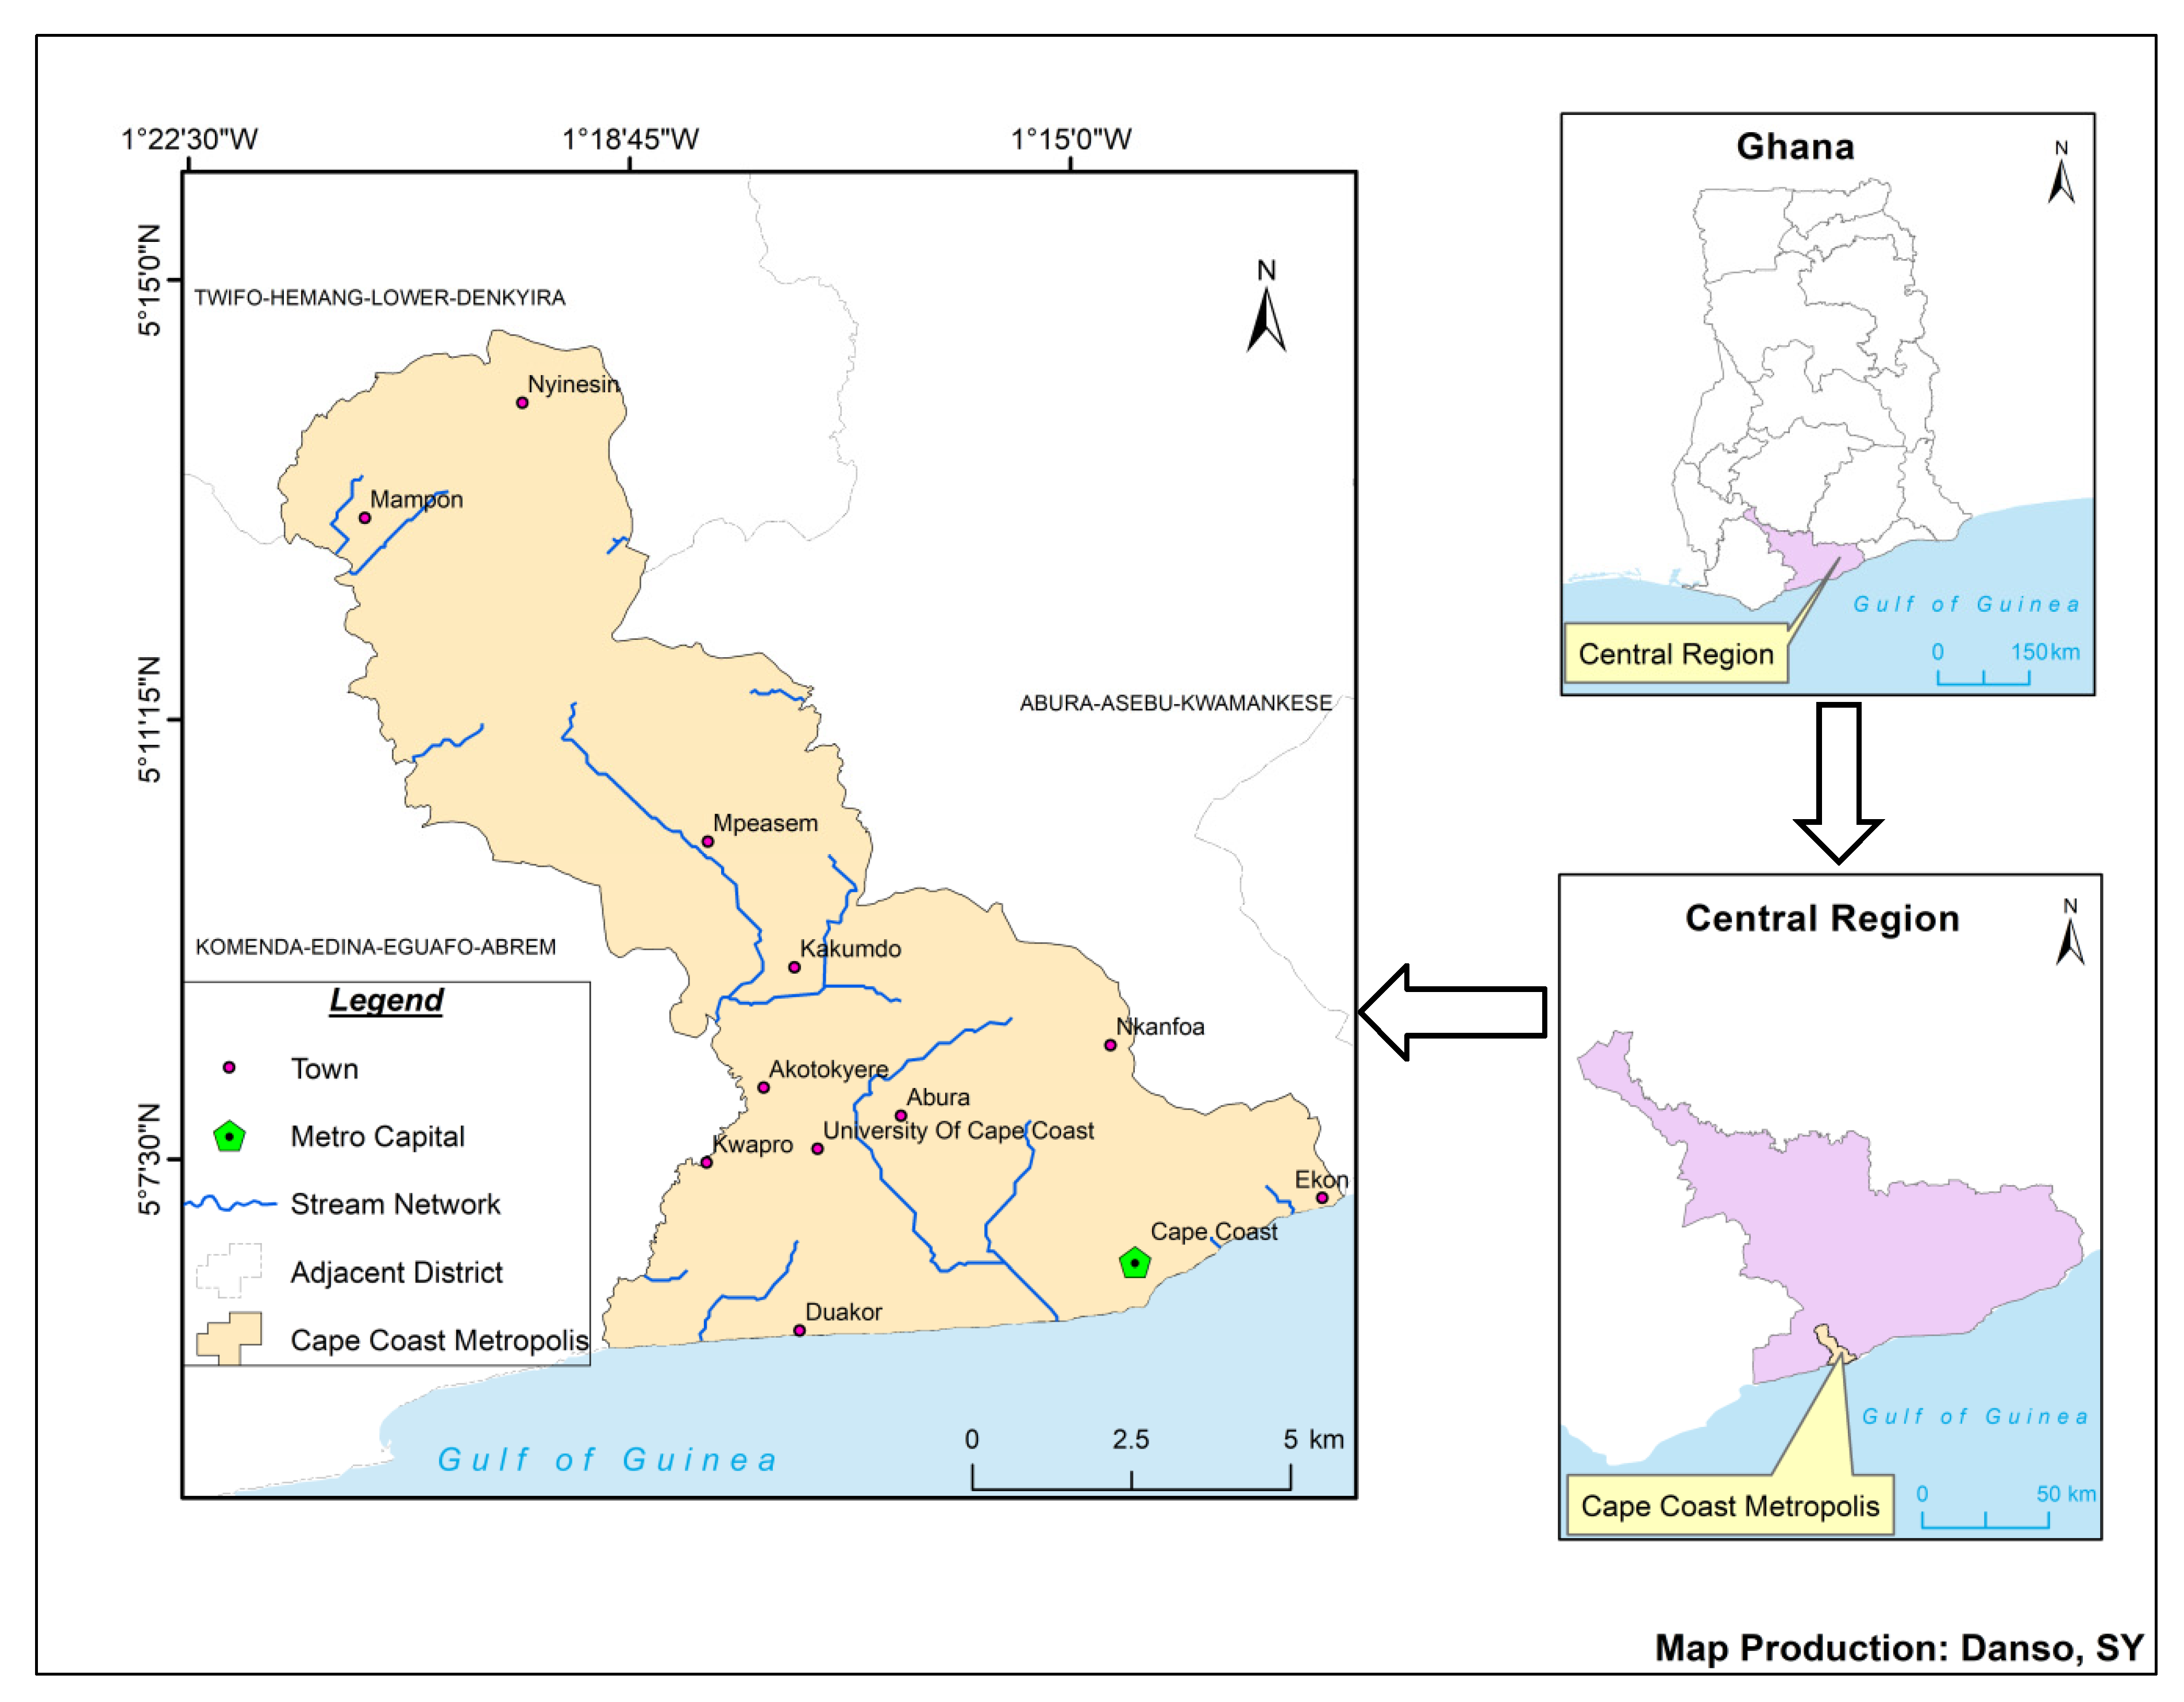
2.1. Study Area

The Cape Coast Metropolis (CCM), a coastal city in the Central Region of Ghana, is located within longitudes 1°11′–1°41′ west and latitudes 5°7′–5°20′ north (see Figure 1). The CCM with a land size of nearly 122 km2 shares boundaries with the Komenda–Edina–Eguafo–Abrem Municipality in the west, Abura–Asebu–Kwamankese District in the east, Twifo–Hemang–Lower–Denkyira District in the north, and the Gulf of Guinea in the south [34,35]. The Metropolis has a coastal stretch of about 13 km long [34].
The CCM records temperatures between 24 and 32 °C with relative humidity between 60% and 80% [34]. The area experiences a double maxima rainfall receiving annual rainfall between 90 and 110 mm along its coastal stretch to 160 mm up north with the harmattan setting in between November and February [34]. The vegetative cover in the area is made up of secondary forest, comprising mainly thickets and shrubs. The CCM has a hilly topography with water bodies flowing in between them. The Kakum River and streams, such as Siwere, are located within the area [34].
The CCM with an estimated population size of 169,894 and a growth rate of 3.1% is one of the oldest districts in Ghana [36]. It was upgraded to a municipality in 1987 and subsequently received metropolitan status in 2007 due to its population size [35]. Cape Coast, the capital of CCM, historically served as the administrative capital of the Gold Coast (currently Ghana) and became a major manufacturing and commercial hub for migrants before 1877 [37]. This vibrant economic activity slowed down as a result of the relocation of the capital to Accra. However, its tourism and educational potentials have made the metropolis a center of attraction for both foreigners and indigenes. The area has a lot of small-scale entrepreneurs and a host of government agencies [28], while farmers and fishermen constitute about 60% of the active workforce [34].

2.2. Data Sources and Processing

We downloaded a global Advanced Spaceborne Thermal Emission and Reflection Radiometer (ASTER) digital elevation model (DEM) at 1 arc-second spatial resolution (https://search.earthdata.nasa.gov/) for the study. A single downloaded image tile was enough to cover the region of interest. Further processing of the DEM was carried out in ArcGIS by filling all gaps in the DEM.
The Africa Soil Grid Drainage Classes map was obtained freely from (https://files.isric.org/public/afsis250m/af_DRAINFAO_T__M_250m.tif) the International Soil Reference and Information Center (ISRIC) website. It was resampled from a 250 m resolution to a 30 m resolution to match other spatial data used in the analysis. Later, the projection was changed from the World Geodetic System (WGS) 1984 Lambert Azimuthal Equal Area to Universal Transverse Mercator (UTM) 30 N.
We acquired a Landsat 8 satellite image via the Earth Explorer website (https://earthexplorer.usgs.gov) as additional material for the study. Applying selection parameters, only one image with less than 5% land and scene cloud cover was acquired. The authors applied an atmospheric correction to improve image quality.

Setting up Data for Use in ArcGIS

We created a file geodatabase for easy saving of files under a single coordinate system. The UTM 30N Projected Coordinate System was used since Ghana falls within this zone. Therefore, all files for the study including shapefiles and images were imported into this geodatabase and were analyzed using the ArcGIS 10.4.1 software.

2.3. Information Extraction

2.3.1. Digital Elevation Model (DEM)

We used a standard digital dataset that is available at the official data source. According to the works of Senevirathne and Willgoose, and Prodanovic et al. [38,39], DEMs contain topographic depressions which can take the form of a single cell (pits) or contiguous areas (depressions), and these can interrupt continuous flow paths, so we created a depressionless DEM before computing our parameters. This was achieved using the Fill tool in ArcGIS. The following variables were obtained using tailor-made Spatial Analyst tools that have in-built algorithms for processing DEMs. The flow direction raster of CCM was first created, which then became an input material for extracting the flow accumulation image. The surface drainage network was extracted using the flow accumulation raster. The stream density map was produced from generated drainage networks, while the distance from streams was also generated using the Euclidean distance tool. The elevation and slope of the study area were also generated from the filled DEM (see Figure 2).

2.3.2. ISRIC World Soil Information

From the downloaded Africa Soil Grid Drainage Classes’ map, a subset for the CCM was generated using the study area’s shapefile. This map had classified soils in the study area based on their drainage qualities on a scale from “1” being “very poor” to “5” being “well-drained”.

2.3.3. Landsat 8 Imagery

From the Landsat 8 image, the Normalized Difference Vegetation Index (NDVI) map for the study area was produced using the NDVI tool in ArcGIS. The Landsat 8 imagery after undergoing atmospheric correction was used for land use/land cover (LULC) classification. The different land cover types were derived using the interactive supervised classification method after creating training samples. Four LULC classes were discovered, namely water, dense vegetation, sparse vegetation, and towns (i.e., built-up).
To establish whether the classification results could be used for this study, the classified map was validated against a reference image, which is a Google Earth natural color-based image. In performing the accuracy assessment, a total of 801 testing samples were used. They represent pixels of the classified image that were randomly selected and uniformly distributed across the entire study area. A pixel to pixel comparison of the testing samples and the reference image was conducted. This helped us to generate an error matrix that formed the input for calculating the overall accuracy and kappa coefficient (see outcome in the Results section).

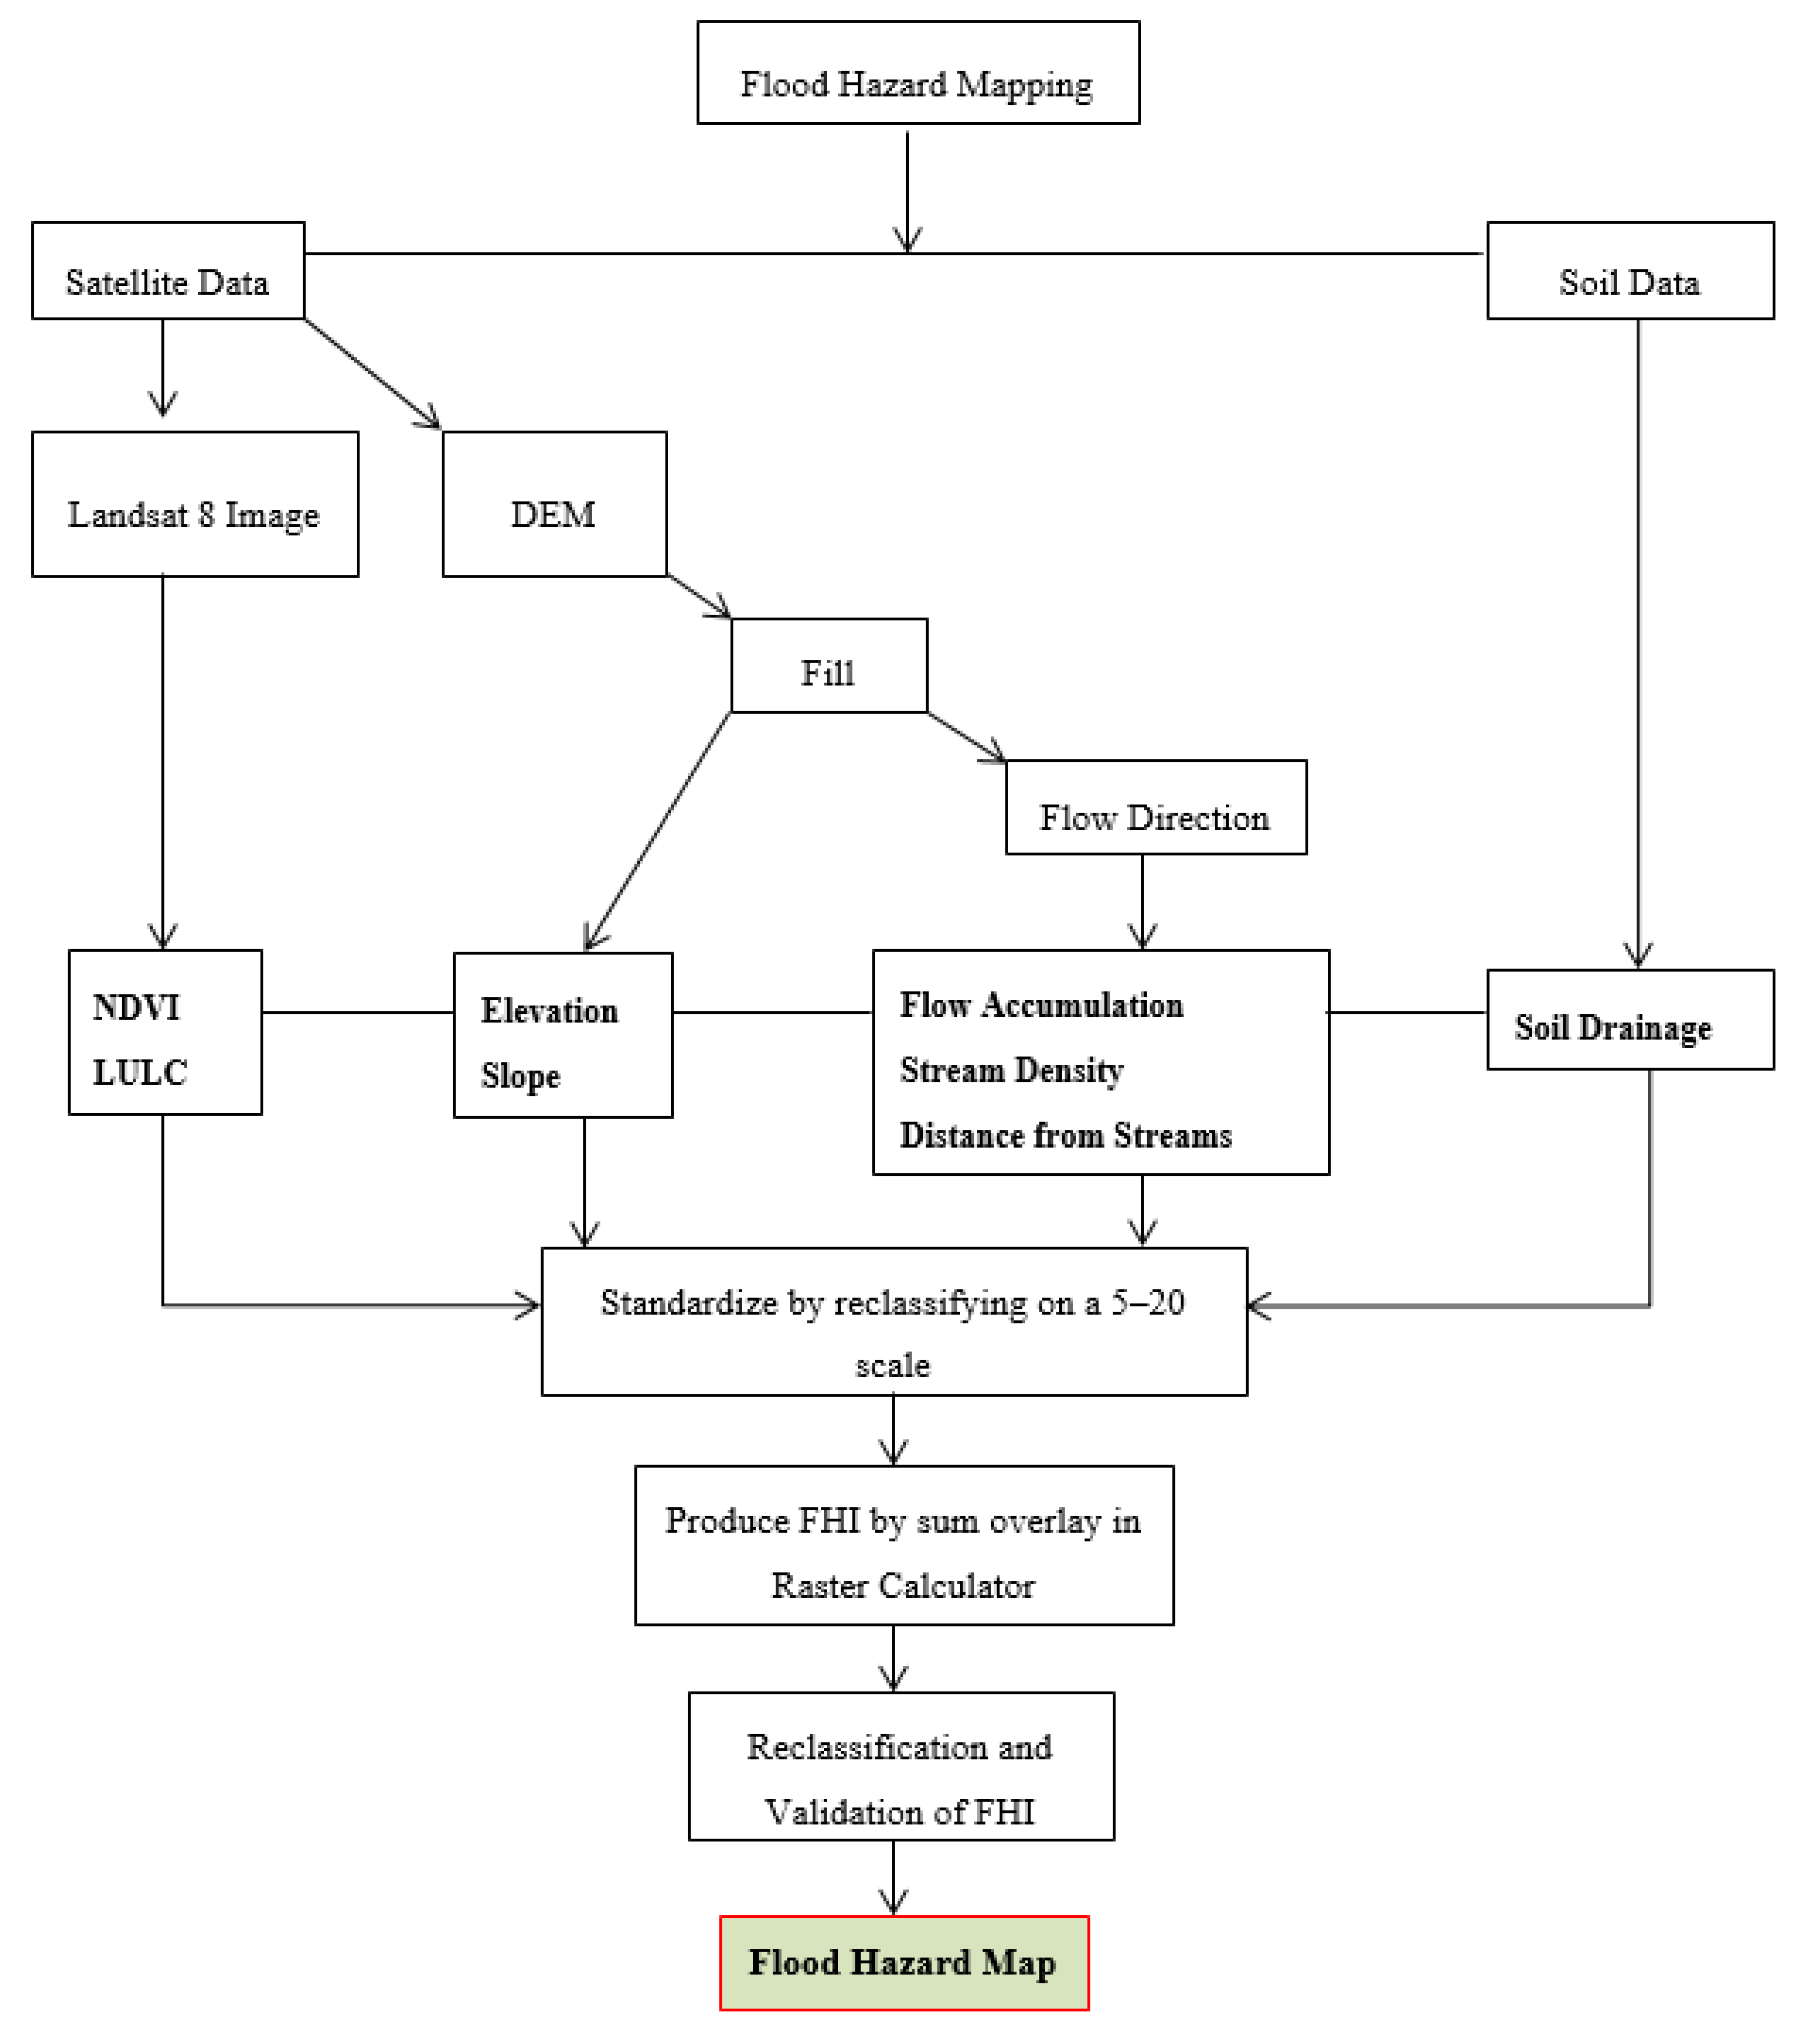
2.4. Flood Hazard Mapping

2.4.1. Factors Included in the Flood Hazard Index (FHI)

We produced a flood hazard index of the study setting using the extracted factors (elevation, slope, flow accumulation, stream density, and distance from streams; Normalized Difference Vegetation Index (NDVI), soil drainage capacity, and LULC). These have been used in similar flood mapping studies and proven to be successful [40]. Analyzing these factors would not have been possible without first standardizing them in the same unit [41]. Therefore, using a scale of 5–20, all aforementioned flood causal factors were reclassified with “5” indicating the least possibility for a factor to influence flooding and “20” assigned for the highest likelihood. For instance, with elevation, areas with high values were given the value of 5 and vice versa because high elevation values are associated with low flooding likelihood and vice versa (Table 1).

2.4.2. Computing Flood Hazard Index (FHI)

We employed a Modified Flood Hazard Index due to the scarcity of data on CCM and the ability to modify the tool to the context of the study area [40]. For instance, stream density was considered a causal factor for floods in this study, although it was absent in the original model. The flood hazard index was derived by overlaying all the reclassified causal factors using the Raster Calculator. To promote objectivity, the authors made no judgment on the relative importance of different factors. Weights were not personally assigned to determine which factor influenced flood hazards more than the other. The following equation was used to produce the FHI.
F H I = i = 1 n r i = E + S + F A + S D + D S + N D V I + S D C + L U L C
where:
  • FHI—Flood Hazard Index;
  • ri—The ranking assigned to a factor;
  • n—The number of factors;
  • E—Elevation;
  • S—Slope;
  • FA—Flow Accumulation;
  • SD—Stream Density;
  • DS—Distance from Streams;
  • NDVI—Normalized Difference Vegetation Index;
  • SDC—Soil Drainage Capacity;
  • LULC—Land Use/Land Cover.
Reclassification of the Index was categorized into four flood hazard zones—high, medium, low, and no—using the natural breaks method [13,40]. We verified the authenticity of the reclassified index using historical flood records of the area to arrive at the flood hazard map.

3. Results

3.1. Flood Causal Factors

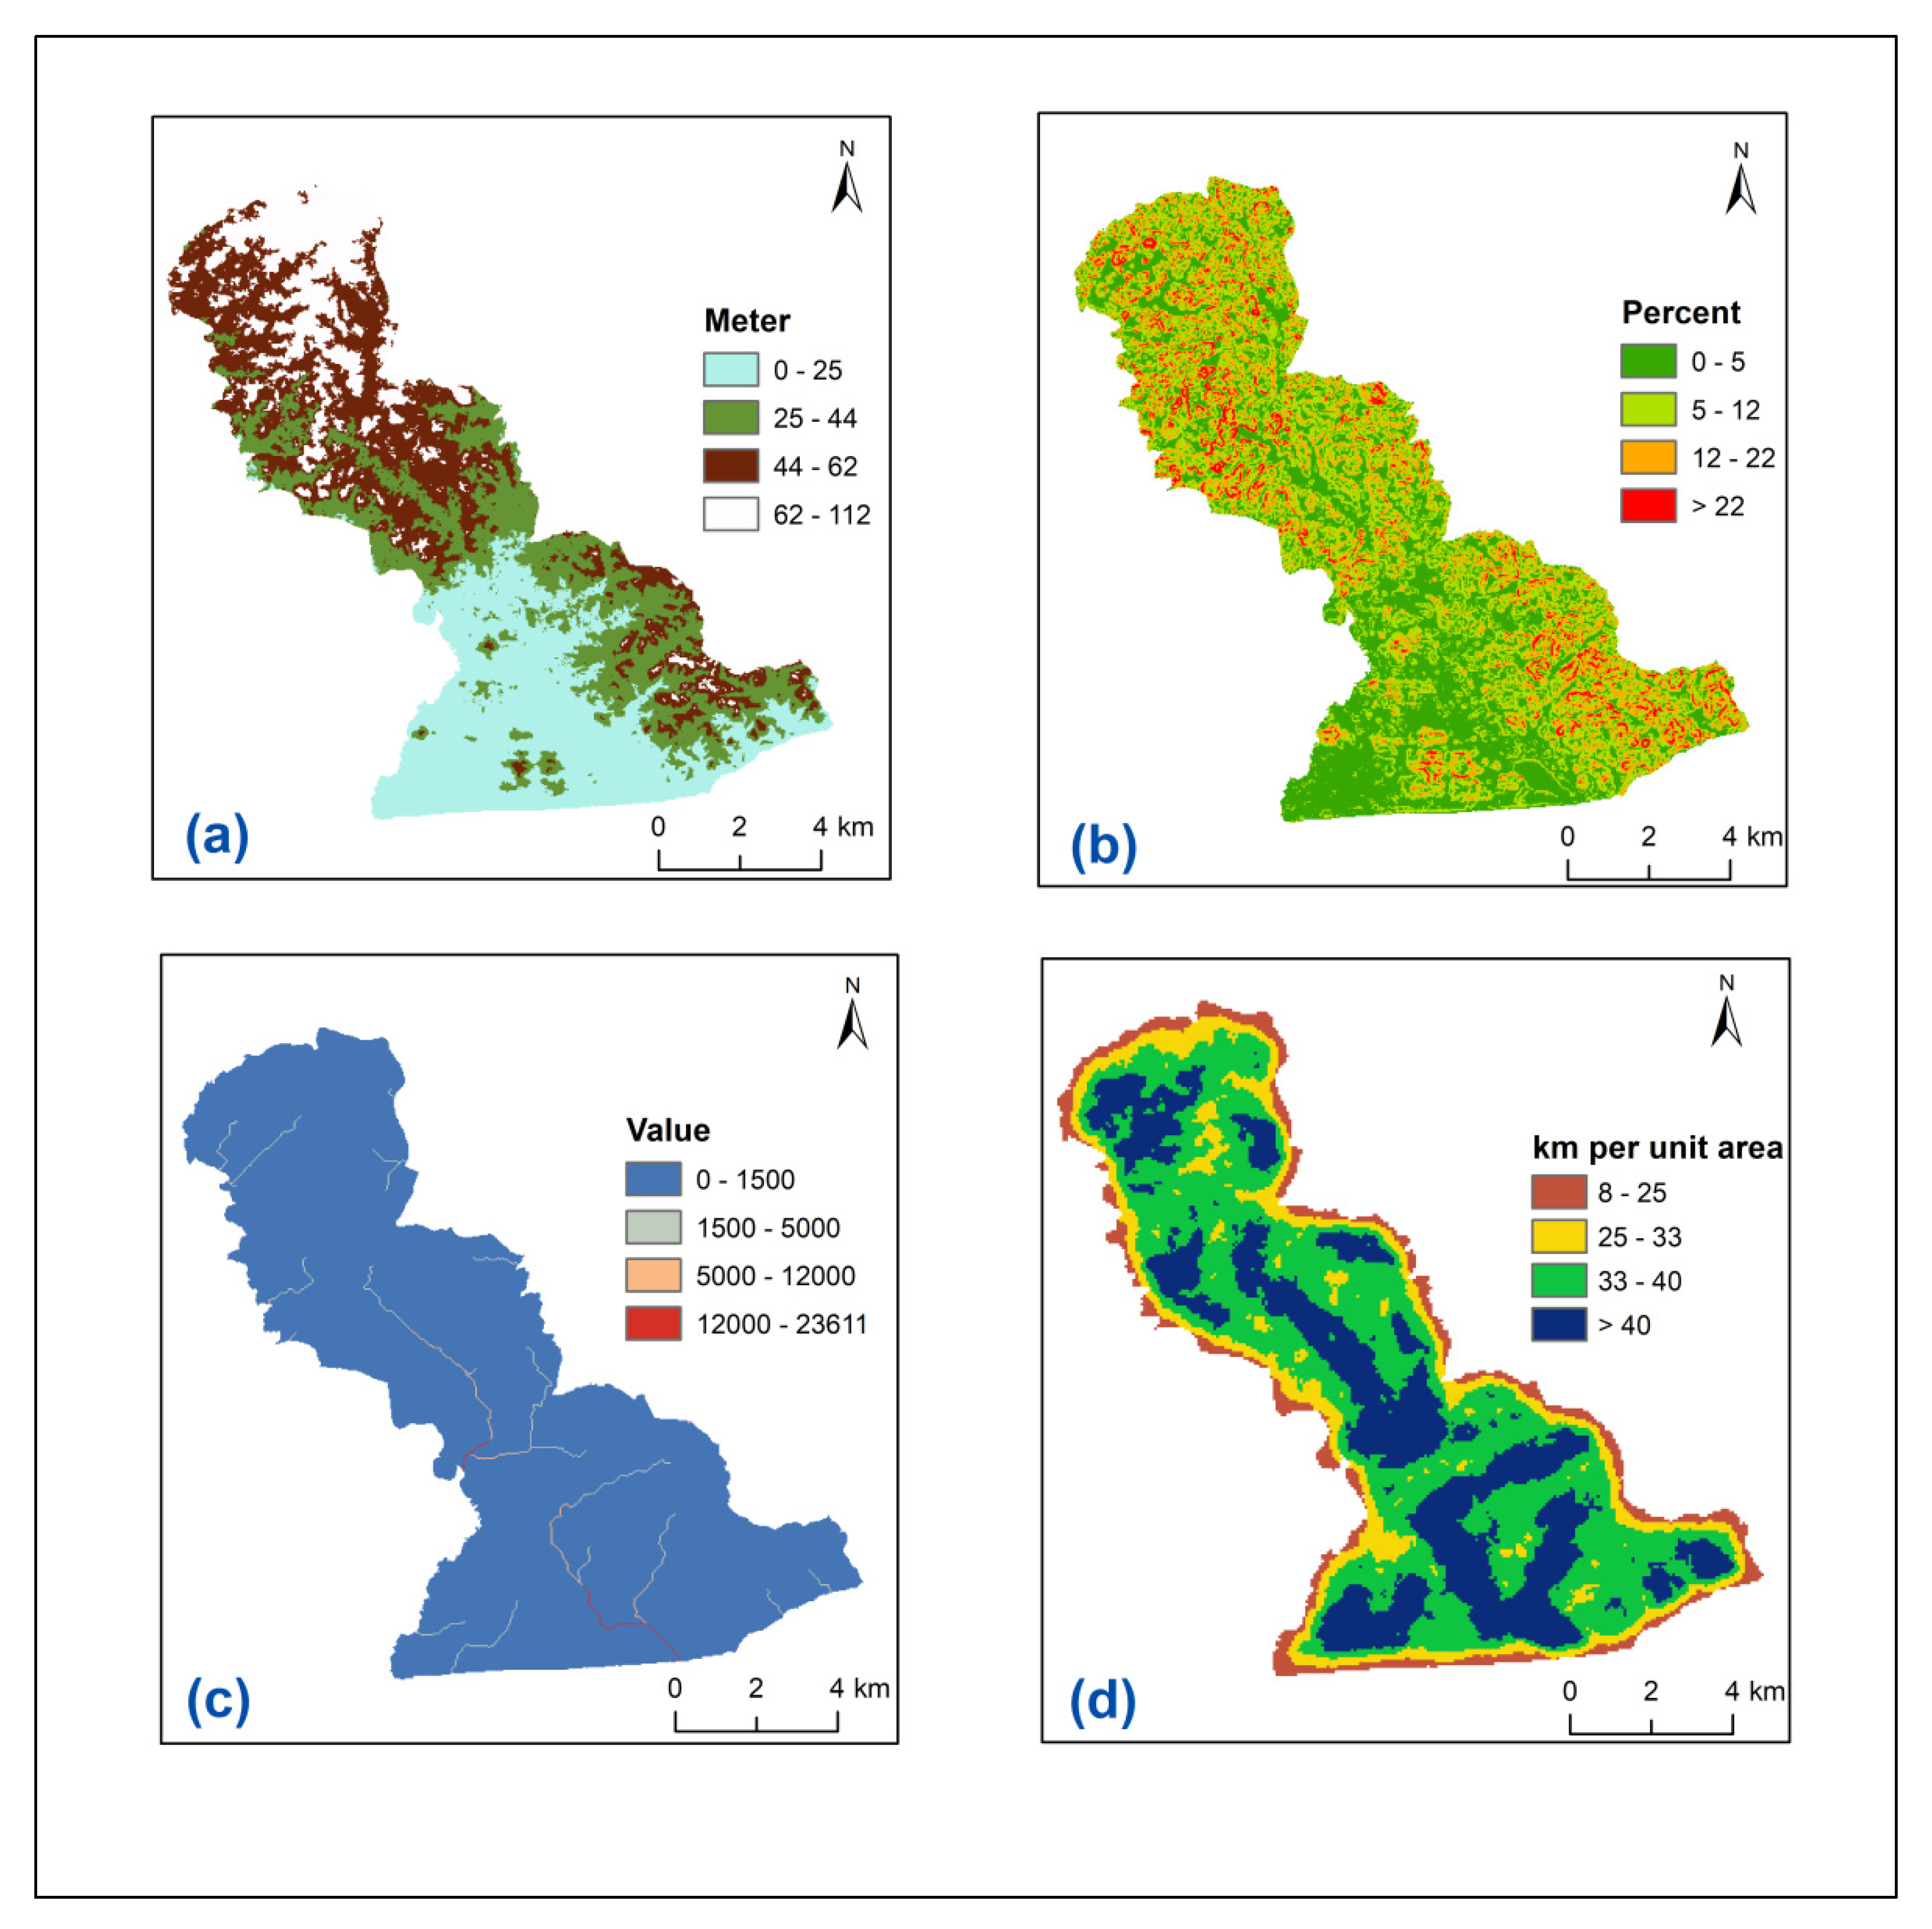
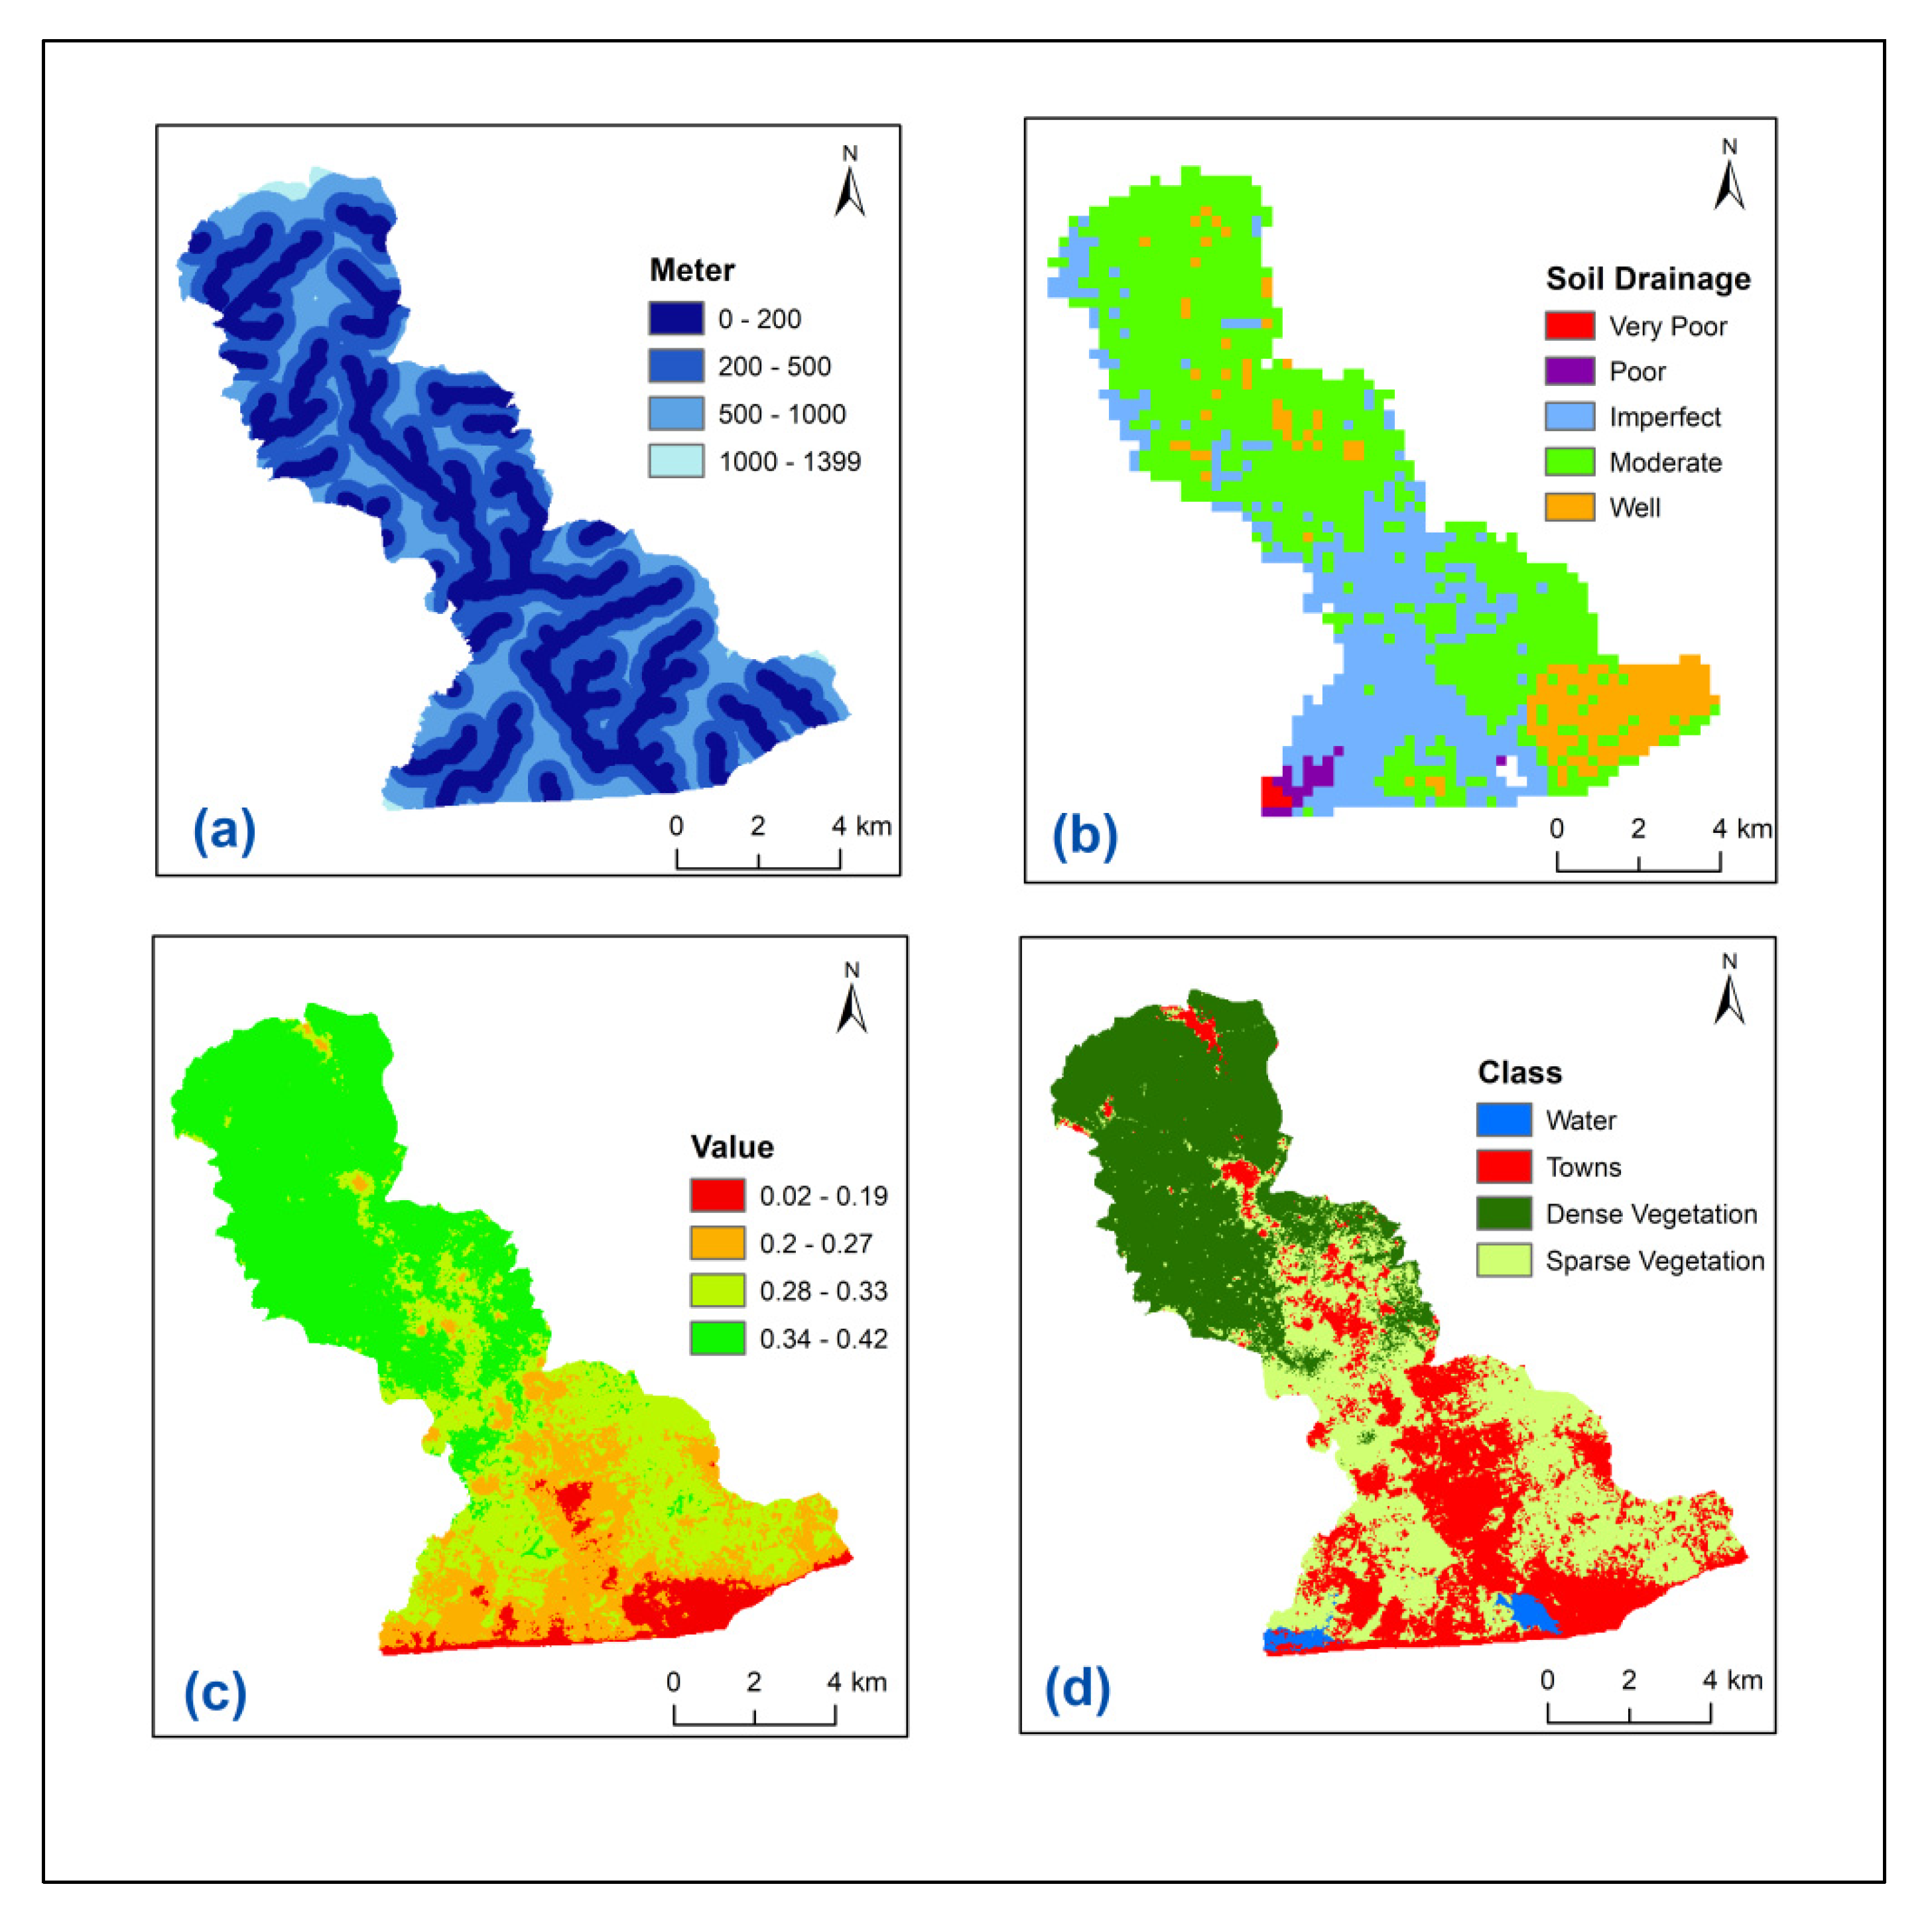
3.1.1. Digital Elevation Model

Elevation was higher in the northeastern section of the Cape Coast Metropolis (CCM), while areas closer to wetlands recorded the least elevation values towards the southwestern portion (see Figure 3a). The coastal stretch of the city also had low elevation values.

3.1.2. Slope

The slope map showed high percentage values in the northernmost and southeastern portions of the metropolis, while the southwestern portion had the lowest slope value of zero (Figure 3b). Slope and elevation maps of the study area show a similar output since the slope is a derivative of elevation.

3.1.3. Flow Accumulation

Flow accumulation shows the cell in an output raster where all flowing water will gather downslope. A higher value is a measure of intense flow hence higher flood hazard and vice versa [40]. The categorization revealed flow accumulation values from 0 to 1500, being the lowest, to the highest which is over 12,000 (Figure 3c). The highest flow accumulation point occurred where river Kakum drains into the ocean.

3.1.4. Stream Density

Figure 3d shows the stream density in the study area. We found areas with high stream density from the midsection to the coastal portions in the Metropolis. The highest values recorded for stream density were along the main channel of the largest river in CCM—i.e., River Kakum.

3.1.5. Distance from Streams

Our findings indicate a link between distance from streams and floods. Places close to rivers were identified to be more susceptible to floods and vice versa. The data show many of the flood-prone towns are within 500 m from river networks (Figure 4a).

3.1.6. Soil Drainage Capacity

Figure 4b reveals the drainage capacity of soils in the study area. Soils with drainage capacity classified as “moderate” covered a large portion of the area, while only a small portion near a wetland at Abakam was classified as having “very poor” drainage.

3.1.7. Normalized Difference Vegetation Index (NDVI)

The CCM recorded higher NDVI values up north compared with the lowest values in the south dominated by built-up environments and water bodies (Figure 4c). The period that the image was captured affected the NDVI values because in January when the harmattan period has already set in, many plants had become distressed due to the dry conditions.

3.1.8. Land Use/Land Cover (LULC) Classification

The largest LULC types covering more than 70% of the area were vegetated areas (both sparse (35.78%) and dense (34.82%)). While dense vegetation was predominant in the northernmost part of the metropolis, sparse vegetation was concentrated in the middle portion of the area ( Figure 4d). Water was the smallest land cover type occupying barely 1.4% of the total land cover. The southern and middle sectors of the metropolis had many built-up areas (28.0%) compared with the north.
Validation of the LULC classification was performed using an error matrix method (see Table 2). The overall accuracy and kappa coefficient were 87.86% and 0.816, respectively. A kappa coefficient of 1 signifies a perfect agreement between a classified image and a reference one, while 0 indicates no agreement [42]; hence, our classification was almost a perfect one.

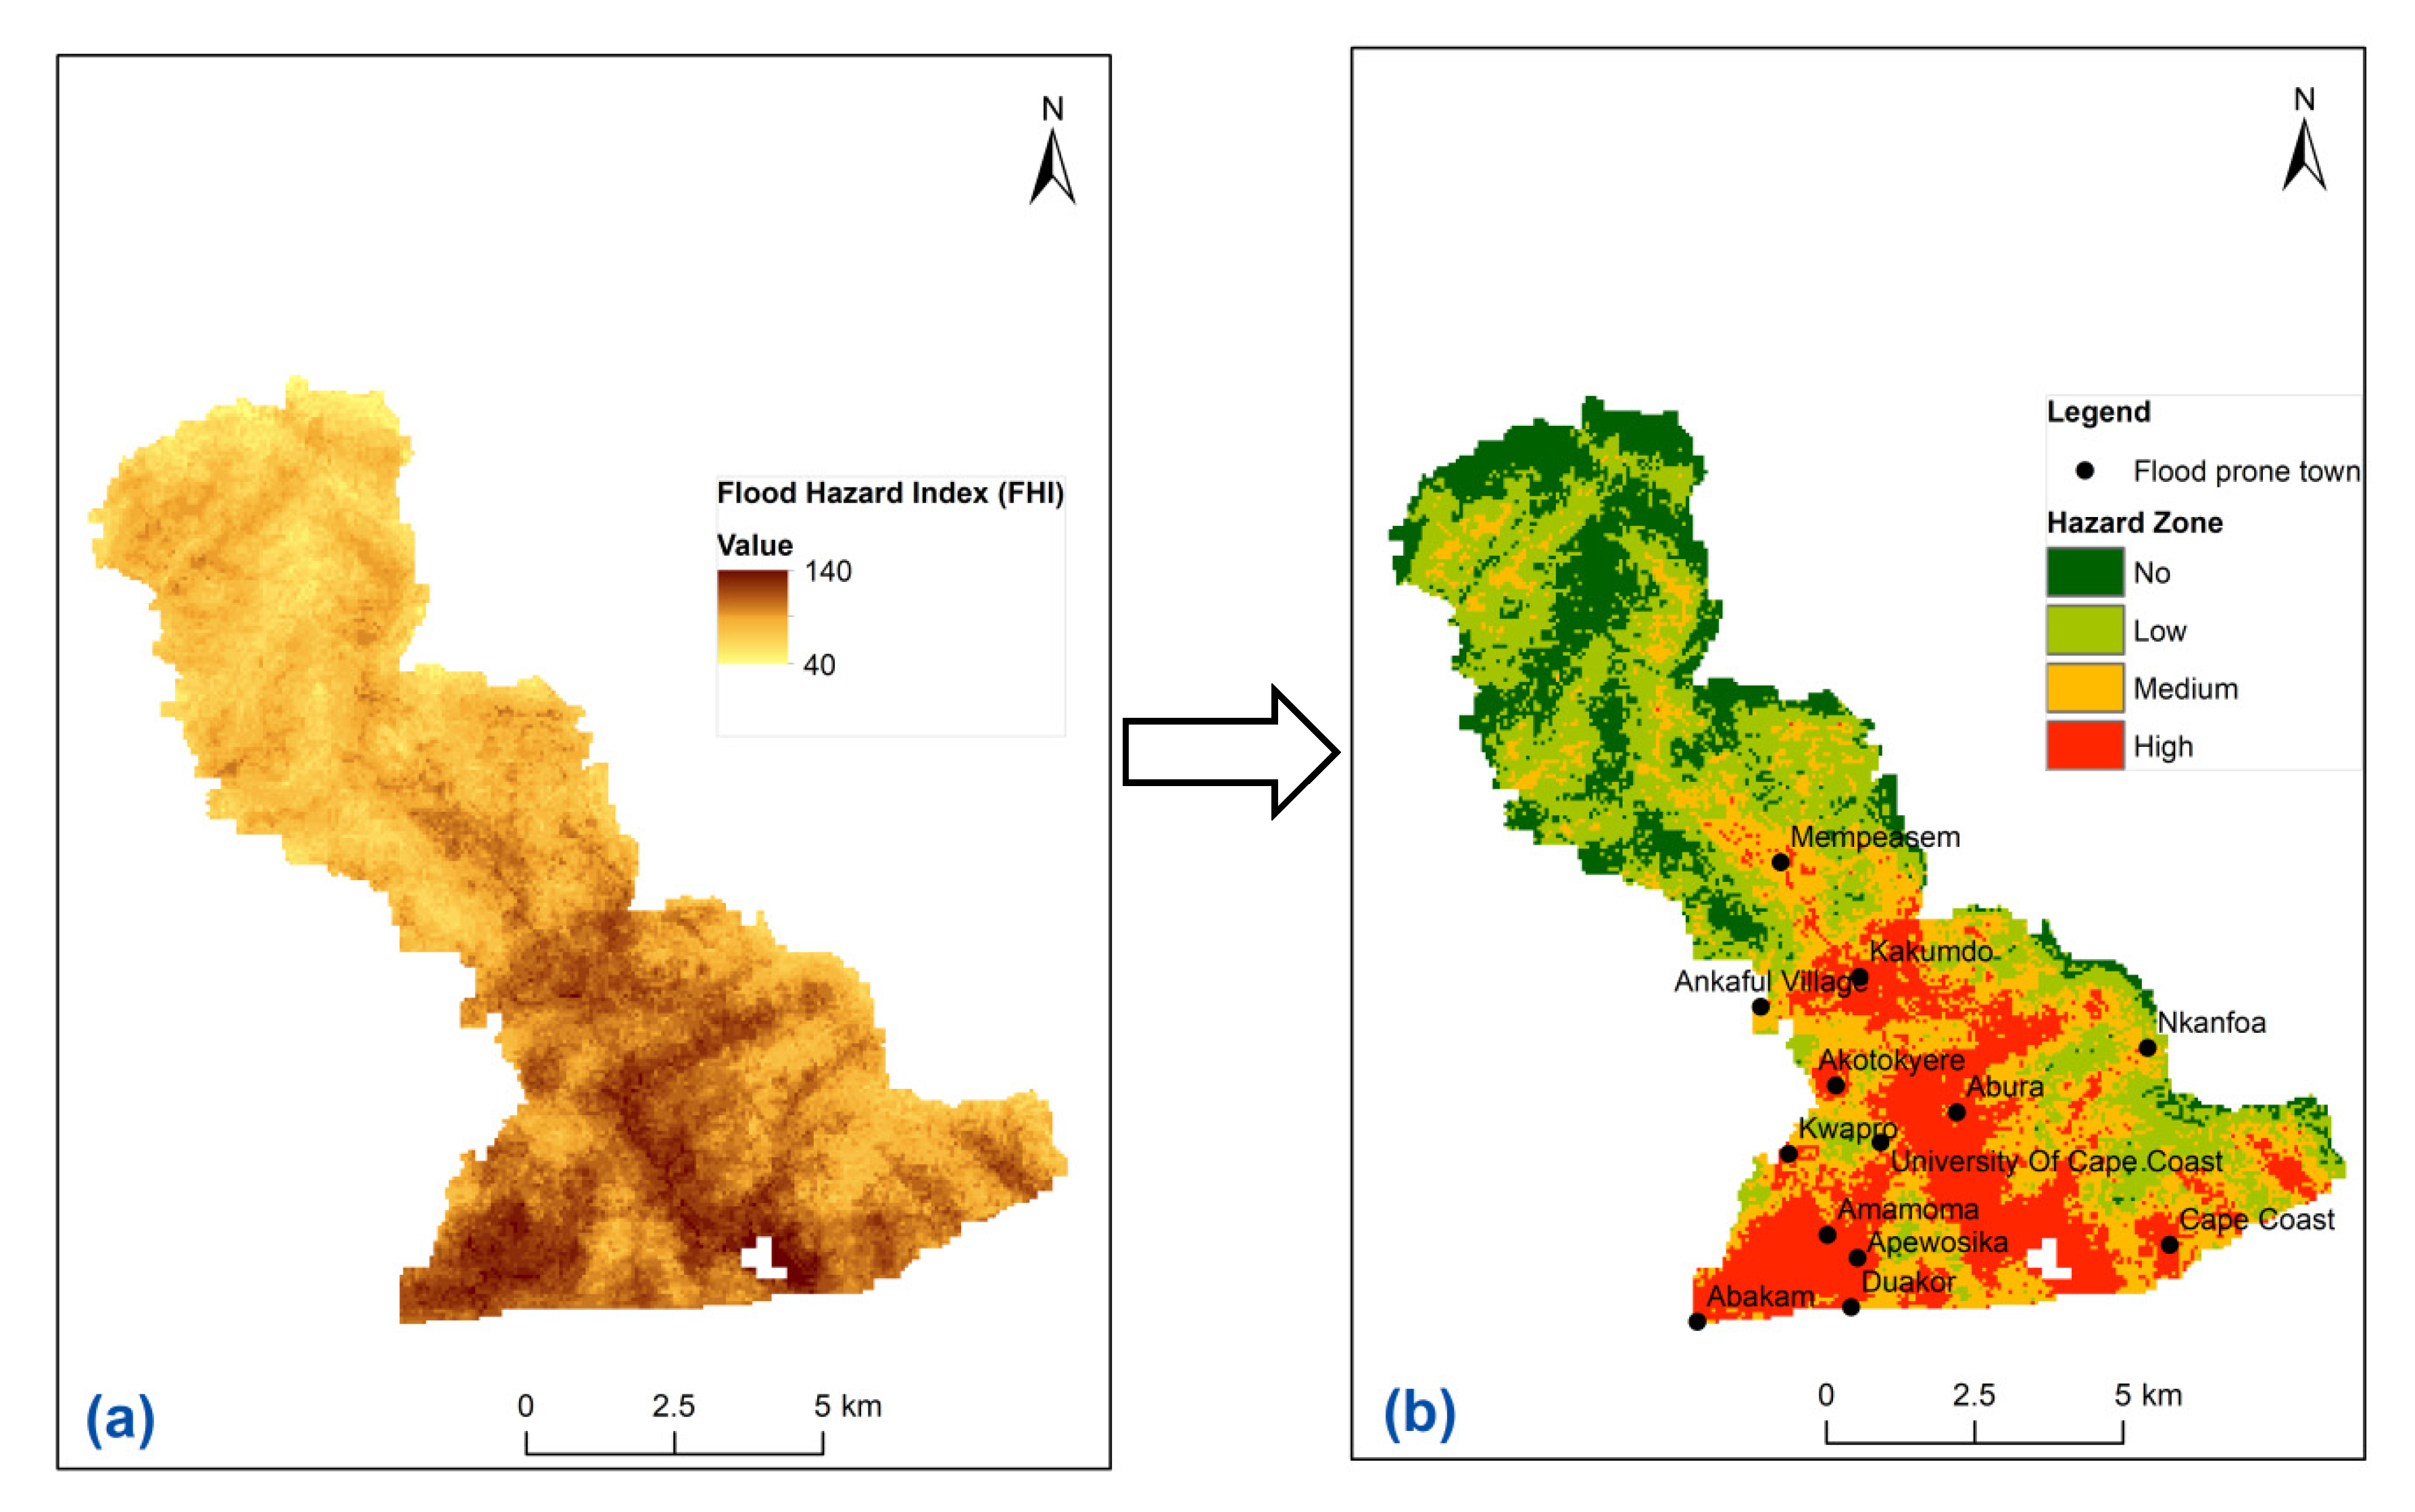
3.2. Flood Hazard Mapping

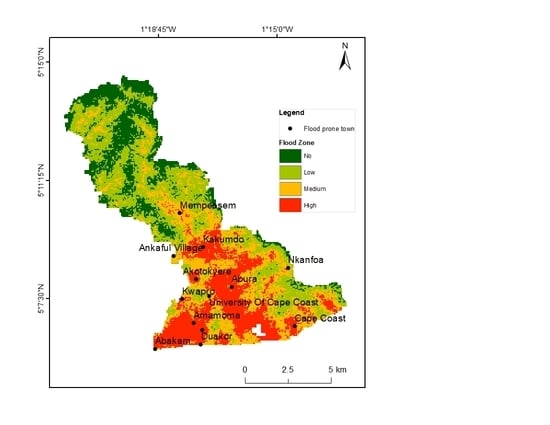
3.2.1. Flood Hazard Zones

The resulting FHI (Figure 5a) was obtained through a combination of the causal factors earlier highlighted in the text. The FHI ranged from 40 (the least score) to 140 (the highest score). A high score is an indication of areas with high susceptibility to flooding and vice versa. To make it easy to interpret and enhance end-user understanding, it was reclassified as a color map into four categories ranging from “no” to “high” flood hazard zones (Figure 5b). This was achieved using the natural break method [11].
Our analysis revealed that high flood hazard zones within the Cape Coast Metropolis (CCM) were concentrated around the coastal areas extending inland up to the middle zone of the study area (Figure 5b). Unlike the outcome in the south of CCM, many places in the hinterlands fall within no (18.18%) or low (33.80%) flood zones. High flood hazard zones cover about 21.94% of the study area. Some of the major characteristics of the hotspots include low slope and elevation values, as well as within few meters from streams. However, both high (21.94%) and medium (26.07%) flood hazard zones constitute 48% of the entire study area.

3.2.2. Flood Hazard Index Validation

We validated the resulting flood hazard index (Figure 5a) using historical flood records from the Central Regional Secretariat of the National Disaster Management Organization (NADMO) to ascertain its authenticity. Historical flood records are relied upon for verifying the accuracy of flood hazard maps generated using GIS [11,40]. Table 3 shows the list of communities in CCM classified as flood-prone. When we plotted these communities on the flood hazard map, as shown in Figure 5b, the outcome confirmed seventeen percent as correctly classified under a medium flood hazard zone with the rest accurately classified as belonging to high flood hazard territory. This proves the success of our technique in mapping potential flood areas.

4. Discussion

Based on geospatial techniques, this study mapped flood hotspots within the Cape Coast Metropolis (CCM) using an index-based approach. To the best of our knowledge, this is the first study to employ an index-based approach to mapping flood hotspots for the study area. The finding that the midsection of the metropolis down to the coastal areas was within medium and high flood hazard zones should be a great concern for both flood management institutions and residents of the CCM. As many communities within the high flood intensity areas were located close to streams as observed in Kwapro, Ankaful, Amamoma, and Duakor (please see Figure 6), much consideration should be given to the relocation of residents close to these streams or building a defense block to prevent flood disaster in the future. Our suggestion corresponds with conclusions in some previous studies indicating that high flood risk zones are usually close to river bodies [11,41] and that relocation of residents can be a life–saving opportunity for people living in such high flood hazard areas [4,41].
Additionally, the dredging of streams can be an effective way of reducing flood hazards in the CCM as in the case of 2016 where concerned authorities sponsored the dredging of the Kakum River at Kwapro, leading to reducing flood cases in Kwapro (Figure 7).
The findings from this study further suggest that flood hazards in the CCM result from the interplay of several factors: elevation, slope, flow accumulation, stream density, and distance from streams; Normalized Difference Vegetation Index (NDVI), soil drainage capacity, and Land use/Land cover (LULC). Areas with low elevation, small slopes, high stream density, low NDVI values, and near the highest flow accumulation were found to be the main hotspots for flooding and vice versa, and these findings confirm the conclusions in previous studies elsewhere [6,13].
Additionally, distance to stream networks played a crucial role in the flood hazard index; many of the communities classified under high flood territories were within a 500 m buffer of river bodies. This finding corresponds with the assumption that distance from river channels plays a critical role in flood inundation; therefore, river overflows should be considered since most rivers overflow their banks when water exceeds the carrying capacity of the river channel [40].
In line with the findings of Nyarko [23], land use played a contributory role in flooding in the Cape Coast Metropolis (CCM), and authorities in the CCM need to discourage deforestation and promote afforestation among residents of the locality. Moreover, it will be prudent for the authorities within CCM to devise strategies to protect wetlands from further encroachment as the resulting flood hazard map showed that most of the wetlands in the CCM are inhabited by people.

4.1. Policy Recommendations

Based on our findings, some recommendations are provided:
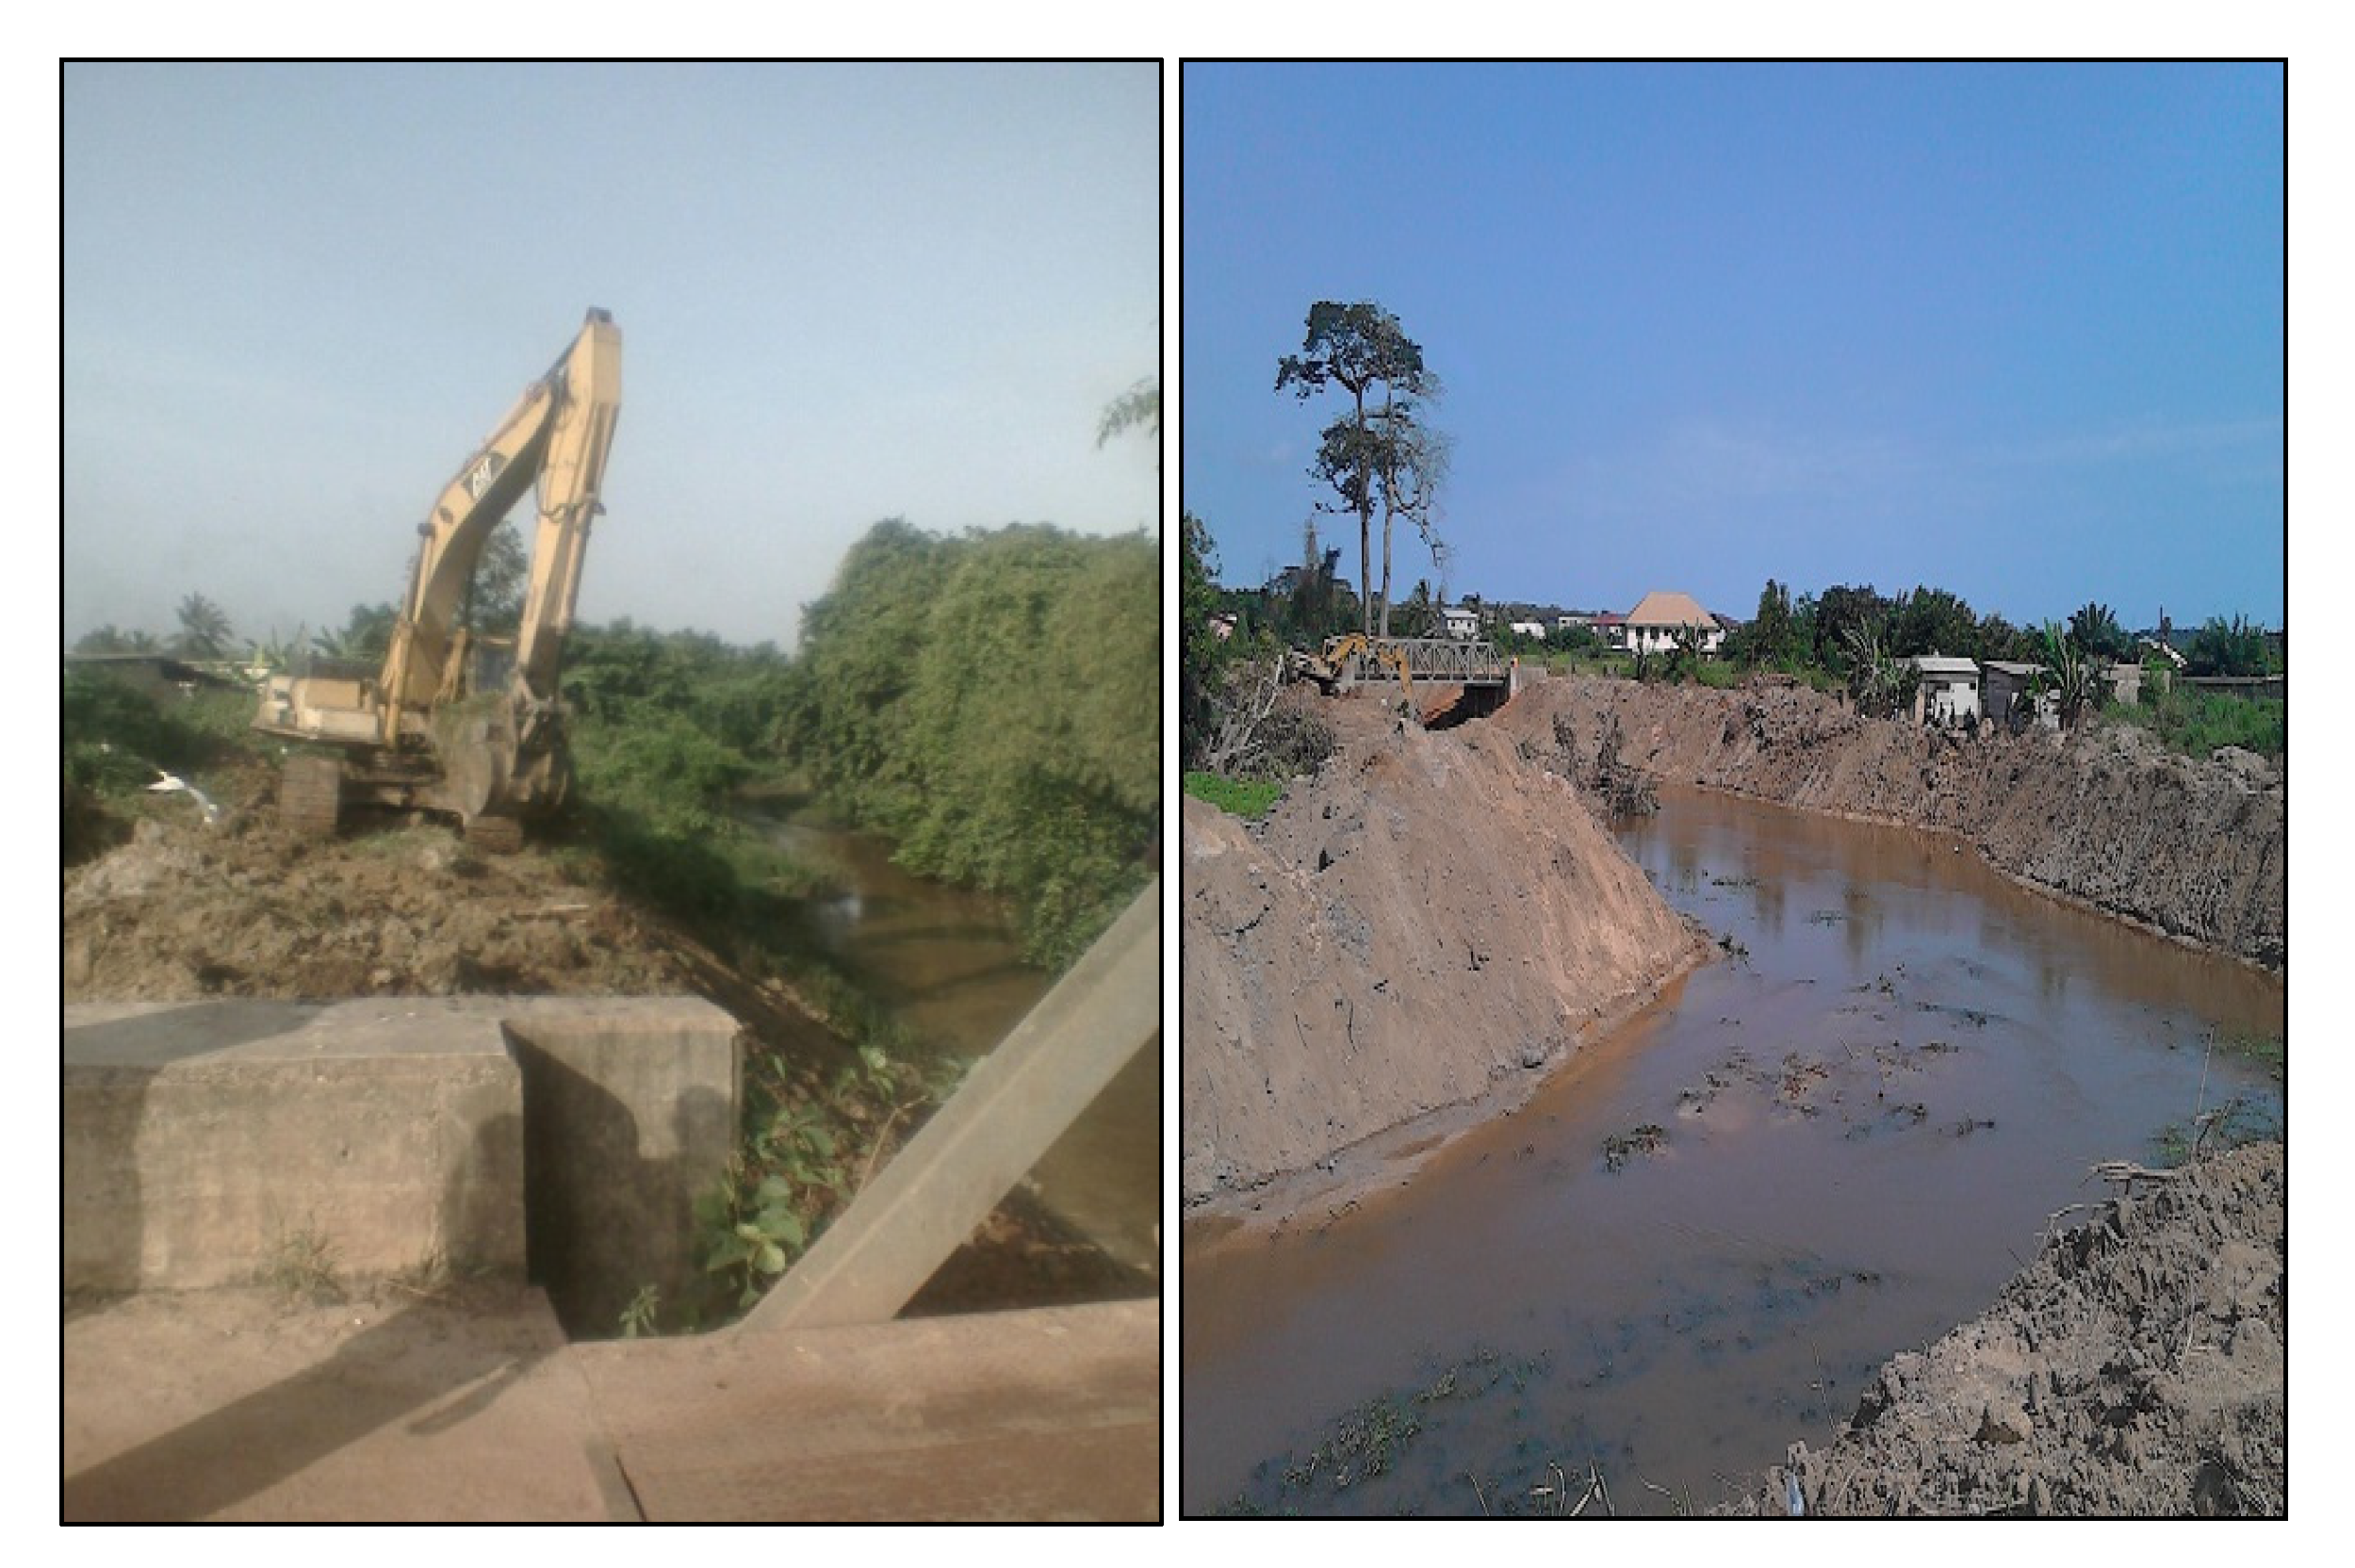
  • The Cape Coast Metropolitan Assembly (CCMA) should fund the dredging of rivers and streams as shown in Figure 7 every two years because the periodic dredging of river networks could salvage the situation. This would require huge financial allocation from the local assembly but would go a long way to reduce flood cases in the Metropolis.
  • Considering the role of vegetation in reducing runoff, it will be prudent on the part of city authorities to plant trees along riverbanks to serve as a buffer. This should be done with the total participation of the local folks since their involvement would prove crucial in ensuring success.
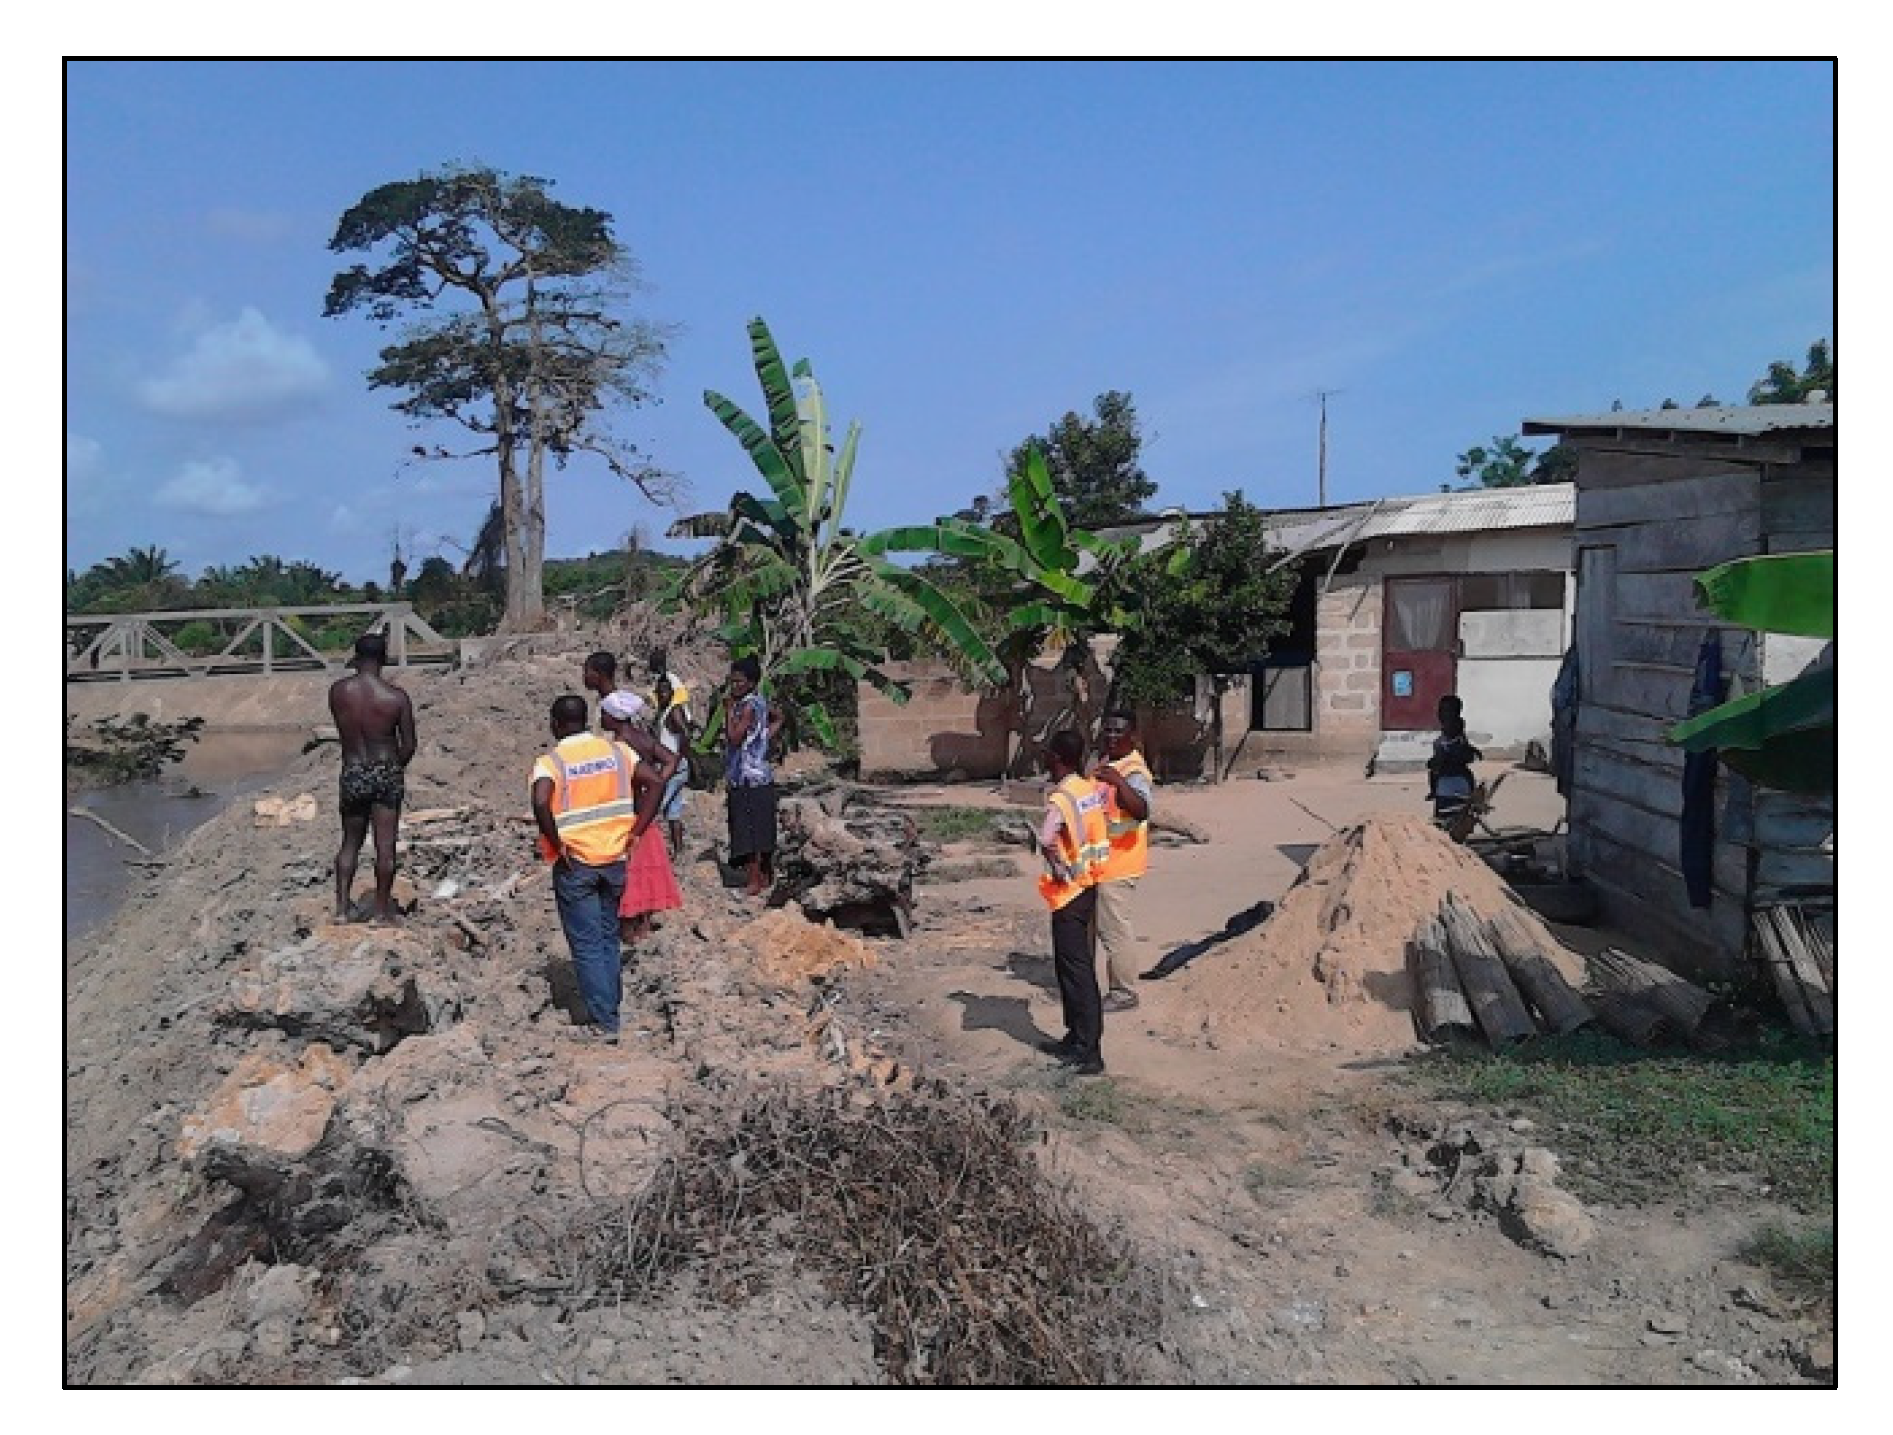
  • NADMO, CCMA, and Ghana Police should work in tandem to ensure strict compliance with buffer zone policies. Authorities must enforce such laws devoid of political interference or favor to deter residents from building close to riverbanks as shown in Figure 6.
  • The Assembly should make the necessary effort to construct concrete banks to prevent sediments from filling the river channel.
  • Residents within the CCM especially those living in flood hazard zones should take education and early warning communication by disaster management organizations seriously to minimize the effects of floods should they occur.
  • Moreover, residents in CCM should construct houses with recourse to building codes since many communities lay within high flood hazard zones.

4.2. Limitations of the Study

Although this study demonstrates novel contributions to the mapping of flood hazards using geospatial technology, some limitations should be noted. Firstly, the study excluded direct rainfall from the factors responsible for flooding. This also comes at the backdrop that the CCM has a fairly good drainage capacity as shown in our findings—the soils in CCM allow water to percolate and did not influence high runoff. Secondly, we did not capture the spilling of excess water from the Brimsu dam in the metropolis. Excess water from this dam is commonly spilled over when the dam reaches its peak capacity. This exercise is intended to protect the dam from collapse but ends up increasing flood risk in the neighboring communities, such as Ankaful. The spilling of the water was not included in the list as this is usually a sponsored venture and the quantification of the amount of water spilled is difficult to measure.

5. Conclusions

Our study explored the use of remote sensing and GIS in mapping flood hotspots within the Cape Coast Metropolis (CCM) using an index-based approach. The study has contributed to the knowledge that simple mapping techniques can be used to determine flood hotspots in areas where data and expertise are major concerns. This study has identified that elevation, slope, flow accumulation, stream density, NDVI, distance from streams, and LULC are key contributory factors to floods in the CCM, and preventive measures can be focused on these factors. It is also worth noting that based on our method, the soil in CCM has been found as a less contributory factor to flooding in the CCM.
To prevent future flood disasters, however, authorities and residents of the CCM can utilize the new findings based on our flood hazard map for the effective planning of the metropolis. We believe that the suggested recommendations if carefully implemented would save lives, properties, and historical monuments in the CCM. The findings and approach used in this study can also be useful for future studies aimed at mapping other flood hazard areas in Ghana and even beyond.

Author Contributions

Conceptualization, S.Y.D.; Data curation, S.Y.D.; Formal analysis, S.Y.D., Y.M., Y.D.A.A. and I.Y.A.; Funding acquisition, Y.M.; Methodology, S.Y.D. and Y.M.; Resources, Y.D.A.A.; Software, S.Y.D.; Supervision, Y.M.; Writing—Original draft, S.Y.D., Y.D.A.A. and I.Y.A.; Writing—Review and editing, Y.D.A.A. and I.Y.A. All authors have read and agreed to the published version of the manuscript.

Funding

This work was supported by the National Key Research and Development Program of China (grant number 2017YFC1405100).

Acknowledgments

Our profound gratitude goes to the Central Regional NADMO Secretariat for providing us with relevant materials for this paper. Special thanks to Adams Osman at the Department of Geography and Regional Planning, University of Cape Coast, Ghana for his suggestions and feedback when contacted.

Conflicts of Interest

The authors declare no conflict of interest. The funders had no role in the design, execution, interpretation, or writing of the study.

References

  1. Khalil, R. Flood Risk Code Mapping Using Multi Criteria Assessment. J. Geogr. Inf. Syst. 2018, 10, 686–698. [Google Scholar] [CrossRef] [Green Version]
  2. Moazzam, M.F.U.; Vansarochana, A.; Rahman, A.U. Analysis of flood susceptibility and zonation for risk management using frequency ratio model in District Charsadda, Pakistan. Int. J. Environ. Geoinform. 2018, 5, 140–153. [Google Scholar] [CrossRef]
  3. Tairi, A.; Elmouden, A.; Aboulouafa, M. Modelling Floods Risk Using GIS in Agadir Morocco. Am. J. Eng. Res. 2018, 7, 34–44. [Google Scholar]
  4. Addo, I.Y.; Danso, S.Y. Sociocultural factors and perceptions associated with voluntary and permanent relocation of flood victims: A case study of Sekondi-Takoradi Metropolis in Ghana. Jàmbá 2017, 9. [Google Scholar] [CrossRef]
  5. Opolot, E. Application of Remote Sensing and Geographical Information Systems in Flood Management: A Review. Res. J. Appl. Sci. Eng. Technol. 2013, 6, 1884–1894. [Google Scholar] [CrossRef]
  6. Amoako, E.O.; Lin, S. Application of Remote Sensing Technique and Geographic Information Science for Flood Risk Mapping-A Case Study of the Offinso District, Kumasi-Ghana. J. Remote Sens. GIS 2018, 7. [Google Scholar] [CrossRef]
  7. Baishya, S.J.; Sahariah, D. Application of Remote Sensing and GIS for Flood Hazard Mapping: A Case Study at Baralia-Nona River Basin, Assam, India. Int. J. Humanit. Soc. Sci. Invent. 2017, 5, 58–70. [Google Scholar]
  8. Forkuo, E.K. Flood Hazard Mapping using Aster Image data with GIS. Int. J. Geomat. Geosci. 2011, 1, 932–950. [Google Scholar]
  9. Sanyal, J.; Lu, X.X. Application of Remote Sensing in Flood Management with Special Reference to Monsoon Asia: A Review. Nat. Hazards 2004, 33, 283–301. [Google Scholar] [CrossRef]
  10. Albano, R.; Sole, A. Geospatial methods and tools for the management and communication of natural risk. ISPRS Int. J. Geo-Inf. 2018, 7, 470. [Google Scholar] [CrossRef] [Green Version]
  11. Asare-Kyei, D.; Forkuor, G.; Venus, V. Modeling Flood Hazard Zones at the Sub-District Level with the Rational Model Integrated with GIS and Remote Sensing Approaches. Water 2015, 7, 3531–3564. [Google Scholar] [CrossRef] [Green Version]
  12. Brivio, P.A.; Colombo, R.; Maggi, M.; Tomasoni, R. Integration of remote sensing data and GIS for accurate mapping of flooded areas. Int. J. Remote Sens. 2002, 23, 429–441. [Google Scholar] [CrossRef]
  13. Aja, D.; Elias, E.; Obiahu, O.H. Flood risk zone mapping using rational model in a highly weathered Nitisols of Abakaliki Local Government Area, South-eastern Nigeria. Geol. Ecol. Landsc. 2019, 4, 131–139. [Google Scholar] [CrossRef] [Green Version]
  14. Danumah, J.H.; Odai, S.N.; Saley, B.M.; Szarzynski, J.; Thiel, M.; Kwaku, A.; Kouame, F.K.; Akpa, L.Y. Flood risk assessment and mapping in Abidjan district using multi-criteria analysis (AHP) model and geoinformation techniques, (Cote d’Ivoire). Geoenviron. Disasters 2016, 3, 10. [Google Scholar] [CrossRef] [Green Version]
  15. Elkhrachy, I. Flash Flood Hazard Mapping Using Satellite Images and GIS Tools: A case study of Najran City, Kingdom of Saudi Arabia (KSA). Egypt. J. Remote Sens. Space Sci. 2015, 18, 261–278. [Google Scholar] [CrossRef] [Green Version]
  16. European Commission. Sendai Framework for Disaster Risk Reduction 2015–2030. Available online: https://ec.europa.eu/echo/partnerships/relations/european-and-international-cooperation/sendai-framework-disaster-risk-reduction_en (accessed on 21 July 2020).
  17. United Nations Office for Disaster Risk Reduction (UNISDR). Sendai Framework for Disaster Risk Reduction 2015–2030. Available online: www.unisdr.org (accessed on 16 May 2019).
  18. United Nations Office for Disaster Risk Reduction (ISDR) and the World Bank Disaster Risk Management Programs for Priority Countries. Available online: https://www.gfdrr.org/node/814 (accessed on 16 May 2019).
  19. Almoradie, A.; Brito, M.M.; Evers, M.; Bossa, A.; Lumor, M.; Norman, C.; Yacouba, Y.; Hounkpe, J. Current flood risk management practices in Ghana: Gaps and opportunities for improving resilience. J. Flood Risk Manag. 2020. [Google Scholar] [CrossRef]
  20. The New Humanitarian West. Africa Flood Round-Up; News of 17 September 2013. Available online: https://www.thenewhumanitarian.org/news/2013/09/17/west-africa-flood-round (accessed on 23 July 2020).
  21. Tarhule, A. Damaging Rainfall and Flooding: The Other Sahel Hazards. Clim. Chang. 2005, 72, 355–377. [Google Scholar] [CrossRef]
  22. Samela, C.; Manfreda, S.; De Paola, F.; Giugni, M.; Sole, A.; Fiorentino, M. DEM-based approaches for the delineation of flood-prone areas in an ungauged basin in Africa. J. Hydrol Eng. 2016, 21, 2. [Google Scholar] [CrossRef]
  23. Nyarko, B.K. Application of a Rational Model in GIS for Flood Risk Assessment in Accra, Ghana. J. Spat. Hydro. 2002, 2, 14. [Google Scholar]
  24. Asumadu-Sarkodie, S.; Owusu, P.A.; Jayaweera, H.M.P.C. Flood risk management in Ghana: A case study in Accra. Adv. Appl. Sci. Res. 2015, 6, 196–201. [Google Scholar]
  25. Asumadu-Sarkodie, S.; Owusu, P.A.; Rufangura, P. Impact analysis of flood in Accra, Ghana. Adv. Appl. Sci. Res. 2015, 6, 53–78. [Google Scholar] [CrossRef]
  26. United Nations Office for the Co-Ordination of Humanitarian Affairs (OCHA). Ghana Floods. Available online: https://reliefweb.int/sites/reliefweb.int/files/resources/030E5488C9AB5C7FC1257758004B7535-Full_Report.pdf (accessed on 22 July 2020).
  27. International Federation of Red Cross and Red Crescent Societies (IFRC). Ghana/Upper East: Floods Emergency Plan of Action DREF Operation no MDRGH016. Available online: https://reliefweb.int/report/ghana/ghana-upper-east-floods-emergency-plan-action-dref-operation-n-mdrgh016 (accessed on 19 July 2020).
  28. Annan-Prah, A.; Amewowor, D.H.A.K.; Osei-Kofi, J.; Amoono, S.E.; Akorli, S.Y.; Saka, E.; Ndadi, H.A. Street foods: Handling, hygiene and client expectations in a World Heritage Site Town, Cape Coast, Ghana. Afr. J. Microbiol. Res. 2011, 5. [Google Scholar] [CrossRef] [Green Version]
  29. Fox, E. Floods Leave Many Dead in Southern Ghana. Available online: https://www.aljazeera.com/news/2016/06/floods-leave-dead-southern-ghana-160616104330811.html (accessed on 23 July 2020).
  30. Frimpong, E.D.; UCC Suspends Lectures Following Campus Floods. Graphic Online. Available online: https://www.graphic.com.gh/news/general-news/ghana-news-ucc-suspends-lectures-following-campus-floods.html (accessed on 30 June 2020).
  31. Mensah, H.; Ahadzie, D.K. Causes, impacts and coping strategies of floods in Ghana: A systematic review. SN Appl. Sci. 2020, 2, 792. [Google Scholar] [CrossRef] [Green Version]
  32. Konadu, D.D.; Fosu, C. Digital Elevation Models and GIS for Watershed Modelling and Flood Prediction—A Case Study of Accra Ghana. In Appropriate Technologies for Environmental Protection in the Developing World; Yanful, E.K., Ed.; Springer: Dordrecht, The Netherlands, 2009; pp. 325–332. ISBN 978-1-4020-9138-4. [Google Scholar]
  33. Kwang, C.; Osei, M.E. Accra Flood Modelling through Application of Geographic Information Systems (GIS), Remote Sensing Techniques and Analytical Hierarchy Process. J. Remote Sens. Gis 2017, 6. [Google Scholar] [CrossRef]
  34. Ministry of Food and Agriculture (MOFA). Cape Coast Metropolitan. Available online: http://mofa.gov.gh/site/directorates/district-directorates/central-region/206-cape-coast-metropolitan (accessed on 30 June 2020).
  35. Ghana Districts. Cape Coast Metropolitan Assembly. Available online: http://ghanadistricts.com/Home/District/67 (accessed on 30 June 2019).
  36. Ghana Statistical Service. 2010 Population and Housing Census. Summary Report of Final Results. Available online: https://www.statsghana.gov.gh/gssmain/storage/img/marqueeupdater/Census2010_Summary_report_of_final_results.pdf (accessed on 23 July 2020).
  37. Kendie, S.B. Employment Structure and the Environment in Cape Coast, Ghana. Singap. J. Trop. Geogr. 1998, 19, 26–38. [Google Scholar] [CrossRef]
  38. Senevirathne, N.; Willgoose, G. A comparison of the performance of DEM pit filling algorithms for hydrology. In Proceedings of the 20th International Congress on Modeling and Simulation, Adelaide, Australia, 1–6 December 2013. [Google Scholar]
  39. Prodanovic, D.; Stanic, M.; Milivojevic, V.; Simic, Z.; Arsic, M. DEM-based algorithms for automatic creation of hydrological models data. J. Serb. Soc. Comput. Mech. 2009, 3, 64–85. [Google Scholar]
  40. Kazakis, N.; Kougias, I.; Patsialis, T. Assessment of flood hazard areas at a regional scale using an index-based approach and Analytical Hierarchy Process: Application in Rhodope–Evros region, Greece. Sci. Total Environ. 2015, 538, 555–563. [Google Scholar] [CrossRef]
  41. Osman, A.; Nyarko, B.K.; Mariwah, S. Vulnerability and risk levels of communities within Ankobra estuary of Ghana. Int. J. Disaster Risk Reduct. 2016, 19, 133–144. [Google Scholar] [CrossRef]
  42. Harris Geospatial. Calculate Confusion Matrices. Available online: https://www.l3harrisgeospatial.com/docs/CalculatingConfusionMatrices.html (accessed on 14 November 2020).
Figure 1. The study area (Cape Coast Metropolis (CCM)).
Water 12 03483 g001
Figure 2. Flowchart for preparing flood hazard map (NDVI—Normalized Difference Vegetation Index; LULC—Land use/Land cover; FHI—Flood hazard index).
Water 12 03483 g002
Figure 3. Four factors considered for flood hazard index: (a) elevation of CCM; (b) slope of CCM; (c) flow accumulation of CCM; (d) stream density of CCM.
Water 12 03483 g003
Figure 4. Remaining factors considered for flood hazard index: (a) distance from major streams in CCM; (b) soil drainage of CCM; (c) NDVI of CCM; (d) LULC of CCM.
Water 12 03483 g004
Figure 5. (a) Flood hazard index (FHI) of CCM; (b) final flood hazard map of CCM.
Water 12 03483 g005
Figure 6. Dwellings located close to the Kakum River in the study area (Credit: Central Regional NADMO Secretariat, Cape Coast).
Water 12 03483 g006
Figure 7. (left) before dredging of Kakum River at Kwapro; (right) after dredging of Kakum River at Kwapro in 2016 (Credit: Central Regional NADMO Secretariat, Cape Coast).
Water 12 03483 g007
Table 1. Classes of each factor and corresponding rank values.
FactorClassesRank for Factor
Elevation0–25 20
25–44 15
44–62 10
62–112 5
Slope (%)0–5 20
5–12 15
12–22 10
>22 5
Flow Accumulation>12,00020
5000–12,000 15
1500–5000 10
<15005
Stream Density>4020
33–4015
25–3310
8–255
Distance from Streams (Meters)0–200 20
200–500 15
500–1000 10
>10005
Normalized Difference Vegetation Index (NDVI)0.024–0.18620
0.186–0.265 15
0.265–0.33210
0.332–0.423 5
Soil Drainage CapacityVery Poor20
Poor15
Imperfect10
Moderate/Well5
Land Use/Land Cover (LULC)Urban20
Water15
Sparse Vegetation10
Dense Vegetation5
Table 2. Confusion/error matrix of land use/land cover classification of the Cape Coast Metropolis.
ClassWaterTownDense VegetationSparse VegetationRow TotalUser’s Accuracy
Water231032785.18%
Town015412618185.08%
Dense Vegetation083221534593.33%
Sparse Vegetation3202120424882.25%
Column Total26183344248801
Producer’s Accuracy88.46%84.15%93.6%82.25%
Overall Accuracy = 87.86%; Kappa Coefficient = 0.816.
Table 3. Top 12 Flood-prone communities in the Cape Coast Metropolis in 2018.
No.Flood-Prone CommunityPopulation
1.Abakam/Duakor601
2.Abura/Ayifoa18,829
3.Adisadel Village10,824
4.Amamoma1312
5.Ankaful1956
6.Antam10,824
7.Apewosika1901
8.Kakumdo3229
9.Kwapro1810
10.Mempeasem1066
11.Nkanfoa3680
12.North Ola/Ameen Sangari 12,210
Source: Central Regional National Disaster Management Organization (NADMO) Secretariat, Cape Coast.
Publisher’s Note: MDPI stays neutral with regard to jurisdictional claims in published maps and institutional affiliations.

