Quantifying the Impacts of Climate Change and Human Activities on Runoff in the Lancang River Basin Based on the Budyko Hypothesis

Key Laboratory of Geographic Information Science, Ministry of Education, East China Normal University, Shanghai 200241, China
*
Author to whom correspondence should be addressed.
Water 2020, 12(12), 3501; https://doi.org/10.3390/w12123501
Submission received: 12 November 2020
/
Revised: 6 December 2020
/
Accepted: 9 December 2020
/
Published: 13 December 2020
(This article belongs to the Special Issue Hydrological Modeling in Water Cycle Processes)
Abstract
:Based on the Lancang River Basin (LRB) hydro–meteorological data from 1961 to 2015, this study uses the Mann–Kendall trend test and mutation test to analyze the trend of hydro–meteorological variables, as well as which year the runoff series changes, respectively. We applied the Choudhury–Yang equation to calculate the climate and catchment landscape elasticity of runoff. Then we quantified the impact of climate change and human activities on runoff change. The results show that: (1) the mean annual precipitation (P) in LRB showed an insignificant decline, the annual potential evapotranspiration (E0) showed a significant increase, and the runoff depth (R) showed a significant decrease; (2) the abrupt change of the R occurred in 2005. Both the climate and catchment landscape elasticity of runoff increased, which means that the hydrological process of LRB became more sensitive to climate changes and human activities; (3) compared with the base period (1961–2004), the reduction of P was the leading cause of runoff reduction, with a contribution of 45.64%. The contribution of E0 and human activities to runoff changes are 13.91% and 40.45%, respectively.
1. Introduction
Under the impact of climate change and human activities, the water cycle process of many basins worldwide has significantly changed [1]. Since the 21st century, the runoff of China’s Haihe, Yellow, and Liaohe rivers decreased significantly, aggravating the conflict between regional water supply and demand [2]. Runoff is an essential form of water resources and is closely related to climate change and human activities. Human activities mainly affect runoff changes through land use/cover changes and engineering construction [3]. Climate change affects the runoff by changing the temporal and spatial distribution of precipitation, surface evaporation, and others [4,5].
Hu–line is an important geographical boundary between China and Southeast Asia. The geographical environment at the end of the line is just the Lancang–Mekong River Basin. Understanding its water resources change under climate change is a geographical science basis for understanding the ecological environment of Southwest China and Lancang–Mekong River Basin. As the Mekong River’s upper reaches, the Lancang River (LR) is an important international cross–border river connecting China and Southeast Asia. Its water resources are important for the development of countries in the basin. LR straddles several climatic regimes along latitude direction with huge climate differences and is a sensitive area to global climate change. The lower LR reaches through Southeast Asian countries, regulating the dry season river runoff of downstream countries. The utilization and management of water resources in LR have been highly concerned by organizations and governments worldwide. In recent years, some scholars have studied the runoff variation of the Lancang River Basin (LRB). Bi et al. [6] believed that climate change is the main reason for runoff decrease in the lower reaches of LRB. Human activity is another vital cause of runoff variation. The construction of the LR cascade hydropower station has a regulatory effect on downstream runoff. This regulation has decreased the peak discharge in the wet season and increased the discharge in the dry season, resulting in a runoff distribution more even in the lower LR reaches [7,8,9,10]. Gu et al. [7] believe that Manwan and Dachaoshan hydropower stations have less regulation effects on downstream runoff, while Xiaowan, Nuozhadu, and Jinghong hydropower stations are more significant after construction completed. The upstream hydropower stations are conducive to flood control and utilization of water resources. Based on the analysis of hydro–meteorological variables in LRB, Li et al. [11] considered that 2005 was the year of abrupt change in runoff series. Han et al. [12] deemed that 2008 was the year of abrupt change, and divided 1980–2014 into three periods: the base period (1980–1986), the transition period (1987–2007), and the post–impact period (2008–2014). Thus far, the quantitative attribution of the impact of climate change and human activities on runoff in LRB is still rare.
The intensive variability has greatly influenced the catchment water cycle in land use/cover, precipitation, and air temperature due to climate change and human activities [13]. Many scholars have studied catchment hydrological response to those changes in different basins around the world. Conventionally, physical–based hydrologic models and the elasticity method based on the Budyko hypothesis are two commonly used approaches.
Ma et al. [14] applied a distributed hydrologic model to assess the impact of climate variability and human activity on runoff decrease in Miyun reservoir catchment in China. Results show that climate was accountable for 55% of the decline in reservoir inflow and human activity was accountable for 18%. Zhang et al. [15] did the same thing in the Huifa River Basin, Northeast China, by applying the Soil and Water Assessment Tool (SWAT), and found that climate change could decrease or increase runoff depending on precipitation, temperature, radiation variation, and land cover changes. Human activities generally lead to a decrease of runoff, especially in wet years, due to regulation and storage of the water projects. Wu et al. [16] used SWAT to estimate the proportional influence of climate change and human activities on decreases in runoff in the Yanhe River Basin from 1997 to 2011. Climate change and human activities contributed 55.8% and 44.2%, respectively, of the total reduction in runoff. Hydrologic models are physically realistic, but often limited due to model calibration and validation, the requirement of high-resolution datasets, and uncertainty in model structures and parameter estimations [17,18,19,20].
With the application of the Budyko hypothesis, scholars have derived a series of specific Budyko formulas from different perspectives. Fu [21] considered the rate of change of evaporation with precipitation and potential evaporation, respectively; Choudhury [22] and Yang [23] evaluated the principle of water and energy balance; Zhang [24] considered the influence of vegetation. These methods are simple to implement and has a low requirement for the dataset. Still, a long time series of observation data are needed because the data series length impacts the accuracy of results. Xu et al. [13] conducted an attribution analysis based on the Budyko hypothesis for detecting the dominant cause of runoff decline in the Haihe basin. Three elasticity of runoff are derived based on the Choudhury–Yang equation: precipitation, potential evapotranspiration, and catchment landscape elasticity of runoff. For 33 catchments in the Haihe basin, the mean annual runoff decreased by 43.0 mm from period 1 (91.4 mm) to period 2 (48.4 mm). Impacts of climate variation and land use/cover change are accountable for the runoff decrease by 26.9% and 73.1% on average, respectively. Liang et al. [25] explored the streamflow (Q) response to ecological restoration (ER) and climate change during the period 1961–2009 by using elasticity and decomposition methods based on the Budyko framework in China’s Loess Plateau. The results show that (1) Q is more sensitive to changes in precipitation (P) than that in evapotranspiration (E0); (2) the two methods consistently demonstrated that, on average, ER (62%) contributing to Q reduction was much larger than that of climate change (38%). Besides, the catchment parameter n is positively correlated with ER. Donohue et al. [26] applied a method based on the Budyko framework, referred to as the Choudhury–Yang equation by Roderick and Farquhar [27] in the Murray Darling Basin in Australia. Results emphasize the importance of the spatial variation in runoff sensitivity, which is low for the whole basin, and moderate–high in high–yielding catchments. These studies strongly proved that the Choudhury–Yang equation, a water–energy balance equation based on the Budyko hypothesis, can be used worldwide and achieve satisfactory results.
This study aims to quantify the climate and human impacts on runoff using observed runoff data in conjunction with trend analysis and the Budyko hypothesis. First, this study analyzes the trend of hydro–meteorological variables and the abrupt change of runoff series by the Mann–Kendall trend test and mutation test, respectively. Then, the Choudhury–Yang equation is applied to calculate the climate and the catchment landscape elasticity of runoff. Finally, the contribution of climate change and human activities to runoff change are obtained. This study reveals the driving factors of runoff change in LRB and provides some theoretical support for cross-border water resource allocation and basin management in LRB.
2. Study Area and Data
2.1. Study Area
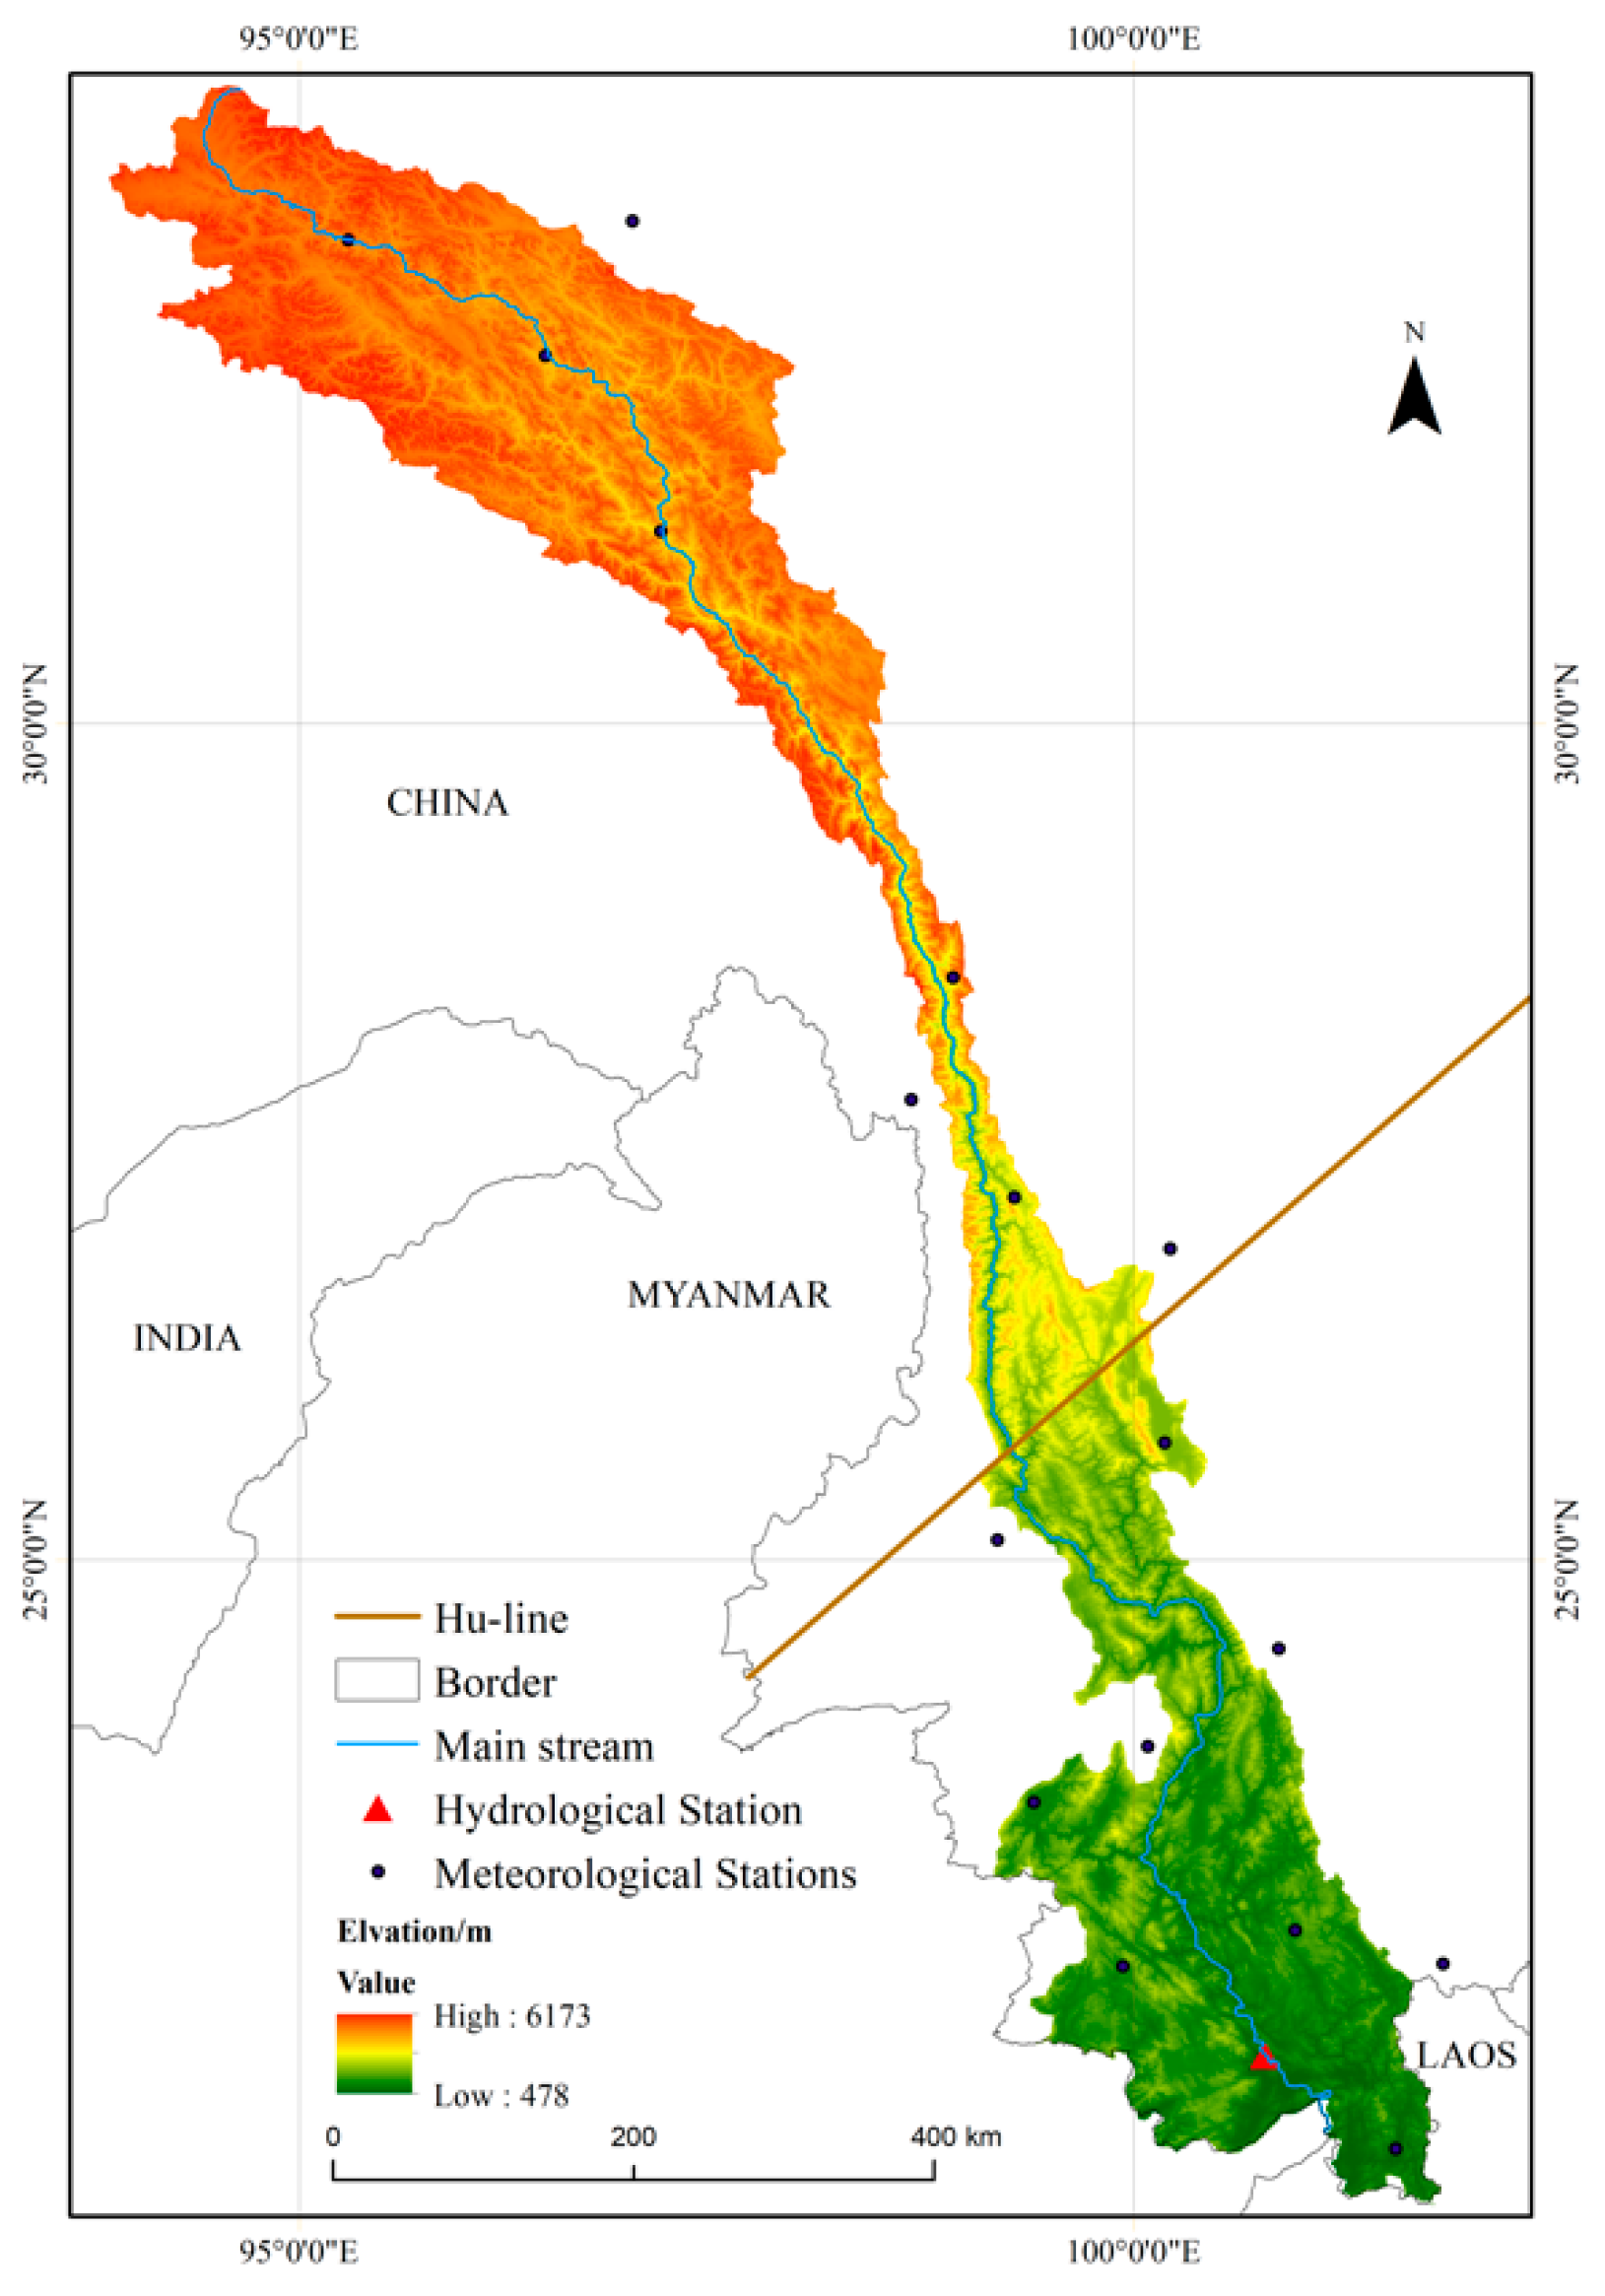
LR originates from Qinghai Province, China. It is the name of the Mekong River in China. LRB ranges from 22°05′–33°40′ N to 93°50′–101°30′ E. The Lancang–Mekong River flows through Qinghai, Tibet, and Yunnan in China. It passes through Mengla County, Xishuangbanna, Yunnan Province, and then flows through Myanmar, Laos, Thailand, and Cambodia, finally flowing into the South China Sea at Saigon, Vietnam. It is the largest international river in Southeast Asia [28]. The total length of the mainstream of LR is 2161 km, the catchment area is 167,487 km2, and the average altitude is 3058 m. It can be seen from Figure 1, except for the snow peak, the mountains in the upper reaches are generally flat to gently undulating. The mountains and valleys in the middle reaches are sheer, the river bed slope is steep, and the shape of the basin is long and narrow; the terrain of the lower reaches is gentle [29]. The basin terrain decreases from north to south, including almost all of the natural landscapes and climate types in the world except Gobi and desert [30].
2.2. Data
The observed runoff data of Yunjinghong hydrometric station in the lower LR reaches from 1961 to 2015 are from the Hydrological Yearbook and National Earth System Science Data Center. The daily meteorological data of 18 stations from 1961 to 2015 are from the National Meteorological Information Center, including precipitation, average temperature, maximum and low temperature, sunshine hours, average wind speed, and relative humidity. Then the potential evapotranspiration was calculated according to the Penman–Monteith equation:
where is reference evapotranspiration (mm day−1), is net radiation at the crop surface (MJ m−2 day−1), is soil heat flux density (MJ m−2 day−1), is mean daily air temperature at 2 m height (°C), is the wind speed at 2 m height (m s−1), is saturation vapor pressure (kPa), is actual vapor pressure (kPa), is saturation vapor pressure deficit (kPa), is slope vapor pressure curve (kPa °C−1), is psychrometric constant (kPa °C−1).
3. Methodology
3.1. Mann–Kendall Trend Test
Mann–Kendall (MK) non–parametric trend test [31,32] is recommended by the World Meteorological Organization. It can effectively distinguish whether a natural process is in natural fluctuation or has a certain change trend. It is widely used in the trend analysis of climate and hydrological series [33]. In this study, we applied the MK test to analyze the hydro–meteorological series trend in LRB from 1961 to 2015, and calculate its magnitude and direction. When the Z value is positive, it indicates an increasing trend, and the negative value indicates a decreasing trend.
3.2. Mann–Kendall Mutation Test
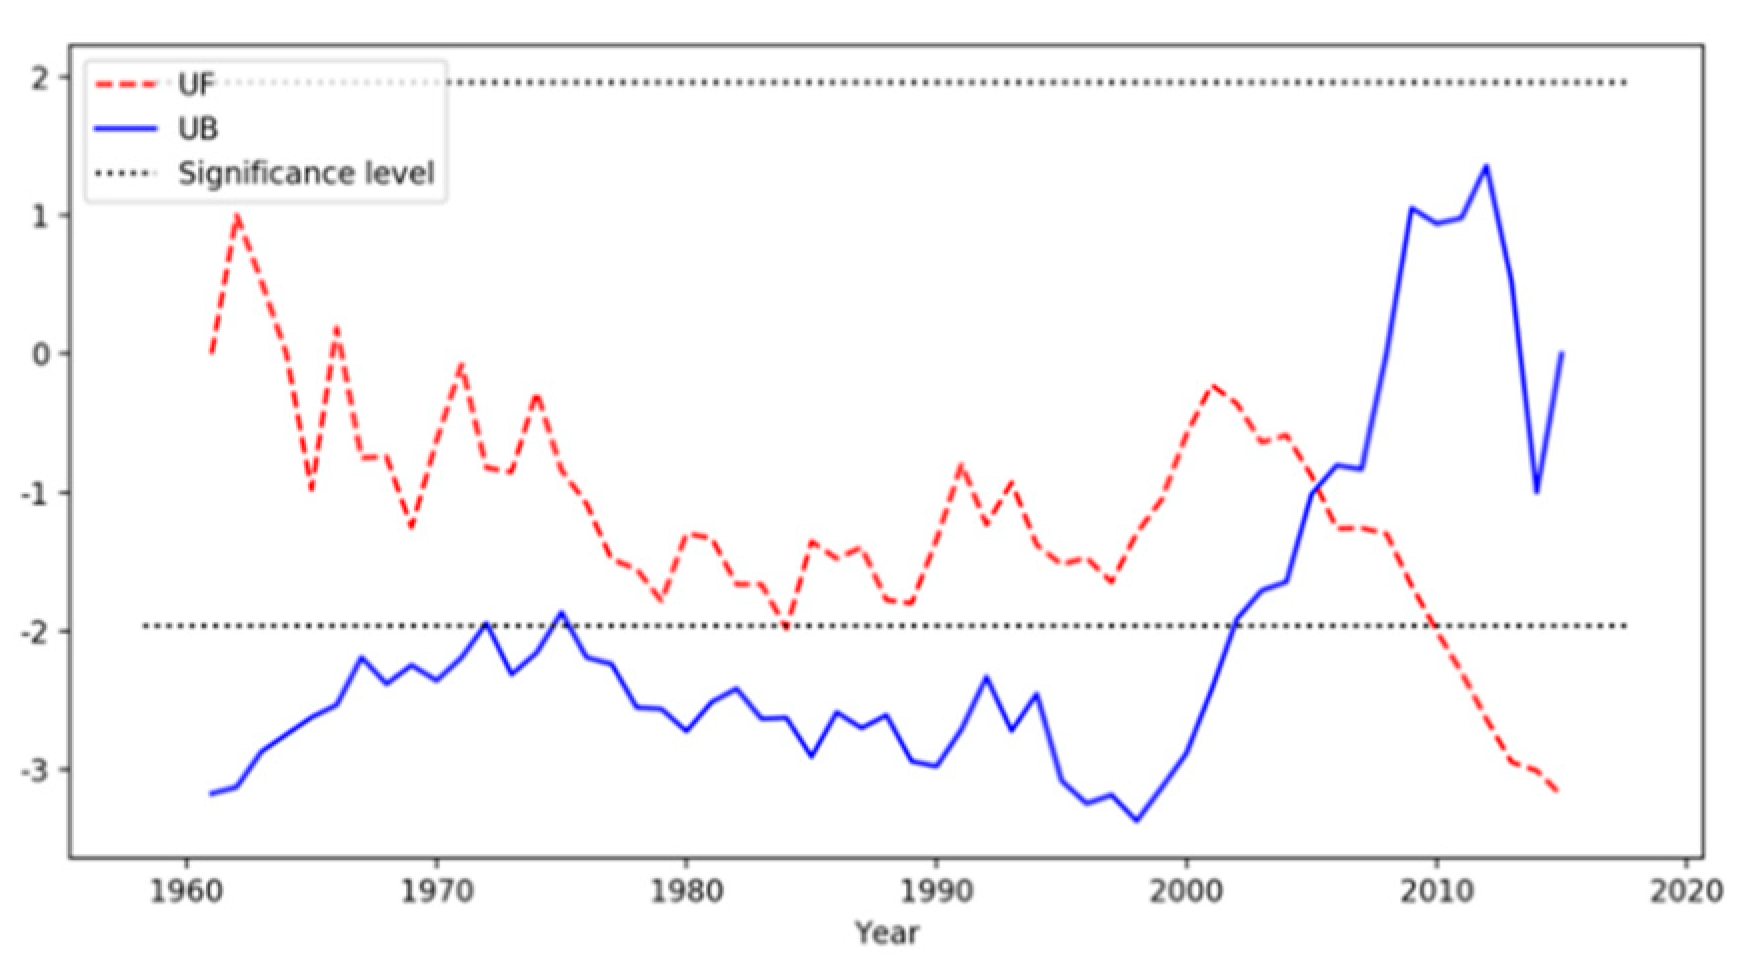
Mann–Kendall mutation detection test [34] is an effective method to detect the abrupt year of runoff series. Yan et al. [35], Song et al. [36], Wang et al. [37] have detected the hydro–meteorological series in different regions and obtained reliable results using this method. This study applied this test to detect the runoff depth series mutation from 1961 to 2015 of Yunjinghong hydrometric station. UF, UB are calculated, and the critical value when the significance level . The mutation point is at the intersection between the UF curve and the UB curve, and is within the critical value range.
3.3. Budyko Hypothesis
Budyko hypothesis [38] states that the actual evapotranspiration is a function of precipitation and potential evapotranspiration:
where E0 is potential evapotranspiration (mm), is actual evaporation (mm), and is precipitation (mm).
According to the Budyko hypothesis, Choudhury [22] and Yang [23] considered the principle of water and energy balance and deduced the Choudhury–Yang water–energy balance equation as Equation (3). The equation is used to represent the mean annual water–energy balance. It describes the Budyko hypothesis by combining dimensional analysis and mathematical reasoning. It is also a useful theoretical tool to evaluate the effect of climate and land–use changes on the water cycle [23].
where n is the parameter reflecting the characteristics of the catchment landscape, including topography, soil, and vegetation [39].
Over a long-term water cycle, it is reasonable to assume the change in soil water storage () is zero. Therefore, the long-term water balance equation is , combining Equation (3), we derived:
where R is the mean annual runoff depth (mm).
The elasticity of R for the independent variable x can be written as:
R’s rainfall elasticity means the change rate of annual R relative to mean annual R, when annual P increased by 1%. Similarly, catchment elasticity can be defined as the variation of R caused by catchment landscape changed per unit [39]. Assuming , the rainfall elasticity (), the potential evapotranspiration elasticity (), and the catchment landscape elasticity () of R are written as Equations (6)–(8) [13,40]:
3.4. Attribution Analysis of Runoff Change
According to the mutation point detected in Section 3.2, the time series is divided into two periods T1 and T2. The mean annual R, , P, and n of the two periods are calculated respectively. Then, the annual R variation from T1–T2 can be expressed as the difference of the mean R of two periods (), as follows:
Similarly, the variation of P, E0, n can be described as follows:
The is attributed to the impacts of climate change () and catchment landscape change (). Assuming that is mainly caused by land use/cover change, and includes the impact of precipitation variation on runoff () and potential evapotranspiration variation on runoff (). The equations are as follows:
The contribution of each variable to runoff change is calculated as follows:
where , and are the contribution of precipitation, potential evapotranspiration, and human activities to runoff change, respectively.
4. Results and Analysis
4.1. Trend of Hydro–Meteorological Variables
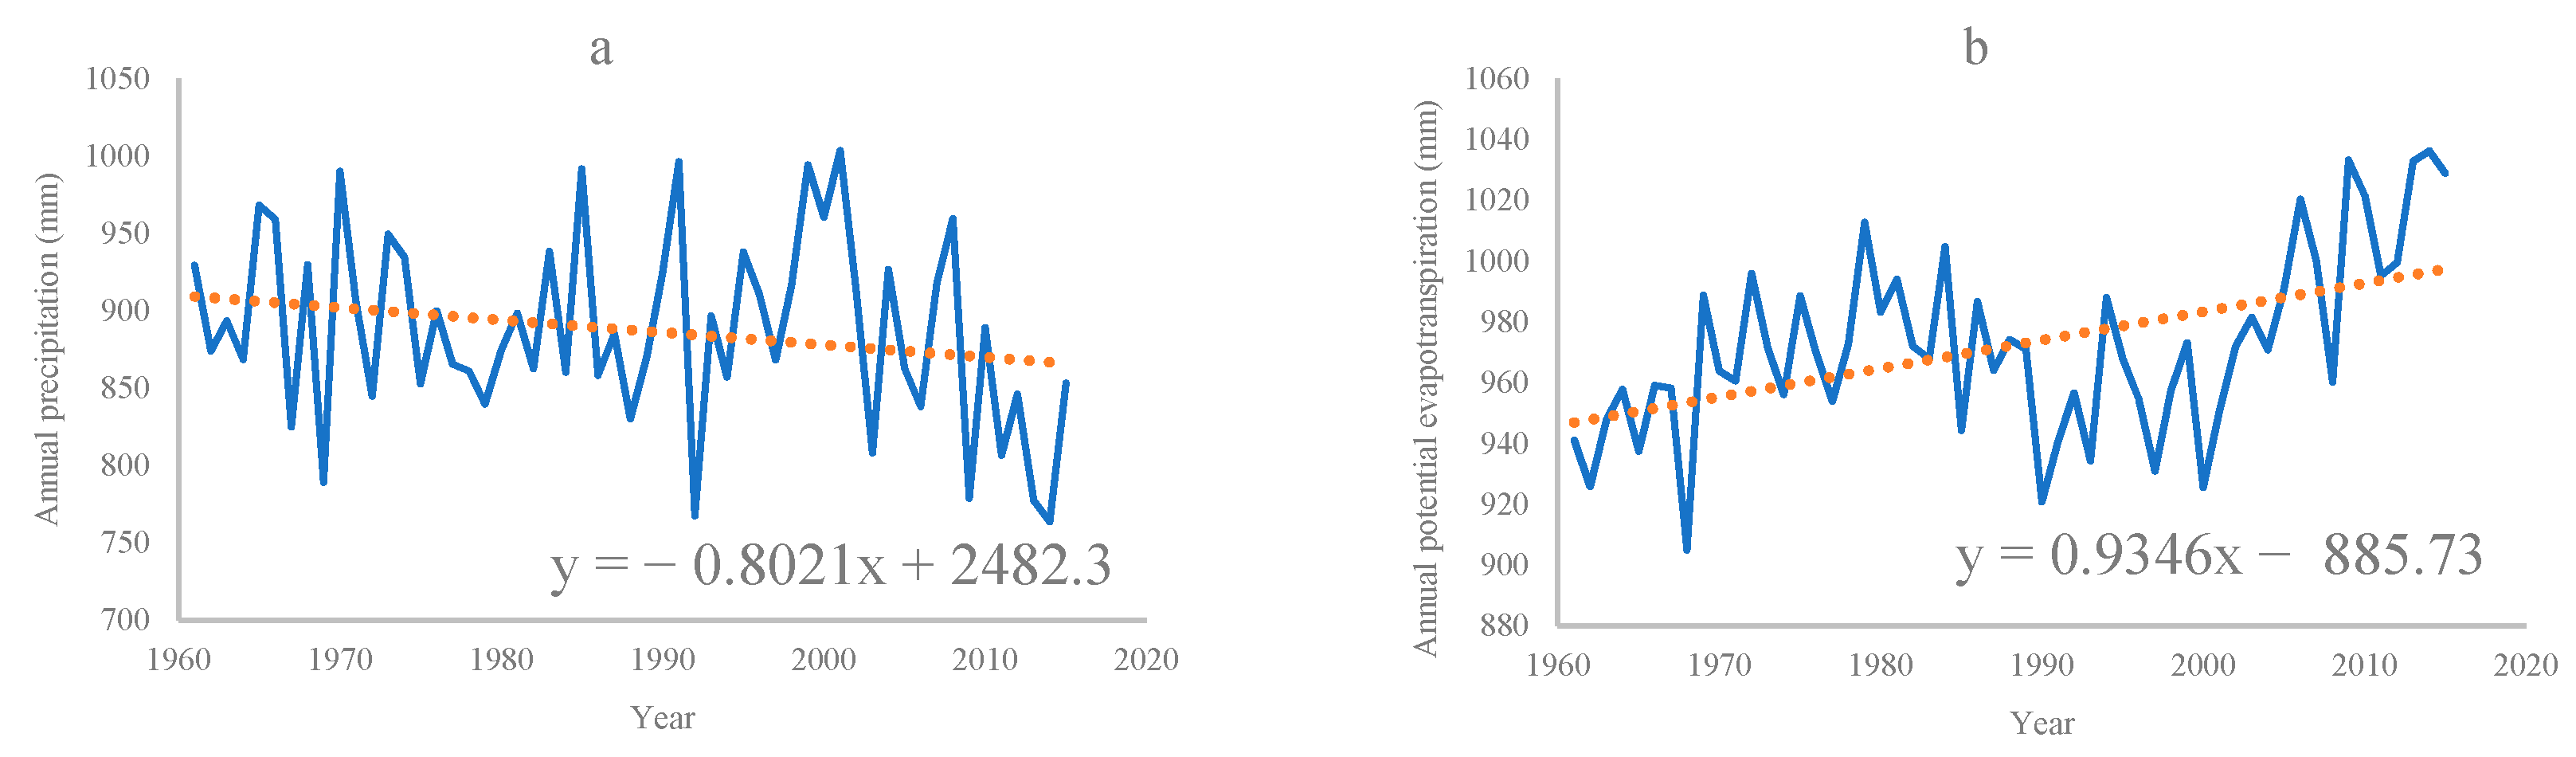
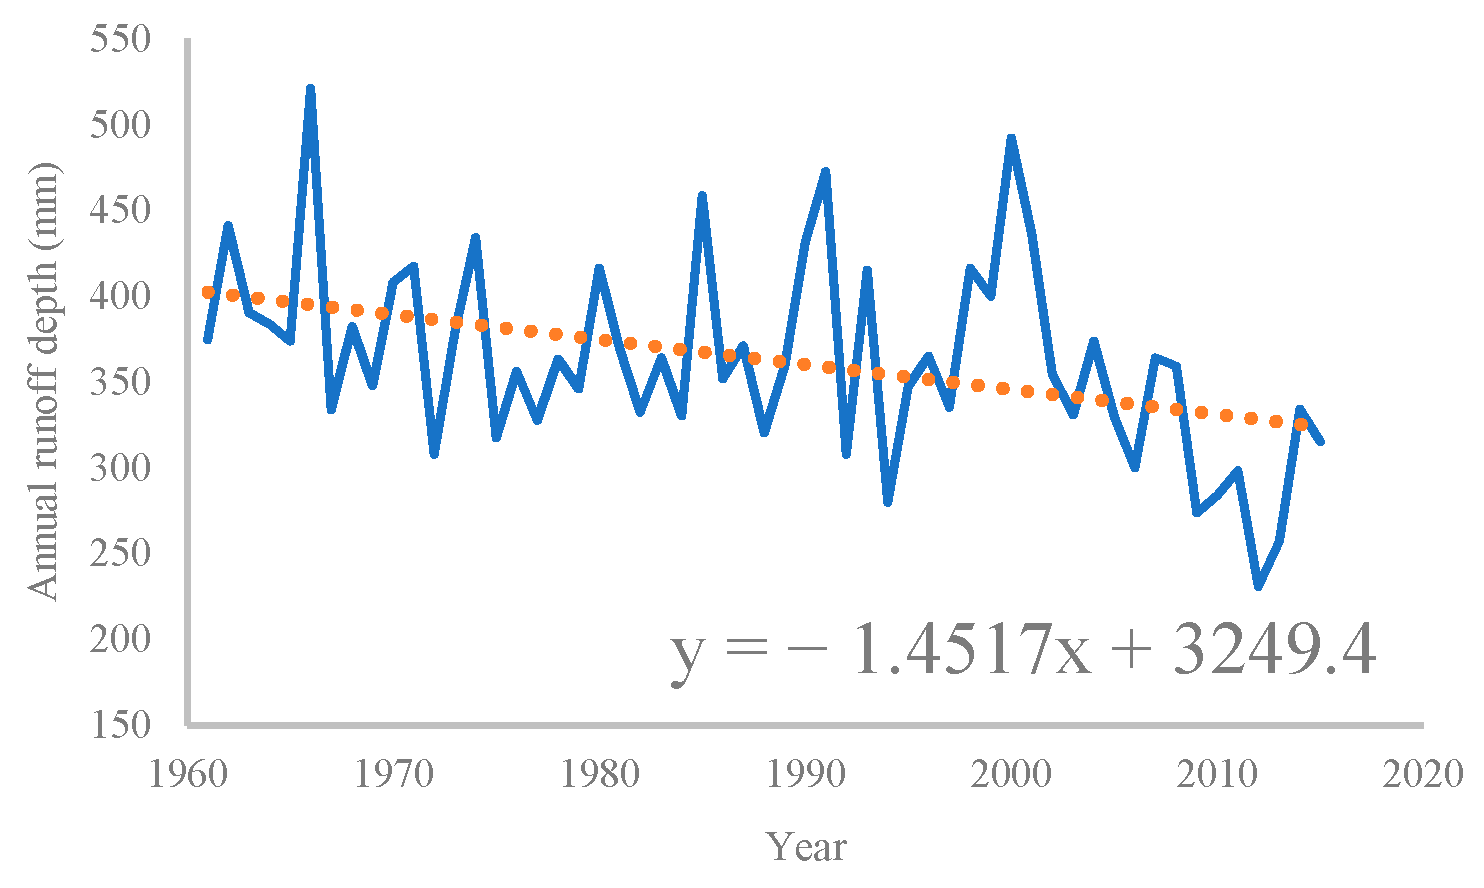
Figure 2 shows the interannual variation of P and E0 in LRB from 1961 to 2015. Figure 3 shows the interannual variation of R of Yunjinghong hydrometric station from 1961 to 2015. The annual P generally presents a slight downward trend, the annual E0 presents a slight upward trend, and the annual R presents a relatively apparent downward trend.
Catchment parameter n for each year is calculated by Equation (3). Then set R as the dependent variable and performed regression analysis with three independent variables that affect it, respectively. Results are shown in Table 1 below. R is positively correlated with P, negatively correlated with E0 and n, and all passed α = 0.001 significant test.
Using the MK trend test to detect the annual P, E0, and R in LRB, and the results are shown in Table 2. From 1961 to 2015, the Z value of annual P is −1.44, which means that annual P shows a downward trend but not significant; for E0 is 3.50, which shows an extremely significant increase trend; for R is −3.17, which presents an extremely significant decrease trend.
4.2. Detection Result of Mutation
Figure 4 shows the MK mutation detection results of R of Yunjinghong hydrometric station from 1961 to 2015. The curve UF and curve UB intersect in 2005, and the intersection point is within the range of significance level —the critical value range . Then 2005 can be regarded as the year of abrupt change of R. It should be noted that, in November 2004, to construct Xiaowan hydropower station, the river closure was carried out. Based on this, 2005 can also be inferred as the year of abrupt change of R. Li et al. [11] also used MK mutation test to detect the abrupt change of LR runoff from 1958 to 2015 and obtained the same results—the year of abrupt change was 2005. In this study, 1961–2004 is set as the first period and 2005–2015 as the second period for the subsequent analysis of Runoff Change Attribution.
4.3. The Climate and Catchment Landscape Elasticity of Runoff
According to MK mutation detection results, the time series is divided into two periods: 1961–2004, which can be regarded as a period of no or less human activities, named the base period; 2005–2015, regarded as a period of human activities. According to the Choudhury–Yang equation, the mean annual P, , R, n, R/P, , , , and are calculated for the two periods, respectively.
Table 3 presented that compared with the base period, P and R during the human activity period decreased by 53.59 mm and 78.54 mm; and n increased by 48.21 mm and 0.12; the mean annual runoff coefficient R/P decreased by 0.07; the mean annual drought index increased by 0.12, but LRB is still a semi–humid area in general. The absolute value of , , increased by 0.12, 0.12, 0.13, respectively, indicated that R is more sensitive to all three variables in period 2. When annual P, E0, n increases by 1%, R will increase by 0.12% and decrease by 0.12%, 0.13%, respectively.
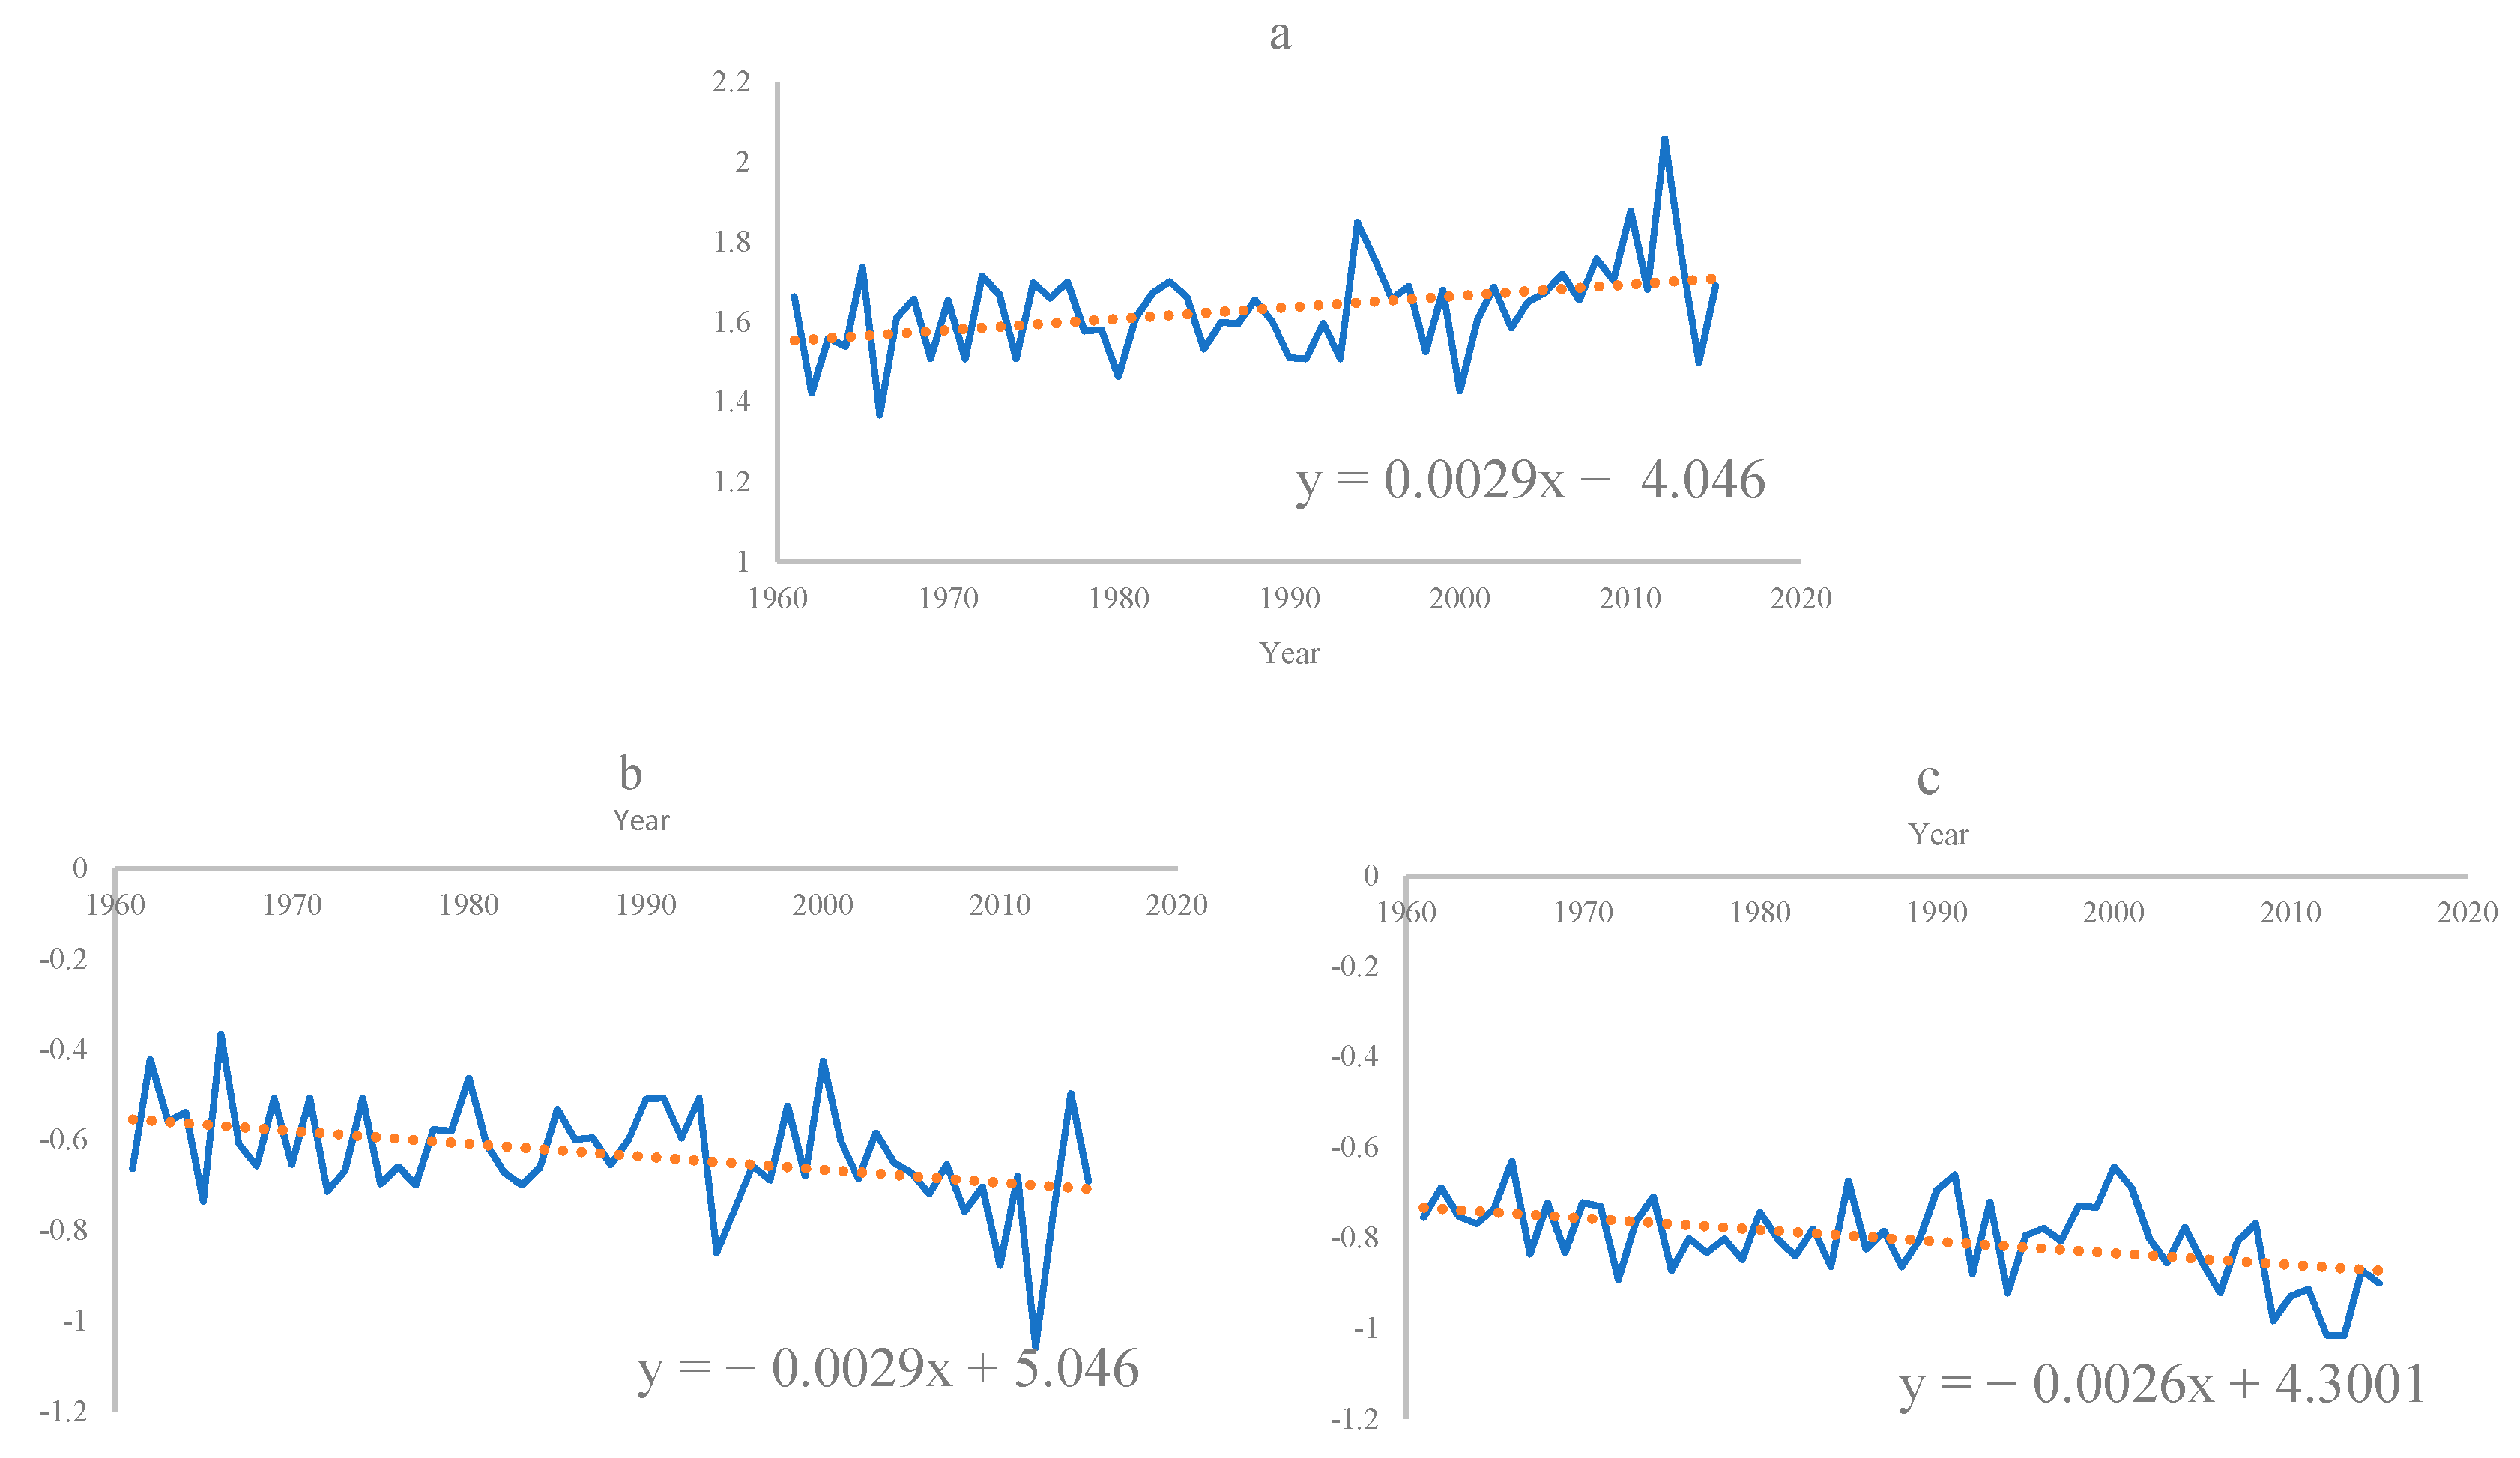
The MK trend test Z value of , and are listed in Table 4, and the interannual variation trend of runoff elasticity is shown in Figure 5. Table 4 and Figure 5 both indicated that the in LRB from 1961 to 2015 showed a significant increase trend, showed a significant decreasing trend, and showed an extremely significantly decreasing trend. Moreover, the three elasticity all fluctuated greatly after 2005.
In general, the absolute values of the climate and catchment elasticity of runoff are increasing, which means that the runoff in LRB is more sensitive to climate change and human activities.
4.4. Quantitative Attribution of the Runoff Change
Based on Equations (9)–(18), calculate , , , (Runoff depth change derived from Budyko hypothesis), (Difference between calculated value and observed value), , and , as shown in Table 5:
As can be seen from Table 5, the difference between the calculated and observed runoff depth change is only 0.76 mm, indicating that the methods used and results obtained in this study are adequate for evaluating the impact of climate change and human activities on runoff changes.
In LRB, compared with the baseline period, climate change and human activities both have reduced runoff in the human activity period.
Among them, precipitation–induced has the most significant impact on runoff changes, with runoff depth reducing by 35.49 mm, accounting for 45.64%; human activities are the second, with runoff depth reduced by 31.46 mm, accounting for 40.45%; potential evapotranspiration is the last, with runoff depth reduced by 10.82 mm, accounting for 13.91%. During the human activity period, runoff variation in LRB is still dominated by precipitation changes, and the contribution rate of climate change to runoff changes is close to 60%.
5. Conclusions and Discussion
This study takes LRB as the research area, based on the hydro–meteorological data from 1961 to 2015, using the MK trend test and mutation test to analyze the interannual change trend of hydro–meteorological variables and the year of abrupt change of runoff series, respectively. Choudhury–Yang water–energy balance equation based on the Budyko hypothesis is used to quantify the climate change and catchment landscape change elasticity of runoff. The contribution of climate change and human activities to runoff are calculated. The following conclusions are obtained:
- During the period 1961 to 2015 in LRB, the precipitation showed a downward trend, but not statistically significant; the potential evapotranspiration showed an extremely significant upward trend; the runoff depth showed an extremely significant downward trend.
- The abrupt year of runoff series in LRB from 1961 to 2015 is 2005. Compared with the period before 2005, the precipitation, and runoff depth in the post–abrupt period decreased by 53.9 mm and 78.54 mm, respectively, and the potential evapotranspiration increased by 48.21 mm. Both the climatic and catchment landscape elasticity of runoff increased in absolute value, indicating that the water cycle of LRB became more sensitive to climate changes and human activities.
- Compared with the baseline period (1961–2004) in LRB, during the human activity period (2005–2015), both climate change and human activities have led to the reduction of runoff. The reduction of precipitation is the leading cause of runoff reduction, with a contribution of 45.64%, followed by human activities at 40.45%, and potential evapotranspiration at 13.91%.
This study quantified the impact of climate change and human activities on runoff variation in LRB using the Choudhury–Yang equation, which is simple to implement while avoiding the tedious process of model calibration and validation, and uncertainty in model structures and parameter estimations with the hydrological model method. The processes of impacts of climate change and human activities on runoff are presented. The driving factors of runoff change in LRB are revealed; meanwhile, theoretical support for cross-border water resources allocation and basin management in LRB is also provided. Although the data and model are strictly controlled in this study, there are still some uncertainties. Precipitation and potential evapotranspiration data may not represent the accurate situation of the whole basin, for both are interpolated from the station data and the low density of national meteorological stations in the study area. Besides, due to the lack of observed runoff data from multiple stations, the runoff from only one station is used to represent the situation of the whole basin, resulting in a lack of spatial heterogeneity.
Author Contributions
Conceptualization, G.J.; Data curation, H.L.; Formal analysis, H.L.; Funding acquisition, Z.W.; Project administration, Z.W.; Resources, Y.Y.; Visualization, H.L.; Writing—original draft, H.L.; Writing—review & editing, G.J. All authors have read and agreed to the published version of the manuscript.
Funding
This research was funded by the Major Projects of National Social Science Foundation of China (Grant No. 18ZDA132), the National Key Research and Development Program of China (Grant No. 2016YFA0602703) and the National Natural Science Foundation of China (Grant No. 41671396).
Conflicts of Interest
The authors declare no conflict of interest.
References
- Milly, P.C.D.; Dunne, K.A.; Vecchia, A.V. Global pattern of trends in streamflow and water availability in a changing climate. Nature 2005, 438, 347–350. [Google Scholar] [CrossRef] [PubMed]
- Zhang, J.; Wang, G.; Jin, J.; He, R.; Liu, C. Evolution and variation characteristics of the recorded runoff for the major rivers in China during 1956–2018. Adv. Water Sci. 2020, 31, 153–161. (In Chinese) [Google Scholar]
- Song, X.; Zhang, J.-Y.; Zan, C.-S.; Liu, C.-Z. Review for impacts of climate change and human activities on water cycle. J. Hydraul. Eng. 2013, 44, 779–790. (In Chinese) [Google Scholar]
- Huang, J.; Wang, Y.; Su, B.; Zhai, J. Future Climate Change and Its Impact on Runoff in the Upper Reaches of the Yangtze River Under RCP4.5 Scenario. Meteorol. Mon. 2016, 42, 614–620. (In Chinese) [Google Scholar]
- Zhang, Y.; Zhong, P.-A.; Chen, J.; Bing, J.; Xu, D.; Wang, M. Impacts of climate change and human activities on the three gorges reservoir inflow. Water 2017, 9, 957. [Google Scholar] [CrossRef] [Green Version]
- BI, Y.; Zhao, Y.; Xiao, W.; Wu, D.; Zhou, X.; Zhang, S. Quantitative research on the effects of climate change and human activity on runoff. South North Water Transf. Water Sci. Technol. 2015, 13, 29–33. (In Chinese) [Google Scholar]
- Gu, Y.; Lei, S.; Liu, J. Effects of cascade hydropower development on hydrological regime of Lower Lancang River. Water Resour. Hydropower Eng. 2008, 4, 20–23. (In Chinese) [Google Scholar]
- Chen, L.H.; He, M.D. The ecological impacts of hydropower cascade development in Lancang-Mekong River. Acta Geogr. Sin. 2000, 55, 577–586. (In Chinese) [Google Scholar]
- Chen, X.; Zhao, J.; Zhao, T.; Lei, X.; Ni, G. Effects of hydropower reservoir operation on natural flow regime and ecosystem. A case study of Xiaowan and Nuozhadu dams. J. Hydroelectr. Eng. 2014, 33, 36–43. (In Chinese) [Google Scholar]
- Zhong, H.; Wang, J. Impacts from hydropower development of main stream on runoff of Lancangjiang River. Shuili Shuidian Jishi Water Resour. Hydropower Eng. 2010, 41, 72–74. (In Chinese) [Google Scholar]
- Li, H.; Wang, G.; Hao, Z.; Liu, C.; Liu, P.; Wu, C.; Gu, Y.; Xu, M.; Fu, X. Characteristics analysis of hydrometeorological elements in Lancang River Basin. J. Water Resour. Water Eng. 2017, 28, 21–27, 34. (In Chinese) [Google Scholar]
- Han, Z.; Long, D.; Fang, Y.; Hou, A.; Hong, Y. Impacts of climate change and human activities on the flow regime of the dammed Lancang River in Southwest China. J. Hydrol. 2019, 570, 96–105. [Google Scholar] [CrossRef]
- Xu, X.; Yang, D.; Yang, H.; Lei, H. Attribution analysis based on the Budyko hypothesis for detecting the dominant cause of runoff decline in Haihe basin. J. Hydrol. 2014, 510, 530–540. [Google Scholar] [CrossRef]
- Ma, H.; Yang, D.; Tan, S.K.; Gao, B.; Hu, Q. Impact of climate variability and human activity on streamflow decrease in the Miyun Reservoir catchment. J. Hydrol. 2010, 389, 317–324. [Google Scholar] [CrossRef]
- Zhang, A.; Zhang, C.; Fu, G.; Wang, B.; Bao, Z.; Zheng, H. Assessments of Impacts of Climate Change and Human Activities on Runoff with SWAT for the Huifa River Basin, Northeast China. Water Resour. Manag. 2012, 26, 2199–2217. [Google Scholar] [CrossRef]
- Wu, J.; Miao, C.; Zhang, X.; Yang, T.; Duan, Q. Detecting the quantitative hydrological response to changes in climate and human activities. Sci. Total. Environ. 2017, 586, 328–337. [Google Scholar] [CrossRef]
- Wang, S.; Zhang, Z.; McVicar, T.R.; Guo, J.; Tang, Y.; Yao, A. Isolating the impacts of climate change and land use change on decadal streamflow variation: Assessing three complementary approaches. J. Hydrol. 2013, 507, 63–74. [Google Scholar] [CrossRef]
- Long, D.; Longuevergne, L.; Scanlon, B.R. Global analysis of approaches for deriving total water storage changes from GRACE satellites. Water Resour. Res. 2015, 51, 2574–2594. [Google Scholar] [CrossRef] [Green Version]
- Long, D.; Scanlon, B.R.; Longuevergne, L.; Sun, A.Y.; Fernando, D.N.; Save, H. GRACE satellite monitoring of large depletion in water storage in response to the 2011 drought in Texas. Geophys. Res. Lett. 2013, 40, 3395–3401. [Google Scholar] [CrossRef] [Green Version]
- Long, D.; Longuevergne, L.; Scanlon, B.R. Uncertainty in evapotranspiration from land surface modeling, remote sensing, and GRACE satellites. Water Resour. Res. 2014, 50, 1131–1151. [Google Scholar] [CrossRef] [Green Version]
- Bao-Pu, F. On the calculation of evaporation from soil. Acta Meteorol. Sin. 1981, 39, 226–236. [Google Scholar]
- Choudhury, B. Evaluation of an empirical equation for annual evaporation using field observations and results from a biophysical model. J. Hydrol. 1999, 216, 99–110. [Google Scholar] [CrossRef]
- Yang, H.; Yang, D.; Lei, Z.; Sun, F. New analytical derivation of the mean annual water-energy balance equation. Water Resour. Res. 2008, 44, 893–897. [Google Scholar] [CrossRef]
- Zhang, L.; Potter, N.; Hickel, K.; Zhang, Y.; Shao, Q. Water balance modeling over variable time scales based on the Budyko framework—Model development and testing. J. Hydrol. 2008, 360, 117–131. [Google Scholar] [CrossRef]
- Liang, W.; Bai, D.; Wang, F.; Fu, B.; Yan, J.; Wang, S.; Yang, Y.; Long, D.; Feng, M. Quantifying the impacts of climate change and ecological restoration on streamflow changes based on a Budyko hydrological model in China’s Loess Plateau. Water Resour. Res. 2015, 51, 6500–6519. [Google Scholar] [CrossRef]
- Donohue, R.J.; Roderick, M.L.; McVicar, T.R. Assessing the differences in sensitivities of runoff to changes in climatic conditions across a large basin. J. Hydrol. 2011, 406, 234–244. [Google Scholar] [CrossRef]
- Roderick, M.L.; Farquhar, G.D. A simple framework for relating variations in runoff to variations in climatic conditions and catchment properties. Water Resour. Res. 2011, 47, 1–11. [Google Scholar] [CrossRef]
- Li, L.J.; Li, H.B.; Wang, J. Analysis on hydrological and water quality character and their spatial and temporal Distribution in Lancangjiang River. Sci. Geogr. Sin. Dili Kexue 2002, 22, 49–56. (In Chinese) [Google Scholar]
- You, Z.; Feng, Z.M.; Jiang, L.G.; Yang, Y.Z. Population distribution and its spatial relationship with terrain elements in Lancang-Mekong river basin. Mt. Res. 2014, 32, 21–29. (In Chinese) [Google Scholar]
- Gan, S.; He, D.; Yuan, J. Study on Background of Natural Ecologic Environment and Land Resources in Lancang River Basin in Yunnan. J. Eros. Soil Water Conserv. 1998, 5, 3–5. (In Chinese) [Google Scholar]
- Kendall, M.G. Rank Correlation Methods; Griffin: London, UK, 1948. [Google Scholar]
- Burn, D.H.; Elnur, M.A.H. Detection of hydrologic trends and variability. J. Hydrol. 2002, 255, 107–122. [Google Scholar] [CrossRef]
- Zhao, G.J.; Mu, X.; Tian, P.; Wang, F.; Gao, P. The variation trend of streamflow and sediment flux in the middle reaches of the Yellow River over the past 60 years and the influencing factors. Resour. Sci. 2012, 34, 1070–1078. (In Chinese) [Google Scholar]
- Gerstengarbe, F.-W.; Werner, P. Estimation of the beginning and end of recurrent events within a climate regime. Clim. Res. 1999, 11, 97–107. [Google Scholar] [CrossRef] [Green Version]
- Yan, M.H.; Deng, W.; Ma, X. Climate variation in the Sanjiang Plain disturbed by large scale reclamation during the last 45 years. Acta Geogr. Sin. 2001, 56, 170–179. (In Chinese) [Google Scholar]
- Song, Y.; Ji, J.J. The remarkable test of abrupt climatic warming and spatiotemporal distribution features of temperature and precipitation fields. Clim. Environ. Res. 2005, 10, 157–165. (In Chinese) [Google Scholar]
- Wang, J.; Kang, L.; Zhao, G. Study on abrupt change point of runoff and sediment series based on Mann Kendall method. Yellow River 2010, 32, 43, 45. (In Chinese) [Google Scholar]
- Budyko, M.I. Climate and Life; Academic Press: New York, NY, USA, 1974. [Google Scholar]
- Zhang, S.; Yang, D.; Xu, X. Attribution analysis for runoff decline in Yellow River Basin during past fifty years based on Budyko hypothesis. Sci. Sin. Technol. 2015, 45, 1024–1034. (In Chinese) [Google Scholar] [CrossRef] [Green Version]
- Zhang, L.; Zhao, G.; Mu, X.; Gao, P.; Sun, W. Attribution of runoff variation in the Wei River basin based on the Budyko hypothesis. Acta Ecol. Sin. 2018, 38, 7607–7617. (In Chinese) [Google Scholar]
Figure 1.
Map of Lancang River Basin.

Figure 2.
Interannual variation trend of precipitation (P) (a) and potential evapotranspiration (E0) (b) in the Lancang River Basin (LRB) from 1961 to 2015.
Figure 2.
Interannual variation trend of precipitation (P) (a) and potential evapotranspiration (E0) (b) in the Lancang River Basin (LRB) from 1961 to 2015.

Figure 3.
Interannual variation trend of runoff (R) of Yunjinghong hydrometric station from 1961 to 2015.
Figure 3.
Interannual variation trend of runoff (R) of Yunjinghong hydrometric station from 1961 to 2015.

Figure 4.
Mann–Kendall (MK) mutation test result.

Figure 5.
The interannual variation trend of three elasticity (a), (b), and (c) in LRB from 1961 to 2015.
Figure 5.
The interannual variation trend of three elasticity (a), (b), and (c) in LRB from 1961 to 2015.


Table 1.
Regression analysis results of runoff (R) with precipitation (P), potential evapotranspiration (E0), and catchment parameter (n), respectively.
Table 1.
Regression analysis results of runoff (R) with precipitation (P), potential evapotranspiration (E0), and catchment parameter (n), respectively.
| Variable | P | E0 | n |
|---|---|---|---|
| Correlation coefficient | 0.71 | −0.66 | −0.58 |
| F–test | 54.22 | 40.92 | 27.04 |
Table 2.
Mann–Kendall (MK) trend test results of annual P, E0, and R in the Lancang River Basin (LRB).
Table 2.
Mann–Kendall (MK) trend test results of annual P, E0, and R in the Lancang River Basin (LRB).
| P Trend | E0 Trend | R Trend |
|---|---|---|
| −1.44 | 3.50 ** | −3.17 ** |
** indicates an extremely significant trend (significance level ).
Table 3.
Hydrological and climatic characteristics of LRB.
| Period | P/mm | E0/mm | R/mm | n | R/P | E0/P | Runoff Elasticity | ||
|---|---|---|---|---|---|---|---|---|---|
| 1961–2004 | 898.52 | 962.62 | 401.38 | 1.12 | 0.45 | 1.08 | 1.61 | −0.61 | −0.78 |
| 2005–2015 | 844.93 | 1010.83 | 322.84 | 1.24 | 0.38 | 1.20 | 1.73 | −0.73 | −0.91 |
Table 4.
MK trend test Z–Value of elasticity.
| Elasticity | |||
|---|---|---|---|
| Z–Value | 2.56 * | −2.56 * | −3.18 ** |
* indicates a significant trend (significance level ), ** indicates an extremely significant trend (significance level ).
Table 5.
Contribution of hydro–meteorological variables to runoff depth changes.
| Base Period | Human Activity Period | |||||||||
|---|---|---|---|---|---|---|---|---|---|---|
| 1961–2004 | 2005–2015 | −35.49 | −10.82 | −31.46 | −77.77 | −78.54 | 0.76 | 45.64 | 13.91 | 40.45 |
Publisher’s Note: MDPI stays neutral with regard to jurisdictional claims in published maps and institutional affiliations. |
© 2020 by the authors. Licensee MDPI, Basel, Switzerland. This article is an open access article distributed under the terms and conditions of the Creative Commons Attribution (CC BY) license (http://creativecommons.org/licenses/by/4.0/).
Share and Cite
MDPI and ACS Style
Liu, H.; Wang, Z.; Ji, G.; Yue, Y. Quantifying the Impacts of Climate Change and Human Activities on Runoff in the Lancang River Basin Based on the Budyko Hypothesis. Water 2020, 12, 3501. https://doi.org/10.3390/w12123501
AMA Style
Liu H, Wang Z, Ji G, Yue Y. Quantifying the Impacts of Climate Change and Human Activities on Runoff in the Lancang River Basin Based on the Budyko Hypothesis. Water. 2020; 12(12):3501. https://doi.org/10.3390/w12123501
Chicago/Turabian StyleLiu, Hao, Zheng Wang, Guangxing Ji, and Yanlin Yue. 2020. "Quantifying the Impacts of Climate Change and Human Activities on Runoff in the Lancang River Basin Based on the Budyko Hypothesis" Water 12, no. 12: 3501. https://doi.org/10.3390/w12123501
Note that from the first issue of 2016, this journal uses article numbers instead of page numbers. See further details here.