Assessment of Hydrology and Sediment Yield in the Mekong River Basin Using SWAT Model


1
Faculty of Hydrology and Water Resources Engineering, Institute of Technology of Cambodia, Russian Federation Blvd., P.O. BOX 86, Phnom Penh 12156, Cambodia
2
Laboratoire Ecologie Fonctionnelle et Environnement, UMR 5245 CNRS/UPS/INPT ENSAT, Avenue de l’Agrobiopole, BP 32607, Auzeville Tolosane, 31326 Castanet Tolosan, France
*
Authors to whom correspondence should be addressed.
Water 2020, 12(12), 3503; https://doi.org/10.3390/w12123503
Submission received: 6 November 2020
/
Revised: 4 December 2020
/
Accepted: 10 December 2020
/
Published: 13 December 2020
(This article belongs to the Special Issue Fluvial Processes and Denudation)
Abstract
:The Mekong River Basin (MRB) in Southeast Asia is among the world’s ten largest rivers, both in terms of its discharge and sediment load. The spatial and temporal resolution to accurately determine the sediment load/yield from tributaries and sub-basin that enters the Mekong mainstream still lacks from the large-scale model. In this study, the SWAT model was applied to the MRB to assess long-term basin hydrology and to quantify the sediment load and spatial sediment yield in the MRB. The model was calibrated and validated (1985–2016) at a monthly time step. The overall proportions of streamflow in the Mekong River were 34% from surface runoff, 21% from lateral flow, 45% from groundwater contribution. The average annual sediments yield presented 1295 t/km2/year in the upper part of the basin, 218 t/km2/year in the middle, 78 t/km2/year in the intensive agricultural area and 138 t/km2/year in the highland area in the lower part. The annual average sediment yield for the Mekong River was 310 t/km2/year from upper 80% of the total MRB before entering the delta. The derived sediment yield and a spatial soil erosion map can explicitly illustrate the identification and prioritization of the critical soil erosion-prone areas of the MR sub-basins.
1. Introduction
Sediment transport, as one of natural components of river geomorphology, plays an overarching role for the maintenance of fluvial environments such as channel systems, floodplains, wetlands and estuaries, and equilibrium between deposition and erosion, which usually occurs along a river in natural and undisturbed systems. Over the past few decades, dynamic river conditions have been noticed to be under the influence of anthropogenic activities, leading to considerable changes in water discharge and sediment loads [1,2,3,4]. Major rivers in the world such as the Nile and Congo in Africa, Colorado in America, the Ebro in Europe, and the Yangtze, Yellow, and Mekong River in Asia have been reported to supply less sediment following anthropogenic activities [5,6,7,8,9,10,11,12]. This has resulted in catastrophic morphological changes, not only in the river itself but also in the delta [13].
There is a recent trend of building new large hydropower dams in developing countries, particularly in mega biodiversity river basins, such as the Amazon, the Congo, and the Mekong, although substantial losses in these ecologically important regions are being observed [11,14,15]. The transboundary Mekong River Basin, which is ranked the 21st largest river basin worldwide, distributed between five countries: China, Myanmar, Lao People’s Democratic Republic, Thailand, Cambodia, and Vietnam. The river basin can be separated into two sections: the Upper Mekong Basin in China (UMB), where the river is called Lancang) and the Lower Mekong Basin (LMB) from Yunnan (China) downstream to the South China Sea in Vietnam. The Mekong is considered one of the last unregulated great rivers in the world, as the flow regime is still close to its natural state [16]. The Mekong could potentially produce over 30,000 MW of electricity; however, only about 10% of this potential has been developed to date [17,18]. Since the 1990s, the Mekong River has been undergoing dam construction. One of the most evident transformations in the construction of large hydropower dams in the upstream Mekong, is that has reduced the sediment discharge into the floodplain and estuaries at an alarming rate [19]. The sediment could limit storage capabilities and increases the risk for ageing infrastructure, in particular the reservoir impoundment in the Mekong River Basin. For example, the main dams in the Lancang River occupy sediment trapping efficiencies between 30% and 70% because of the high sediment yield in the Lancang-Mekong River’s mainstream and sub-basins [20]. Some estimate the sediment flux of the Mekong, the pre-dam sediment flux into the South China Sea, has been estimated from 40 to 160 Mt/year [21,22,23,24].
Sediment in Mekong River is important to sustain the geomorphology of the floodplains and particularly the Tonle Sap Lake and to provide essential nutrients for the lake’s productive ecosystem [25]. As a requisite part of the Mekong River system, the Tonle Sap Lake in central Cambodia is the Southeast Asia’s largest permanent freshwater body and the essential natural reservoir from which the Mekong River benefits [25]. Further, the Tonle Sap Lake and its floodplains connecting with the Mekong mainstream through the Tonle Sap River rely as well upon the Mekong sediment regimes since the primary source of sediment supply to the Tonle Sap Lake is of sediment transport from the Mekong [25,26]. The Mekong River is responsible for the majority (more than 70%) of the sediment delivered to Tonle Sap Lake [25,26,27].
Due to the limited sediment monitoring data for both suspended and bed loads in the Mekong Rivers and their tributaries, the spatial and temporal resolution to accurately determine how much of the sediment load is from tributaries entering the Mekong mainstream is still lacking. As a result, no consensus was reached on sediment baselines amongst the countries in the Mekong Basin [28]. The fact that the Mekong River basin spreads across six countries has made studying the system a complex task. Much importance is given to modelling in terms of the development of sustainable management of water resources at the river basin scale, which can help evaluate current water resources, identify pollution sources, and improve sustainable development [29]. The Soil and Water Assessment Tool (SWAT) model [30,31,32] has emerged as one of the most extensively used eco-hydrological models worldwide. The SWAT model has been quite reliable in Southeast Asia (SEA), with most of the studies reporting above the satisfactory statistical values. Applications of SWAT in Southeast Asia (SEA) were for hydrologic analyses of the Mekong River Basin [33]. Partial analyses of the Mekong system with SWAT are ongoing, as a rising number of studies have been conducted for specific catchments based in different SEA countries [33]. Several recent studies have attempted to perform a SWAT model in parts of Mekong river for various objectives from hydrology, sediment to water quality, land use/climate scenarios, and others, e.g., [34,35,36,37]. As mentioned previously, prior studies have applied the SWAT model to parts of the basin. In this study, the SWAT model was applied for the Mekong River Basin to (i) assess long-term basin hydrology focusing on the water balance components and contribution of the different compartments of the basin to water yield, and to (ii) quantify the sediment load and spatial sediment yield.
2. Materials and Methods
2.1. Study Area
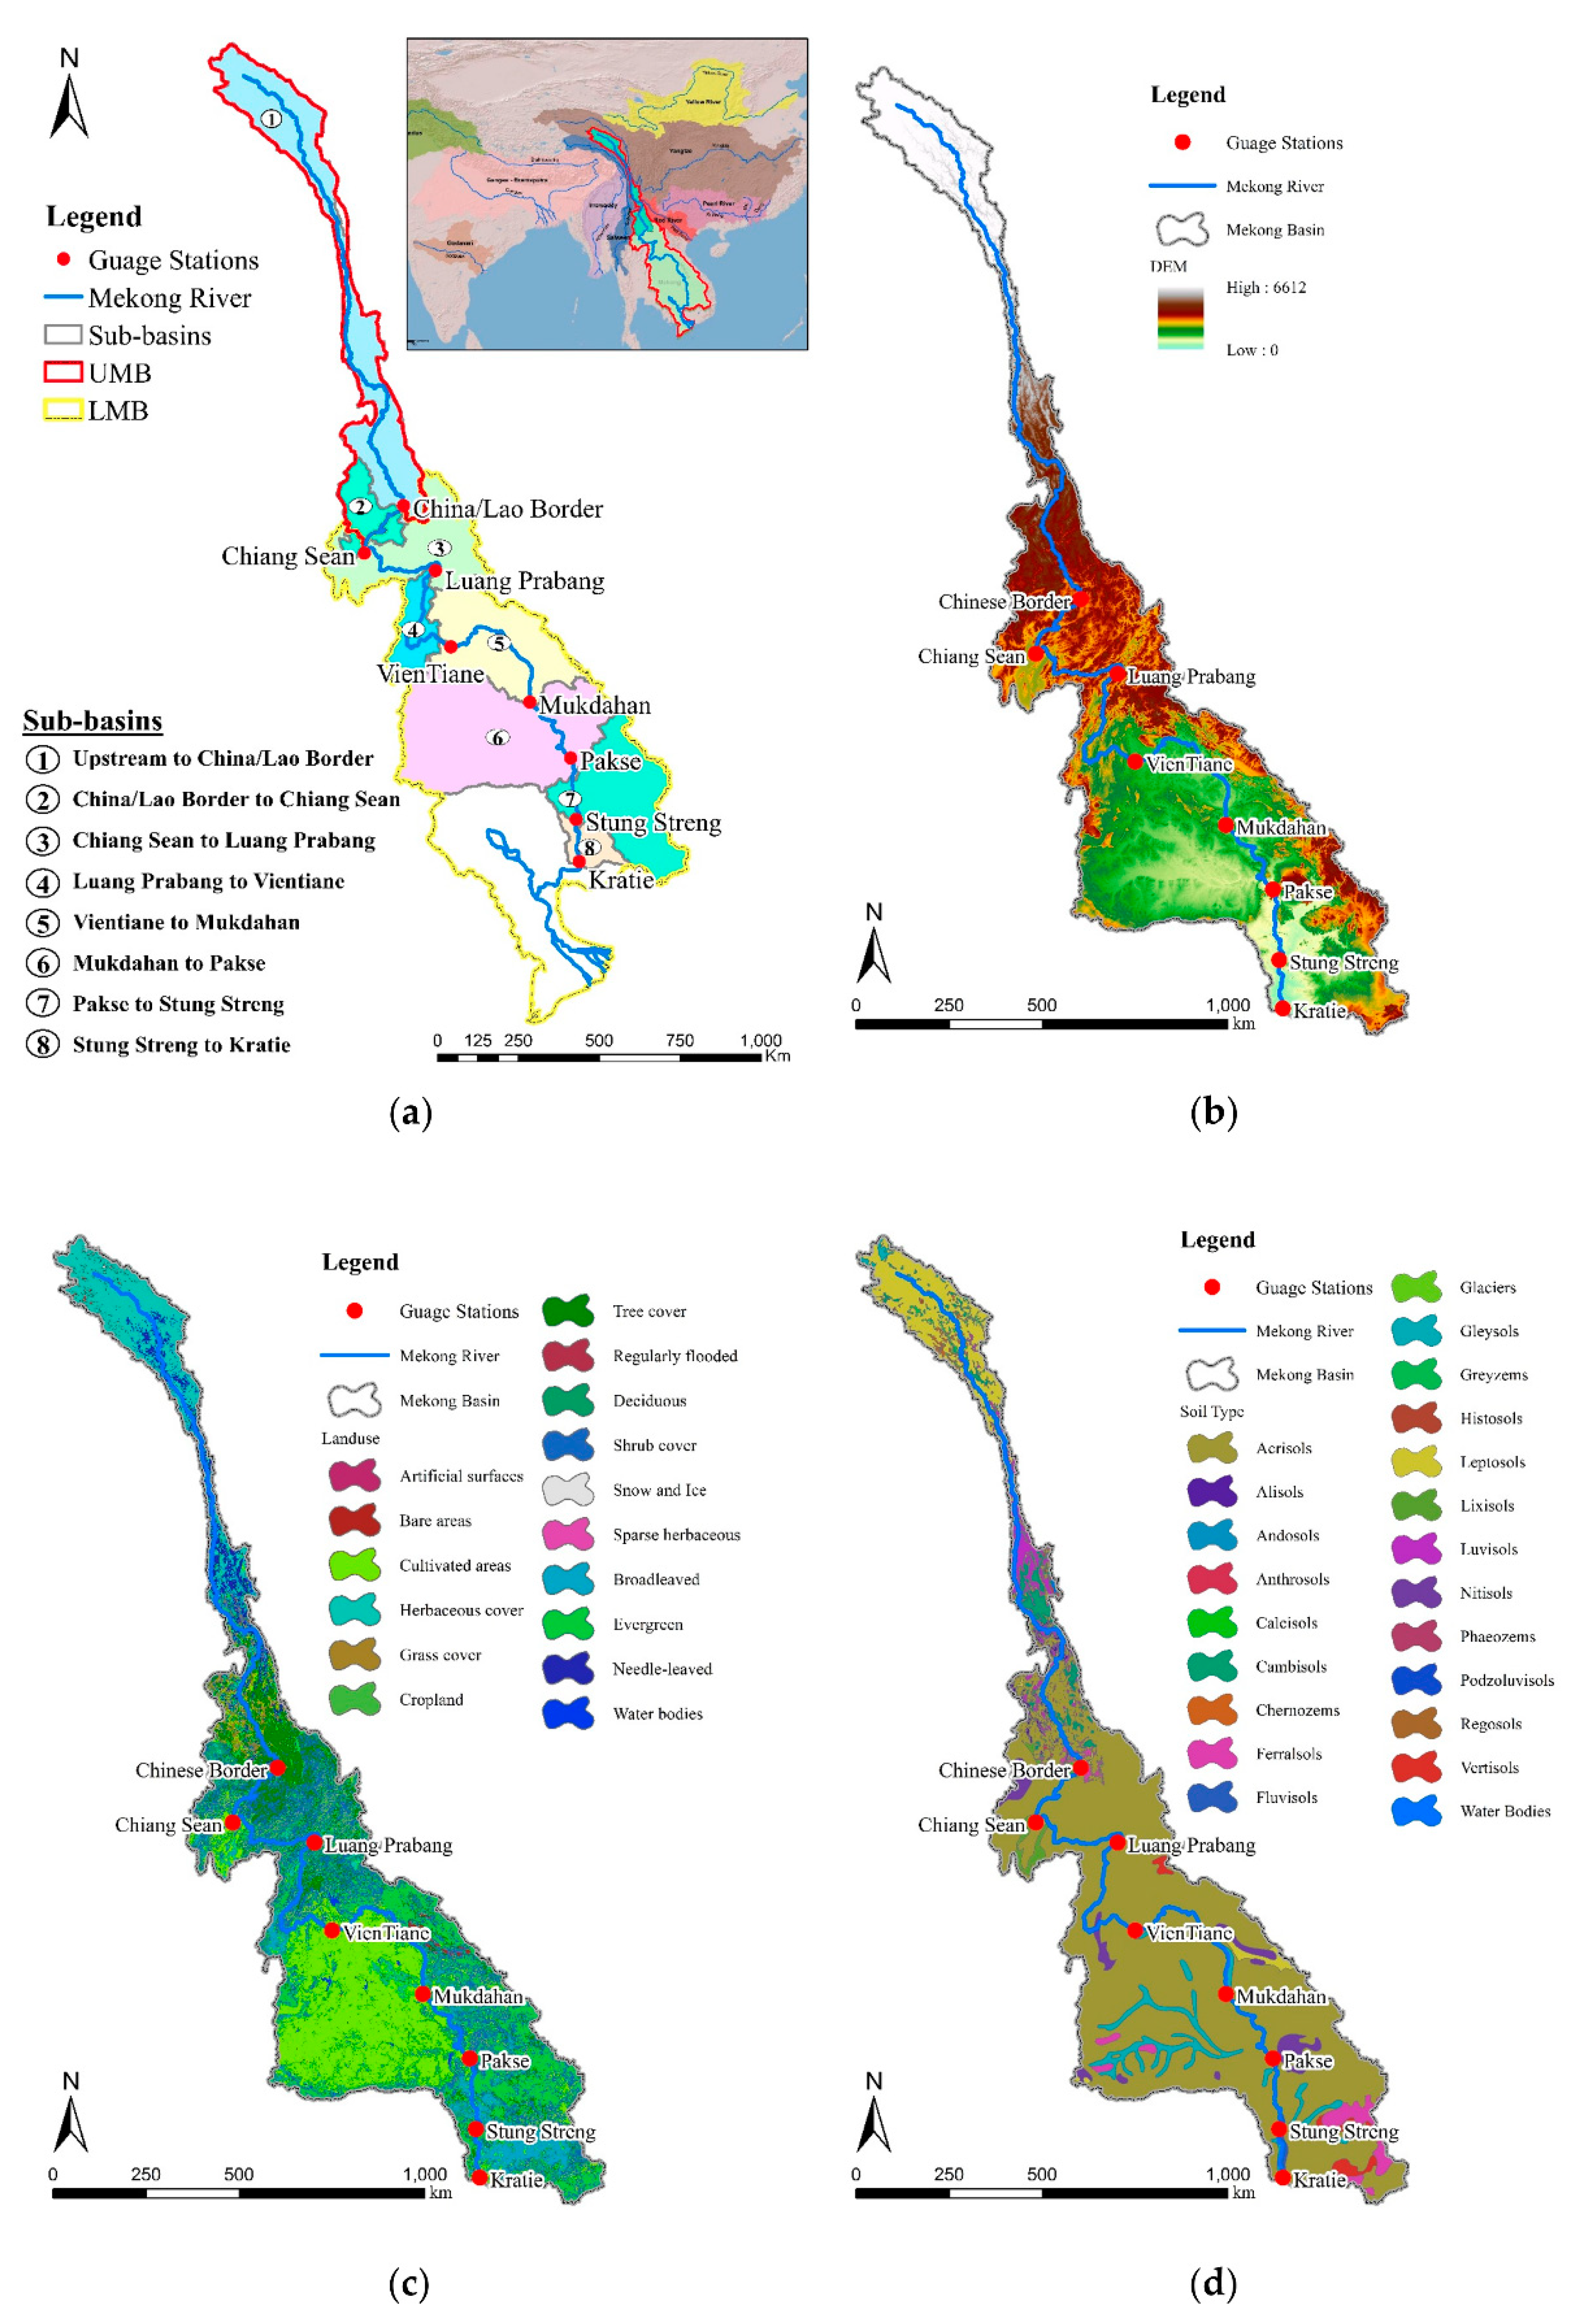
Located in Asia, the Mekong River, measuring a length of 4,800 km, is the 12th longest river in the world, and has a basin area ranked 21st (795,000 km2), with an average annual runoff ranked 8th in the world (475,000 million m3). The basin area is shared by China (21%), Myanmar (3%), Lao PDR (25%), Thailand (23%), Cambodia (20%), and Vietnam (8%). The Mekong River Basin is politically divided into two parts, the Upper Mekong Basin in China (Lancang River) and the Lower Mekong Basin from downstream of China/Laos Border to the South China Sea in Vietnam. The Lower Mekong River Basin mainly overlays the areas in the four downstream riparian countries (Lao PDR, Thailand, Cambodia, and Vietnam) accounting for 620,000 km2 of the basin area (Figure 1a). The water resources and productivity of the river and its basin benefit a population of over 60 million people. That part of the basin is occupied by Northeast Thailand and currently undergoes considerable irrigation development and the potential for future development. Cambodia has a significant part of the basin that includes the Great Lake and Tonle Sap. The lake area varies from 3000 km2 in the dry season to 15,000 km2 in the wet season. The lake becomes the biggest source of freshwater fish in Southeast Asia. Tonle Sap River with an approximate length of 120 km adjoins the lake to the Mekong River. The reverse flow from the Mekong River to the lake complicates the understanding of the hydraulic and ecological processes pertinent to this area. The Mekong Delta, mostly in Vietnam and partly in Cambodia, is affected by the tidal process and can impact as far as Phnom Penh of Cambodia [38].
Remaining undeveloped until 1990, The Mekong River is now witnessing dam construction at a rapid pace. The seven dams’ construction is in progress on the mainstream in China, and 133 are proposed for the Lower Mekong River, including 11 on the Lower Mekong mainstream [39]. The active volume of the existing dams in the UMB in China measures between 120 and 12,300 million m3; on the other hand, the 11 dams to be proposed in the LMB would contain the volume of 115–1450 million m3. The operation of dams in the UMB will be either seasonal or yearly, but all those 11 proposed dams in the LMB are intended for daily operation. However, recently the Upper Mekong River in China is governed by a number of dams and reservoirs, all of which have laid dramatic changes in navigation patterns, the flow of water as well as sediment to the Mekong Delta [40].
2.2. Discharge and Sediment Data Used in the Study
The streamflow data (recorded daily) and sediment data (recorded monthly) used in this study were obtained from the metadata of the Mekong River Commission (MRC). There are eight discharge gauge stations along the main Mekong River in this study (Table 1). The total suspended sediment (TSS) concentration from the MRC-WQMN (MRC-Water Quality Monitoring Network) dataset has been widely used in sediment load estimation in the Mekong River Basin study, e.g., [25,41,42]. TSS concentrations were obtained from the water quality sampling conducted monthly by respective member countries. The TSS samples were collected at 0.30 m below the water surface in the middle of the mainstream cross-section at each station. The samples were analyzed at designated laboratories by MRC and recommended analytical method for TSS analysis (2540-D-TSS-SM) were employed [43]. Sediment loads were estimated at six locations using the LOAD ESTimator (LOADEST) program [44]. It should be noted that our study did not include the bed-load, which is approximately 1.40% of suspended sediment load [45]. The sediment record use in this study is also detailed in Table 1.
2.3. SWAT Conceptual Model
SWAT is a physically-based, semi-distributed, agro-hydrological simulation model that operates on a sub-daily to annual scale time step on a watershed scale. SWAT was developed with the aim of predicting the impact of management on water, sediment, and agricultural chemical yields in ungauged catchments [31]. The model’s capability lies in continuous simulation for dissolved and particulate elements in large complex catchments with varying weather, soils, and management conditions over long periods. Small or expansive catchments can be analyzed using SWAT through discretizing into sub-basins, which are then further subdivided into hydrological response units (HRUs) with homogeneous land use, soil type, and slope.
The prediction streamflow of the SWAT model is based on the water balance equation:
The prediction of the sediment of the SWAT model is based on modified universal soil loss (MUSLE) equation where rainfall and runoff are the main reason for soil loss.
2.4. SWAT Model Setup and Data Inputs for the Mekong River Basin
The SWAT model has been set up to cover the total area of 748,000 km2 from the most upstream (80%) of the total Mekong River Basin (Figure 1a). The SWAT application of this study in the Mekong Basin can be split into eight zones, as seen in Figure 1a, as availability of recorded streamflow and sediment used in this study for SWAT setup. The model was set up with the following major sub-basins: (1) from most upstream to China/Laos Border, (2) China/Laos Border to Chiang Saen, (3) Chiang Saen to Luang Prabang, (4) Luang Prabang to Vientiane, (5) Vientiane to Mukdahan, (6) Mukdahan to Pakse, (7) Pakse to Stung Treng and (8) Stung Treng to Kratie. The Kratie station was selected as the most downstream for the model setup since this location is not affected by the tidal influence [38] and the buffering of the flood wave in the Tonle Sap Lake system [46].
Each data input was obtained from different sources, which is summarized in Table 2. The precipitation used for this study was obtained from the Global Precipitation Climatology Centre (GPCC) (www.gcmd.nasa.gov), and daily temperatures were downloaded from NASA Earth Exchange (NEX) (www.nasa.gov/nex). The study used the Multi-Error-Removed Improved-Terrain DEM (MERIT DEM) (www.hydro.iis.u-tokyo.ac.jp/~yamadai/). The MERIT DEM was developed through the removal of multiple error components (absolute bias, stripe noise, speckle noise, and tree height bias) from the existing space-borne DEMs (SRTM3 v2.1 and AW3D-30m v1) [47]. The distribution of elevation varies from 8 m to 6612 m as representing the topographic condition of the SWAT Model setup for the Mekong River Basin. The acquisition of land use distribution in the Mekong River Basin was from the Global Land Cover 2000 Database (www.usgs.gov) at a 1 km resolution. Land use distribution was downloaded from Global Soil data by FAO (www.fao.org/) (Figure 1). The watershed had been discretized into small 345 sub-basins, which is equal to 345 HRUs from 14 land uses, 20 soils and five slopes classes (0%–1%, 1%–2%, 2%–5%, 5%–20%, and >20%). The SWAT model included six major dams based in the Upper Mekong Basin, the Manwan Dam operating in 1993, Dachaoshan in 2001, Jinghong in 2008, Xiaowan in 2009, Gongguoqiao in 2011, and Nuozhadu in 2012. All of these reservoirs quantify an accumulated total and active reservoir storage capacity of approximately 400 × 108 m3 and 230 × 108 m3, respectively [48].
2.5. SWAT Model Calibration and Validation
The SWAT simulates the overall hydrologic balance for each HRU (hydrologic response units), and model output is available in daily, monthly, and annual time steps. The SWAT version used in this study is SWAT2012 rev. 664 (http://swat.tamu.edu/software/arcswat/) [30,31]. The calibration was executed manually with the comparison of observed data and literature review information for overall hydrology components and sediment. The Penman-Monteith method was selected to calculate potential evapotranspiration. Parameters controlling the groundwater behaviour in the model and depending on spatial data have been calibrated with literature at the monthly time step (Table 3). The parameters were calibrated/validated for each sub-basin (based in the gauge stations). The results of calibration showed the importance of parameters, such as Soil_AWC, Soil_K, and ALPHA_BF (groundwater parameter) in the studied flow of the analyzed Mekong Basin (Table 3). The parameter CN2 is pertinent to the quantity of runoff and is based on soil use. Soil_K and Soil_AWC are related to the quantity of soil-water relationships in various soil types of the region. For sediment load calibration, the parameter PRF_BSN has been calibrated to reduce the impact of streamflow peaks on erosion rate and sediment load at reaches while the USLE_K parameter has been calibrated depending on the permafrost type to slow down erosion comparing to literature reviews.
The model performance was subjected to evaluate by means of comparison between the simulated and the observed constituents using Nash-Sutcliffe efficiency (NSE) [49] and Coefficient of determination (R2). NSE was used to indicate how well the plot of observed versus simulated data fits the 1:1 line. A calibrated model could be deemed satisfactory if NSE And R2 are higher than 0.60 for mean behavior [50,51,52,53].
3. Results and Discussion
3.1. Streamflow Calibration and Validation for the SWAT Model
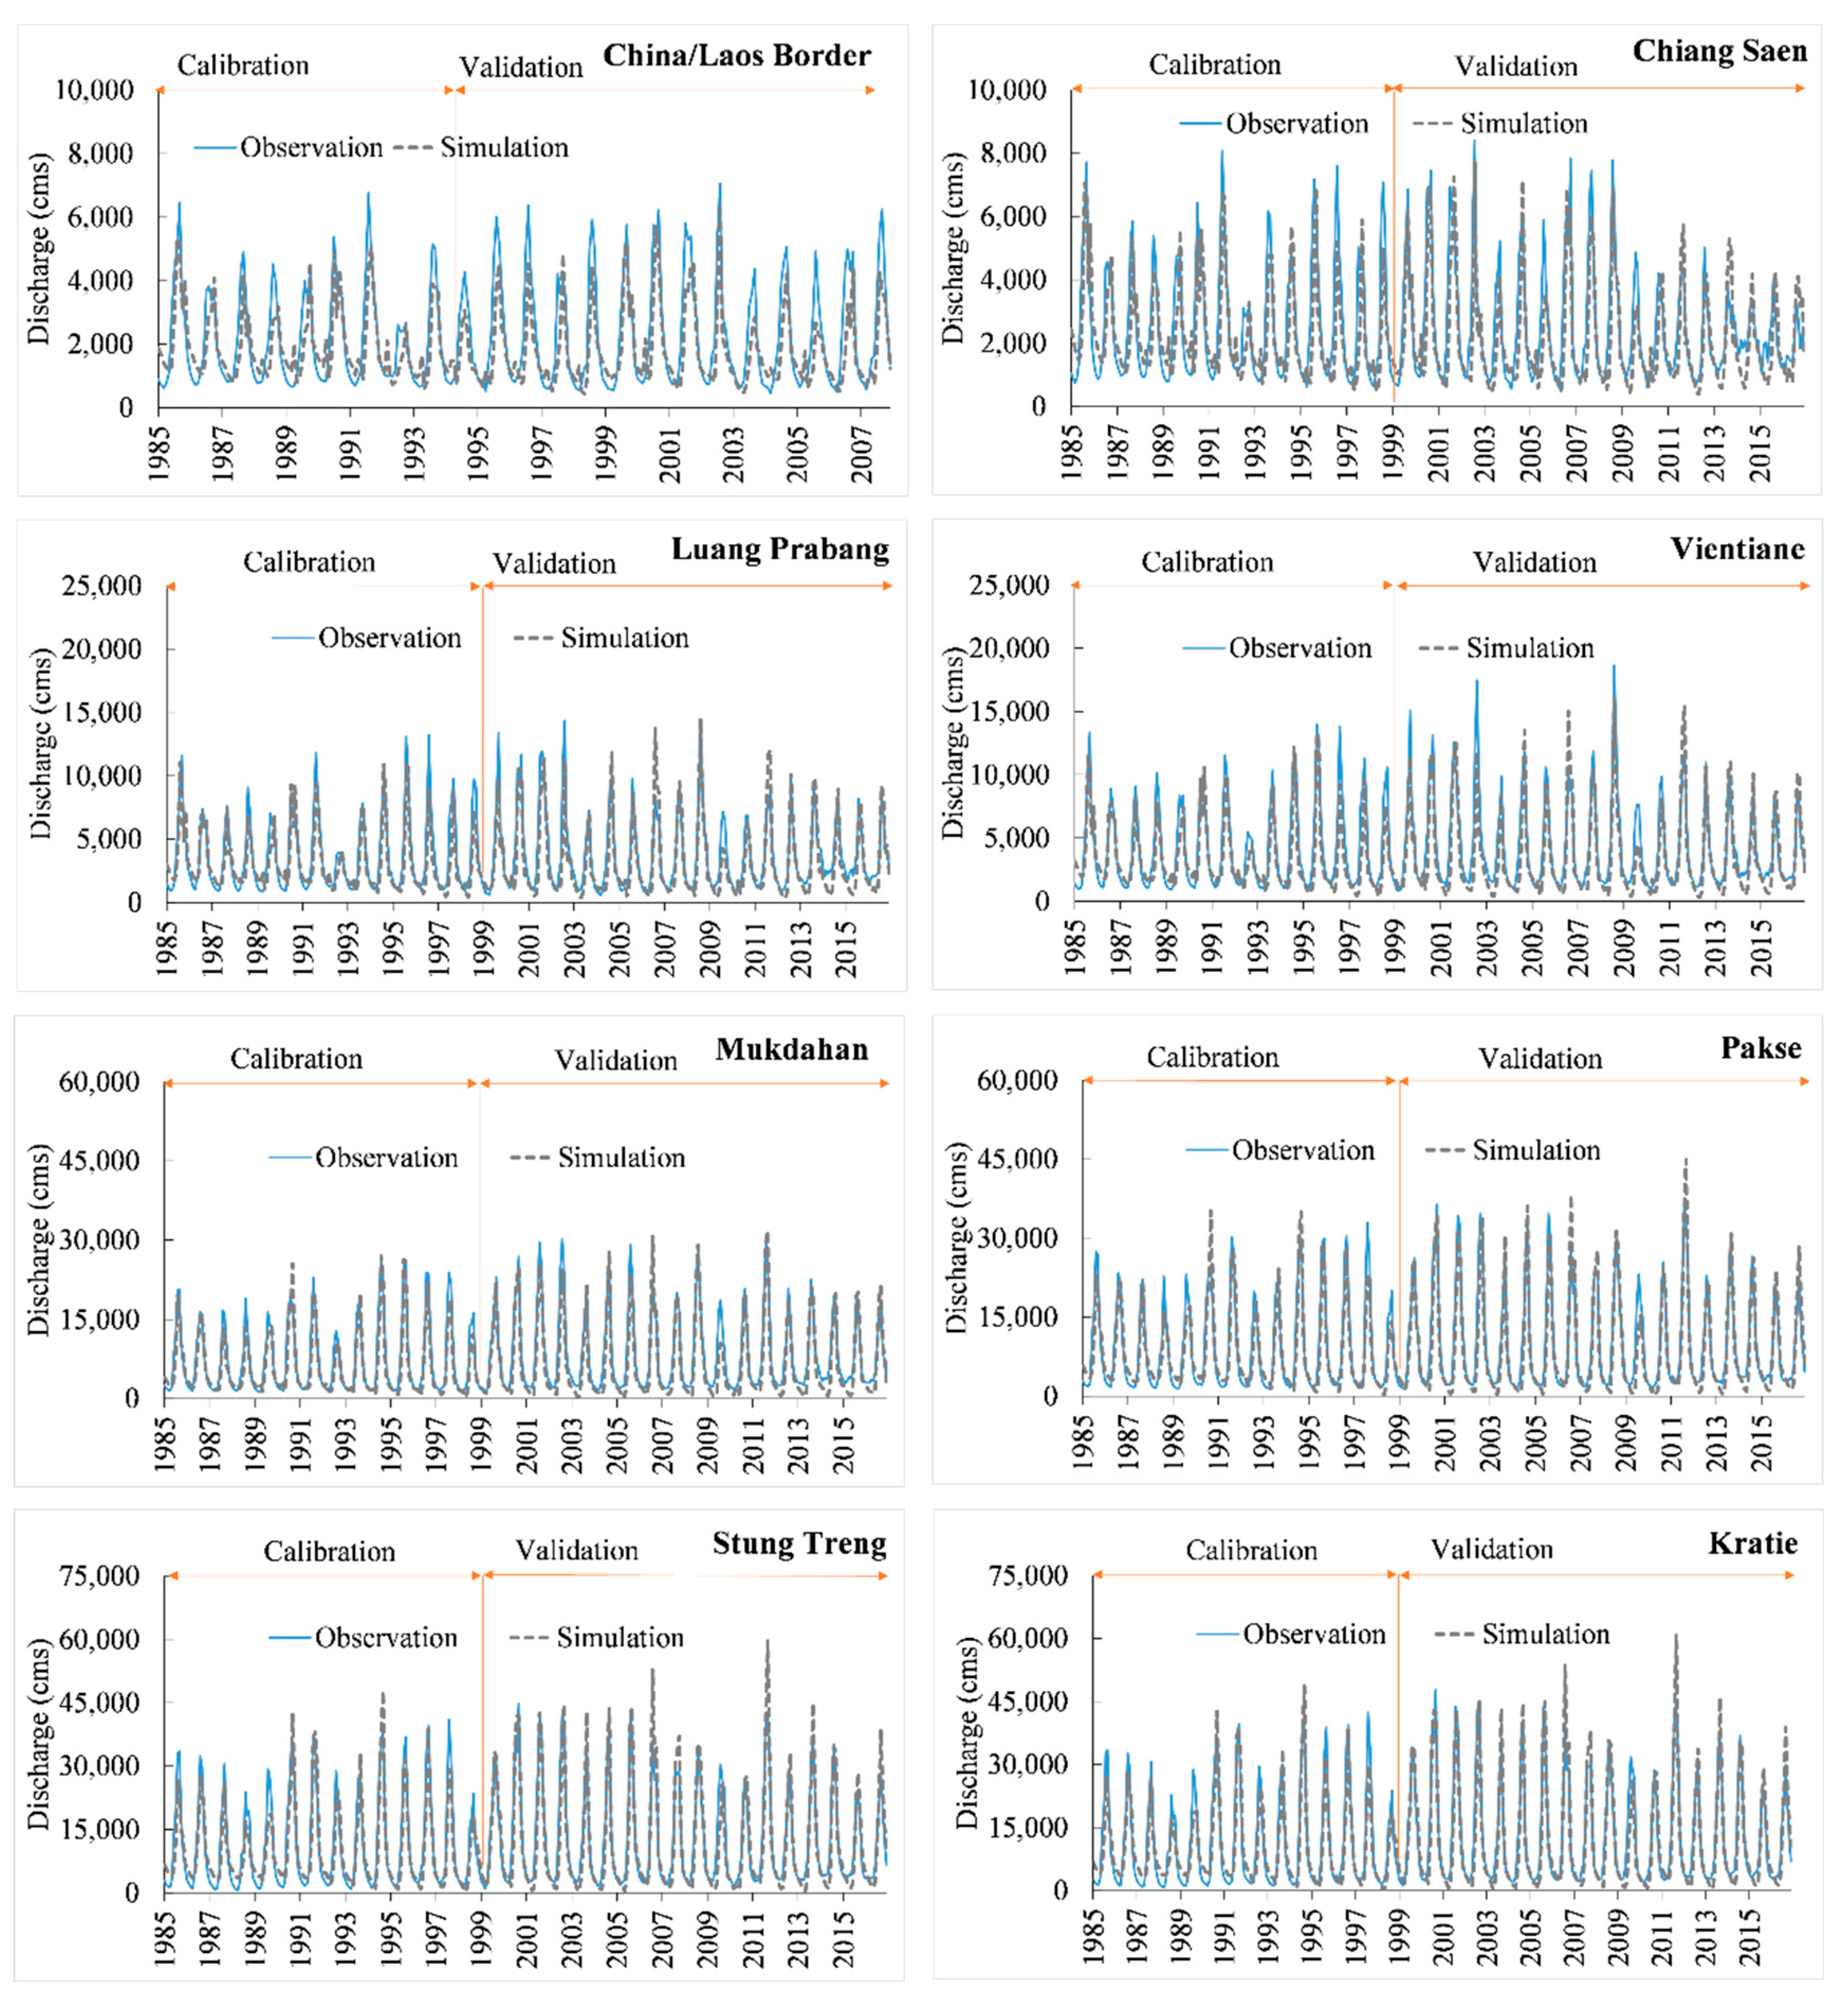
The mean annual rainfall during the study period was 1540 mm; 67% (1032 mm) of the average annual rainfall was removed by evapotranspiration and 33% (508 mm) for the streamflow. A water yield of 508 mm has come from surface runoff (proportion of 34%), lateral flow (proportion of 21%), and groundwater (proportion of 45%). The graphical results of streamflow simulation performance during the calibration and validation periods are shown in Figure 2. In addition to the monthly comparison of simulated and observation streamflow, we also evaluated the average monthly simulated and observed streamflow of our model for the eight-gauge stations, respectively (Figure 3). Figure 4 illustrates the monthly observed and simulated streamflow for the study watershed during study periods. The result of calibration periods covers 1985–1999 at monthly time steps, except at Chiang Saen (1985–1994). The validation period covers from 2000–2016, except at Chiang Saen (1995–2007). The statistical performance of monthly streamflow simulation suggested that these SWAT models were well-calibrated/validated and are in a very good range in the lower part of the Mekong Basin from Luang Prabang to Kratie (Table 4). The NSE values were over 0.80, and R2 values were over 0.75, respectively. For the two stations at China/Laos Border and Chiang Saen, the statistical indicators were found to be higher than 0.70 (NSE > 0.70, 0.65 < R2 < 0.75) for results of SWAT monthly streamflow calibration and validation, which suggested that the SWAT model was well-calibrated/validated and was in a good range. For all the gauge stations, the result of monthly streamflow performance of the SWAT model shows the adequate capability to process sediment calibration and further process. In general, graphical results (Figure 2) indicated good calibration and validation over the range of streamflow discharge, although the calibration and validation results are not differentiated. The model simulated the timing and end of seasonal streamflow but was slightly off in some estimates of peak flows. The result of the statistical performance of streamflow simulation during both calibration and validation are summarized in Table 4.
3.2. Sediment Loads Calibration and Validation for the SWAT Model
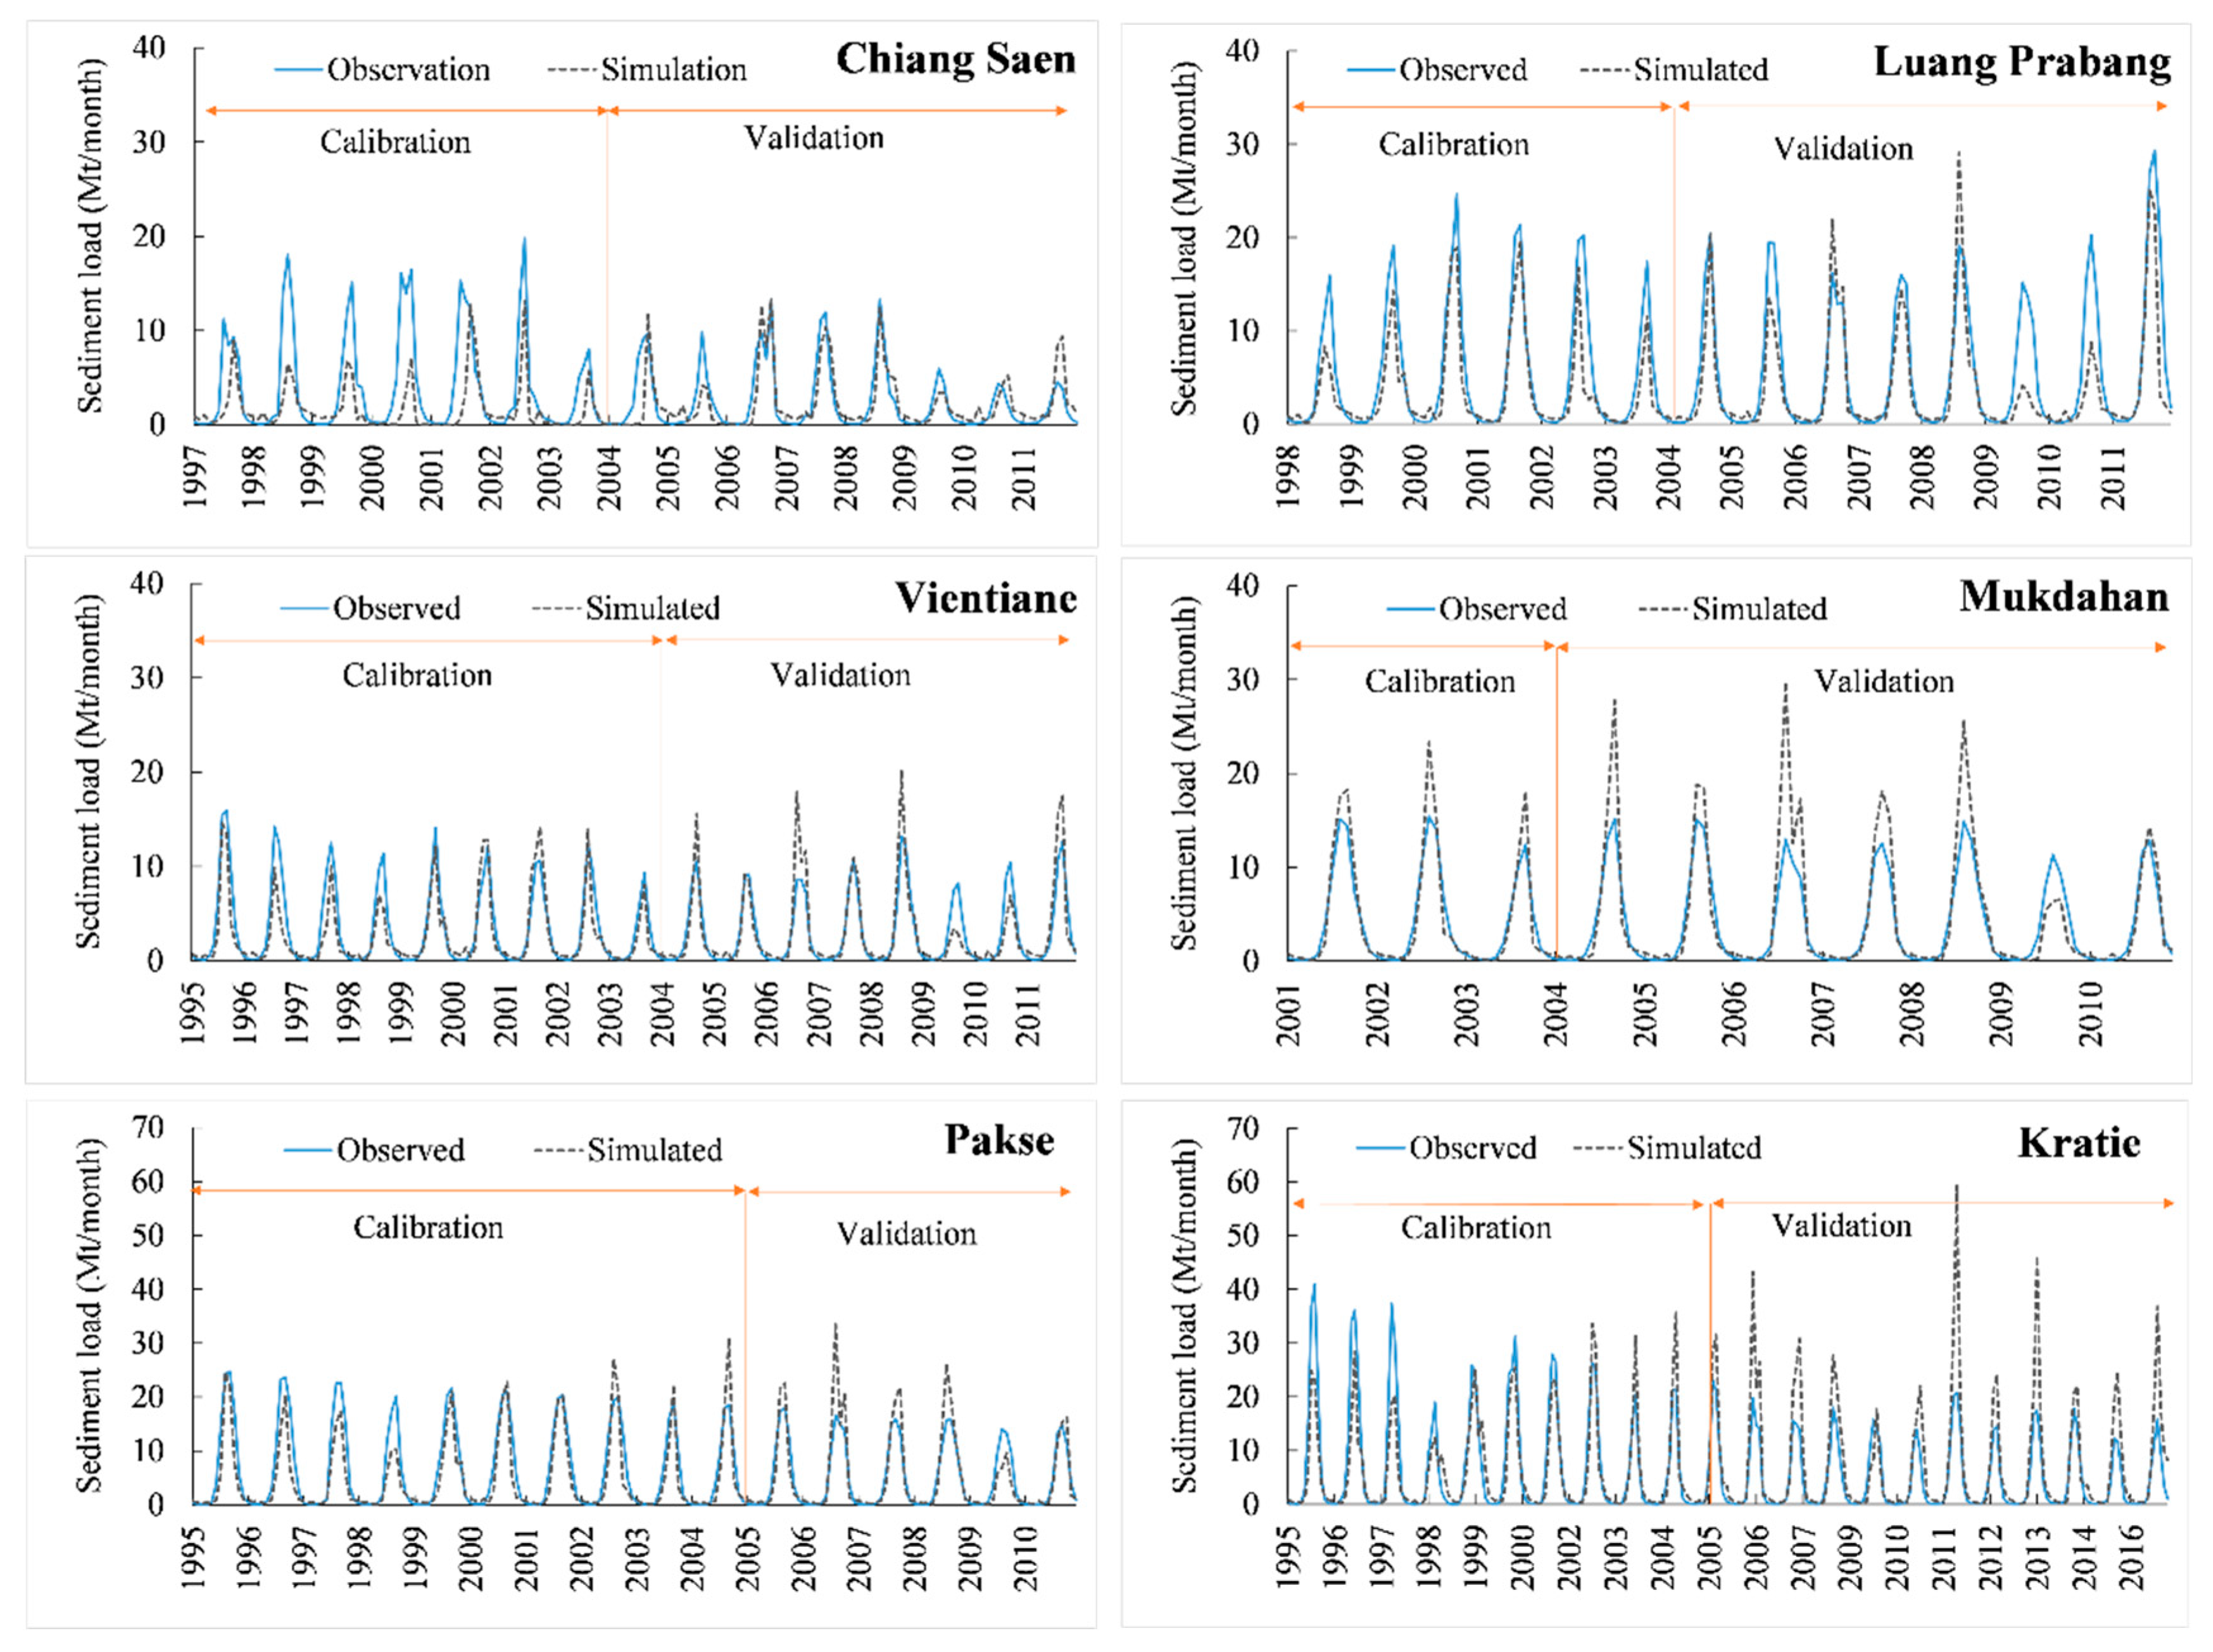
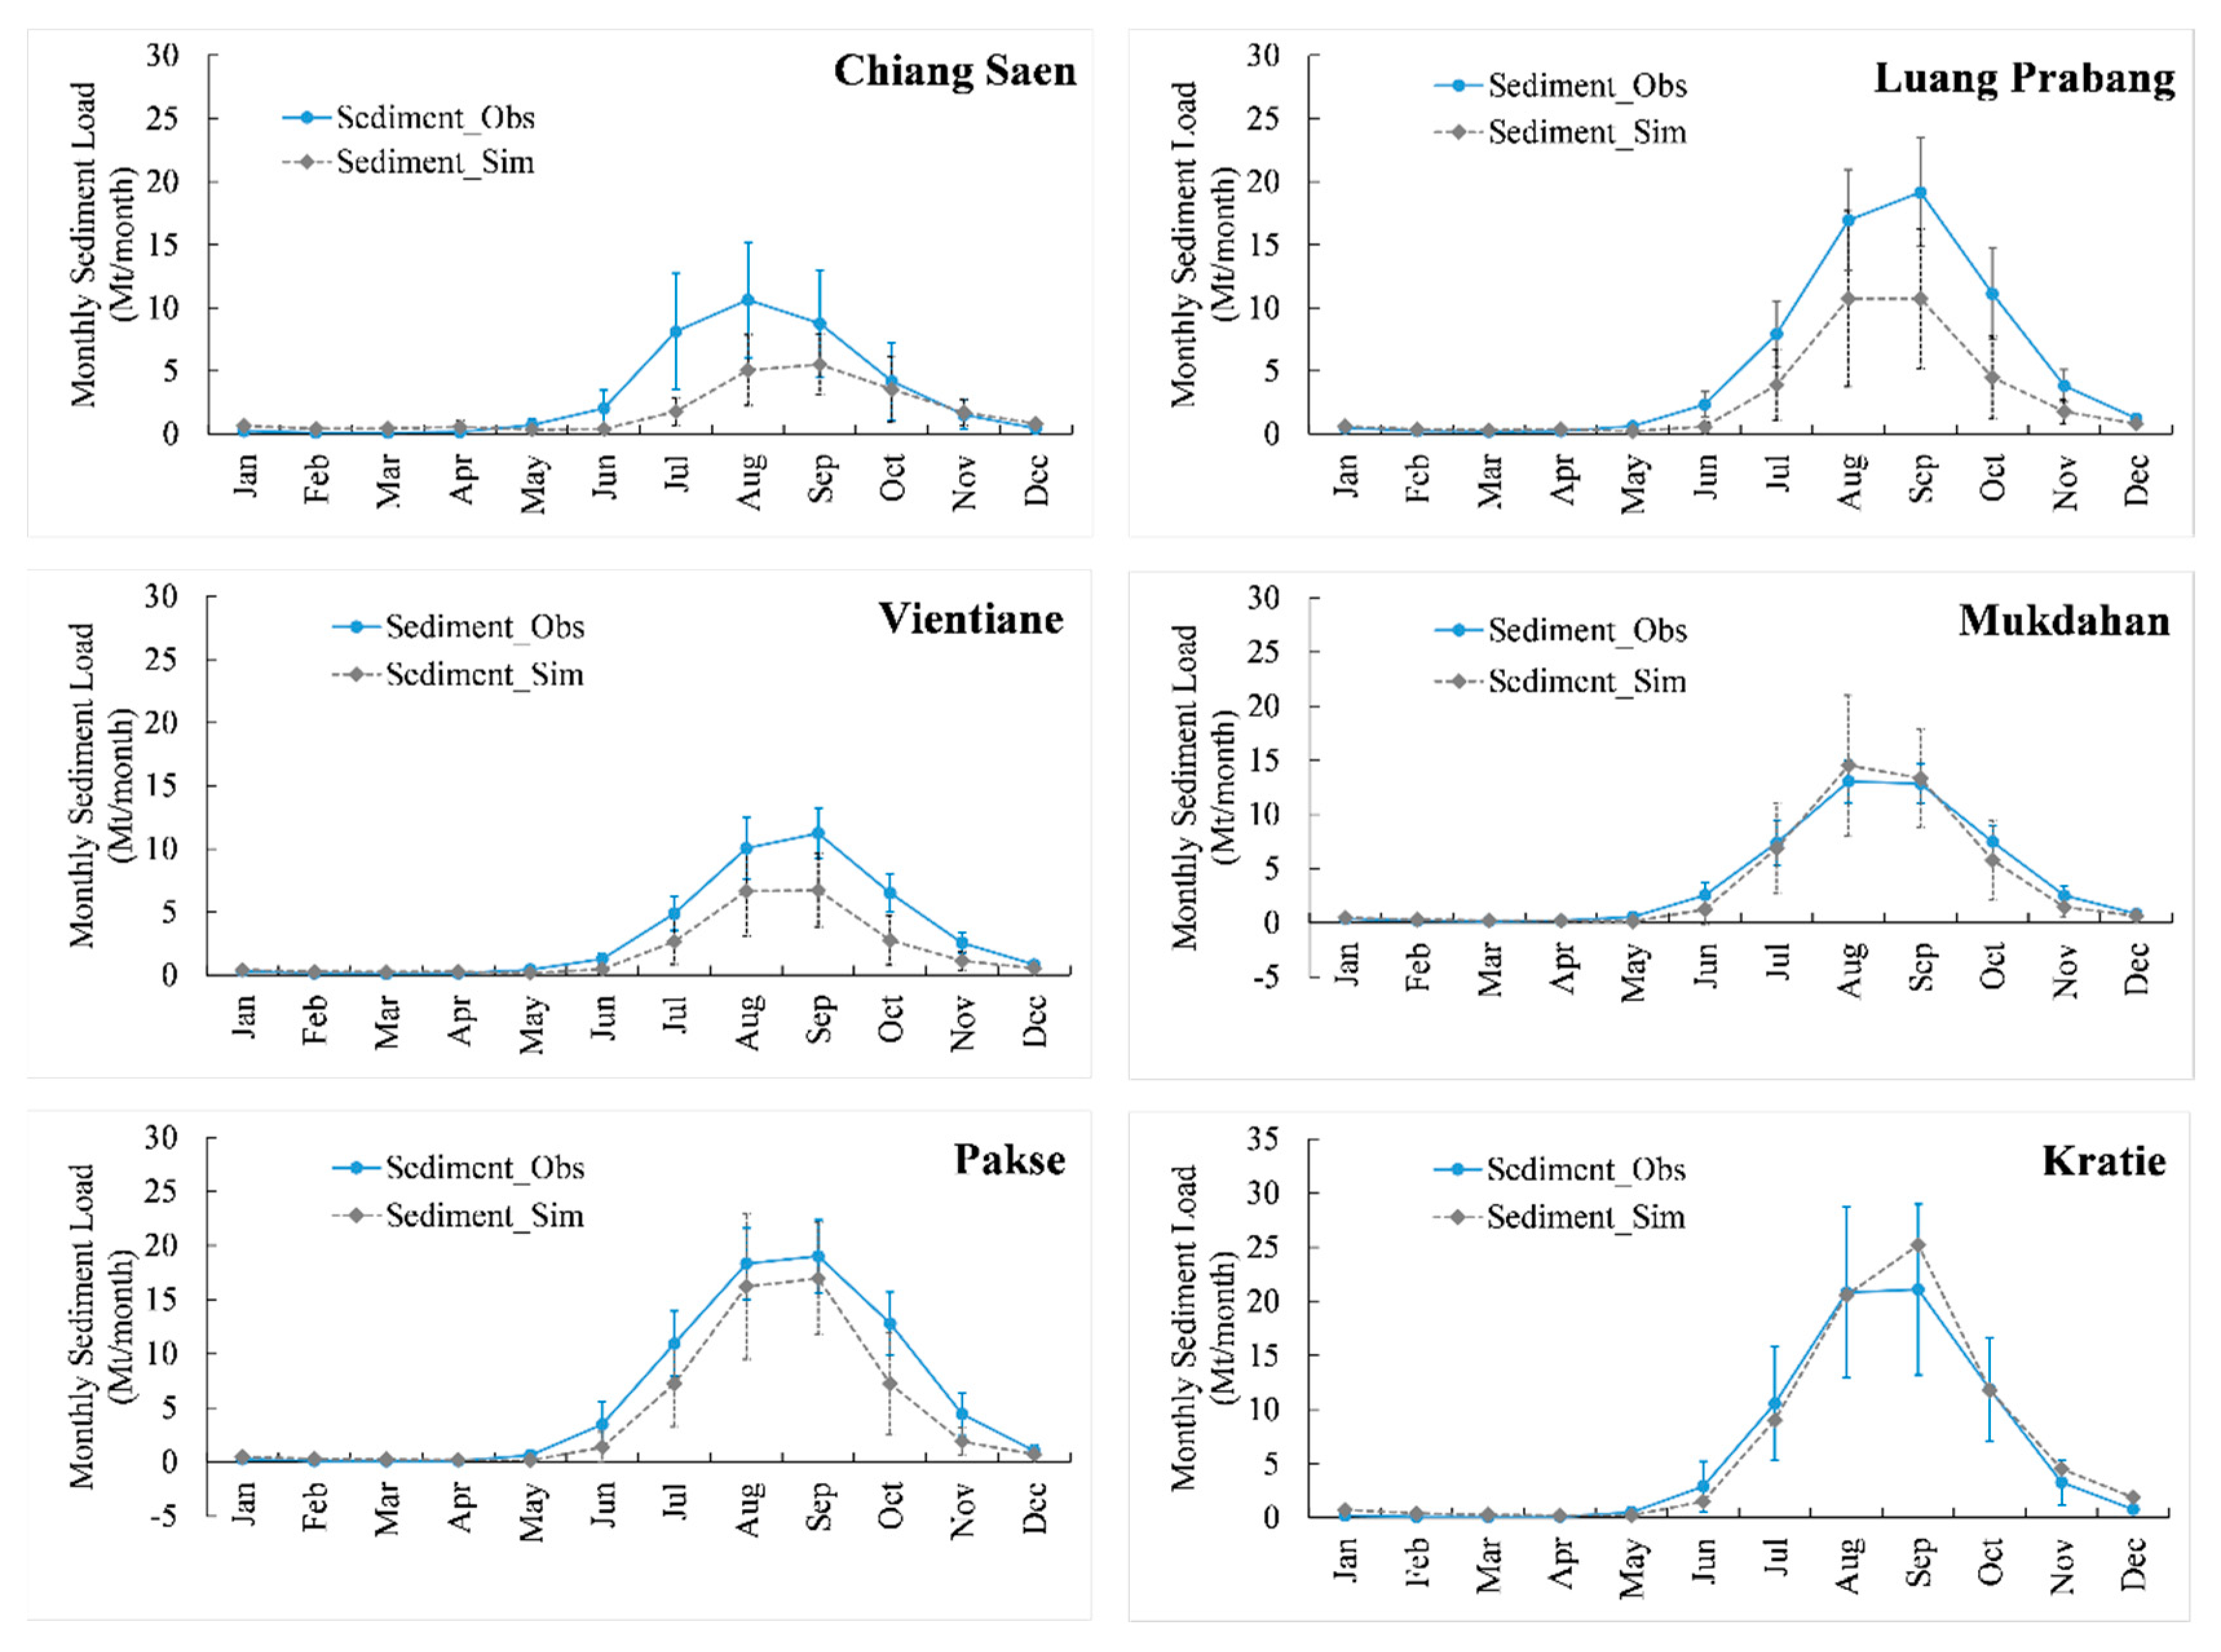
Figure 5 shows the visual comparisons between simulated and observed sediment loads in the calibration and validation years at the Chiang Saen, Vientiane, Mukdahan, Pakse, Kratie stations. The results authenticated that SWAT is satisfactory for use in the sediment study. However, the model does not be able to apprehend the peak sediment loads well for both calibration and validation years. This can be attributed to the bias of precipitation data and errors in stream gauges [54]. In addition, the result of mismatch in low-flows may be have caused by unaccounted flow control from upstream hydropower dams in the dry season, as recommended by [55].
The result of calibration periods covers from 1985–1999, except at Chiang Saen (1985–1994), and the validation period covers from 2000–2016, except at Chiang Saen (1995–2007). The statistical performance of monthly sediment load simulation suggested that the SWAT model was well-calibrated/validated and is in a good range in the lower part of the Mekong Basin from Luang Prabang to Kratie (Table 5). The NSE values were over 0.50, and R2 values were above 0.50, for most of the stations during both calibration and validation periods. For two stations, the most upstream at Chiang Saen and the lowest station at Kratie, the statistical indicators were found to be 0.30 of NSE (Chiang Saen) at the calibration period and 0.30 of NSE (Kratie) in the validation period. The low performance of the model in the upstream part could be due to the six dams affecting the upstream at Chiang Saen. Overall, the result of the monthly streamflow performance of the SWAT model shows the adequate capability to process sediment calibration and further process. This can be caused by the scarcity of sediment data in the upstream, moreover the precision of the SWAT performance in simulating sediment load could be reduced at the steep slope area. Walling [23] has acknowledged that the number of gauging stations, reliability, and the spatial and temporal resolutions of data are crucial information in investigations on the load in Chiang Saen station. The lowest station at Kratie seems to be problematic in modelling due to the wetlands (at Stung Treng). On the whole, the perceptible comparisons and the estimations of statistical indices represent acceptable fits between simulated and measured load.
In general, graphical visual and statistical indices indicated good calibration and validation over the range of sediment load. The model simulated the timing and end of seasonal streamflow but was slightly off in some estimates of peak flows. In addition to the monthly comparison of simulated and observation streamflow, we also evaluated the average monthly simulated and observed streamflow of our model for the six-gauge stations, respectively (Figure 6). It demonstrated the underestimate in monthly sediment load in two upstream stations at Chiang Saen and Luang Prabang. The upstream underestimation can be confirmed and found in Figure 7, which is the scatter plot of the monthly comparison of simulated and observation sediment load.
3.3. Water Balance and Hydrological Component in the Mekong River Basin
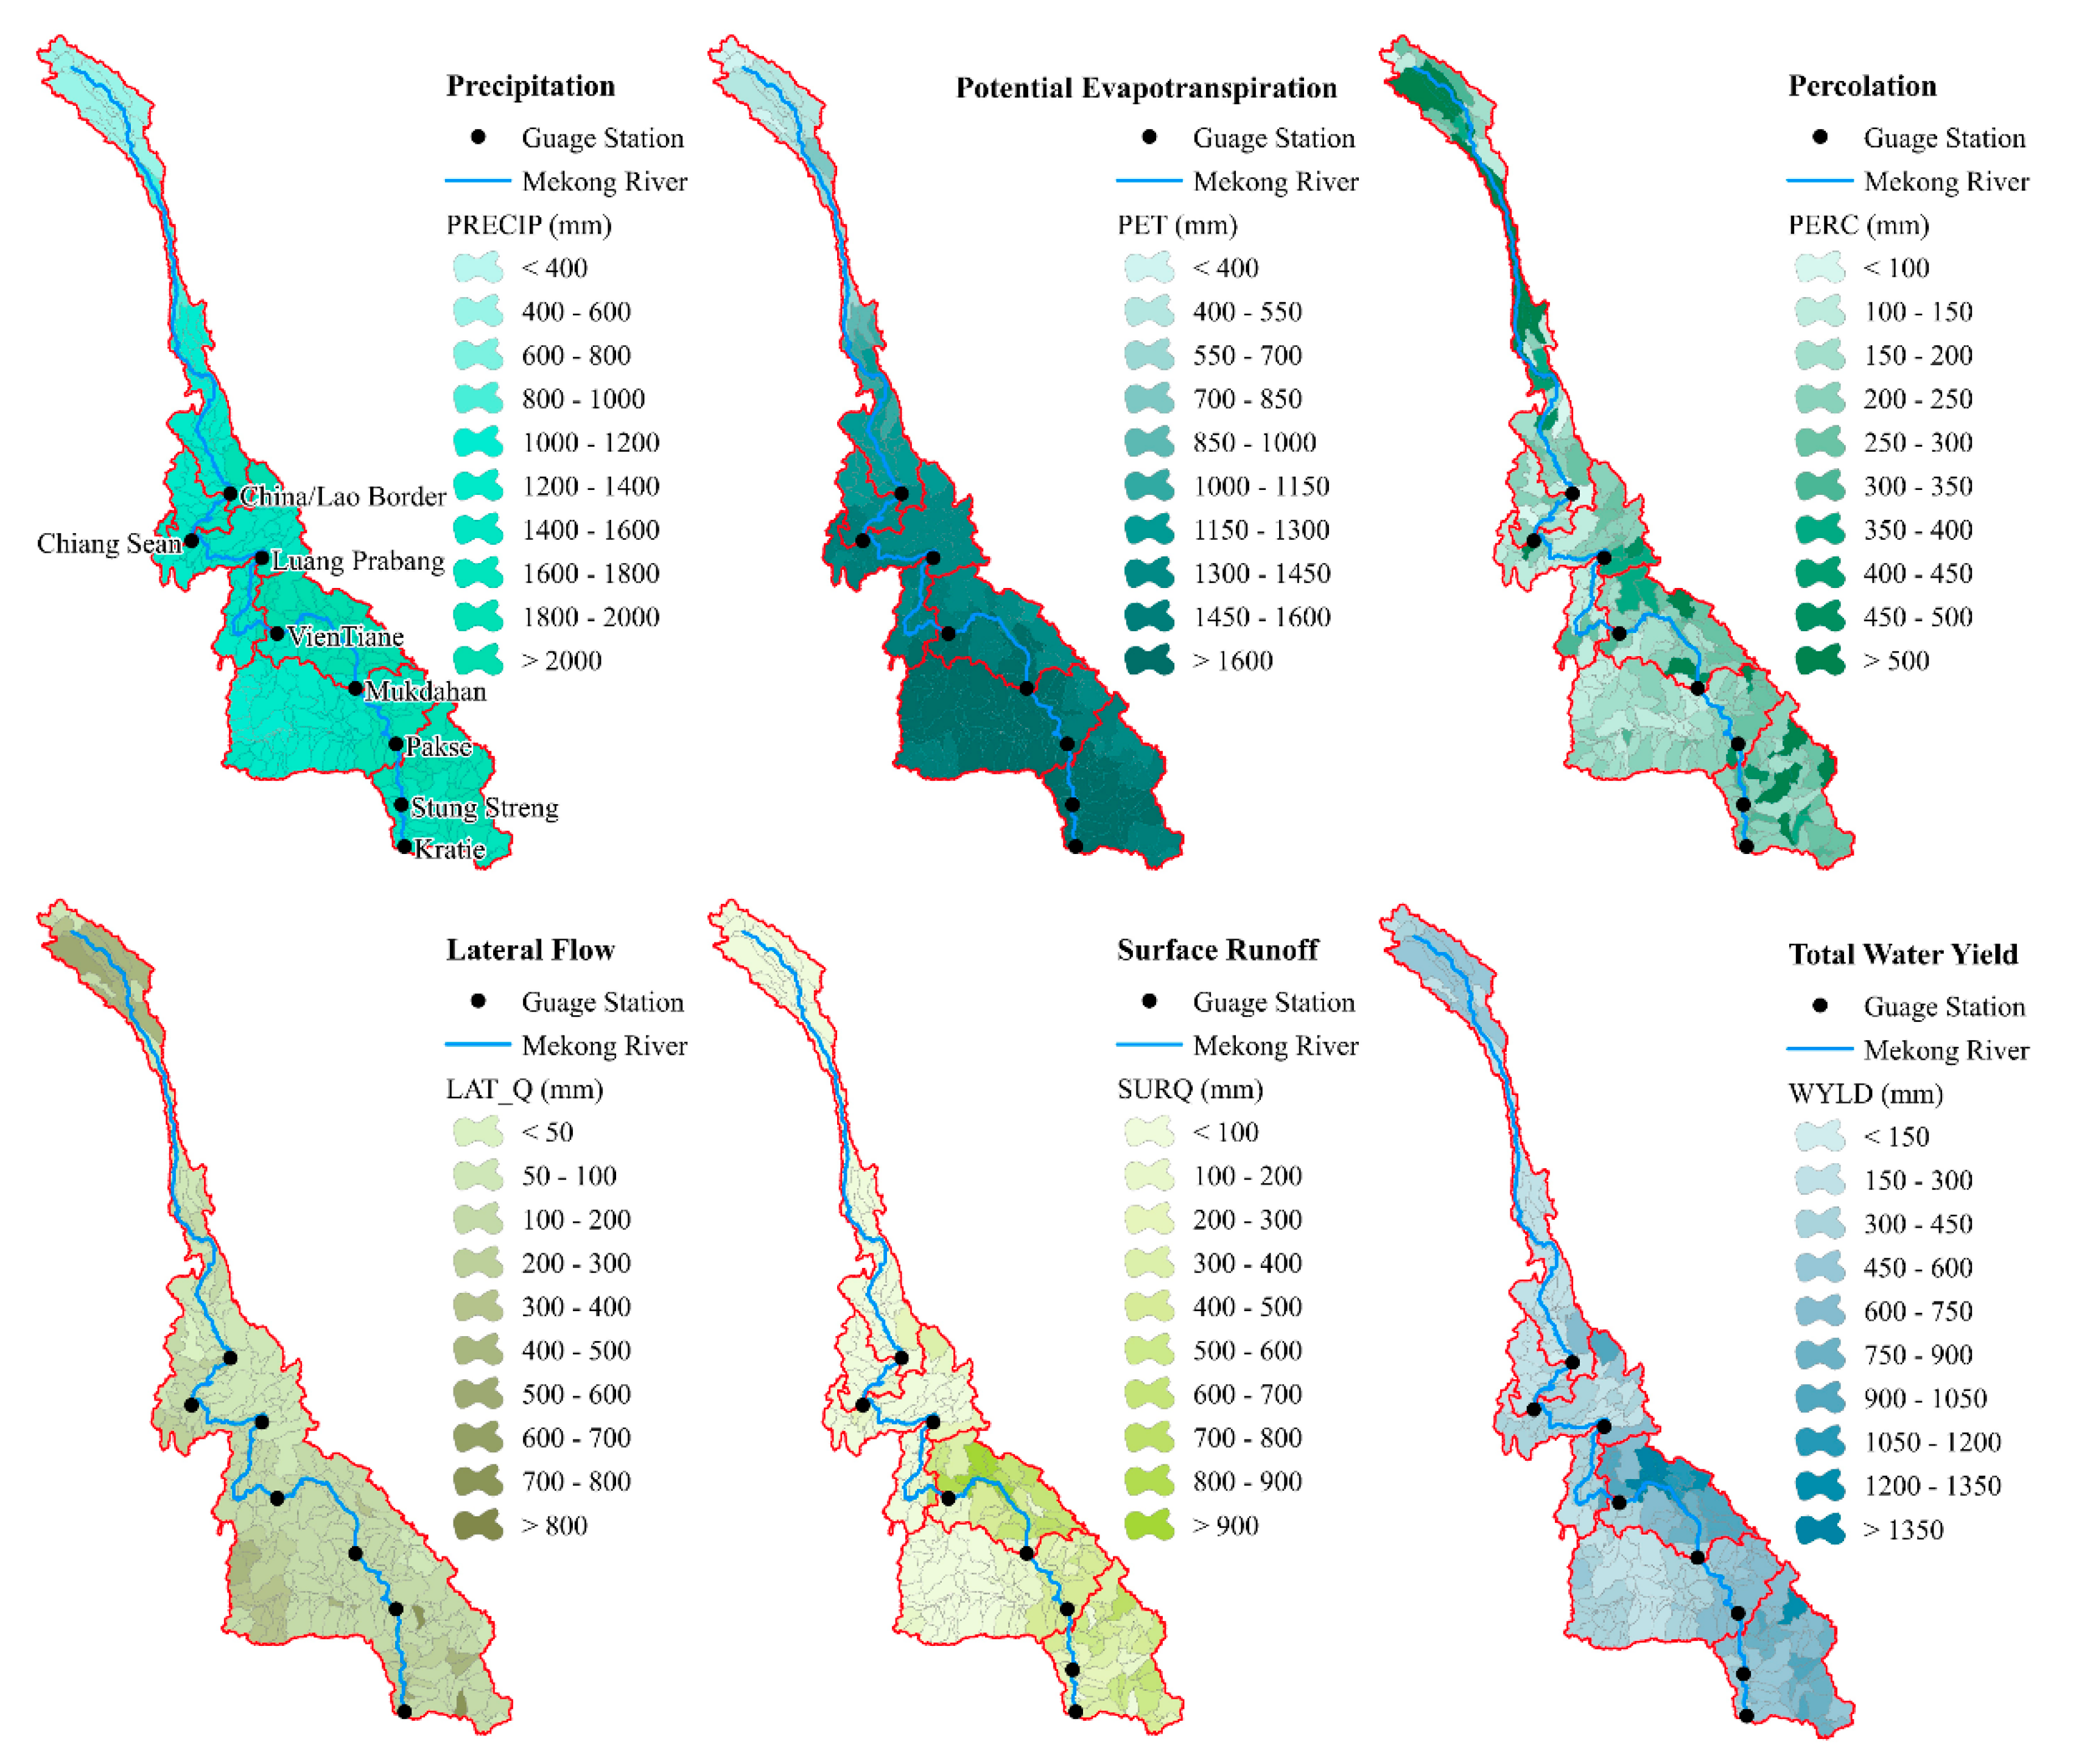
Water balance components on the Mekong Basin have been illustrated in Figure 8. The system in the Mekong Basin can be divided and can be identified in three major groups. The first upper group in the Upper Mekong River Basin (sub-basin #1 and #2) have low rainfall in the annual scale; however, snowmelt contributes to its streamflow during the dry season. The left bank tributaries group (sub-basin #3, #5, #7 and #8) drains the high-rainfall areas of Lao DPR, Central Highland of Vietnam and the Northeast of Cambodia. The right bank tributaries (mainly the Mun and Chi Rivers, the sub-basin #4 and #6) drain a large part of northeast Thailand [56].
In the Upper Basin (Lancang), the climate varies from tropical and subtropical monsoons in the south of Yunnan to temperate monsoons in the north as the elevation rises from a mean of 2500 to 4000 m above MSL in the most upstream part. The seasonal distribution of rainfall is similar to the Lower Basin; however, annual precipitation decreases towards the north (the most upstream of the basin) to as little as 400–600 mm. Snow at higher elevations is the major source of water during the dry season and spring flows (April, May) in the upper part of mainstream. The rainfall distribution can reach a double peak over the Lower Mekong Basin in Central of Laos, Central highland of Vietnam, and the Upper part of Cambodia (from Vientiane to Kratie) comparing to the Upper Mekong Basin. The highest precipitation (>2000 mm/year) occurs in the left bank of the river in Lao DPR and the central highland of Vietnam.
The overall proportion of streamflow in the Mekong River in the study modelled by SWAT was 34% from surface runoff, 21% from lateral flow, 45%from the contribution of groundwater. The detail in each sub-basin is summarized in Table 6. The high average water yield was noticed at the sub-basin # 5 in between Vientiane to Mukdahan following by sub-basin # 7 from Pakse to Stung Streng, which is the highland area in Vietnam. The detail of water yield, which is contributed by surface runoff, lateral flow, and groundwater to the streamflow (total water yield) in the Mekong River at eight stations are detailed in Table 7. Comparing to Kratie, the upper Mekong Basin at China/Laos Border and Chiang Saen contribute average flows of 18% and 21%, respectively. At Luang Prabang and Vientiane, the flow contribution to the Mekong flow at Kratie was 30% and 34%. At the downstream of Vientiane, the station at Mukdahan and Pakse contributes a large part of the flow, with the average flow 65% and 79% of total flow at Kratie. At the same time, average flow at Stung Treng to Kratie was close to each other (1% difference of the total flow at Kratie). Apart from the upstream flow, the large part of the average flow at Stung Treng comes from the 3S basin (Se San, Sekong, and Sre Pok), which is the largest tributary of the Mekong River and originates from the central highland of Vietnam.
3.4. Spatio-Temporal Sediment Load and Yield of Mekong River Basin
The variation of the annual water discharge, annual sediment load, and yield at Chiang Saen, Luang Prabang, Vientiane, Mukdahan, Pakse, and Kratie along the Lower Mekong River have been illustrated in Figure 9 and Table 8. Key factors affecting the amount of sediment yield include vegetation cover, topography, soil, and climate. From Table 8 which describe general characteristic and sediment load yields by major area, the highest sediment yield (1295 t/km2/year) can be found in Chiang Saen to Luang Prabang in the northern part of Laos. This area is covered by mixed land use and high topography with steep slopes. In the upper Mekong part in China (where the river is called Lancang River), despite high topography and steep slope, the sediment load is lower than Chiang Saen to Luang Prabang due to covering by the forest type (evergreen and mixed forest). It is noticed that the Mekong Basin in Thailand (Mukdahan to Pakse), despite the high agricultural activity, the sediment yield is low (78 t/km2/year) since most of the area covers by gentle slope. In between Pakse and Kratie (including 3S, the largest tributary of Mekong), the average sediment yield was found 138 t/km2/year; however, we found high yields at the upstream part of 3S basin (>500 t/km2/year). Even though Tonle Sap and its basin were not included in this study; it is worthy of mentioning that the Tonle Sap Lake at flood stage receives substantial sediment in backwater flooding upstream from the Mekong River mainstream and its net deposition [25,27,57], thus zero sediment yield assumption was commonly mentioned in this apart. The delta is naturally a sediment sink, so it also has a zero-sediment yield [39].
Our result of sediment loads in various stations along the main river align with some previous studies that suggest sediment discharge to the South China Sea varies from 40 to 160 Mt/year such as [26,34,58,59,60]. However, some studies found higher sediment loads, such as [61,62,63]. Sediment load have been started to decrease continuously due to the fact of sediment trapping by hydropower dams was confirmed in most research [20,39,41,64,65]. The reduction of sediment loads in the Mekong could be aligned with the global context. e.g., [1,12,66,67]. In the Mekong River Basin, one of the recent studies on the effects of rapid development dams on sediment transport was conducted by [64], which found that more than 50% of the total Mekong River sediment load would be trapped annually (between 1993 and 2003). Before 2003 and after 2009, average suspended loads reduced at Chiang Saen station from 60 to 10 Mt/year (83% reduction), at Pakse from 120 to 60 Mt/year (50% reduction), and at Kratie from 160 to 90 Mt/year (43% reduction) [28]. The concern stems not only from dam development on Mekong mainstream but also on its main tributaries. For example, Wild and Loucks [68] found a substantial portion of the sediment reduction from the 3S basin, where there is a rich source of sediment. Beside the dam development in Mekong River Basin, climate change and land use change are also the crucial factors of sediment transport throughout the basin [69]. The instream sediment load and yield in the lower part of the Mekong River are likely influenced by the interaction between land use/land cover, rainfall-runoff, and anthropogenic activities within the basin [70]. Deforestation and agriculture expansion could change the landcover and alters basin erosion of the Mekong River [71]. Shrestha et al. [69] also indicate large unreliability of Mekong River’s watershed in the direction and magnitude of variability of flow and sediment yields due to climate change. The variability of sediment can be from the accumulation of upstream and localized erosion agricultural activities [72].
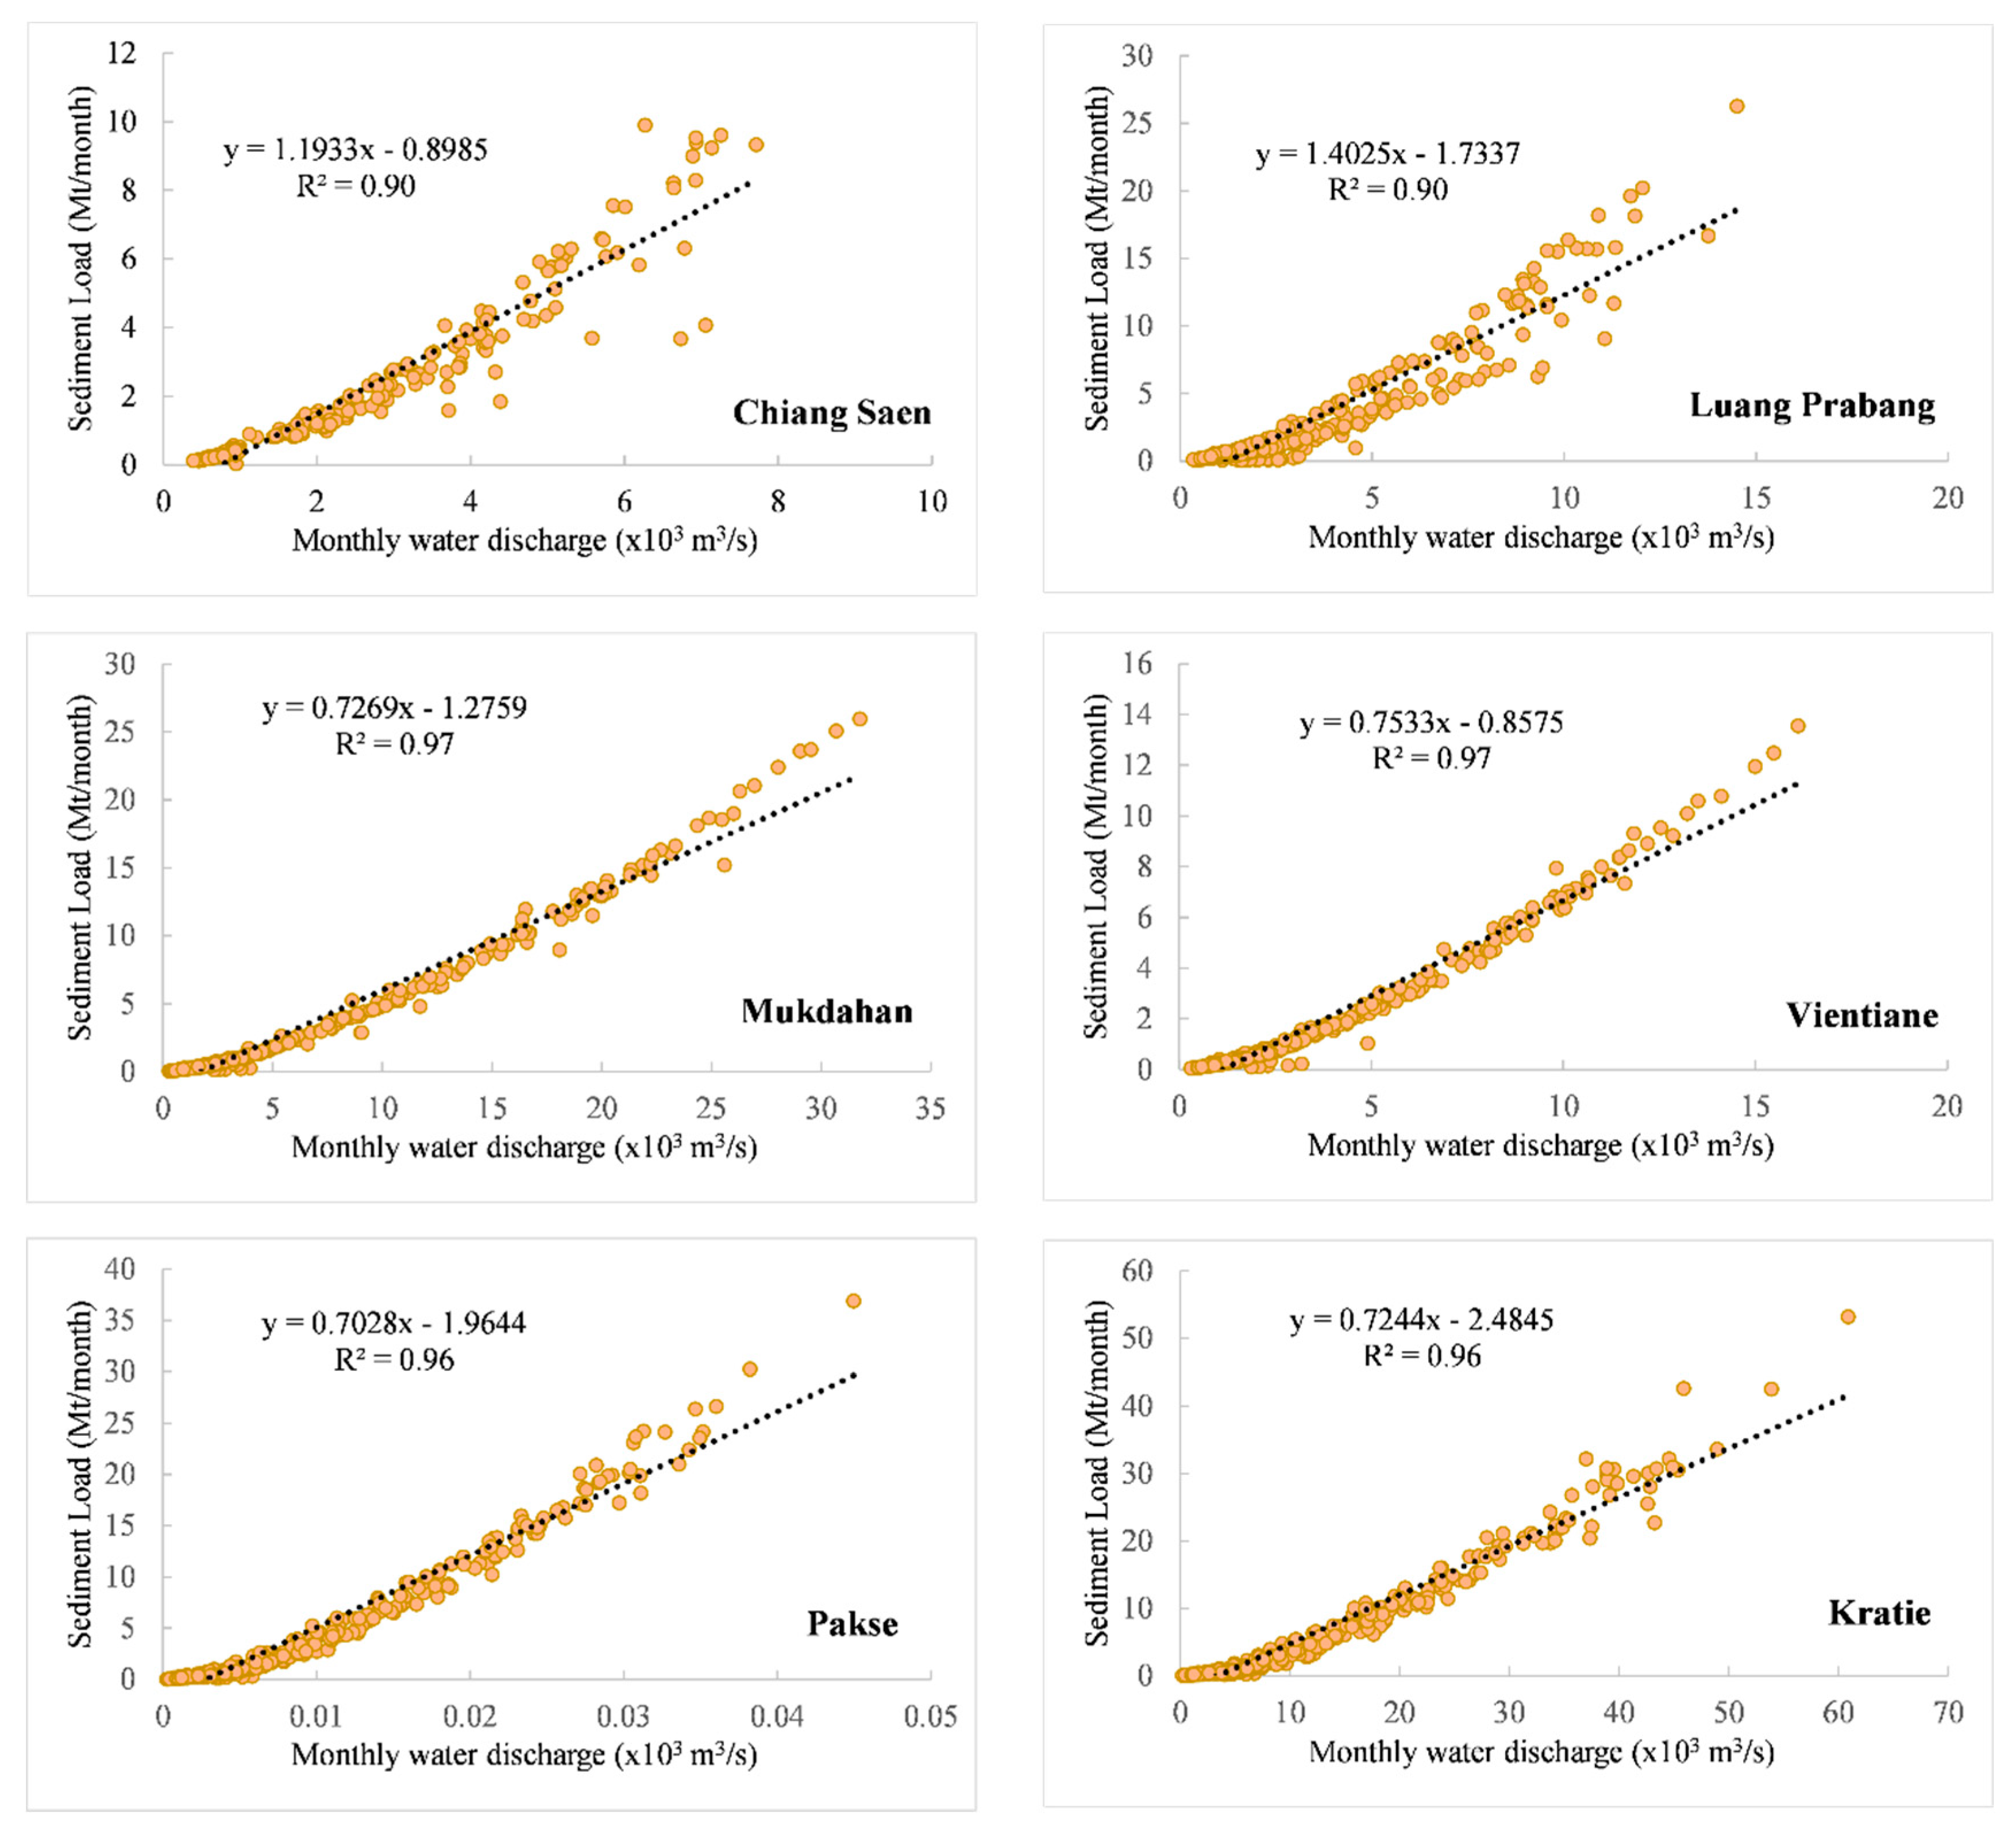
The empirical relationship between sediment load and water discharge will be used for sediment load estimation along the Mekong River (Figure 10). The monthly sediment load correlated well to the monthly discharge (notably high values of R2). The R2 values of these correlations were generally over 0.90. According to the results of R2 values suggested that these correlations were well-closely and are in a very good relationship between sediment load and water discharge in the Mekong Basin from Chiang Saen to Kratie.
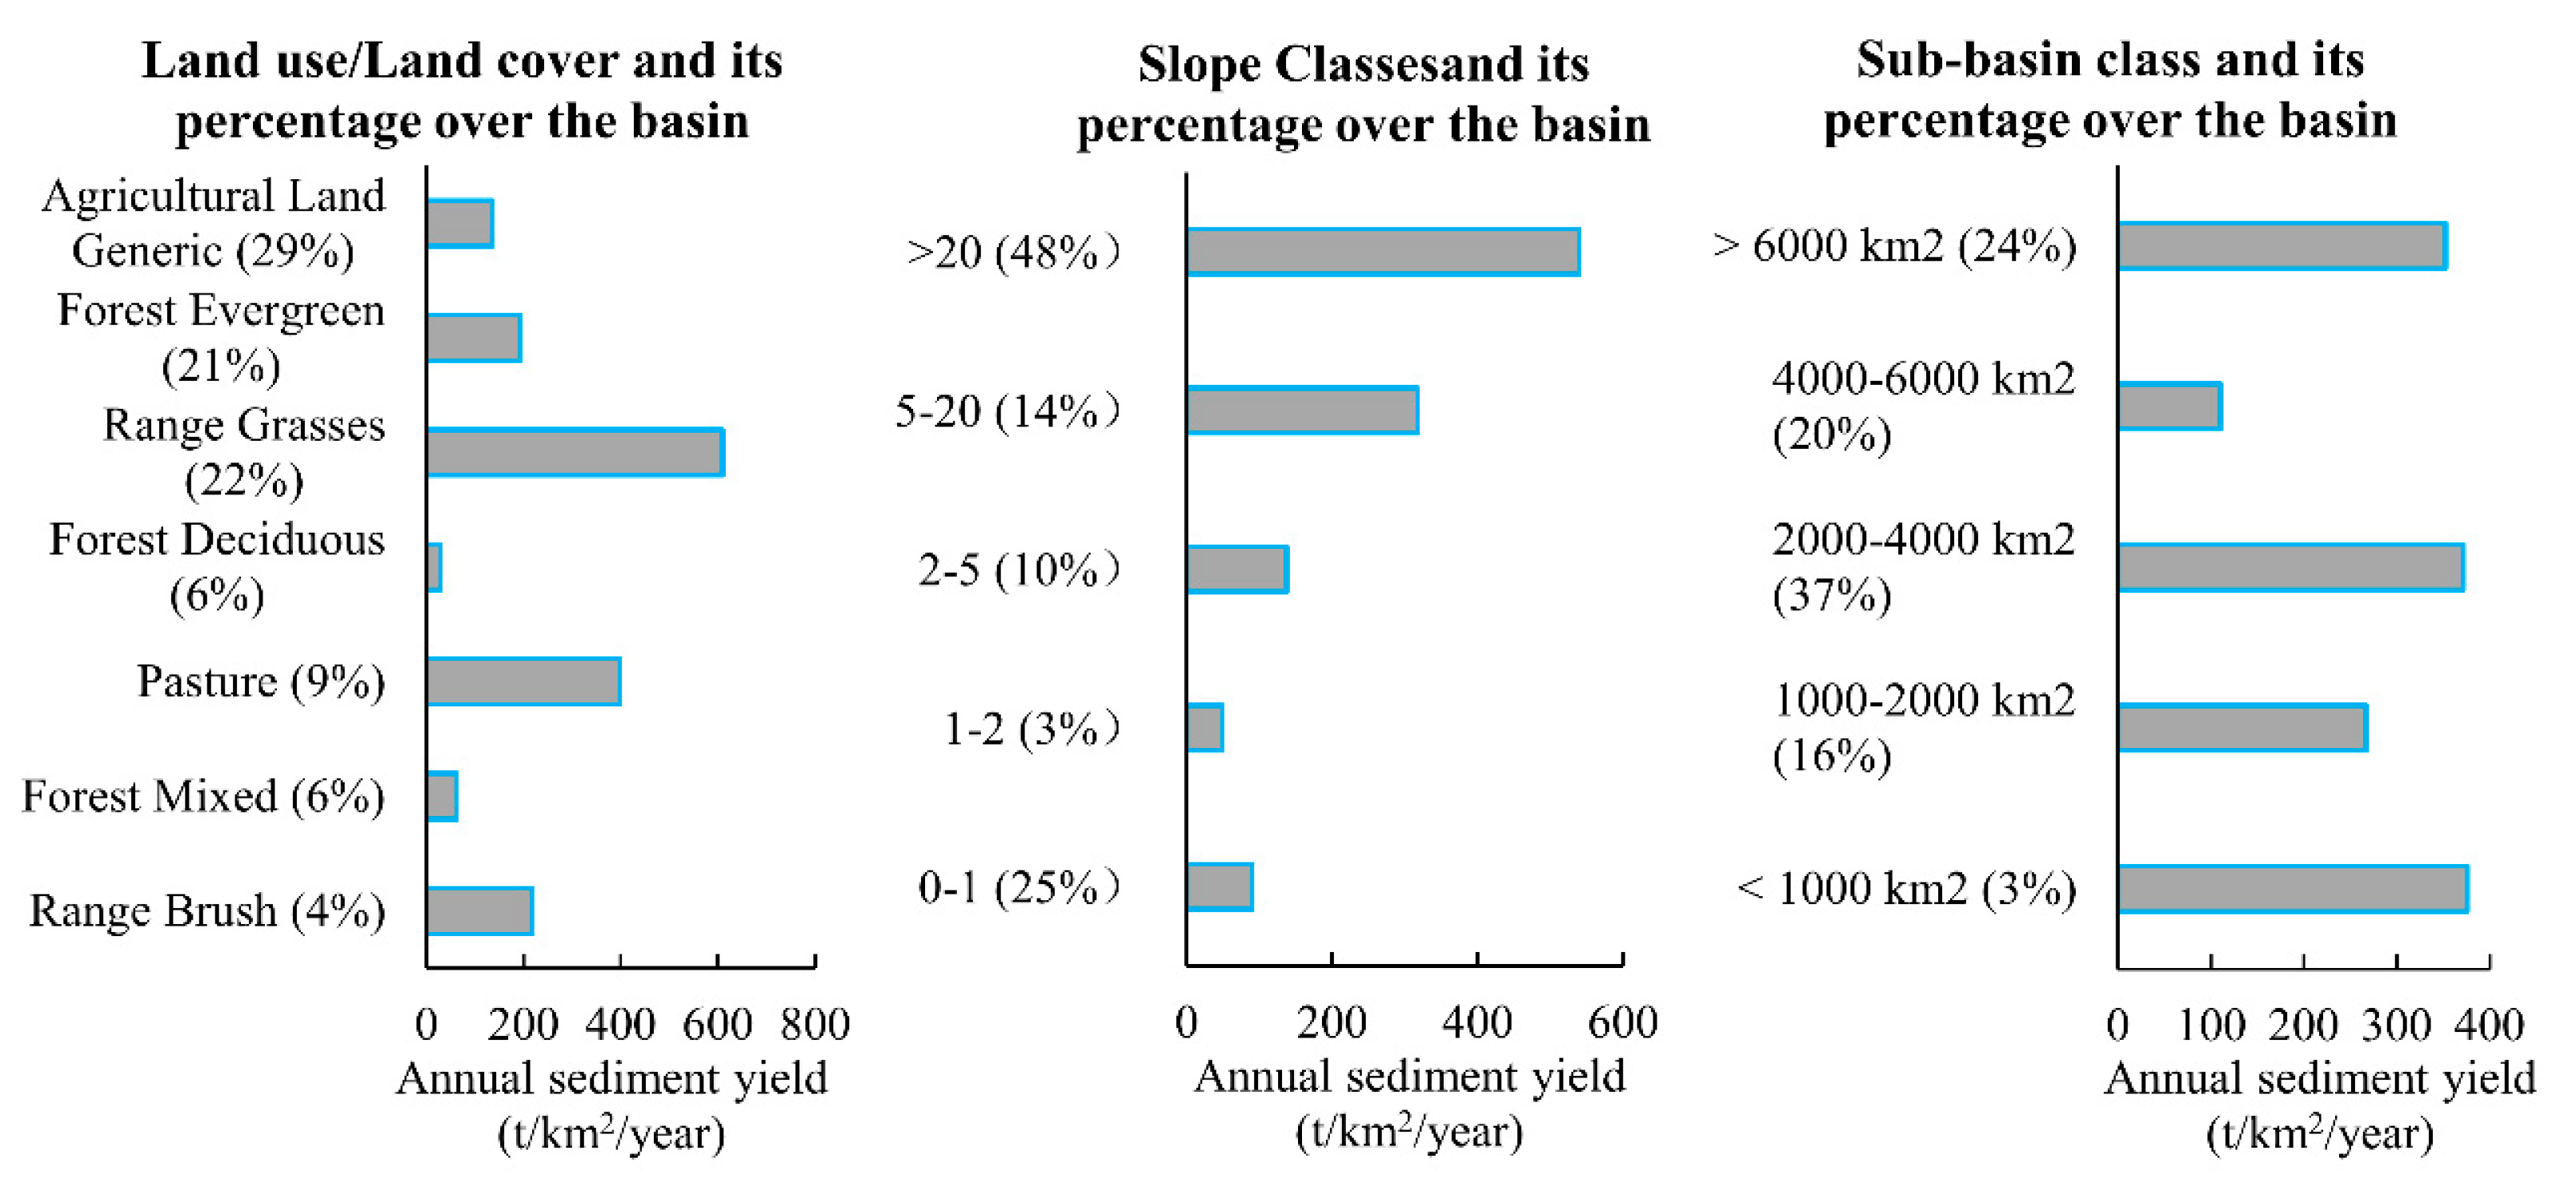
Figure 11 illustrated the overall spatial mapping of average sediment yields and mean annual sediment load for the Mekong River Basin from 1985 to 2016. To understand in detail sediment yield in the Mekong related to basin characteristic, the annual mean of the sediment yield in the Mekong River Basin for the simulation period 1990–2016 by divided into land use/land cover types, slope class, and area sub-basin class. The mean annual sediment of land use/land cover types, and its percentage over the basin ware divided into seven types as agricultural land generic, forest evergreen, range grasses, forest deciduous, pasture, forest mixed, and range brush (Figure 12). The highest and lower erosion sediment yield of the basin compared to other are range grasses and forest deciduous about 610 t/km2/year and 28 t/km2/year, respectively. For the erosion sediment yield of the pasture about 397 t/km2/year, range brush 217 t/km2/year, forest evergreen was found to be less sediment yield with approximately 193 t/km2/year; for agricultural land generic was found even lower averagely 135 t/km2/year, and the lowest forest cover erosion was forest mixed with 62 t/km2/year.
The annual sediment yield classification related to slope class and its percentage over the basin was separated into five classes such as 0–1, 1–2, 2–5, 5–20, and higher than 20 described in Figure 12. The highest slope class covered area about 48% of the whole basin, was highly erosion sediment yield about 539 t/km2/year, and the gentle slope classes (0–1% and 1–2%) were low erosion sediment yield approximately 90 t/km2/year and 49 t/km2/year, respectively. The steep slope classes (2–5% and 5–20%) were covered about 24% of the whole basin, which were erosion sediment yield about 137 t/km2/year and 317 t/km2/year, respectively.
The sediment yield of sub-basin area class and its percentage over the basin by divided into five classes (less than 1000 km2, 1000–2000 km2, 2000–4000 km2, 4000–6000 km2, and higher than 6000 km2) were also presented and can be found in Figure 12. The most significant erosion sediment yield of the sub-basin area class is sub-basin area less than 1000 km2 covered area only 3% of the whole Mekong River Basin about 376 t/km2/year. The lowest erosion sediment yield of the sub-basin area class about 110 t/km2/year in the sub-basin 4000–6000 was 110 t/km2/year, which covered an area of about 20% of the whole Mekong River Basin. For the sub-basin area class 1000–2000 km2, 2000–4000 km2, and higher than 6000 km2 were covered in a total area of about 50% of the whole Mekong River Basin, which was erosion sediment yield about 267 t/km2/year, 372 t/km2/year, and 352 t/km2/year, respectively.
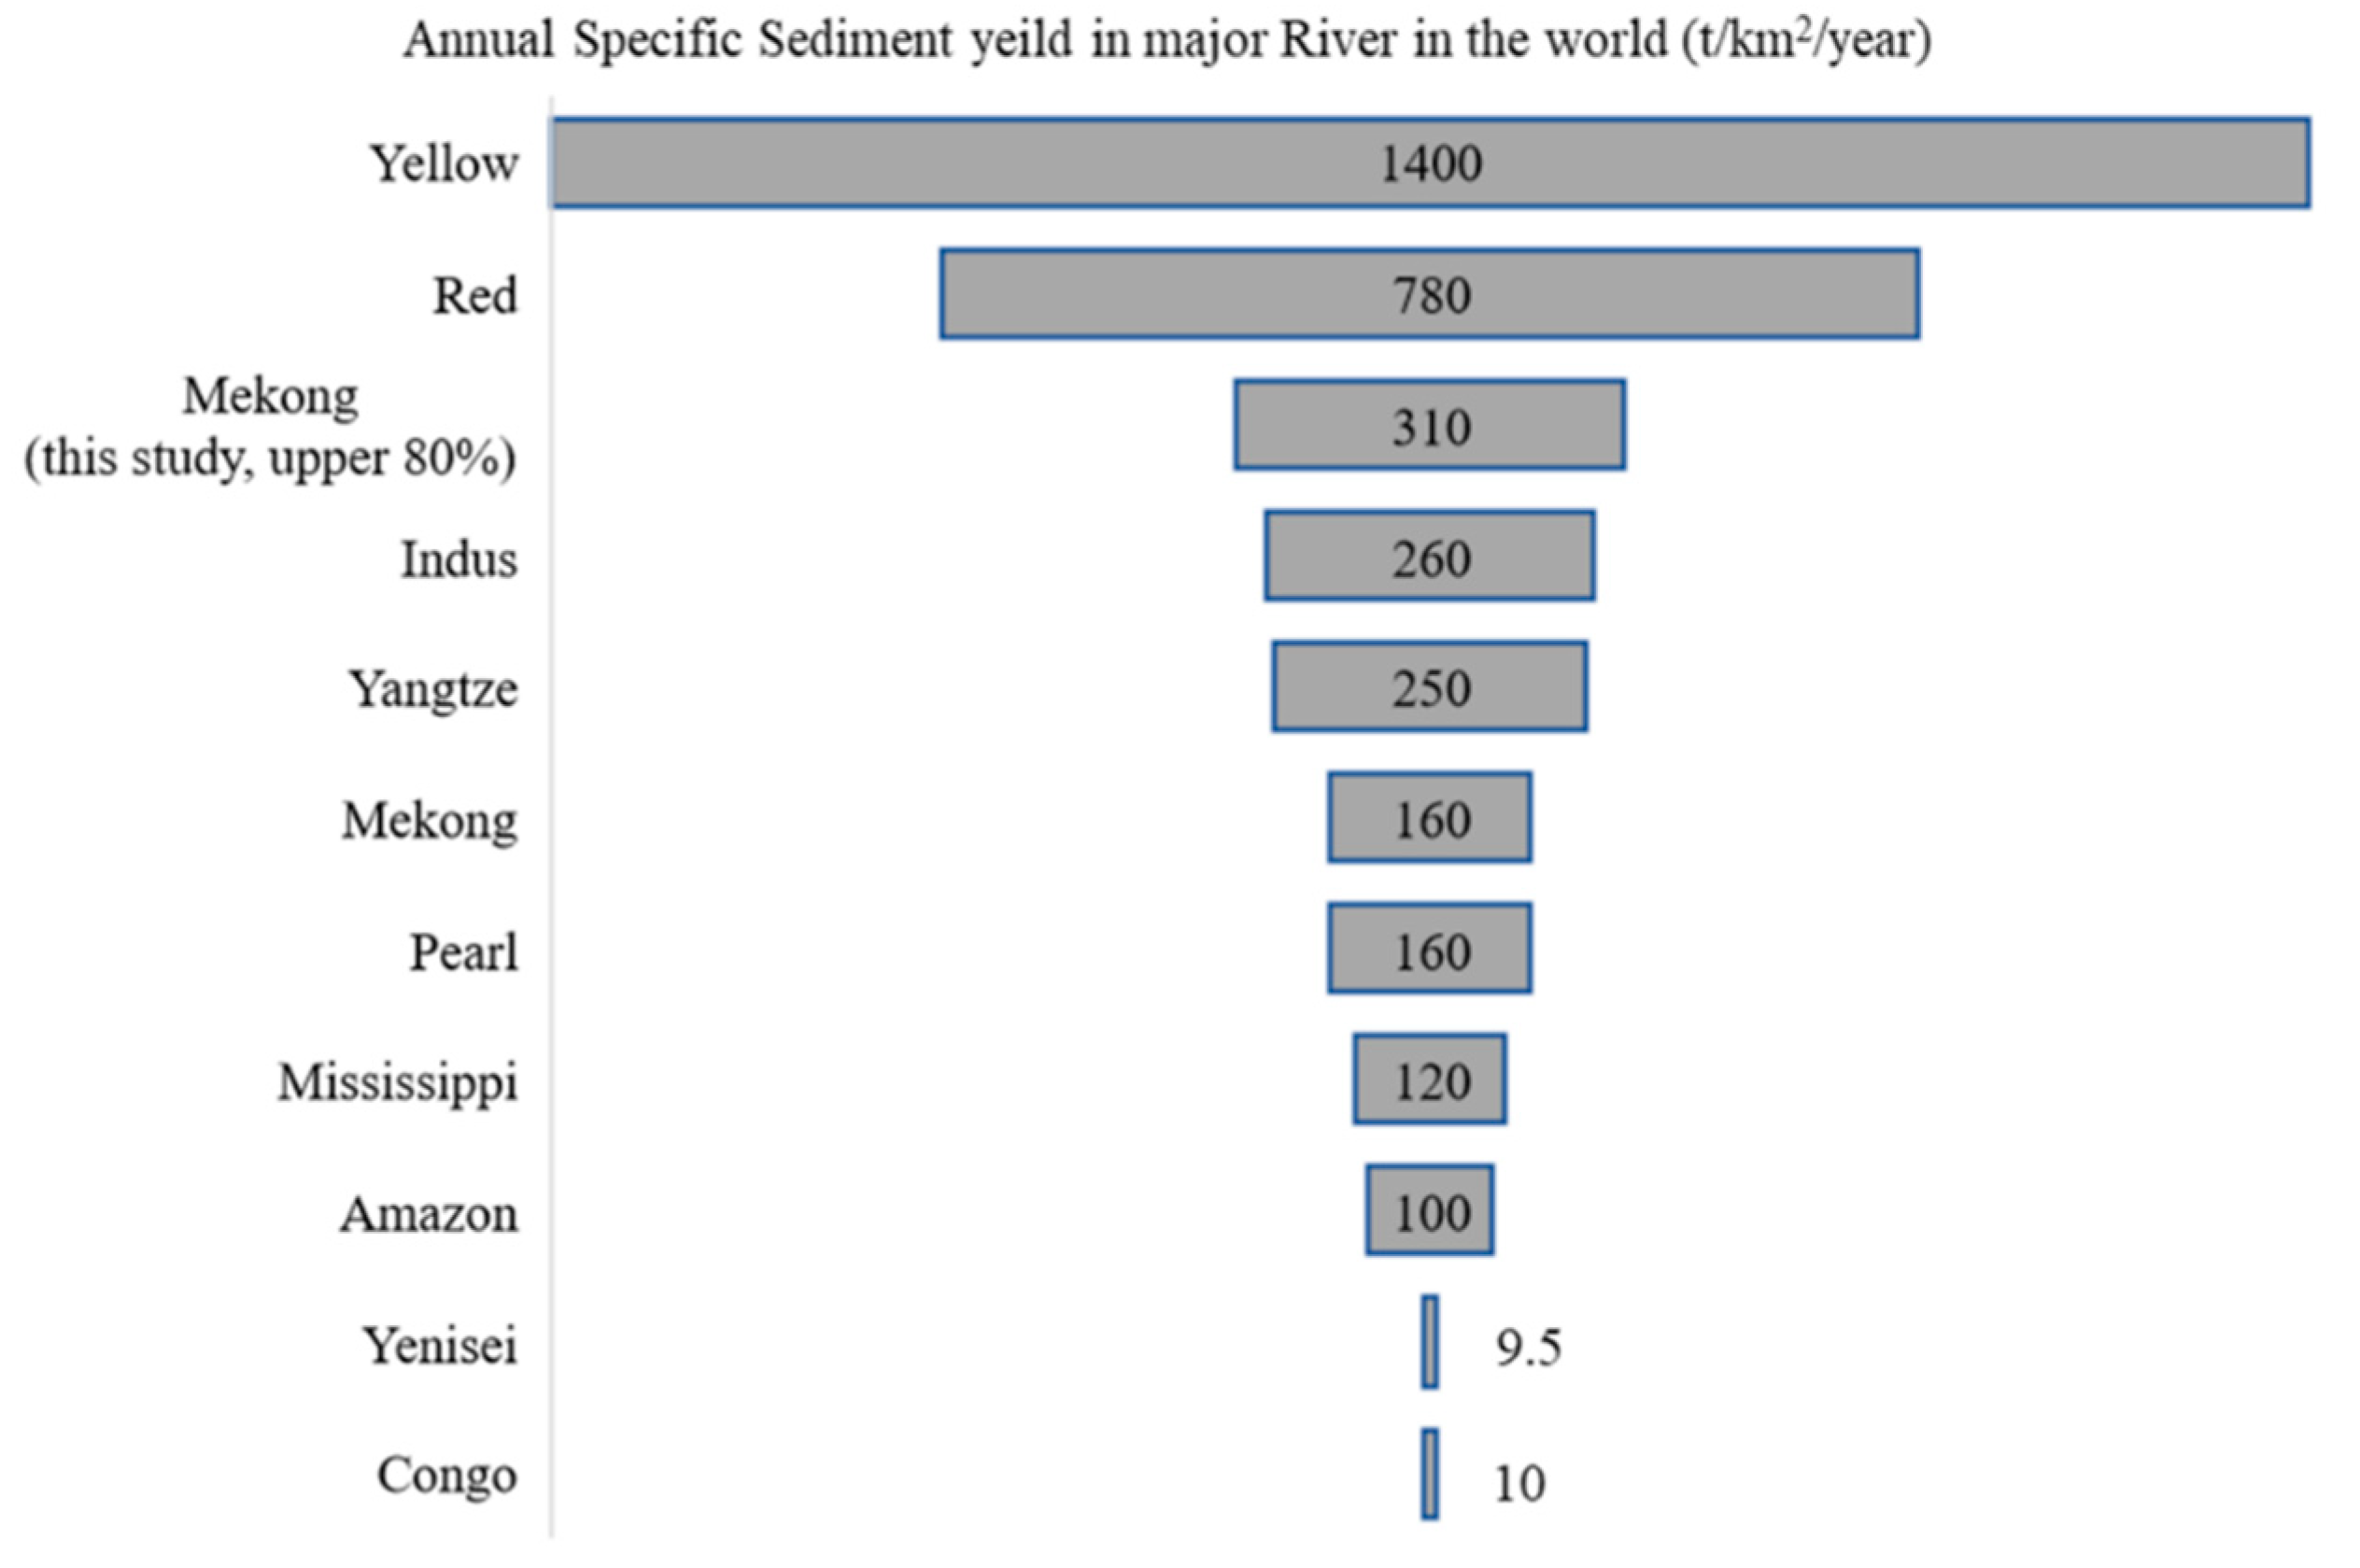
Unlike some other large alluvial rivers such as the Amazon, little sediment exchange occurs between channel and floodplain in the Lower Mekong River, except in downstream reaches below Kratie in the Cambodian lowlands and the Mekong Delta [22]. In this area of basin, Mekong river is essentially a conduit cut in rock that transfers sediment derived from the upper basin and tributaries draining nearby hillslopes and the sediment appears to be stored almost entirely within the channel [22]. The annual sediment yield of the Mekong River is comparable with sediment yields reported for other major rivers in Asia and elsewhere (Figure 13).
4. Conclusions
The SWAT model was applied to assess the water balance components and sediment erosion yield in the Mekong River Basin. The model was calibrated and validated against eight hydrological stations and six sediment stations along the Mekong mainstream. The calibration and valuation results authenticated the model performance to be very good in monthly flow performance and acceptable in monthly sediment performance. In the overall proportion of streamflow in the Mekong River, groundwater played a key role and contributed to almost half of the streamflow. At the same time, surface runoff took part in 1/3 of streamflow. The high average water yield was noticed in between Vientiane to Mukdahan from Pakse to Stung Streng, which is in the highland area in Vietnam. The Upper Mekong Basin contributed 20% of the average flow and is especially important during the dry season due to snowmelt. Apart from the upstream flow, the large part of the average flow from the 3S basin (Se San, Sekong, and Sre Pok), which is the largest tributary of the Mekong River and originates from the central highland of Vietnam, contributed 20% of the flow. The annual average sediment yield for the Mekong River was 312 t/km2/year from upper 80% of the total MRB before entering the delta. The highest sediment yield (1,295 t/km2/year) can be found in Chiang Saen to Luang Prabang in the northern part of Laos due to covering by the mixed land use and high topography with steep slopes. The middle part of Mekong Basin, located in Thailand (Mukdahan to Pakse), despite the high agricultural activity, has a low sediment yield (78 t/km2/year) since most of the area is covered by gentle slope. It is important to note that slope and land-use type in the Mekong could be the main factors related to sediment yield in the basin. The results of this study would be useful for understanding the derived sediment yield, and a spatial soil erosion map that can explicitly illustrate the identification and prioritization of the critical soil erosion-prone areas of Mekong River’s sub-basins. This study also supplies a sediment loading map in the Mekong River Basin, which could help to limit storage capabilities, increases the risk for ageing infrastructure, and lead to proper management strategies of this region. The outcome of the study could also be the baseline information of sediment studies for the sustainable watershed management plan.
It is also important to note that the assessment of hydrology and sediment in the Mekong River Basin accomplished in our study was mainly based on a dataset with only monthly water sampling at some stations along the main river. Given the large size of the Mekong River Basin, refinement of the basin monitoring network is necessary to improve assessments and future modelling work. The sediment load and yield have been influenced by land-use change, which is likely to alter the upland erosion process and not to mention climate change. The future dam development of some major tributaries will continue to cause a change in sediment load dynamics through sediment trapping of water impoundment. The combined effect of climate change, agricultural, and hydropower development requires further study, as complex interactions could cause drastic changes of sediment as well as water quality like nutrients, which can affect downstream ecosystems, delta, and the South China Sea.
Author Contributions
Conceptualization, C.O., S.S. and J.M.S.-P.; data curation, I.I.; investigation, T.S.; methodology, S.S. and J.M.S.-P.; software, T.S. and I.I.; supervision, C.O. and J.M.S.-P.; writing—original draft, T.S. All authors have read and agreed to the published version of the manuscript.
Funding
This research received no external funding.
Acknowledgments
The authors also thank the Ministry of Water Resources and Meteorology (MOWRAM) of Cambodia for providing the data. Ty SOK would like to acknowledge Les Bourses du Gouvernement Français (BGF) and Laboratoire Ecologie Fonctionnelle et Environnement for hosting during his Ph.D. study. Authors would like to thank Cody J. Stewart for English editing this paper.
Conflicts of Interest
The authors declare no conflict of interest.
References
- Vörösmarty, C.J.; Meybeck, M.; Fekete, B.M.; Sharma, K.; Green, P.; Syvitski, J.P. Anthropogenic sediment retention: Major global impact from registered river impoundments. Glob. Planet. Chang. 2003, 39, 169–190. [Google Scholar] [CrossRef]
- Syvitski, J.P.; Vörösmarty, C.J.; Kettner, A.J.; Green, P. Impact of humans on the flux of terrestrial sediment to the global coastal ocean. Science 2005, 308, 376–380. [Google Scholar] [CrossRef] [PubMed]
- Walling, D. Human impact on land–ocean sediment transfer by the world’s rivers. Geomorphology 2006, 79, 192–216. [Google Scholar] [CrossRef]
- Walling, D.E.; Fang, D. Recent trends in the suspended sediment loads of the world’s rivers. Glob. Planet. Chang. 2003, 39, 111–126. [Google Scholar] [CrossRef]
- Khafagy, A.; Naffaa, M.; Fanos, A.; Dean, R. Nearshore Coastal Changes Along the Nile Delta Shores. In Coastal Engineering 1992; American Society of Civil Engineers (ASCE): Reston, VA, USA, 1993; pp. 3260–3272. [Google Scholar]
- Fanos, A.M. The impact of human activities on the erosion and accretion of the nile delta coast. J. Coast. Res. 1995, 11, 821–833. [Google Scholar]
- Carriquiry, J.; Sánchez, A. Sedimentation in the colorado river delta and upper gulf of california after nearly a century of discharge loss. Mar. Geol. 1999, 158, 125–145. [Google Scholar] [CrossRef]
- Mikhailova, M.V. Transformation of the ebro river delta under the impact of intense human-induced reduction of sediment runoff. Water Resour. 2003, 30, 370–378. [Google Scholar] [CrossRef]
- Yang, S.L.; Li, M.; Dai, S.B.; Liu, Z.; Zhang, J.; Ding, P.X. Drastic decrease in sediment supply from the yangtze river and its challenge to coastal wetland management. Geophys. Res. Lett. 2006, 33. [Google Scholar] [CrossRef]
- Wang, H.; Yang, Z.; Saito, Y.; Liu, J.P.; Sun, X.; Wang, Y. Stepwise decreases of the Huanghe (yellow river) sediment load (1950–2005): Impacts of climate change and human activities. Glob. Planet. Chang. 2007, 57, 331–354. [Google Scholar] [CrossRef]
- Moran, E.F.; Lopez, M.C.; Moore, N.; Müller, N.; Hyndman, D.W. Sustainable hydropower in the 21st century. Proc. Natl. Acad. Sci. USA 2018, 115, 11891–11898. [Google Scholar] [CrossRef] [Green Version]
- Kondolf, G.M.; Schmitt, R.J.; Carling, P.; Darby, S.; Arias, M.; Bizzi, S.; Castelletti, A.; Cochrane, T.A.; Gibson, S.; Kummu, M.; et al. Changing sediment budget of the Mekong: Cumulative threats and management strategies for a large river basin. Sci. Total. Environ. 2018, 625, 114–134. [Google Scholar] [CrossRef] [PubMed] [Green Version]
- Peng, J.; Chen, S.; Dong, P. Temporal variation of sediment load in the yellow river basin, China, and its impacts on the lower reaches and the river delta. Catena 2010, 83, 135–147. [Google Scholar] [CrossRef]
- Galipeau, B.A.; Ingman, M.; Tilt, B. Dam-induced displacement and agricultural livelihoods in China’s Mekong Basin. Hum. Ecol. 2013, 41, 437–446. [Google Scholar] [CrossRef]
- Rex, W.; Foster, V.; Lyon, K.; Bucknall, J.; Liden, R. Supporting Hydropower: An Overview of the World Bank Group’s Engagement; The World Bank: Washington, WA, USA, 2014. [Google Scholar]
- Adamson, P.T.; Rutherfurd, I.D.; Peel, M.C.; Conlan, I.A. The Hydrology of the Mekong River. In The Mekong Biophysical Environment of an International River Basin; Campbell, I.C., Ed.; Elsevier Inc.: Amsterdam, The Netherlands, 2009; pp. 53–76. [Google Scholar]
- Hecht, J.S.; Lacombe, G.; Arias, M.E.; Dang, T.D.; Piman, T. Hydropower dams of the Mekong River basin: A review of their hydrological impacts. J. Hydrol. 2019, 568, 285–300. [Google Scholar] [CrossRef]
- Mekong River Commission, MRC. Assessment of Basin-Wide Development Scenarios—Main Report. Mekong River Commission Vientiane; MRC: Phnom Penh, Cambodia, 2011. [Google Scholar]
- Schmitt, R.; Rubin, Z.; Kondolf, G. Losing ground-scenarios of land loss as consequence of shifting sediment budgets in the Mekong Delta. Geomorphology 2017, 294, 58–69. [Google Scholar] [CrossRef]
- Fu, K.; He, D.; Chen, W.; Ye, C.; Li, Y. Impacts of dam constructions on the annual distribution of sediment in Lancang-Mekong River Basin. Acta Geogr. Sin.-Chin. Ed. 2007, 62, 14. [Google Scholar]
- Milliman, J.D.; Syvitski, J.P. Geomorphic/tectonic control of sediment discharge to the ocean: The importance of small mountainous rivers. J. Geol. 1992, 100, 525–544. [Google Scholar] [CrossRef]
- Gupta, A.; Liew, S. The Mekong from satellite imagery: A quick look at a large river. Geomorphology 2007, 85, 259–274. [Google Scholar] [CrossRef]
- Walling, D.E. The changing sediment load of the Mekong River. AMBIO: J. Hum. Environ. 2008, 37, 150–157. [Google Scholar] [CrossRef]
- Stephens, J.; Allison, M.; di Leonardo, D.; Weathers, H., III; Ogston, A.; McLachlan, R.; Xing, F.; Meselhe, E. Sand dynamics in the Mekong River channel and export to the coastal ocean. Cont. Shelf Res. 2017, 147, 38–50. [Google Scholar] [CrossRef]
- Kummu, M.; Penny, D.; Sarkkula, J.; Koponen, J. Sediment: Curse or blessing for Tonle Sap Lake? Ambio: A J. Hum. Environ. 2008, 37, 158–163. [Google Scholar] [CrossRef]
- Lu, X.; Kummu, M.; Oeurng, C. Reappraisal of sediment dynamics in the lower Mekong River, Cambodia. Earth Surf. Process. Landforms 2014, 39, 1855–1865. [Google Scholar] [CrossRef]
- Sok, T.; Oeurng, C.; Kaing, V.; Sauvage, S.; Kondol, G.M.; Perez, J.M. Assessment of sediment load variabilities in the tonle sap and lower Mekong Rivers, Cambodia. Manuscript submitted for Publication. Authorea 2020. [Google Scholar] [CrossRef]
- Piman, T.; Shrestha, M. Case Study on Sediment in the Mekong River Basin: Current State and Future Trends; Stockholm Environment Institute: Stockholm, Sweden, 2017. [Google Scholar]
- Bouraoui, F.; Benabdallah, S.; Jrad, A.; Bidoglio, G. Application of the SWAT model on the Medjerda river basin (Tunisia). Phys. Chem. Earth Parts A/B/C 2005, 30, 497–507. [Google Scholar] [CrossRef]
- Arnold, J.G.; Srinivasan, R.; Muttiah, R.S.; Williams, J.R. Large area hydrologic modeling and assessment part I: Model development. JAWRA J. Am. Water Resour. Assoc. 1998, 34, 73–89. [Google Scholar] [CrossRef]
- Arnold, J.G.; Moriasi, D.N.; Gassman, P.W.; Abbaspour, K.C.; White, M.J.; Srinivasan, R.; Santhi, C.; Harmel, R.D.; van Griensven, A.; van Liew, M.W.; et al. SWAT: Model use, calibration, and validation. Trans. ASABE 2012, 55, 1491–1508. [Google Scholar] [CrossRef]
- Bieger, K.; Arnold, J.G.; Rathjens, H.; White, M.J.; Bosch, D.D.; Allen, P.M.; Volk, M.; Srinivasan, R. Introduction to SWAT+, A completely restructured version of the soil and water assessment tool. JAWRA J. Am. Water Resour. Assoc. 2016, 53, 115–130. [Google Scholar] [CrossRef]
- Tan, M.L.; Gassman, P.W.; Raghavan, S.; Arnold, J.G.; Yang, X. A Review of SWAT studies in southeast Asia: Applications, challenges and future directions. Water 2019, 11, 914. [Google Scholar] [CrossRef] [Green Version]
- Al-Soufi, R. Soil erosion and sediment transport in the Mekong basin. In Proceedings of the 2nd Asia Pacific Association of Hydrology and Water Resources Conference, Suntec International Convention and Exhibition Center, Singapore, 5–8 July 2004; pp. 47–56. [Google Scholar]
- Shrestha, B.; Cochrane, T.A.; Caruso, B.S.; Arias, M.E.; Piman, T. Uncertainty in flow and sediment projections due to future climate scenarios for the 3S Rivers in the Mekong Basin. J. Hydrol. 2016, 540, 1088–1104. [Google Scholar] [CrossRef]
- Mohammed, I.N.; Bolten, J.; Srinivasan, R.; Lakshmi, V. Satellite observations and modeling to understand the lower Mekong River Basin streamflow variability. J. Hydrol. 2018, 564, 559–573. [Google Scholar] [CrossRef]
- Trung, L.D.; Duc, N.A.; Nguyen, L.T.; Thai, T.H.; Khan, A.; Rautenstrauch, K.; Schmidt, C. Assessing cumulative impacts of the proposed lower Mekong Basin hydropower cascade on the Mekong River floodplains and Delta-Overview of integrated modeling methods and results. J. Hydrol. 2020, 581, 122511. [Google Scholar] [CrossRef]
- Ogston, A.; Allison, M.; McLachlan, R.; Nowacki, D.; Stephens, J.D. How tidal processes impact the transfer of sediment from source to sink: Mekong river collaborative studies. Oceanography 2017, 30, 22–33. [Google Scholar] [CrossRef] [Green Version]
- Kondolf, G.M.; Rubin, Z.K.; Minear, J.T. Dams on the Mekong: Cumulative sediment starvation. Water Resour. Res. 2014, 50, 5158–5169. [Google Scholar] [CrossRef]
- Yoshida, Y.; Lee, H.S.; Trung, B.H.; Tran, H.-D.; Lall, M.K.; Kakar, K.; Xuan, T.D. Impacts of mainstream hydropower dams on fisheries and agriculture in lower Mekong Basin. Sustainability 2020, 12, 2408. [Google Scholar] [CrossRef] [Green Version]
- Kummu, M.; Varis, O. Sediment-related impacts due to upstream reservoir trapping, the lower Mekong River. Geomorphology 2007, 85, 275–293. [Google Scholar] [CrossRef]
- Wang, J.-J.; Lu, X.X.; Kummu, M. Sediment load estimates and variations in the lower Mekong River. River Res. Appl. 2011, 27, 33–46. [Google Scholar] [CrossRef]
- Kongmeng, L.; Larsen, H. Lower Mekong Regional Water Quality Monitoring Report; Mekong River Commission: Vientiane, Lao, 2016. [Google Scholar]
- Runkel, R.L.; Crawford, C.G.; Cohn, T.A. Load Estimator (LOADEST): A FORTRAN Program for Estimating Constituent Loads in Streams and Rivers; USGS Colorado Water Science Center: Herndon, VA, USA, 2004. [Google Scholar]
- Koehnken, L. IKMP Discharge and Sediment Monitoring Program Review, Recommendations and Data Analysis. In Part 2: Data Analysis and Preliminary Results; MRC: Phnom Penh, Cambodia, 2012. [Google Scholar]
- Hung, N.N.; Delgado, J.M.; Tri, V.K.; Hung, L.M.; Merz, B.; Bárdossy, A.; Apel, H. Floodplain hydrology of the Mekong Delta, Vietnam. Hydrol. Process. 2011, 26, 674–686. [Google Scholar] [CrossRef] [Green Version]
- Yamazaki, D.; Ikeshima, D.; Tawatari, R.; Yamaguchi, T.; O’Loughlin, F.; Neal, J.C.; Sampson, C.C.; Kanae, S.; Bates, P.B. A high-accuracy map of global terrain elevations. Geophys. Res. Lett. 2017, 44, 5844–5853. [Google Scholar] [CrossRef] [Green Version]
- Lu, X.; Li, S.; Kummu, M.; Padawangi, R.; Wang, J. Observed changes in the water flow at Chiang Saen in the lower Mekong: Impacts of Chinese dams? Quat. Int. 2014, 336, 145–157. [Google Scholar] [CrossRef]
- Nash, J.E.; Sutcliffe, J.V. River Flow forecasting through conceptual models-Part I: A discussion of principles. J. Hydrol. 1970, 10, 282–290. [Google Scholar] [CrossRef]
- Benaman, J.; Shoemaker, C.A.; Haith, D.A. Calibration and validation of soil and water assessment tool on an agricultural watershed in Upstate New York. J. Hydrol. Eng. 2005, 10, 363–374. [Google Scholar] [CrossRef]
- Gupta, H.V.; Kling, H.; Yilmaz, K.K.; Martinez, G.F. Decomposition of the mean squared error and NSE performance criteria: Implications for improving hydrological modelling. J. Hydrol. 2009, 377, 80–91. [Google Scholar] [CrossRef] [Green Version]
- Moriasi, D.N.; Arnold, J.G.; Van Liew, M.W.; Bingner, R.L.; Harmel, R.D.; Veith, T.L. Model evaluation guidelines for systematic quantification of accuracy in watershed simulations. Trans. ASABE 2007, 50, 885–900. [Google Scholar] [CrossRef]
- Hydrologic and water quality models: Performance measures and evaluation criteria. Trans. ASABE 2015, 58, 1763–1785. [CrossRef] [Green Version]
- Shrestha, D.L.; Robertson, D.E.; Wang, Q.J.; Pagano, T.C.; Hapuarachchi, H.A.P. Evaluation of numerical weather prediction model precipitation forecasts for short-term streamflow forecasting purpose. Hydrol. Earth Syst. Sci. 2013, 17, 1913–1931. [Google Scholar] [CrossRef] [Green Version]
- Lauri, H.; de Moel, H.; Ward, P.J.; Räsänen, T.A.; Keskinen, M.; Kummu, M. Future changes in Mekong River hydrology: Impact of climate change and reservoir operation on discharge. Hydrol. Earth Syst. Sci. Discuss. 2012, 9, 6569–6614. [Google Scholar] [CrossRef]
- M.R.C. Overview of the Hydrology of the Mekong Basin. In Mekong River Commission, Vientiane; M.R.C: Vientiane, Lao, 2005. [Google Scholar]
- Tsukawaki, S. Sedimentation rates in the northern part of Lake Tonle Sap, Cambodia, during the last 6000 years. Sam. Res. AMS 1997, 8, 125–133. [Google Scholar]
- Milliman, J.D.; Meade, R.H. World-wide delivery of River Sediment to the oceans. J. Geol. 1983, 91, 1–21. [Google Scholar] [CrossRef]
- Nowacki, D.J.; Ogston, A.S.; Nittrouer, C.A.; Fricke, A.T.; Van, P.D.T. Sediment dynamics in the lower M ekong River: Transition from tidal river to estuary. J. Geophys. Res. Oceans 2015, 120, 6363–6383. [Google Scholar] [CrossRef] [Green Version]
- Jordan, C.; Tiede, J.; Lojek, O.; Visscher, J.; Apel, H.; Nguyen, H.Q.; Quang, C.N.X.; Schlurmann, T. Sand mining in the Mekong Delta revisited-current scales of local sediment deficits. Sci. Rep. 2019, 9, 1–14. [Google Scholar] [CrossRef]
- Manh, N.V.; Dung, N.V.; Hung, N.N.; Merz, B.; Apel, H. Large-scale suspended sediment transport and sediment deposition in the Mekong Delta. Hydrol. Earth Syst. Sci. 2014, 18, 3033–3053. [Google Scholar] [CrossRef] [Green Version]
- Ta, T.; Nguyen, V.; Tateishi, M.; Kobayashi, I.; Tanabe, S.; Saito, Y. Holocene delta evolution and sediment discharge of the Mekong River, southern Vietnam. Quat. Sci. Rev. 2002, 21, 1807–1819. [Google Scholar] [CrossRef]
- Liu, C.; He, Y.; Walling, E.D.; Wang, J. Changes in the sediment load of the Lancang-Mekong River over the period 1965–2003. Sci. China Technol. Sci. 2013, 56, 843–852. [Google Scholar] [CrossRef]
- Kummu, M.; Lu, X.X.; Wang, J.J.; Varis, O. Basin-wide sediment trapping efficiency of emerging reservoirs along the Mekong. Geomorphology 2010, 119, 181–197. [Google Scholar] [CrossRef]
- Fu, K.; He, D.; Lu, X.X. Sedimentation in the Manwan reservoir in the Upper Mekong and its downstream impacts. Quat. Int. 2008, 186, 91–99. [Google Scholar] [CrossRef]
- Liu, C.; Wang, Z.; Sui, J. Analysis on variation of seagoing water and sediment load in main rivers of China. J. Hydraul. Eng. 2007, 38, 1444–1452. [Google Scholar]
- Gupta, H.; Kao, S.-J.; Dai, M. The role of mega dams in reducing sediment fluxes: A case study of large Asian rivers. J. Hydrol. 2012, 464, 447–458. [Google Scholar] [CrossRef]
- Wild, T.B.; Loucks, D.P. Managing flow, sediment, and hydropower regimes in the Sre Pok, Se San, and Se Kong Rivers of the Mekong basin. Water Resour. Res. 2014, 50, 5141–5157. [Google Scholar] [CrossRef]
- Shrestha, B.; Babel, M.S.; Maskey, S.; van Griensven, A.; Uhlenbrook, S.; Green, A.; Akkharath, I. Impact of climate change on sediment yield in the Mekong River basin: A case study of the Nam Ou basin, Lao PDR. Hydrol. Earth Syst. Sci. 2013, 17, 1–20. [Google Scholar] [CrossRef] [Green Version]
- Ly, K.; Metternicht, G.; Marshall, L. Linking changes in land cover and land use of the lower Mekong Basin to instream nitrate and total suspended solids variations. Sustainability 2020, 12, 2992. [Google Scholar] [CrossRef] [Green Version]
- Kaura, M.; Arias, M.E.; Benjamin, J.A.; Oeurng, C.; Cochrane, T.A. Benefits of forest conservation on riverine sediment and hydropower in the Tonle Sap Basin, Cambodia. Ecosyst. Serv. 2019, 39, 101003. [Google Scholar] [CrossRef]
- Chea, R.; Grenouillet, G.; Lek, S. Evidence of water quality degradation in lower Mekong Basin revealed by self-organizing map. PLoS ONE 2016, 11, e0145527. [Google Scholar] [CrossRef] [PubMed] [Green Version]
- Fabre, C.; Sauvage, S.; Tananaev, N.; Noël, G.E.; Teisserenc, R.; Probst, J.-L.; Sánchez-Pérez, J.M. Assessment of sediment and organic carbon exports into the Arctic ocean: The case of the Yenisei River basin. Water Res. 2019, 158, 118–135. [Google Scholar] [CrossRef] [PubMed] [Green Version]
- Wittmann, H.; von Blanckenburg, F.; Maurice, L.; Guyot, J.-L.; Filizola, N.; Kubik, P.W. Sediment production and delivery in the Amazon River basin quantified by in situ-produced cosmogenic nuclides and recent river loads. GSA Bull. 2010, 123, 934–950. [Google Scholar] [CrossRef]
- Meade, R.H. River-Sediment Inputs to Major Deltas. In Coastal Systems and Continental Margins; Springer: Berlin/Heidelberg, Germany, 1996; pp. 63–85. [Google Scholar]
- Wei, X.; Sauvage, S.; Le, T.P.Q.; Ouillon, S.; Orange, D.; Herrman, M.; Sánchez-Pérez, J.-M. A drastic decrease of suspended sediment fluxes in the Red River related to climate variability and dam constructions. Catena 2020, 197. [Google Scholar] [CrossRef]
Figure 1.
Spatial Maps of the Mekong River Basin. (a) Study area: Mekong River Basin (including the Upper and Lower Mekong Basin) sharing of the basin area includes Southern part of China and major sub-basin identifications based on the gauge stations, (b) DEM, (c) Land use distribution, and (d) Soil type distribution.

Figure 2.
Observed and simulated monthly streamflow during the period 1985 to 2016 for Mekong River Basin during calibration and validation at China/Laos Border, Chiang Saen, Luang Prabang, Vientiane, Mukdahan, Pakse, Stung Treng, Kratie.
Figure 2.
Observed and simulated monthly streamflow during the period 1985 to 2016 for Mekong River Basin during calibration and validation at China/Laos Border, Chiang Saen, Luang Prabang, Vientiane, Mukdahan, Pakse, Stung Treng, Kratie.

Figure 3.
Average monthly observed and simulated streamflow (with standard deviations) for Mekong River Basin from the eight sub-basins: China/Laos Border, Chiang Saen, Luang Prabang, Vientiane, Mukdahan, Pakse, Stung Treng, Kratie.
Figure 3.
Average monthly observed and simulated streamflow (with standard deviations) for Mekong River Basin from the eight sub-basins: China/Laos Border, Chiang Saen, Luang Prabang, Vientiane, Mukdahan, Pakse, Stung Treng, Kratie.

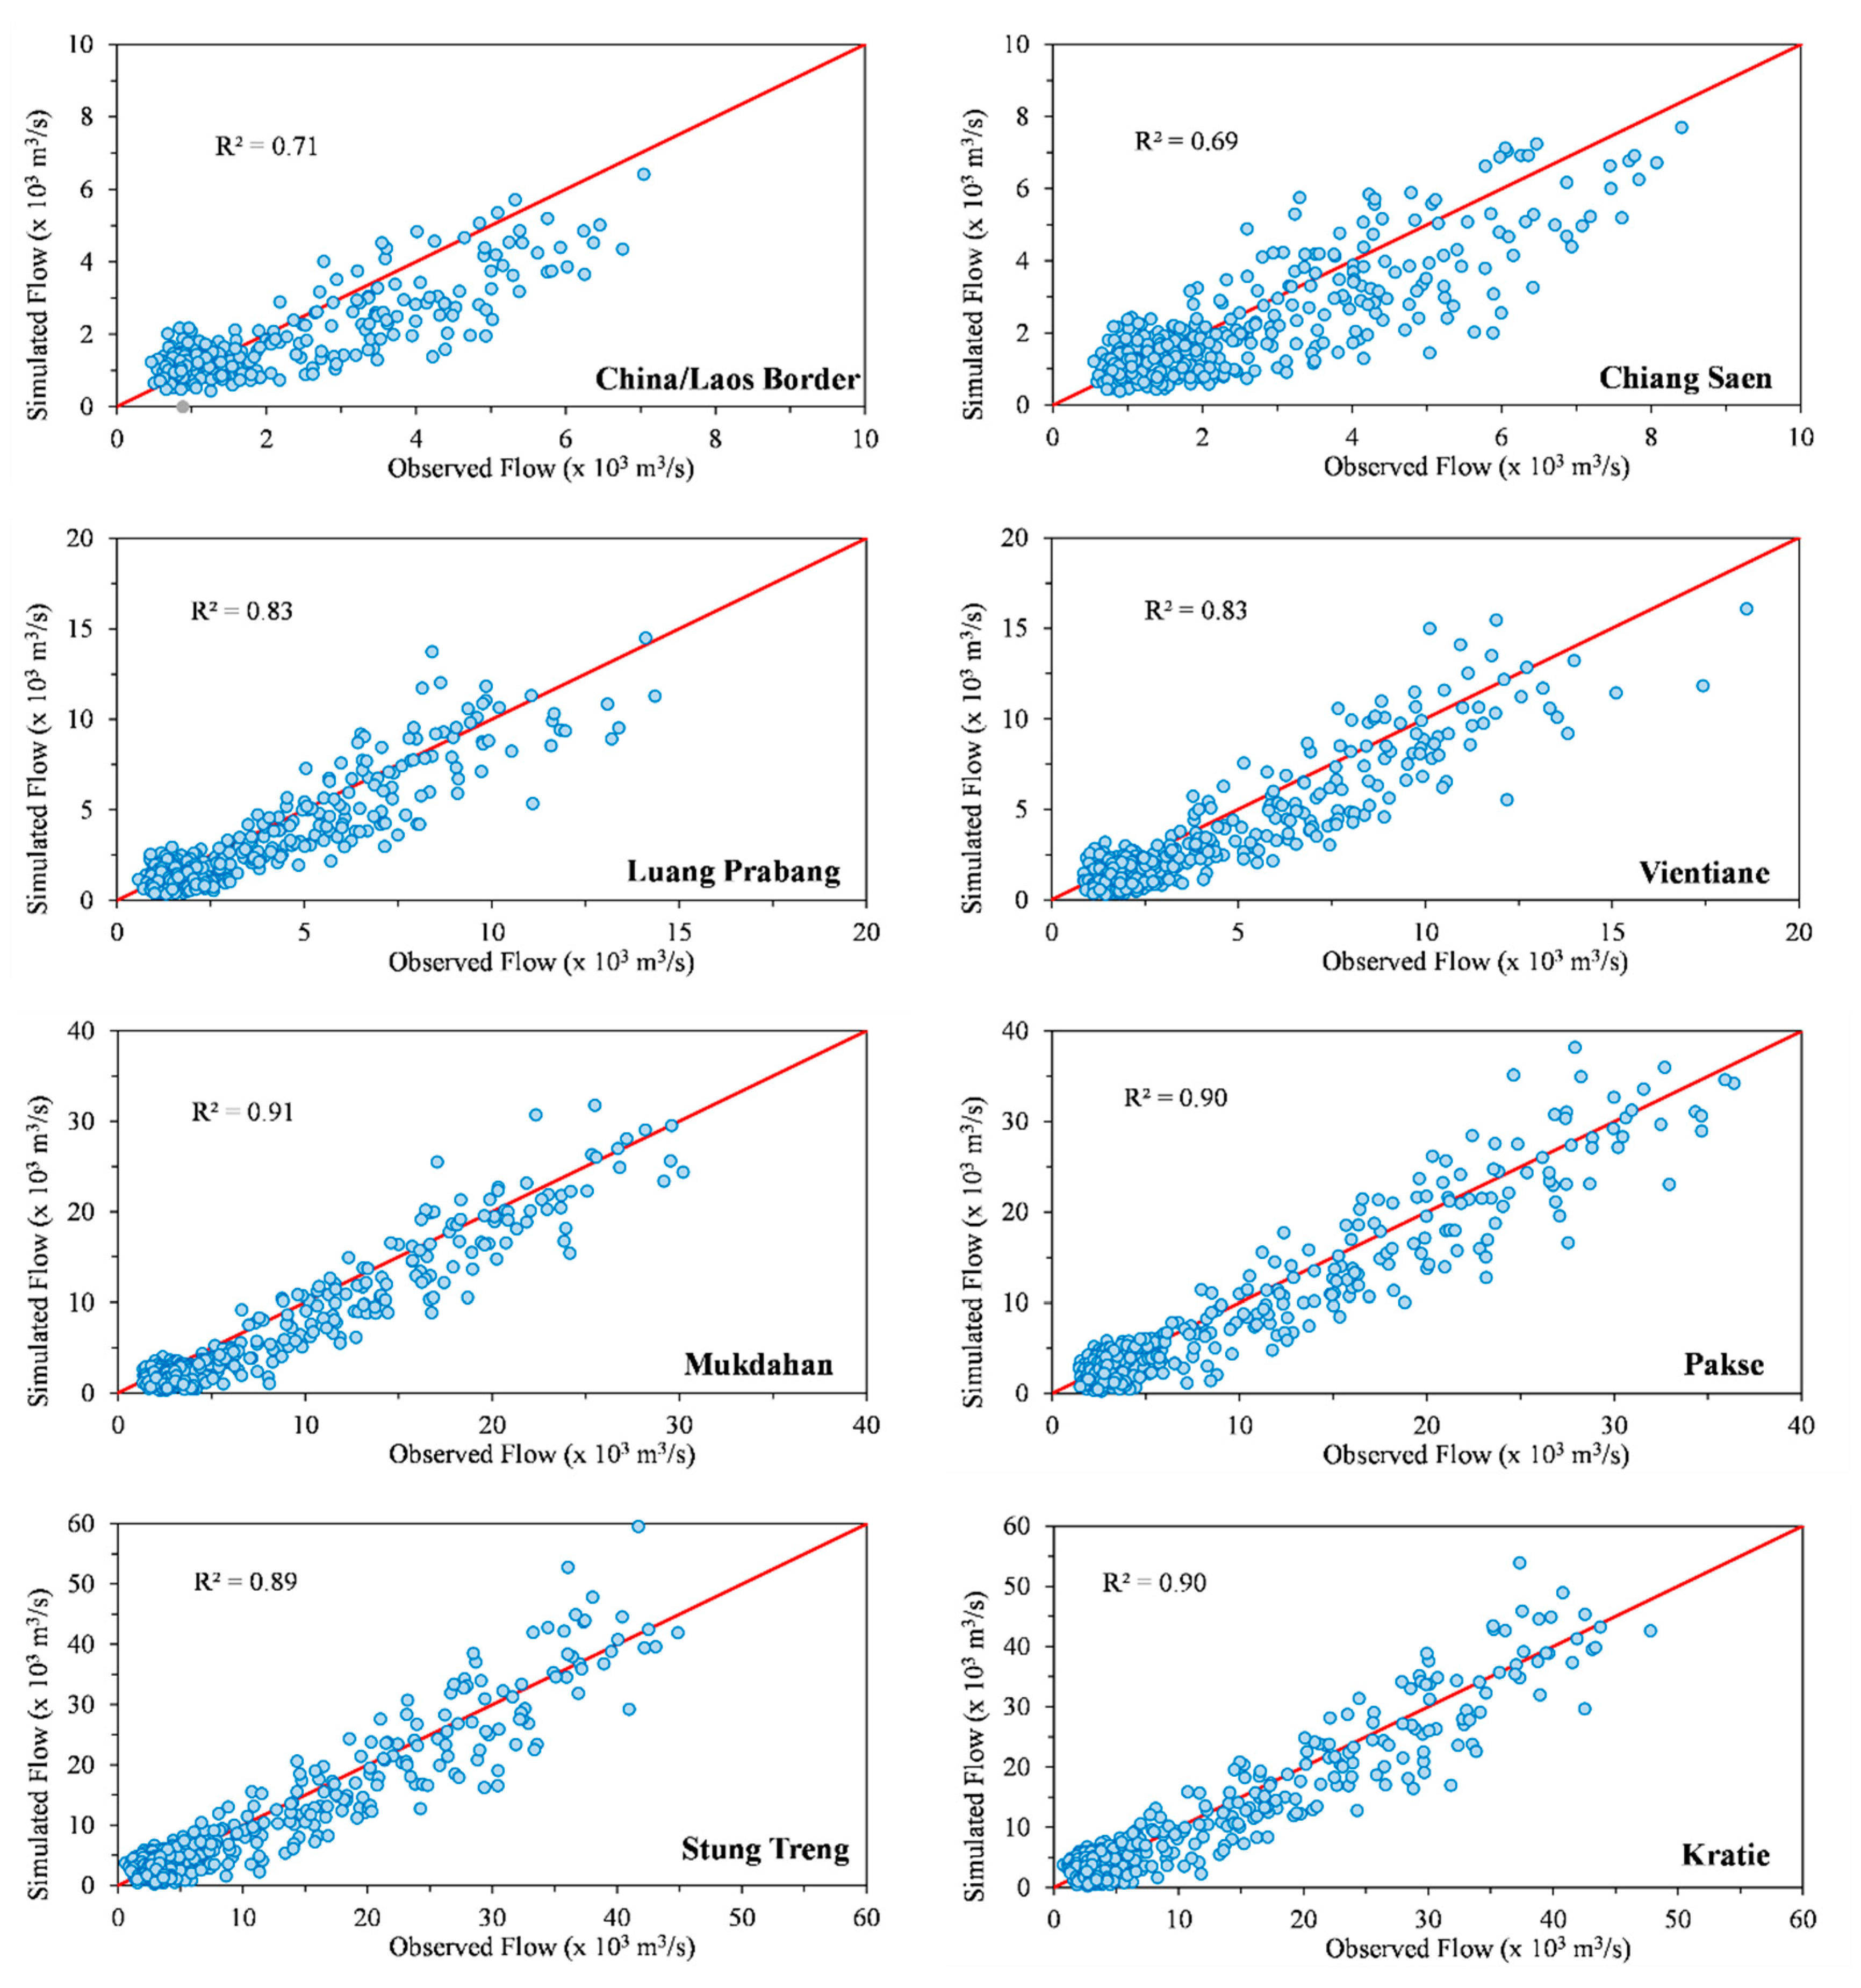
Figure 4.
Scatterplot of monthly observed and simulated discharge for eight-gauge stations along the main river from 1985–2016.
Figure 4.
Scatterplot of monthly observed and simulated discharge for eight-gauge stations along the main river from 1985–2016.

Figure 5.
Observed and simulated monthly sediment for Mekong River Basin during calibration and validation at Chiang Saen, Luang Prabang, Vientiane, Mukdahan, Pakse and Kratie.
Figure 5.
Observed and simulated monthly sediment for Mekong River Basin during calibration and validation at Chiang Saen, Luang Prabang, Vientiane, Mukdahan, Pakse and Kratie.

Figure 6.
Monthly average observed and simulated sediment load (with standard deviations) for Mekong River Basin from the six locations: Chiang Saen, Luang Prabang, Vientiane, Mukdahan, Pakse, Kratie.
Figure 6.
Monthly average observed and simulated sediment load (with standard deviations) for Mekong River Basin from the six locations: Chiang Saen, Luang Prabang, Vientiane, Mukdahan, Pakse, Kratie.

Figure 7.
Scatterplot of monthly observed and simulated sediment for six monitoring stations along the main river.
Figure 7.
Scatterplot of monthly observed and simulated sediment for six monitoring stations along the main river.

Figure 8.
Water balance components on the Mekong river basin and its sub-basin: Precipitation, Potential Evapotranspiration, Percolation, Lateral flow, Surface runoff, and water yield from 1985–2016.
Figure 8.
Water balance components on the Mekong river basin and its sub-basin: Precipitation, Potential Evapotranspiration, Percolation, Lateral flow, Surface runoff, and water yield from 1985–2016.

Figure 9.
Variations of the annual water discharge and annual sediment load from 1990–2016 along the Mekong River. Stations are Chiang Saen, Luang Prabang, Vientiane, Mukdahan, Pakse, and Kratie.
Figure 9.
Variations of the annual water discharge and annual sediment load from 1990–2016 along the Mekong River. Stations are Chiang Saen, Luang Prabang, Vientiane, Mukdahan, Pakse, and Kratie.

Figure 10.
Empirical relationship between monthly sediment load and monthly water discharge at six locations along the main river from 1985–2016.
Figure 10.
Empirical relationship between monthly sediment load and monthly water discharge at six locations along the main river from 1985–2016.

Figure 11.
Mean annual fluvial sediment load (SL, Mt/year) and annual sediment yield (SY, t/km2/year) for the Mekong river major sub-basins from 1985 to 2016.
Figure 11.
Mean annual fluvial sediment load (SL, Mt/year) and annual sediment yield (SY, t/km2/year) for the Mekong river major sub-basins from 1985 to 2016.

Figure 12.
Distribution of mean annual sediment yields (t/km2/year) in the Mekong River Basin for the simulation period 1995–2016, divided by main land use types, slope classes and basin sizes.
Figure 12.
Distribution of mean annual sediment yields (t/km2/year) in the Mekong River Basin for the simulation period 1995–2016, divided by main land use types, slope classes and basin sizes.

Figure 13.
The annual mean of sediment yield of Mekong River with other major rivers in Asia and continents. Note: The value from [23,58,73,74,75,76].


Table 1.
Recorded streamflow and sediment used in this study. Data from MRC.
| Name of Station | Basin Coverage | Streamflow Record Used | Sediment Record Used | |||
|---|---|---|---|---|---|---|
| (km2) | (%) of Total Basin | Period | Timestep of Measurement | Period | Timestep of Measurement | |
| China/Laos Border | 164,226 | 18% | 1985–2007 | Daily | Monthly | |
| Chiang Saen | 199,008 | 21% | 1985–2016 | 1995–2011 | ||
| Luang Prabang | 288,380 | 31% | 1985–2016 | 1995–2011 | ||
| Vientiane | 323,027 | 34% | 1985–2016 | 1995–2011 | ||
| Mukdahan | 429,210 | 46% | 1985–2016 | 2001–2011 | ||
| Pakse | 621,404 | 66% | 1985–2016 | 1995–2011 | ||
| Stung Treng | 728,828 | 78% | 1985–2016 | |||
| Kratie | 747,958 | 80% | 1985–2016 | 1995–2016 | ||
Table 2.
Data input and sources in the SWAT model in the study.
| Data Type | Description | Spatial Resolution | Temporal Resolution | Data Sources |
|---|---|---|---|---|
| Topography map | DEM | 90 m | MERIT DEM: Multi-Error-Removed Improved-Terrain DEM http://hydro.iis.u-tokyo.ac.jp/~yamadai/MERIT_DEM/ | |
| Land use map | Land use classification | 250 m × 250 m | 2002 | Global Land Cover Characterization (GLCC): https://www.usgs.gov/ |
| Soil Map | Soil types | 250 m × 250 m | 2002 | Global Soil data: http://www.fao.org/ |
| Meteorological data | Gridded daily rainfall | 1° | Daily, 1982–2016 | Global Precipitation Climatology Centre: https://gcmd.nasa.gov/ |
| Meteorological data | Temperature | 0.25° | Daily, 1982–2016 | NASA Earth Exchange (NEX) https://www.nasa.gov/nex |
| Hydrological data | Observed streamflow | 8 stations | Daily, 1980–2016 1 | MoWRAM and MRC |
| Sediment data | Observed TSS | 6 stations | Monthly, 1980–2016 1 | MoWRAM and MRC |
1 Data used to depend on data available to this study for each station.
Table 3.
Calibrated values of SWAT parameters.
| Parameter | Name | Input File | Literature Range | Calibrated Value |
|---|---|---|---|---|
| Hydrology: | ||||
| ALPHA_BF | Baseflow alpha factor (days) | .gw | 0–1 | 0.005 |
| CANMX | Maximum canopy storage (mm H2O) | .hru | 0–100 | 100 |
| CN2 | Curve number | .mgt | 35–98 | 35–70 |
| ESCO | Soil evaporation compensation factor | .bsn | 0–1 | 0.35 |
| GW_DELAY | Groundwater delay (days) | .gw | 0–500 | 31 |
| GW_REVAP | Groundwater “revap” coefficient | .gw | 0.02–0.20 | 0.05 |
| REVAPMN | Threshold depth of water in the shallow aquifer for “revap” to occur (mm) | .gw | 0–500 | 150 |
| SOL_AWC | Available water capacity of the soil layer (mm H2O/mm soil) | .sol | 0–1 | 0.20–0.40 |
| SOL_K | Depth soil surface to bottom of layer (mm/hour) | .sol | 0–2000 | 50; 90; 100 |
| SOL_Z | Saturated hydraulic conductivity (mm/hour) | .sol | 0–3500 | 495 |
| Sediment: | ||||
| PRF_BSN | Peak rate adjustment factor for sediment routing | .bsn | 0–10 | 0.80 |
| USLE_K | USLE equation soil erodibility factor | .sol | 0–0.65 | 0.20–0.60 |
| SPCON | Linear factor for channel sediment routing | .bsn | 0.0001–0.01 | 0.0025 |
| SPX | Exponential factor for channel sediment routing | .bsn | 1–2 | 1.15 |
Table 4.
Monthly flow calibration and validation at eight-gauge stations along the Mekong mainstream.
Table 4.
Monthly flow calibration and validation at eight-gauge stations along the Mekong mainstream.
| Name of Station | Calibration | Validation | ||||
|---|---|---|---|---|---|---|
| Period | Performance Indicators | Period | Performance Indicators | |||
| NSE | R2 | NSE | R2 | |||
| China/Laos Border | 1985–1994 | 0.64 | 0.66 | 1995–2007 | 0.65 | 0.75 |
| Chiang Saen | 1985–1999 | 0.63 | 0.65 | 2000–2016 | 0.67 | 0.72 |
| Luang Prabang | 1985–1999 | 0.80 | 0.83 | 2000–2016 | 0.80 | 0.85 |
| Vientiane | 1985–1999 | 0.79 | 0.84 | 2000–2016 | 0.80 | 0.85 |
| Mukdahan | 1985–1999 | 0.89 | 0.91 | 2000–2016 | 0.87 | 0.92 |
| Pakse | 1985–1999 | 0.88 | 0.89 | 2000–2016 | 0.90 | 0.92 |
| Stung Treng | 1985–1999 | 0.88 | 0.89 | 2000–2016 | 0.90 | 0.92 |
| Kratie | 1985–1999 | 0.88 | 0.89 | 2000–2016 | 0.90 | 0.92 |
Table 5.
Mean monthly sediment load calibration and validation of the SWAT model in Mekong River Basin.
Table 5.
Mean monthly sediment load calibration and validation of the SWAT model in Mekong River Basin.
| Name of Station | Calibration | Validation | ||||
|---|---|---|---|---|---|---|
| Period | Performance Indicators | Period | Performance Indicators | |||
| NSE | R2 | NSE | R2 | |||
| Chiang Saen | 1997–2003 | 0.30 | 0.60 | 2004–2011 | 0.69 | 0.74 |
| Luang Prabang | 1998–2003 | 0.46 | 0.74 | 2004–2011 | 0.57 | 0.7 |
| Vientiane | 1995–2003 | 0.55 | 0.79 | 2004–2011 | 0.71 | 0.78 |
| Mukdahan | 2001–2003 | 0.82 | 0.89 | 2004–2011 | 0.66 | 0.82 |
| Pakse | 1995–2004 | 0.72 | 0.80 | 2005–2011 | 0.58 | 0.77 |
| Kratie | 1995–2004 | 0.77 | 0.80 | 2005–2016 | 0.30 | 0.86 |
Table 6.
Water balance components in mm/year (Potential Evapotranspiration, Actual Evapotranspiration, Percolation, and Water Yield) of the Mekong river basin for each sub-basin from 1985–2016.
Table 6.
Water balance components in mm/year (Potential Evapotranspiration, Actual Evapotranspiration, Percolation, and Water Yield) of the Mekong river basin for each sub-basin from 1985–2016.
| Area | Gauge Name | Precipitation | PET | ET | PERC | Total Water Yield | |
|---|---|---|---|---|---|---|---|
| Range | Average | ||||||
| mm Per Year | |||||||
| 1 | Upstream to China/Laos Border | 462–1805 | 954 | 890 | 604 | 229 | 325 |
| 2 | China/Laos Border to Chiang Sean | 1256–1632 | 1435 | 1404 | 1073 | 185 | 311 |
| 3 | Chiang Sean to Luang Prabang | 1380–2082 | 1559 | 1439 | 1121 | 166 | 385 |
| 4 | Luang Prabang to Vientiane | 1274–2281 | 1517 | 1527 | 1110 | 194 | 348 |
| 5 | Vientiane to Mukdahan | 1482–3189 | 2265 | 1549 | 1179 | 231 | 1024 |
| 6 | Mukdahan to Pakse | 1148–1930 | 1523 | 1650 | 1034 | 284 | 424 |
| 7 | Pakse to Stung Streng | 1676–2420 | 1925 | 1625 | 1116 | 296 | 736 |
| 8 | Stung Streng to Kratie | 1386–1744 | 1624 | 1751 | 1039 | 322 | 507 |
Note: PET: Potential Evapotranspiration, ET: Actual Evapotranspiration, PERC: Percolation.
Table 7.
Contribution of surface runoff, lateral flow, and groundwater to the streamflow (total water yield) in mm/year in the Mekong River at eight stations from 1985–2016.
Table 7.
Contribution of surface runoff, lateral flow, and groundwater to the streamflow (total water yield) in mm/year in the Mekong River at eight stations from 1985–2016.
| Area | Gauge Name | Surface Runoff | Lateral Flow | Ground Water Flow | Total Water Yield | |||
|---|---|---|---|---|---|---|---|---|
| (mm/year) | % | (mm/year) | % | (mm/year) | % | (mm/year) | ||
| 1 | Upstream to China/Laos Border | 16 | 5% | 112 | 34% | 197 | 61% | 325 |
| 2 | China/Laos Border to Chiang Sean | 45 | 14% | 139 | 45% | 127 | 41% | 311 |
| 3 | Chiang Sean to Luang Prabang | 99 | 26% | 179 | 46% | 107 | 28% | 385 |
| 4 | Luang Prabang to Vientiane | 120 | 34% | 100 | 29% | 128 | 37% | 348 |
| 5 | Vientiane to Mukdahan | 706 | 69% | 156 | 15% | 162 | 16% | 1024 |
| 6 | Mukdahan to Pakse | 184 | 43% | 33 | 8% | 207 | 49% | 424 |
| 7 | Pakse to Stung Streng | 216 | 29% | 304 | 41% | 216 | 29% | 736 |
| 8 | Stung Streng to Kratie | 248 | 49% | 24 | 5% | 235 | 46% | 507 |
Table 8.
Mekong River Sediment Yields by major sub-basins in the study from 1990–2016.
| Area | Description of Sub-Basin General Characteristic | Average Annual Sediment Yield (t/km2/year) | Average Annual Sediment Load in Main Mekong River (Mt/year) |
|---|---|---|---|
| China/Laos Border to Chiang Saen | In upper Mekong part in China. Covered by the forest type (evergreen and mixed forest) and range grasses (more than 80% of the total area. High topography and steep slope. | 340 | 20 ± 7 |
| Chiang Saen to Luang Prabang | The northern part of Laos. Mixed land use (forest and grasses more than 50% and agriculture type 25%). High topography and steep slope | 1295 | 35 ± 14 |
| Luang Prabang to Vientiane | Mixed land use between grasses type (more than 50%) and agriculture (30%). Steep (40%) and medium slope (60%) | 49 | 22 ± 8 |
| Vientiane to Mukdahan | In the central of Laos. Dominated by agriculture type (more than 80%) and grasses type (20%). Gentle slope (more than 50%) and medium slope (20%) and some steep hill at the north and far-right bank | 218 | 44 ± 14 |
| Mukdahan to Pakse | The area cover is in Thailand. It is dominated by agriculture type (70%) and some grass type. Gentle slope (70%) and some medium slope. | 78 | 54 ± 17 |
| Pakse to Kratie | In central highland of Vietnam and some part in Cambodia. Covered by forest type (evergreen forest, 60%) and some agricultural type. The gentle slope in Laos and Cambodia and some high slope in the far-right bank in Central of Vietnam. | 138 | 75 ± 21 |
Publisher’s Note: MDPI stays neutral with regard to jurisdictional claims in published maps and institutional affiliations. |
© 2020 by the authors. Licensee MDPI, Basel, Switzerland. This article is an open access article distributed under the terms and conditions of the Creative Commons Attribution (CC BY) license (http://creativecommons.org/licenses/by/4.0/).
Share and Cite
MDPI and ACS Style
Sok, T.; Oeurng, C.; Ich, I.; Sauvage, S.; Miguel Sánchez-Pérez, J. Assessment of Hydrology and Sediment Yield in the Mekong River Basin Using SWAT Model. Water 2020, 12, 3503. https://doi.org/10.3390/w12123503
AMA Style
Sok T, Oeurng C, Ich I, Sauvage S, Miguel Sánchez-Pérez J. Assessment of Hydrology and Sediment Yield in the Mekong River Basin Using SWAT Model. Water. 2020; 12(12):3503. https://doi.org/10.3390/w12123503
Chicago/Turabian StyleSok, Ty, Chantha Oeurng, Ilan Ich, Sabine Sauvage, and José Miguel Sánchez-Pérez. 2020. "Assessment of Hydrology and Sediment Yield in the Mekong River Basin Using SWAT Model" Water 12, no. 12: 3503. https://doi.org/10.3390/w12123503
Note that from the first issue of 2016, this journal uses article numbers instead of page numbers. See further details here.