Using Soil Water Stable Isotopes to Investigate Soil Water Movement in a Water Conservation Forest in Hani Terrace


1
College of Ecology and Environment, Southwest Forestry University, Kunming 650224, China
2
State Key Laboratory of Cryospheric Sciences, Cold and Arid Regions Environmental and Engineering Research Institute, Chinese Academy of Sciences, Lanzhou 730000, China
*
Author to whom correspondence should be addressed.
Water 2020, 12(12), 3520; https://doi.org/10.3390/w12123520
Submission received: 19 November 2020
/
Revised: 10 December 2020
/
Accepted: 11 December 2020
/
Published: 15 December 2020
(This article belongs to the Section Hydrology)
Abstract
:Water conservation forests significantly contribute to the stability of mountain agricultural ecosystems in Hani Terrace. In this study, we analyzed the relationship between the stable isotopic composition of soil water and precipitation to determine the mechanisms of soil water movement in the small watershed of Quanfuzhuang. We observed significant seasonal variations in soil water sources: antecedent precipitation was the dominant supply during the dry season, and current precipitation dominated during the rainy season. The recharge ratio of precipitation to soil water in the grassland was significantly higher than that in the arbor land and shrubland. The influence of water infiltration, old and new soil water mixing, and soil evaporation on the soil water stable isotopes gradually decreased from the surface (0–20 cm) to the deep (60–80 cm) soil. We observed significant seasonal variability in average soil water δ18O in the upper 0–60 cm and lower variability at 60–100 cm. The average soil water δ18O was generally higher in the dry season than in the rainy season. The mixing of old and new water is a continuous and cumulative process that is impacted by soil structure, soil texture, and precipitation events. We therefore identified a significant time delay in soil water supply with increasing soil depth. Moreover, the piston flow of soil water co-occurred with preferential flow, and the latter was the dominant supply during the rainy season.
1. Introduction
Water resource shortages are a worldwide concern. Soil water is a dominant water resource and is intrinsically linked to atmospheric precipitation, surface water, groundwater, biogeochemical cycles, and the water cycle [1]. The study of soil water movement is important for assessing soil water supplies, water redistribution mechanisms, soil nutrient and pollution transport processes, and areal water resource potential [2,3,4,5]. Hydrogen and oxygen stable isotopes, as elements of H2O, can accurately reflect water movement in soil. Isotopic measurements can identify the soil water source, infiltration, evaporation, and other water movement processes to infer the dynamic changes, movement features, and supply mechanisms of soil water. As a result, stable isotopes can be applied to assess basin-scale water cycles [6,7,8]. In recent years, many studies have assessed soil water movement processes using stable isotope techniques. For example, Lee et al. [9] found that the index piston flow model, which incorporated the deuterium excess (d) of rainfall and soil water, could accurately simulate water retention time. Using the stable isotope tracer method, Brinkmann et al. [10] found that the retention time of rainfall in soil ranged from days to months and increased with soil depth. Mueller et al. [7] also applied stable isotopes to trace the soil water movement pathways in the slope zone. According to the component features of soil water stable isotopes, Gazis et al. [11] found that rainfall infiltrated the soil surface by piston flow, while the water in deeper soil was renewed by long-term continuous snowmelt or heavy rainfall. Tian et al. [12] analyzed stable isotopes of rainfall and soil water in the central region of the Qinghai–Tibet Plateau and assessed their relationships with water movement at different depths in the soil profile. Based on the stable isotopic features of three typical vegetation types in the Taihang Mountains, Hou et al. [13] found that the temporal variations and vertical distributions of soil water stable isotopes reflected the tradeoff between rainfall infiltration and evaporation. Cheng et al. [14] found that artificial grass glades with high water consumption did not create priority flows due to the formation of a soil dry layer from a negative water balance. However, rainfall easily infiltrated farmland and wild grass via priority flow, which supplied water to the deep soil and/or groundwater. Ma et al. [15] detected soil water priority flow in forests, grasslands, and farmlands by analyzing the soil water δ2H of aeration zones in different land use types. Ji et al. [16] found that low rainfall supplied water in farmlands and grasslands, while summer and autumn rainstorms supplied landscapes dominated by Salix and Populus. Many studies have assessed soil water hydrogen and oxygen stable isotopic characteristics to determine the vertical movements of soil water and the rainfall infiltration processes in different areas; however, few studies to date have investigated the soil water movement mechanisms in the water source regions of Hani Terrace.
Hani Terrace is a typical mountain farming ecosystem. The region is known for its water flow in irrigated areas, which remains consistent throughout the year. However, Yunnan Province experienced a severe one-hundred-year drought event in 2010. The ecosystem’s landscape structure consists of four elements: forests, villages, terraces, and rivers [17]; as a result, forests significantly regulate the hydrological cycle in Hani Terrace. Studying the conservative water content of forests and identifying and adjusting the areal structures of forests, villages, and croplands can help to balance terrace conservation and regional sustainable development [18]. It is therefore crucial to identify the soil water movement characteristics of the headwater forest to evaluate rainfall infiltration processes and soil water source stability. In this study, we investigated the water migration in arbor land, shrubland, and grassland located above the small Quanfuzhuang watershed. We analyzed the soil water, underground water, and rainfall stable isotopes in the three land types over one year to determine the dynamic movements and stable isotopic composition of soil water. Our results elucidate the soil water movement processes and their spatiotemporal variations in the headwater forests. We also provide suggestions for future quantitative research on water cycle processes to improve the sustainable development of forest–terrace ecosystems in Hani Terrace.
2. Materials and Methods
2.1. Study Site
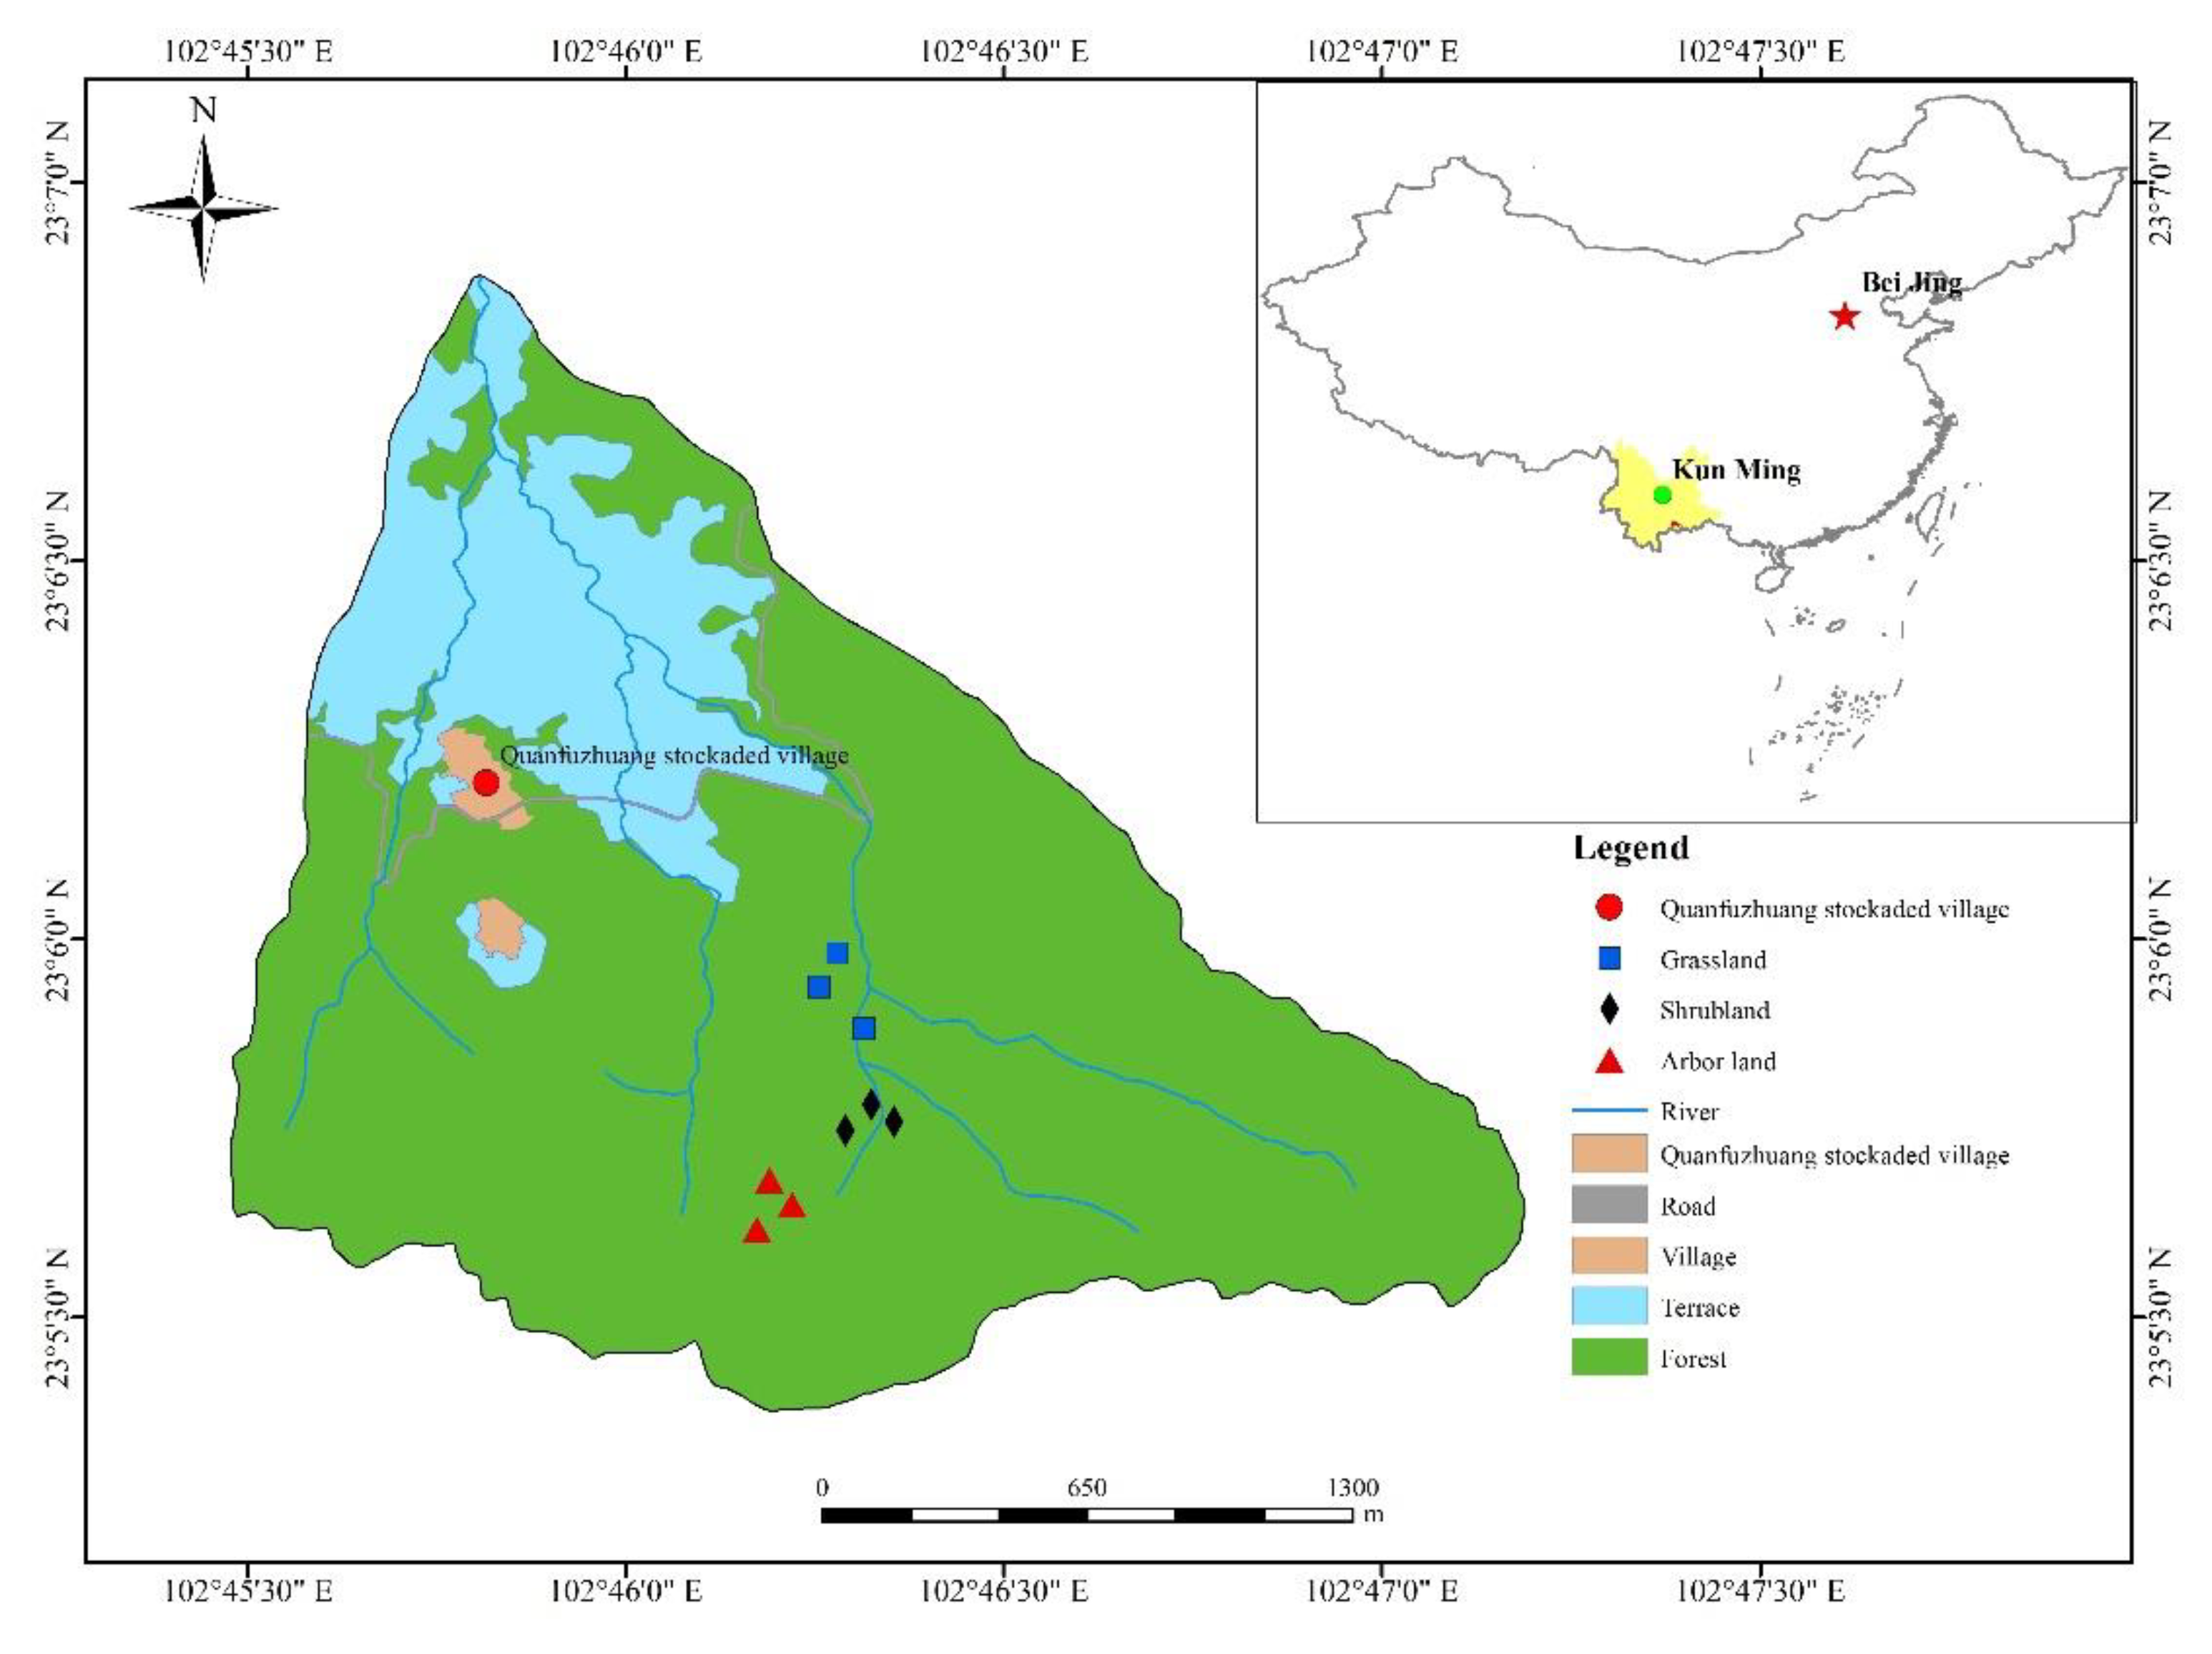
The small Quanfuzhuang watershed (102°45′–102°53′ E, 23°03′–23°10′ N) is located in the Bada district (Yuanyang County) in Honghe State, Yunnan Province. Hani Terrace, located in the Bada district, is classified as a World Cultural Heritage site. The Bada district is the upstream water source region of the Malizhai River—a first-level tributary of the Honghe River. The watershed has an area of approximately 13.92 km2, and its altitude ranges between 1500 and 2000 m. The watershed consists of moderate- to low-level mountains with a hilly topography and an obvious three-dimensional climate. The area above 1800 m primarily consists of forests and experiences northern subtropical and temperate climate; the region is also dominated by yellow and yellow–brown soils covered by evergreen broad-leaf moss forests (mist forest; mainly Alnus cremastogyne and Camellia pitardii), with grasslands occurring in damaged areas. The area below 1800 m has a central or southern subtropical climate and is mainly dominated by terraced fields. The region mainly consists of yellow and paddy soils, and the vegetation predominantly comprises evergreen broad-leaved forest or coniferous forest (mainly Cyclobalanopsis glauca or Schima superba); secondary forests and plantations also occur in damaged zones [19,20]. The multi-year average temperature and precipitation is 20.5 °C and 1397.6 mm, respectively. The region experiences notable seasonal rainfall variability, with the rainy season occurring from May to October (maximum rainfall from July to August). The annual evaporation is 1184.1 mm, and the annual average sunshine hours is 1820.8 h [21]. The study site is located in the water conservation forest above the terraced region in the small Quanfuzhuang watershed. The forest has a water source conservation of 77 hm2 and an altitude range of 1720–2073 m.
2.2. Research Site and Standard Plots
We established a gauging station and recorded the site type and land use characteristics (arbor land, shrubland, and grassland) in the watershed; three standard runoff communities were also laid out (specification: 5 × 20 m). Three standard plots with areas of 100 m2 were established in the watershed (Figure 1 and Table 1).
2.3. Sample Collection and Stable Isotope Determination
2.3.1. Sample Collection
Soil samples from 0 to 100 cm depth in the standard plots and samples of precipitation, surface water, and groundwater near the plots were collected every month from March 2019 to February 2020.
For rainwater samples, a polyethylene bottle was placed in a rainwater collection device located in an open area of the woodland, and a funnel was added to the mouth of the bottle. A table tennis ball was then placed at the mouth of the funnel to prevent the water from evaporating. Water samples were collected immediately after each rainfall event. If rainfall occurred during the evening, samples were collected on the following morning. Groundwater samples were collected at the dew point in a spring of constant flowing water once a month. The water samples were placed in a 50 mL centrifugal tube and immediately sealed with Parafilm. The samples were then stored in a cryopreservation box for transport to the laboratory for frozen storage. A total of 99 precipitation samples and 13 groundwater samples were collected during the study period.
Three quadrats were randomly placed in the three typical plots (arbor land, shrubland, and grassland) in the study area. A soil drill was used to sample the soil once a month at 0–10, 10–20, 20–40, 40–60, 60–80, and 80–100 cm depth; the average depth of each soil layer was used as the standard depth during the analysis: i.e., 5, 15, 30, 50, 70, and 90 cm. The soil samples were placed in a centrifuge tube and immediately sealed with Parafilm. The samples were then stored in a cryopreservation box and transported to the laboratory for refrigeration storage (1–4 °C). A total of 648 soil samples (216 soil samples from each woodland type) were collected. The final soil water isotope values of each forest type were determined as the average of three quadrats during the analysis, resulting in 72 soil samples for each forest type.
2.3.2. Stable Isotope Determination
We used a vacuum-distilled extraction apparatus to extract soil water from the soil samples [22].
All samples were analyzed for hydrogen and oxygen isotopes using a liquid water isotope analyzer (model: DLT-100, Los Gatos Research, Mountain View, CA, USA) and off-axis integrated cavity output spectroscopy (OA-ICOS) at the State Key Laboratory of Cryospheric Science, Northwest Institute of Eco-Environment and Resources, Chinese Academy of Sciences. The hydrogen and oxygen measurements were a thousand points lower than the Vienna Standard Mean Ocean Water (VSMOW):
where Rsample is the natural abundance ratio of hydrogen or oxygen isotopes in the tested sample (‰), and RV-SMOW is the natural abundance ratio of stable oxygen or hydrogen isotopes in VSMOW (‰). The analytical accuracies of the δ2H and δ18O measurements were ±1‰ and ±0.2‰, respectively.
2.4. Soil Water and Meteorological Data Acquisition
In each standard runoff plot, 1 m deep drivepipes were buried in three slope positions (uphill, mid-slope, and downslope), and a high-precision soil moisture content analyzer (model: ML2X, DELTA-T, Cambridge, Massachusetts, England) was used to observe the soil volumetric water content at different depths (10, 20, 30, 40, 60, and 100 cm). The observation period ranged from March 2019 to February 2020, and the observation frequency was three times a month (at 10 day intervals) and twice a day (at 08:00 and 17:00). In this study, soil water content refers to the soil volumetric water content (θ), and meteorological data—such as rainfall (P) and temperature (Ta)—at the research site were provided by the Xinjie Weather Station in Yuanyang County.
2.5. Data Processing
The soil water storage capacity can reflect the water condition within a period and within a certain soil depth in the studied district. Using the observational data of soil volumetric water content, the soil water storage content of different land use types can be calculated hierarchically using the following formula:
where W is the soil moisture content (mm), h is the thickness of the soil layer (cm), and θi is the volumetric water content of the i-th soil layer (%).
In this study, the average stable isotope value of precipitation was calculated by weighting the rainfall in the corresponding periods. The average value of all other elements refers to the arithmetic average of the elements during each period. The weighted average precipitation isotope values (δw) were calculated as follows:
where Pi and δi are the precipitation and isotope values of each precipitation event, respectively.
The linear relationship between δ2H and δ18O of precipitation is called the meteoric water line (MWL), which is highly useful in the study of water cycle stable isotope variability [23]. The lc-excess (the difference between the value of δ2H and the location of the MWL (LMWL)) of a particular water body represents the degree of evaporation relative to local precipitation [24,25,26] and is expressed by the following:
where a and b are the slope and intercept of LMWL, and δ2H and δ18O are the stable isotope values of the water sample. Generally, the variation of lc-excess in local precipitation is mainly affected by different water vapor sources, and the annual average value is 0. The average lc-excess is usually below 0 if the stable isotopes of the water body is enriched by evaporation. However, lc-excess is positive if the water sample is affected by non-precipitation water sources [27,28].
lc-excess = δ2H − a × δ18O − b,
The data analysis was performed using Microsoft Excel 2016, and the significance analysis was performed using IBM SPSS Statistics 26.0. All charts were formed using Microsoft Excel 2016 and OriginPro 2019.
3. Results
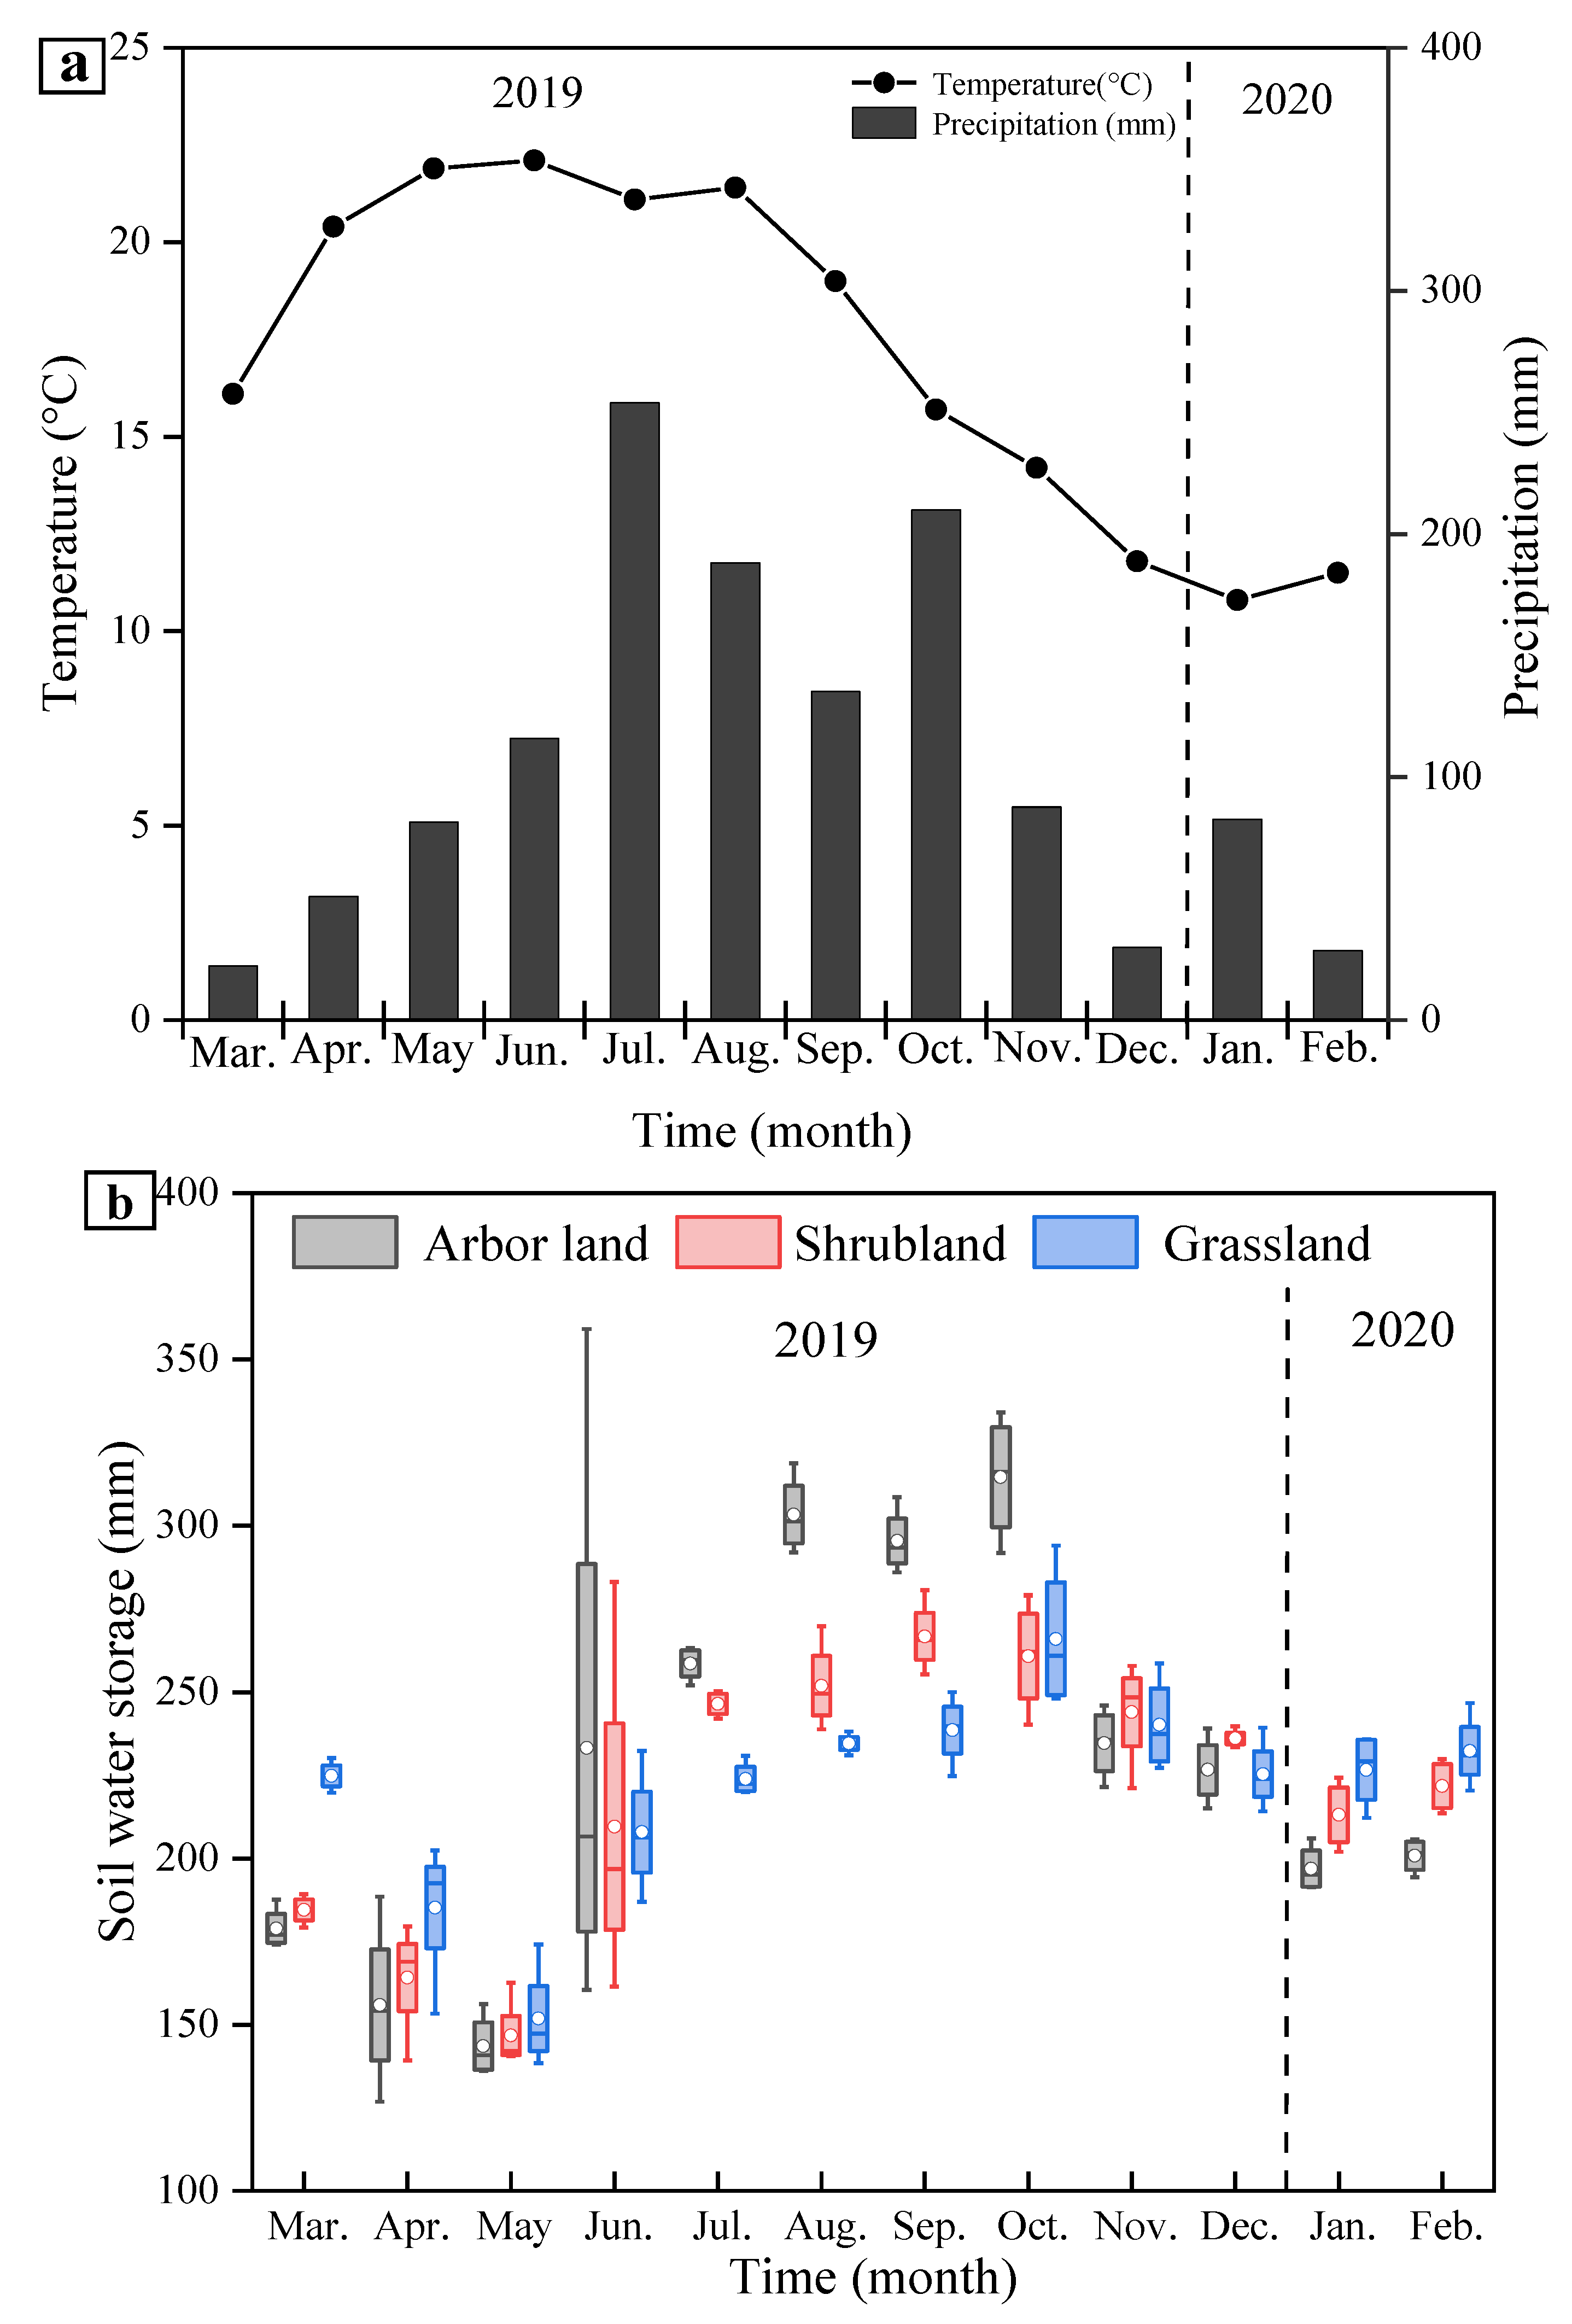
3.1. Dynamic Changes in Soil Moisture
Changes in soil moisture are mainly affected by rainfall and evapotranspiration [29]. The study region experiences notable seasonal variation in rainfall, with distinct dry and rainy seasons. The soil water storage capacity exhibited regular fluctuations, coinciding with fluctuations in temperature and precipitation (Figure 2). Precipitation reached 984.5 mm in the rainy season (May to October), accounting for 76.5% of the total annual precipitation; 111 precipitation days also occurred during the rainy season, accounting for 66.9% of the total annual precipitation days. The highest temperature was recorded in June, with a monthly average of 22.1 °C. The soil moisture content of the arbor land showed large fluctuations, ranging between 136.20 and 359.20 mm (average of 258.13 mm), with a variation coefficient of 26.35%. The soil moisture content of the shrubland ranged between 140.50 and 283.00 mm, with an average value of 230.44 mm and a variation coefficient of 20.58%. The soil moisture content of the grassland ranged between 138.45 and 294.00 mm, with an average value of 220.51 mm and a variation coefficient of 17.32%. The overall fluctuation in the grassland was smaller than that in the other two woodland types. The soil moisture content in the arbor land and grassland was the highest in October, with monthly averages of 314.58 and 266.05 mm, respectively. In contrast, the highest soil moisture content in the shrubland occurred in September, with a monthly average of 266.85 mm. The soil water storage of the three woodland types showed the highest fluctuation in June, with variation coefficients of 37.39%, 23.68%, and 11.74%. Woodland vegetation enters the peak growing season in June, with high rates of transpiration. During this period, the high temperature and low rainfall increases evaporation, and the soil water storage capacity is predominantly dependent on rainfall amount [30], leading to large fluctuations in soil moisture content. Transpiration of forest vegetation is generally higher during the growing season (May to October); however, the soil moisture content notably increased due to the sufficient soil moisture supply from precipitation. The soil water storage capacity of the three woodland types occurred in the following order: arbor land > shrubland > grassland.
The dry season (March to April and November to February of the following year) precipitation was 302.0 mm, accounting for only 23.5% of the annual precipitation. Moreover, the dry season comprised a total of 55 precipitation days, accounting for 33.1% of the total annual precipitation days. Temperature was the lowest in January, with a monthly average value of 10.8 °C. The soil moisture content of the arbor land showed large fluctuations, ranging between 126.80 and 246.00 mm (average of 199.01 mm), with a variation coefficient of 14.87%. The soil moisture content of the shrubland ranged between 139.30 and 258.00 mm, with an average of 210.65 mm and a variation coefficient of 14.40%. The soil moisture content of the grassland ranged between 153.35 and 258.70 mm, with an average value of 222.46 mm and a variation coefficient of 9.59%; the overall fluctuation was also much smaller than that of the other two woodland types. Generally, forest vegetation growth and transpiration significantly reduce during the dry season. The low temperature also weakens soil water activity and soil evaporation. The soil water storage volume showed little fluctuation and generally declined with time. The soil moisture content of the three woodland types occurred in the order of grassland > shrubland > arbor land.
The annual soil moisture content of the arbor land showed large variability, ranging between 143.53 and 314.58 mm (annual average of 228.57 mm), with a variation coefficient of 24.73%. The annual soil moisture content of the shrubland ranged between 146.78 and 266.85 mm, with an average value of 220.54 mm and a variation coefficient of 17.47%. The annual soil moisture content of the grassland ranged between 151.86 and 266.05 mm, with an average value of 221.48 mm and a variation coefficient of 13.15%; the overall fluctuation was also much smaller than that of the other two woodland types. The annual average soil moisture content of the three woodland types occurred in the order of arbor land > grassland > shrubland.
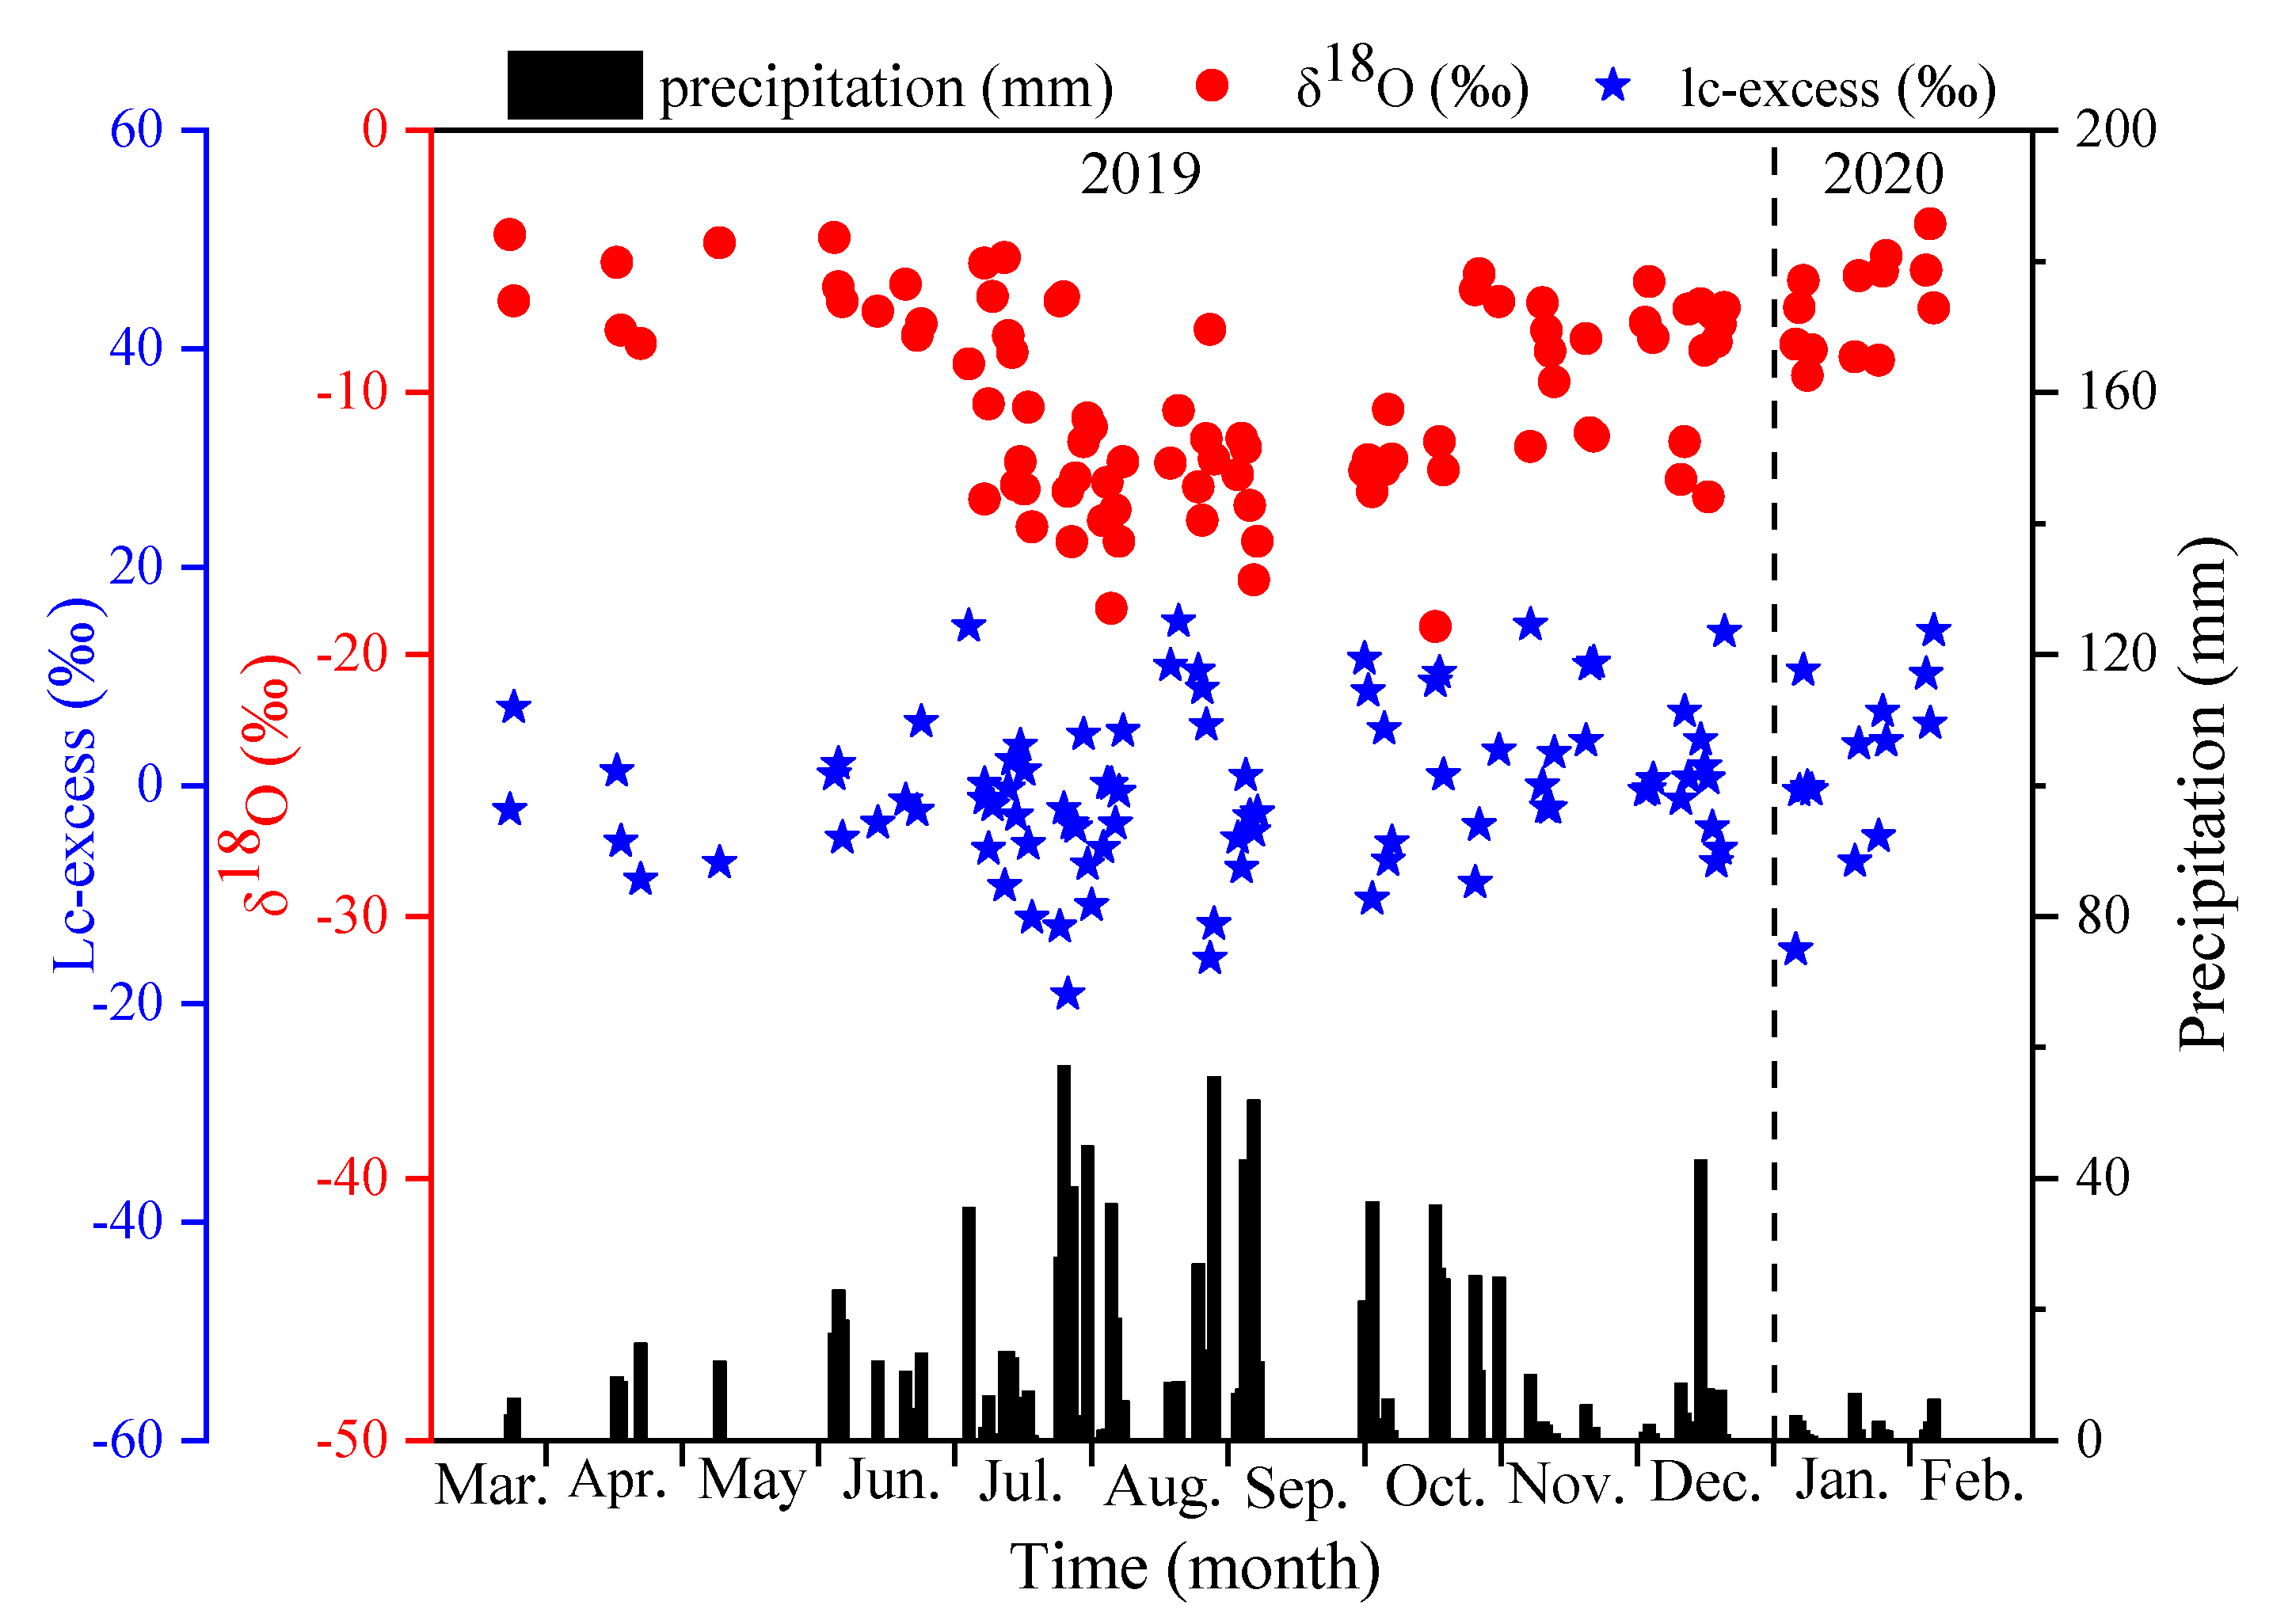
3.2. Stable Isotope Characteristics of Precipitation
The δ18O of precipitation ranged from −18.93‰ to −3.56‰, with an average value of −10.69‰ and a standard deviation of 3.65‰ (Figure 3). Precipitation δ18O is affected by the water vapor source and monsoon climate variability. Precipitation δ18O was higher during the dry season (−7.38‰) than in the rainy season (−11.71‰), but the standard deviation was higher in the rainy season (3.56‰) than in the dry season (2.42‰). This indicates the large stable isotope variability of precipitation, likely related to the region’s complex and diverse weather system. Precipitation water vapor sources and seasonal meteorological conditions are the dominant causes for the seasonal variation in precipitation δ18O in the study area. δ18O is typically lower during the rainy season, as precipitation water vapor is mainly transported from the low-latitude ocean, which has high air humidity and rainfall and lower evaporation; precipitation is also continuously depleted during transport. The study region is typically affected by continental air masses during the dry season, and the water vapor in the southwestern region mainly transforms the westerly belt and the water vapor supply from inland re-evaporation. Air humidity and precipitation is low and evaporation is strong, resulting in heavy isotope enrichment [31]; this phenomenon is widespread across low- and mid-latitude monsoon regions [32]. The lc-excess value of precipitation ranged from −19.11‰ to 15.05‰, with an annual average value of 0 and a standard deviation of 7.25‰, which was consistent with the seasonal variation of precipitation δ18O. The precipitation lc-excess value was higher in the dry season (1.25‰) than in the rainy season (−0.96‰). This is because in the dry season, 18O enriches relatively more rapidly than 2H as water evaporates, and the positive intercept of the water line for evaporated water tends to increase.
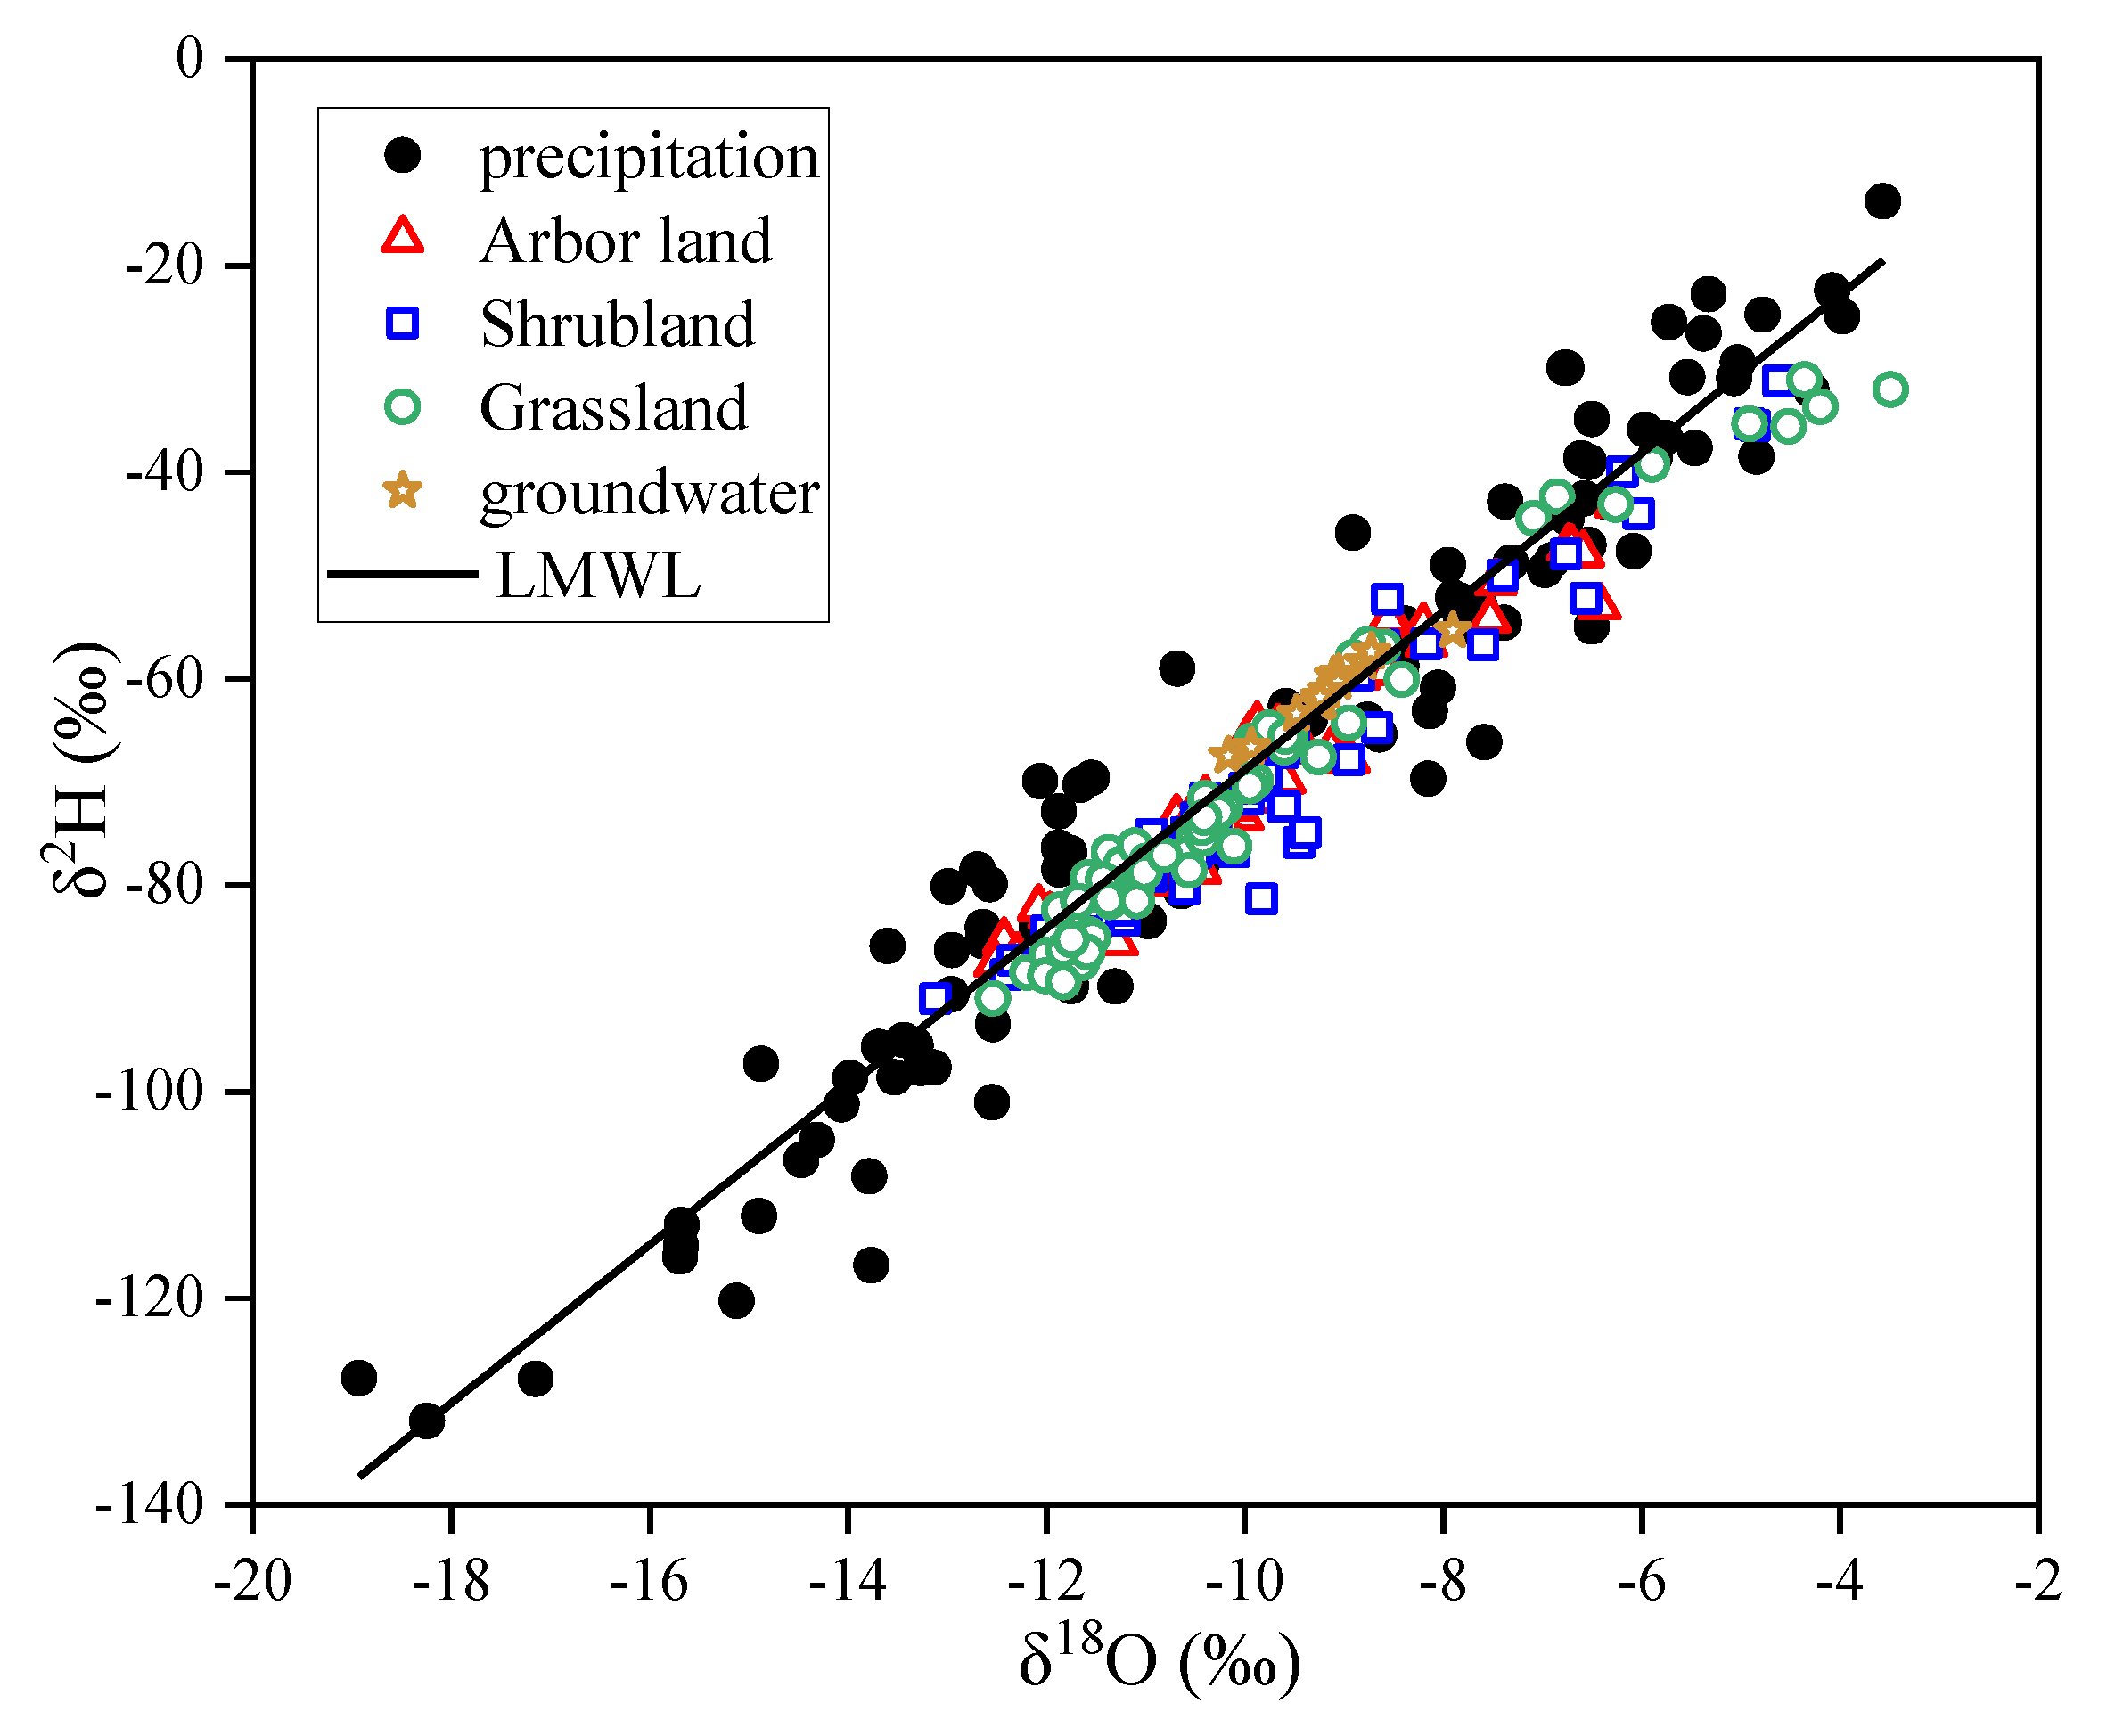
The ordinary least squares method was used to obtain the LMWL of the study site (Table 2): δ2H = 7.67 δ18O + 7.87 (R = 0.968, n = 99). The slope and intercept of this equation are smaller than those of the global meteoric water line (GMWL: δ2H = 8 δ18O + 10) and the China meteoric water line (CMWL: δ2H = 7.9 δ18O + 8.2) [33]. This suggests that precipitation in the study area originates from a region with different stable isotope ratios and is also affected by other environmental factors such as evaporation [34].
3.3. Stable Isotope Characteristics of Soil Water
We analyzed soil water samples from three forest types during the sampling period (Table 3). The soil water δ18O in the arbor land ranged from −12.52‰ to −6.26‰, with an average of −9.92‰ and a standard deviation of 1.42‰. The soil water δ18O in the shrubland ranged from −13.12‰ to −4.62‰, with an average value of −9.86‰ and a standard deviation of 1.78‰. Finally, the soil water δ18O in the grassland ranged from −12.54‰ to −3.49‰, with an average value of −9.94‰ and a standard deviation of 2.09‰. Soil water δ18O is typically influenced by numerous factors, including the stable isotopic composition of precipitation, infiltration of precipitation, the mixing of new and old water, and differences in soil evaporation. The soil water δ18O in the three woodland types showed significant seasonal variability, with higher values in the dry season than in the rainy season. In addition, the soil water δ18O was also much higher in the shrubland than in both the arbor land and grassland. This may be due to secondary rainfall interception in the shrubland, which prolongs the supply of precipitation to the soil water. Evaporative fractionation also increased, which coincided with the impacts of soil evaporation, leading to the enrichment of isotopes in the shrubland soil water. The differences between the soil water isotopes of the three woodland types also showed notable seasonal changes. During the rainy season, soil water isotopes occurred in the order of arbor land > shrubland > grassland. In contrast, soil water δ18O in the dry season occurred in the order of grassland > shrubland > arbor land.
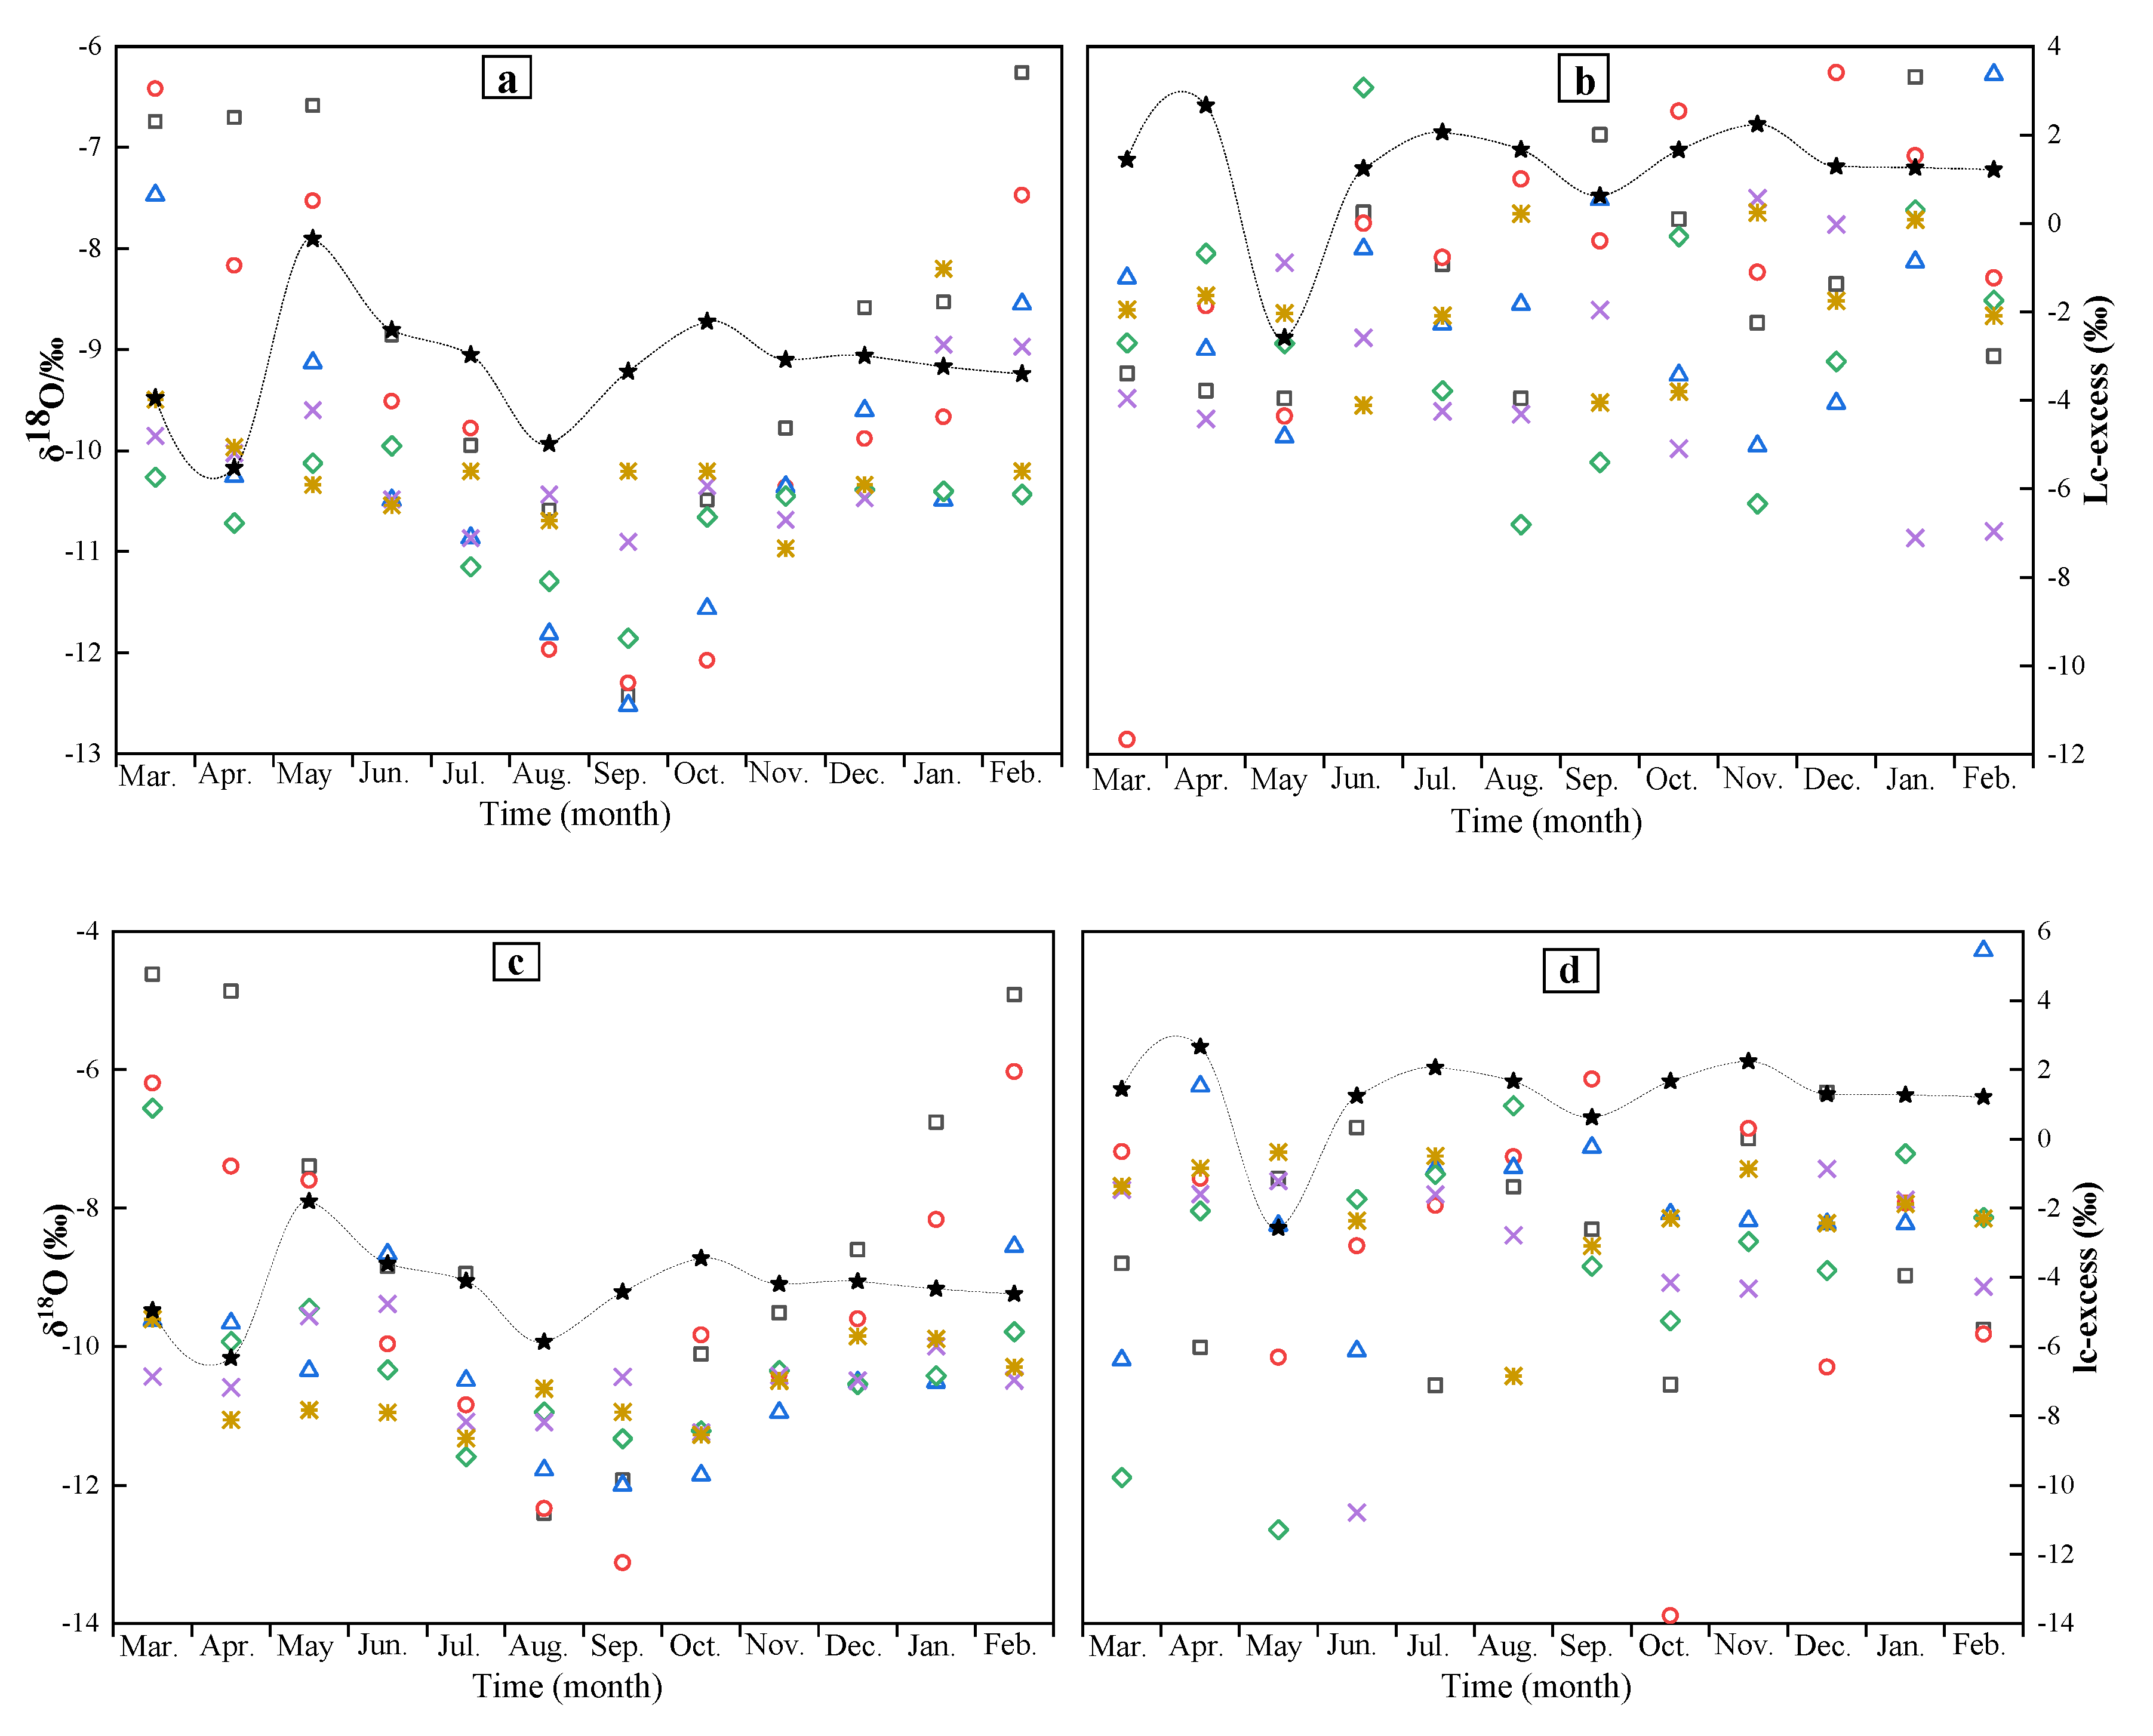
3.3.1. Soil Water δ18O Variability with Depth
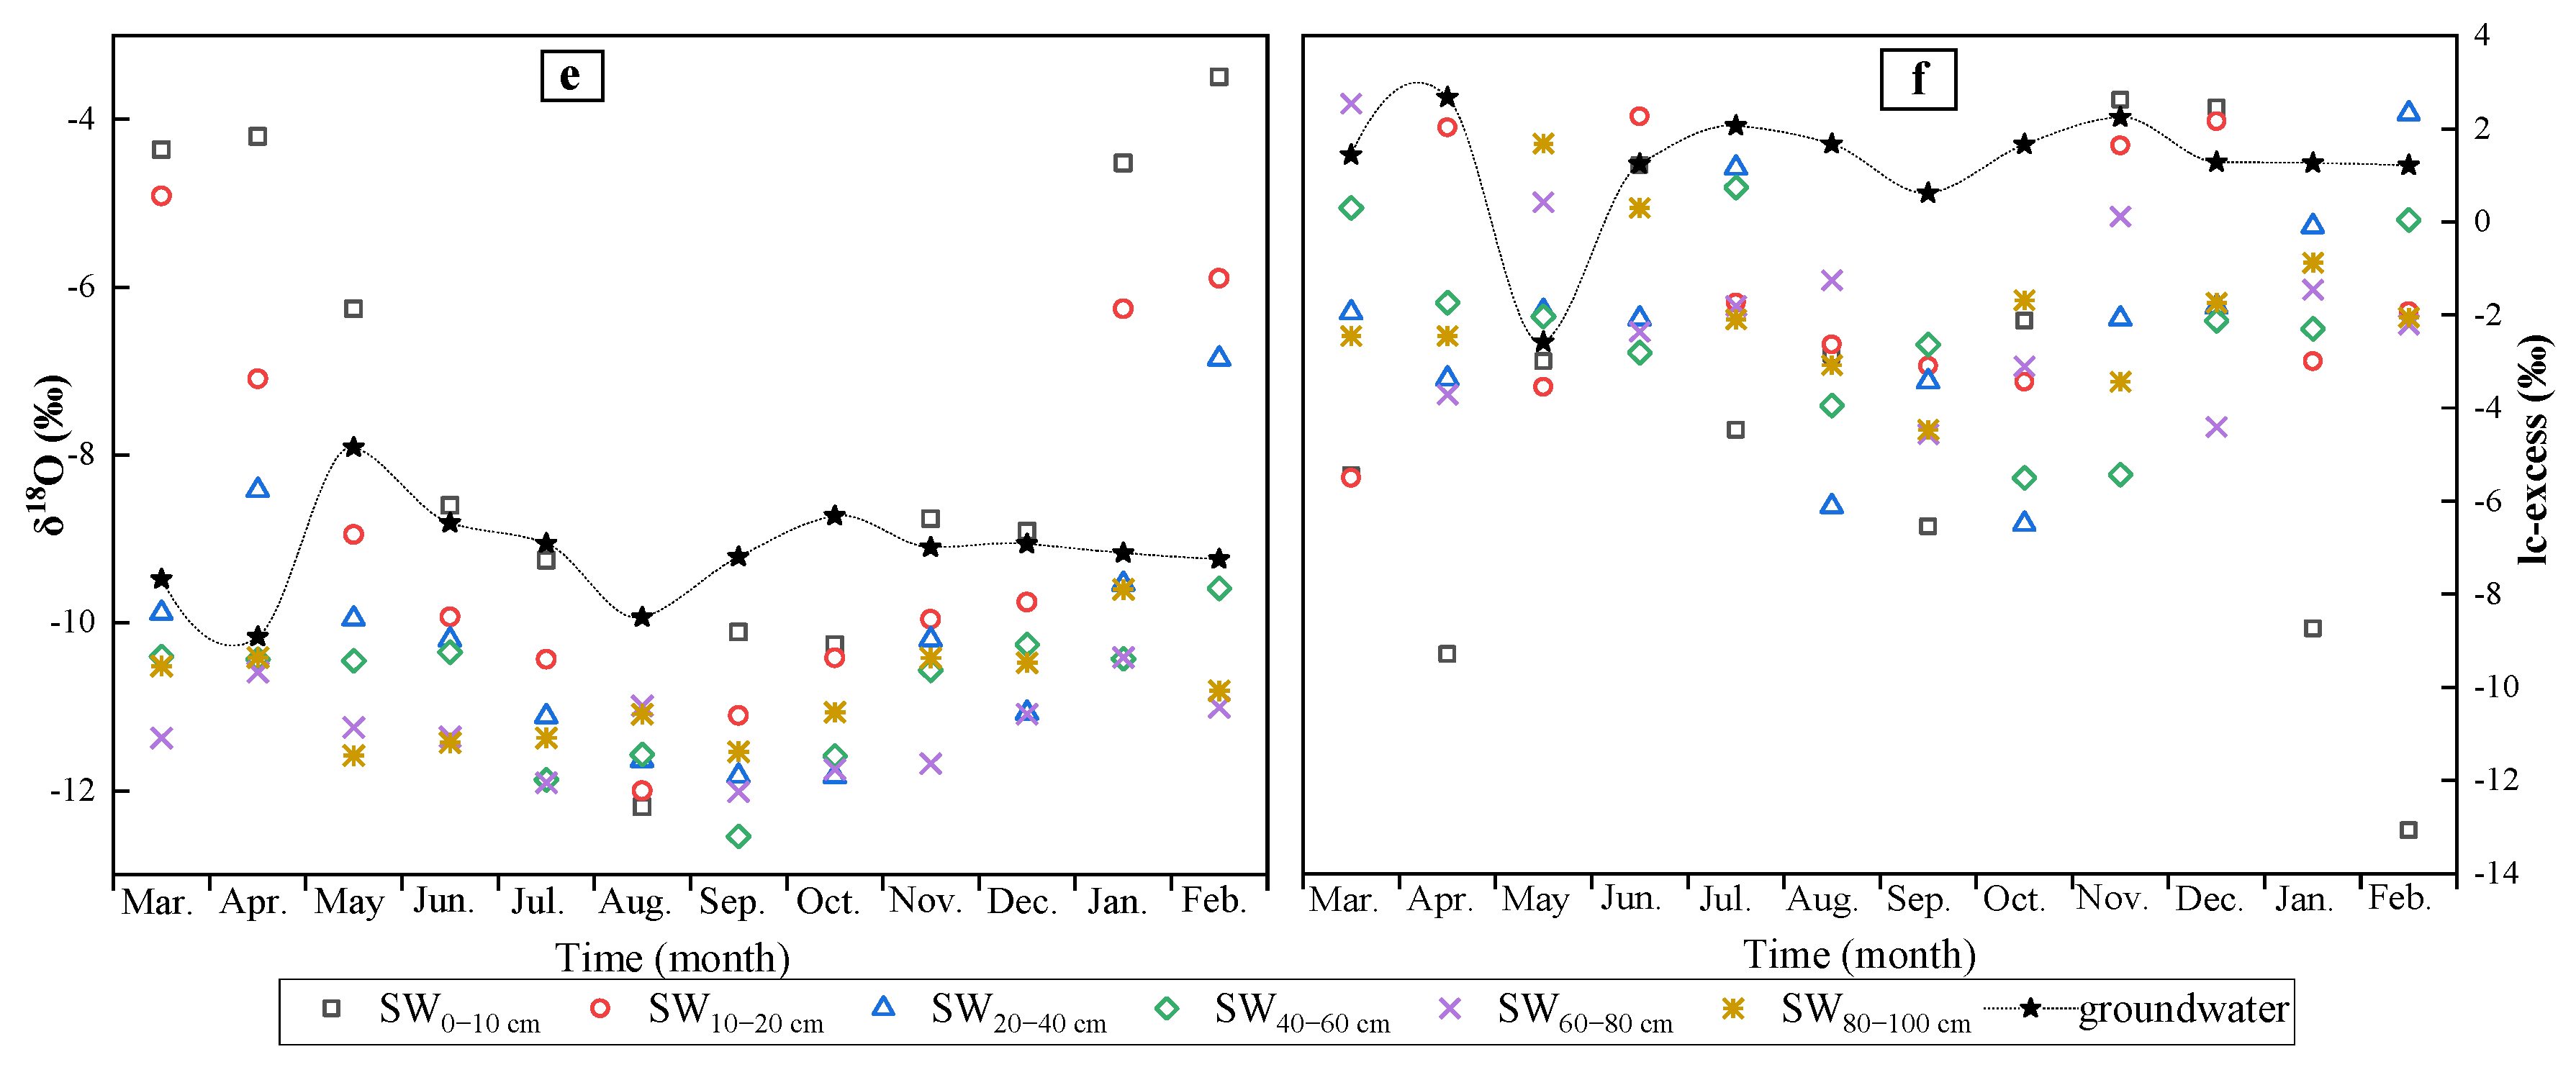
During the observation period, the surface soil (0–20 cm) δ18O of the three woodland types showed large variability and predominantly reflected the isotopic fractionation effect of soil evaporation. The standard deviation of soil water δ18O gradually decreased and the δ18O stability increased with increasing soil depth. Moreover, the δ18O remained stable below the 60–80 cm layer. However, we observed notable differences in the soil profile characteristics of soil water δ18O between the three types of woodland. In arbor land and shrubland, the δ18O of soil water first decreased with soil depth to the 60–80 cm layer and then increased. The minimum soil water δ18O at the 60–80 cm soil layer was −10.64‰ and −10.60‰ for the arbor land and shrubland, respectively. Soil water δ18O of the grassland showed a decreasing trend to the 40–60 cm soil layer, followed by an increasing trend with soil depth. The minimum soil water δ18O (−11.28‰) at 40–60 cm was lower than the minimum observed in the arbor land and shrubland. We observed significant differences in the seasonal variation of soil water δ18O at different depths in the three woodland types. For example, the soil water δ18O from 0 to 60 cm showed the most significant seasonal variability, while that at 60 to 100 cm showed the lowest seasonal change. Overall, the dry season values were generally higher than those of the rainy season. We observed significant seasonal differences in the soil water δ18O profile characteristics of both arbor land and shrubland. In the dry season, the δ18O of soil water first decreased to 60–80 cm and then increased with increasing soil depth. In the rainy season, the trend in soil water δ18O shifted at 40–60 cm (Table 3 and Figure 4a,c,e).
3.3.2. Evaporation Effects on Soil Water Stable Isotopes
Water evaporation is a dominant cause for the observed differences in the distribution of soil water stable isotope profiles (Table 3 and Figure 4b,d,f). The average lc-excess of each water body occurred in the order of groundwater (1.19‰) > precipitation (0) > arbor forest soil water (−2.06‰) > unused grassland soil water (−2.27‰) > shrub forest soil water (−2.80‰). The soil water lc-excess values of the three woodland types were less than 0, which suggests that the soil water stable isotopes experienced different degrees of evaporation and enrichment. The lc-excess of groundwater was greater than 0, inferring the influence of non-precipitation water sources on groundwater in the study site. The δ18O of the surface soil (0–20 cm) showed the highest variability in all three woodland types. The soil water δ18O stabilized below 60–80 cm in all three sites, indicating a weaker evaporation effect on the δ18O of deeper soil water. For the three woodland types, the soil water lc-excess ranges were 11.66‰–3.41‰, −13.77‰–5.44‰, and −13.07‰–2.62‰; the annual average values were −2.04‰, −2.80‰, and −2.27‰; and the standard deviations were 2.72‰, 3.14‰, and 2.88‰, respectively. The arbor land values were larger than the shrubland and grassland values, inferring weaker soil evaporation in the arbor land. Soil evaporation decreased and soil water lc-excess increased with increasing depth. The average soil water lc-excess in the 0–10 cm layer was significantly lower than the average values of the other soil layers in all woodland types (−3.41‰, −3.61‰, −4.10‰), indicating the highest evaporation in the surface soil layer (0–10 cm). The soil water lc-excess in the 0–10 cm layer of the grassland site was significantly lower than that of the arbor land and shrubland, inferring stronger surface soil evaporation in the grassland. The soil water lc-excess of the three woodland types also showed significant seasonal variability, with lower values in the dry season than in the rainy season; this infers higher surface soil evaporation during the dry season.
The soil water δ2H and δ18O of all three woodland types were distributed below the LMWL. Moreover, the slope and intercept of the soil waterline (SWL) of each woodland type were lower than those of the LMWL, which may reflect the seasonal changes in the evaporative stable isotope enrichment of soil water (Figure 5). The change in groundwater δ18O was different to that of precipitation and soil water. Groundwater δ18O showed low variability (standard deviation of 0.55‰), ranging from −7.91‰ to −10.17‰, with an average value of −9.16‰; this was larger than the δ18O of soil water and precipitation, which suggests that groundwater values may reflect the average precipitation value of previous years and/or the influence of non-precipitation water sources [35]. The slope and intercept of the SWL of the grassland were higher than those of the arbor land and shrubland, indicating weaker soil water evaporation in the grasslands; this suggests that the grassland was predominantly replenished by precipitation, while arbor land and shrubland were predominantly replenished by previous soil water.
3.3.3. Influence of Infiltration Processes on Soil Water Stable Isotopes
Infiltrated precipitation mixes with the original soil water and only replaces a part of the old water. Soil water stable isotope values generally stabilize with increasing depth [35]. The soil water infiltration depth increases under heavy rainfall, which facilitates the mixing of precipitation and deep soil water. Following several large precipitation events in the rainy season (29 of the 56 precipitation samples with precipitation of ≥10 mm), the degree of new and old water mixing was significant. In the arbor land and shrubland, the soil water at 0–60 cm fully mixed with precipitation, while that at 60–100 cm showed partial mixing. In contrast, we observed full mixing of soil water and precipitation at 0–100 cm in the grassland. The degree of new and old water mixing was low during the dry season due to the low occurrence of heavy precipitation events (seven of the 43 precipitation samples with precipitation ≥10 mm). Only the surface soil water (0–10 cm) in the arbor land reflected the stable oxygen isotopic signature of precipitation, while soil water at 20–100 cm still retained the isotopic signature of the rainy season. In the shrubland and grassland, soil water in the upper 0–20 cm reflected the stable oxygen isotopic signature of precipitation, while that at 40–100 cm still retained the isotopic signature of the rainy season (Table 3 and Figure 4). In summary, the infiltration of soil water and the subsequent mixing of new and old water is a continuous accumulative process, resulting in the gradual replacement of old soil water with infiltrated water. Soil water infiltration also replenishes soil water and is affected by the structure and texture of soil, the previous water content, the efficiency of infiltration, and different precipitation events. Soil water replenishment therefore shows a time lag in the soil profile. Soil water at 0–20 cm mixes well with precipitation and has a short renewal time, and the occurrence of precipitation events therefore renews its isotopic value. The renewal time at 20–60 cm is several months, while that at 60–100 cm is >1 a (Figure 4a,c,e) and shows minimal variability.
4. Discussion
4.1. Soil Water Source and Movement Mechanisms
Soil water movement mainly comprises two processes: soil water replenishment and dissipation [36,37,38,39,40,41]. Soil water is mainly sourced from atmospheric precipitation, groundwater, and irrigation water, with minor influences from water vapor condensation. The main soil moisture dissipation pathways are soil evaporation, vegetation utilization and transpiration, water leakage, and runoff [5]. We found that the isotopic values of the soil water samples in all woodland types were close to or less than the average value of atmospheric precipitation. The recharge source of soil water was mainly precipitation, which is consistent with the findings of Mou et al. [42]. During the dry season, the soil water isotopic values in all woodland types were lower than the precipitation isotopic values, except for the surface layer (0–20 cm). In contrast, the soil water isotopic values were higher than the precipitation isotopic values in the rainy season, which indicates significant seasonal differences in the soil water source in the study area: i.e., the supply of current precipitation was relatively low and the supply from the previous precipitation was relatively high during the dry season. Seasonal precipitation was the dominant supply of soil water during the rainy season, as soil water is generally a mixture of original soil water and other supplementary water sources [43]—including the seasonal replenishment of precipitation [44]. According to the source and sink theory, water with depleted isotopic compositions generally flows toward water with enriched isotopic compositions [16]. For example, Awaleh et al. [45] found that wadi-rivers in arid volcanogenic areas recharged alluvium via downward circulation through major faults toward the basalt, which mixed with a more geochemically evolved groundwater. The stable isotopic composition of groundwater in the study area was more enriched than most soil water isotopic values; this suggests that, rather than the groundwater replenishment of soil water, soil water affected by evaporation was instead the dominant source of groundwater. Adomako et al. [46] found that soil water was of meteoric origin that had undergone fractionation-controlled evaporation. Moreover, soil water below 3 m depth had recharged groundwater mainly via piston flow. In agreement, we found that precipitation and groundwater recharge were the dominant sources of soil water in this study. However, Li et al. [47] found that the local precipitation was not a dominant source of groundwater in the Mogao Grottoes and suggested that underground phreatic water was a likely source of evaporative soil water, indicating a clear supply channel. This finding contrasts with our results, which may be due to the influence of meteorological conditions and other factors on soil water transport [48,49,50]. Our study area located in the monsoon region, which experiences higher rainfall and lower evaporation than arid regions; it is therefore less likely for evaporative soil water to be sourced from phreatic water.
Water in the soil profile mainly has two forms of movement: plug flow and preferential flow. Plug flow refers to the gradual downward movement of “old soil water” (relatively enriched hydrogen and oxygen stable isotopes) by the infiltration of “new water” (relatively depleted hydrogen and oxygen stable isotopes) without axial mixing in the vertical direction; preferential flow refers to the rapid movement of infiltrating water through open channels, such as wormholes, vegetation roots, and fissures [51]. The migration of soil water is affected by factors such as soil texture, vegetation type, micro-topography, and climate [43,52,53,54]. The soil water δ18O in all woodland types generally showed an initial decreasing trend with depth, followed by an increasing trend; this indicates the occurrence of top–down piston infiltration of precipitation. Soil water δ18O showed large seasonal variability, with a gradual decrease during the rainy season. The minimum soil water isotope value at 40–60 cm confirms that preferential precipitation infiltration was the dominant mechanism of soil water movement. This is consistent with previous findings in the karst forest–lake basin of southeastern Yunnan Province [42] and in the Loess Plateau [14]. However, Ji et al. [16] found that the piston flow of precipitation was the dominant supply of soil water and the main water movement mechanism in the deep loess profiles under different land use types in northern Shaanxi, China. We observed different water movement characteristics in the shallow and deep soil layers. Precipitation infiltrated the shallow soil layer in the form of plug flow, and some of the rainwater rapidly reached the deep soil via preferential flow [11]. Germann et al. [55] found that macropore preferred flow was the only water source channel to the deep soil, while Adomako et al. [45] found that the piston flow of soil water below 3 m was the dominant contributor to groundwater recharge.
4.2. Influence of Stand Type on Soil Water Stable Hydrogen and Oxygen Isotopes
The soil water isotopic composition is influenced by many factors, such as the precipitation isotopic composition, surface evaporation, soil water (horizontal and vertical) movement, vegetation type, and human activity [56,57,58,59]. Precipitation characteristics were similar throughout the study area, and root water uptake did not alter the stable hydrogen and oxygen isotopic compositions. Therefore, the difference in soil water stable isotopes between the different vegetation types was likely caused by evaporation differences influenced by vegetation. Oerter et al. [60] also identified the influence of plants on soil water variability and its isotopic ratios. The slope of the soil waterline of the different vegetation types occurred in the order of grassland > arbor land > shrubland (Table 2), and the soil water lc-excess occurred in the order of arbor land (−2.06‰) > grassland (−2.27‰) > shrubland (−2.80‰); this suggests that the soil moisture evaporation fractionation occurred in the order of grassland < arbor land < shrubland. The annual average soil water storage in the arbor land and grassland (228.57 and 221.48 mm, respectively) was higher than that of the shrubland (220.54 mm), with larger and faster water infiltration. This is likely due to the presence of larger pores from developed root systems, which facilitated the generation of preferential flow. Vegetation coverage and human disturbance in shrubland enhances soil compaction and reduces the number of macropores; this slows the rate of precipitation infiltration, resulting in the dominance of plug flow [20,61]. Yu et al. [62] identified infiltration coefficients of 0.91, 0.64, and 0.74 in shifting dunes, shrub-dominated communities, and herb-dominated communities, respectively. Cumulative infiltration and soil texture were the two vital factors affecting the depth of rainfall penetration. Rainfall events larger than 35.0 mm had recharged the soil water at the 60–80 cm layer in the herb-dominated community, which is consistent with the results of this study. Vegetation types therefore have a dominant impact on soil water movement. Amani et al. [63] also confirmed the influence of vegetation and field conditions on the variability of soil water flow mechanisms. In addition, the slope and intercept of the SWL in the wild grassland were higher than those of the arbor and shrub forests; this suggests that precipitation was the dominant supply of soil water in the grassland, while early soil water predominantly replenished soil water in the arbor land and shrubland. Studies in the loess region showed that vegetation type had a dominant impact on the soil water cycle. Ji et al. [16] found that farmland and grassland were predominantly replenished by low-intensity precipitation events, while land dominated by Salix cheilophila and Populus sp. was mainly replenished by heavy rainfall in summer and autumn. Ma et al. [64] found that precipitation mainly recharged grassland soil water, while deep soil water mainly recharged the surface soil water in black locust forests. These findings are consistent with the results of our study and further highlights the influence of vegetation type on soil water supply.
5. Conclusions
In this study, we analyzed the stable hydrogen and oxygen isotopes of soil water to determine the dominant soil water sources and migration processes in the upper 0–100 cm. We assessed the soil water movements under three woodland types in a forested water source region above the small Quanfuzhuang watershed and concluded the following:
Soil moisture showed significant seasonal variability in Hani Terrace, and soil water content and its stability increased from the surface to the deep soil. The annual average soil moisture content of the three woodland types occurred in the order of arbor land > grassland > shrubland. We also observed notable seasonal differences in the soil water sources: early precipitation was the dominant supply during the dry season, while atmospheric precipitation was the dominant supply during the rainy season. The proportion of soil water supplied by precipitation was higher in the grassland than in the arbor land and shrubland.
The standard deviation of soil water δ18O gradually decreased and its stability increased from the surface (0–20 cm) to the deep layer (60–80 cm), while lc-excess increased with increasing soil depth; this indicates elevated soil evaporation with decreasing depth, with highest soil evaporation at 0–10 cm. Soil evaporation was higher during the dry season than in the wet season in all three woodland types. The arbor land and shrubland showed the weakest and strongest soil evaporation, respectively, while highest evaporation was observed in the 0–10 cm soil layer in the grassland.
The mixing of new and old soil water during infiltration is a continuous accumulative process. Based on the precipitation and soil water stable isotope changes at different depths, plug flow and preferential flow were the dominant precipitation infiltration mechanisms in the study site, and the latter was mainly recharged during the rainy season.
Author Contributions
Conceptualization, H.P. and W.S.; methodology, J.W. and W.S.; data curation, H.P. and W.S.; formal analysis, H.P. and W.S.; writing—original draft preparation, H.P.; writing—review and editing, H.P., J.W., and W.S.; project administration, J.W. and W.S.; funding acquisition, J.W. and W.S. All authors have read and agreed to the published version of the manuscript.
Funding
This research was funded by the Applied Basic Research Projects of Yunnan Province (project no. 202001AS070042) and the National Natural Science Foundation of China (project no. 41771084).
Conflicts of Interest
The authors declare no conflict of interest.
References
- Thevs, N.; Ovezmuradoc, K.; Zanjani, L.V.; Zerbe, S. Water consumption of agriculture and natural ecosystems at the Amu Darya in Lebap Province, Turkmenistan. Environ. Earth Sci. 2015, 73, 731–741. [Google Scholar] [CrossRef]
- Robertson, J.A.; Gazis, C.A. An oxygen isotope study of seasonal trends in soil water fluxes at two sites along a climate gradient in Washington state (USA). J. Hydrol. 2006, 328, 375–387. [Google Scholar] [CrossRef]
- Koeniger, P.; Leibundgut, C.; Link, T.; Marshall, J.D. Stable isotopes applied as water tracers in column and field studies. Org. Geochem. 2010, 41, 31–40. [Google Scholar] [CrossRef]
- Dougill, A.J.; Heathwaite, A.L.; Thomas, D.S.G. Soil water movement and nutrient cycling in semi-arid rangeland: Vegetation change and system resilience. Hydrol. Process. 2015, 12, 443–459. [Google Scholar] [CrossRef]
- Koeniger, P.; Gaj, M.; Beyer, M.; Himmelsbach, T. Review on soil water isotope-based groundwater recharge estimations. Hydrol. Process. 2016, 30, 2817–2834. [Google Scholar] [CrossRef]
- Nordén, L.G. Depletion and recharge of soil water in two stands of norway spruce (picea abies (l.) karst). Hydrol. Process. 1990, 4, 197–213. [Google Scholar]
- Mueller, M.H.; Alaoui, A.; Kuells, C.; Leistert, H.; Meusburger, K.; Stumpp, C.; Weiler, M.; Alewell, C. Tracking water pathways in steep hillslopes by δ18O depth profiles of soil water. J. Hydrol. 2014, 519, 340–352. [Google Scholar] [CrossRef]
- Penna, D.; Hopp, L.; Scandellari, F.; Allen, S.T.; Kirchner, J. Tracing ecosystem water fluxes using hydrogen and oxygen stable isotopes: Challenges and opportunities from an interdisciplinary perspective. Biogeoences Discuss. 2018, 15, 6399–6415. [Google Scholar]
- Lee, K.S.; Kim, J.M.; Lee, D.R.; Kim, Y.; Lee, D. Analysis of water movement through an unsaturated soil zone in Jeju Island, Korea using stable oxygen and hydrogen isotopes. J. Hydrol. 2007, 345, 199–211. [Google Scholar] [CrossRef]
- Brinkmann, N.; Seeger, S.; Weiler, M.; Buchmann, N.; Eugster, W.; Kahmen, A. Employing stable isotopes to determine the residence times of soil water and the temporal origin of water taken up by Fagus sylvatica and Picea abies in a temperate forest. N. Phytol. 2018, 219, 1300–1313. [Google Scholar] [CrossRef] [Green Version]
- Gazis, C.; Feng, X.H. A stable isotope study of soil water: Evidence for mixing and preferential flow paths. Geoderma 2004, 119, 97–111. [Google Scholar] [CrossRef]
- Tian, L.D.; Yao, T.D.; Sun, W.Z. Stable isotope variation of precipitation in the middle of Qinghai-Xizang Plateau and monsoon activity. Geochimica 2001, 141, 1723–1729. [Google Scholar]
- Hou, S.B.; Song, X.F.; Yu, J.J.; Liu, X.; Zhang, G.Y. Stable isotopes characters in the process of precipitation and infiltration in Taihang mountainous region. Resour. Sci. 2008, 30, 86–92. (In Chinese) [Google Scholar]
- Cheng, L.P.; Liu, W.Z. Characteristics of stable isotopes in soil water under several typical land use patterns on Loess Tableland. Chin. J. Appl. Ecol. 2012, 23, 651–658. (In Chinese) [Google Scholar]
- Ma, T.T.; Ke, H.C.; Li, Z.B.; Li, P.; Xiao, L.; Zhang, Y.; Tang, S.S.; Zheng, L.F.; Su, Y.Y.; Bai, L.L. Soil moisture migration characteristics of typical small watershed in rain feed region under individual rainfall event. J. Soil Water Conserv. 2018, 32, 80–86. (In Chinese) [Google Scholar]
- Ji, W.J.; Huang, Y.N.; Li, B.B.; Li, Z. Oxygen and hydrogen stable isotopes composition of soil water in deep loess profile under different land use types of northern Shaanxi, China. Chin. J. Appl. Ecol. 2019, 30, 4143–4149. (In Chinese) [Google Scholar]
- Song, W.F.; Wu, J.K. Hani rice terrace–Historical status, ecological environment, sustainable development; Science Press: Beijing, China, 2016. (In Chinese) [Google Scholar]
- Song, W.F. Current situation and development and protection countermeasures for ancient terraced fields in southern China. Soil Water Conserv. China 2019, 4, 15–20. (In Chinese) [Google Scholar]
- Liu, M.C.; Liu, W.W.; Yang, L.; Jiao, W.J.; He, S.Y.; Min, Q.W. A dynamic eco-compensation standard for Hani rice terraces system in southwest China. Ecosyst. Serv. 2019, 36, 1–7. [Google Scholar] [CrossRef]
- Jiao, Y.-M.; Zhao, D.; Xu, Q.; Liu, Z.; Ding, Z.; Ding, Y.; Liu, C.; Zha, Z. Mapping lateral and longitudinal hydrological connectivity to identify conservation priority areas in the water-holding forest in Honghe Hani Rice Terraces World Heritage Site. Landsc. Ecol. 2020, 35, 709–725. [Google Scholar] [CrossRef]
- Ma, J.; Song, W.F.; Wu, J.K.; Liu, Z.B.; Wei, Z. Identifying the mean residence time of soil water for different vegetation types in a water source area of the Yuanyang Terrace, southwestern China. Isot. Environ. Health Studies 2019, 55, 272–289. [Google Scholar] [CrossRef]
- Orlowski, N.; Winkler, A.; McDonnell, J.J.; Breuer, L. A simple greenhouse experiment to explore the effect of cryogenic water extraction for tracing plant source water. Ecohydrology 2018, 11, 1967. [Google Scholar] [CrossRef]
- Craig, H. Isotopic Variation in Meteoric Waters. Science 1961, 133, 1702–1703. [Google Scholar] [CrossRef]
- Hasselquist, N.J.; Benegas, L.; Roupsard, O.; Malmer, A.; Ilstedt, U. Canopy cover effects on local soil water dynamics in a tropical agroforestry system: Evaporation drives soil water isotopic enrichment. Hydrol. Process. 2018, 32, 994–1004. [Google Scholar] [CrossRef]
- Hervé-Fernández, P.; Oyarzún, C.; Brumbt, C.; Huygens, D.; Bodé, S.; Verhoest, N.E.C.; Boeckx, P. Assessing the “two water worlds” hypothesis and water sources for native and exotic evergreen species in south-central Chile. Hydrol. Process. 2016, 30, 4227–4241. [Google Scholar] [CrossRef]
- Nie, Y.P.; Chen, H.S.; Ding, Y.L.; Wang, K.L. Water source segregation along successional stages in a degraded karst region of subtropical China. J. Veg. Sci. 2018, 29, 933–942. [Google Scholar] [CrossRef]
- Sprenger, M.; Tetzlaff, D.; Soulsby, C. Soil water stable isotopes reveal evaporation dynamics at the soil–plant–atmosphere interface of the critical zone. Hydrol. Earth Syst. Sci. 2017, 21, 3839–3858. [Google Scholar] [CrossRef] [Green Version]
- Landwehr, J.M.; Coplen, T.B.; Stewart, D.W. Spatial, seasonal, and source variability in the stable oxygen and hydrogen isotopic composition of tap waters throughout the USA. Hydrol. Process. 2014, 28, 5382–5422. [Google Scholar] [CrossRef]
- Hunt, A.; Faybishenko, B.; Ghanbarian, B.; Egli, M.; Yu, F. Predicting water cycle characteristics from percolation theory and observational data. Int. J. Environ. Res. Public Health 2020, 17, 734. [Google Scholar] [CrossRef] [Green Version]
- Liu, B.X.; Shao, M.A. Estimation of soil water storage using temporal stability in four land uses over 10 years on the Loess Plateau, China. J. Hydrol. 2014, 517, 974–984. [Google Scholar] [CrossRef]
- Zhang, X.P.; Liu, J.M.; Nakawo, M.; Xie, Z.C. vapor origins revealed by deuterium excess in precipitation in southwest China. J. Glaciol. Geocryol. 2009, 31, 613–619. (In Chinese) [Google Scholar]
- Liu, J.R.; Song, X.F.; Yuan, G.F.; Sun, X.M.; Liu, X.; Wang, S.Q. The characteristics and sources of atmospheric precipitation ^18O in the monsoon region of eastern China. Chin. Sci. Bull. 2009, 22, 3521–3531. (In Chinese) [Google Scholar]
- Zheng, S.H.; Hou, F.G.; Nie, B.L. Study on nitrogen and oxygen stable isotopes of atmospheric precipitation in China. Chin. Sci. Bull. 1983, 13, 35–40. (In Chinese) [Google Scholar]
- Zhang, X.P.; Sun, W.Z.; Liu, J.M. Stable isotopes in precipitation in the vapor transport path in Kunming of southewest China. Res. Environ. Yangtze Basin 2005, 14, 665–669. (In Chinese) [Google Scholar]
- Tan, H.B.; Liu, Z.H.; Rao, W.B.; Wei, H.Z.; Zhang, Y.D.; Jin, B. Stable isotopes of soil water: Implications for soil water and shallow groundwater recharge in hill and gully regions of the Loess Plateau, China. Agric. Ecosyst. Environ. 2017, 243, 1–9. [Google Scholar] [CrossRef]
- David, K.; Timms, W.; Hughes, C.E.; Crawford, J.; Mcgeeney, D. Application of the pore water stable isotope method and hydrogeological approaches to characterise a wetland system. Hydrol. Earth Syst. Sci. 2018, 22, 6023–6041. [Google Scholar] [CrossRef] [Green Version]
- Bowen, G.J.; Kennedy, C.D.; Liu, Z.F.; Stalker, J. Water balance model for mean annual hydrogen and oxygen isotope distributions in surface waters of the contiguous United States. J. Geophys. Res. Biogeosci. 2011, 116, 1–14. [Google Scholar] [CrossRef] [Green Version]
- Skrzypek, G.; Mydłowski, A.; Dogramaci, S.; Hedley, P.; Gibson, J.J.; Grierson, P.F. Estimation of evaporative loss based on the stable isotope composition of water using Hydrocalculator. J. Hydrol. 2015, 523, 781–789. [Google Scholar] [CrossRef] [Green Version]
- Skrzypek, G.; Mydlowski, A.; Dogramaci, S.; Hedley, P.; Gibson, J.; Grierson, P. Calculations of evaporative losses using stable water isotope composition in dry climates. In Proceedings of the EGU General Assembly Conference, Vienna, Austria, 27 April–2 May 2014. [Google Scholar]
- Zhang, X.; Xiao, Y.; Wan, H.; Deng, Z.M.; Pan, G.Y.; Xia, J. Using stable hydrogen and oxygen isotopes to study water movement in soil-plant-atmosphere continuum at Poyang Lake wetland, China. Wetl. Ecol. Manag. 2016, 25, 221–234. [Google Scholar] [CrossRef]
- Beyer, M. Quantitative Studies along the Soil–Vegetation–Atmosphere Interface of Water–Limited Environments: Practice-Oriented Approaches based on Stable Water Isotopes, Modeling and Multivariate Analysis. Ph.D. Thesis, Technische Universität Braunschweig, Braunschweig, Germany, 2016. [Google Scholar]
- Mou, Y.; Fan, T.; Hu, H.H. Stable isotope analysis of soil water sources and migrations under different microhabitats in karst forest-lake basin of southeast Yunnan Province. J. Fujian Agric. For. Univ. 2020, 49, 540–549. (In Chinese) [Google Scholar]
- Li, F.D.; Song, X.F.; Tang, C.Y.; Liu, C.M.; Yu, J.J.; Zhang, W.J. Tracing infiltration and recharge using stable isotope in Taihang Mt., North China. Environ. Geol. 2007, 53, 687–696. [Google Scholar] [CrossRef]
- Liu, J.; Nie, Z.L.; Duan, B.Q.; Tian, Y.L.; Liu, F.L.; Zhang, L. Characteristics of stable isotope (δ2H and δ18O) in soil water in Hohhot area. J. Arid Land Resour. Environ. 2016, 30, 145–150. (In Chinese) [Google Scholar]
- Awaleh, M.O.; Baudron, P.; Soubaneh, Y.D.; Boschetti, T.; Hoch, F.B.; Egueh, N.M.; Mohamed, J.; Dabar, O.A.; Masse-Dufresne, J.; Gassani, J. Recharge, groundwater flow pattern and contamination processes in an arid volcanic area: Insights from isotopic and geochemical tracers (Bara aquifer system, Republic of Djibouti). J. Geochem. Explor. 2017, 175, 82–98. [Google Scholar] [CrossRef]
- Adomako, D.; Gibrilla, A.; Maloszewski, P.; Ganyaglo, S.Y.; Rai, S.P. Tracing stable isotopes (δ2H and δ18O) from meteoric water to groundwater in the Densu River basin of Ghana. Environ. Monit. Asses. 2015, 187, 1–15. [Google Scholar] [CrossRef] [PubMed]
- Li, H.S.; Wang, W.F.; Zhan, H.T.; Qiu, F.; Zhang, Z.M.; Wu, F.S. The use of stable hydrogen and oxygen isotopes to determine the source of evaporation water in extremely arid areas. Acta Ecol. Sin. 2016, 36, 7436–7445. (In Chinese) [Google Scholar]
- Nonterah, C.; Xu, Y.X.; Osae, S.; Akiti, T.T.; Dampare, S.B. A review of the ecohydrology of the Sakumo wetland in Ghana. Environ. Monit. Assess. Int. J. 2015, 187, 1–14. [Google Scholar] [CrossRef]
- Ries, F.; Lange, J.; Schmidt, S.; Puhlmann, H.; Sauter, M. Recharge estimation and soil moisture dynamics in a Mediterranean, semi-arid karst region. Hydrol. Earth Syst. Sci. 2015, 19, 1439–1456. [Google Scholar] [CrossRef] [Green Version]
- Yong, L.L.; Zhu, G.F.; Wan, Q.Z.; Xu, Y.X.; Zhang, Z.X.; Sun, Z.G.; Ma, H.Y.; Sang, L.Y.; Liu, Y.W.; Guo, H.W. The soil water evaporation process from mountains based on the stable isotope composition in a headwater basin and northwest China. Water 2020, 12, 2711. [Google Scholar] [CrossRef]
- Mathieu, R.; Bariac, T. An isotopic study (2H and 18O) of water movements in clayey soils under a semiarid climate. Water Resour. Res. 1996, 32, 779–790. [Google Scholar] [CrossRef]
- Piayda, A.; Dubbert, M.; Werner, C.; Cuntz, M. Stable oxygen isotope analysis reveal vegetation influence on soil water movement and ecosystem water fluxes in a semi-arid oak woodland. In Proceedings of the EGU General Assembly Conference, Vienna, Austria, 12–17 April 2015. [Google Scholar]
- Gaj, M.; Beyer, M.; Koeniger, P.; Wanke, H.; Hamutoko, J.; Himmelsbach, T. In situ unsaturated zone water stable isotope (2H and 18O) measurements in semi-arid environments: A soil water balance. Hydrol. Earth Syst. Sci. 2016, 20, 715–731. [Google Scholar] [CrossRef] [Green Version]
- Carmi, I.; Stiller, M.; Kronfeld, J. Dynamics of water soil storage in the unsaturated zone of a sand dune in a semi-arid region traced by humidity and carbon isotopes: The case of Ashdod, Israel. Radiocarbon 2018, 60, 1–9. [Google Scholar] [CrossRef]
- Germann, P.F.; Edwards, W.M.; Owens, L.B. Profiles of bromide and increased soil moisture after infiltration into soils with Macropores1. J. Soil Sci. Soc. Am. 1984, 48, 237–244. [Google Scholar] [CrossRef]
- Soulsby, C.; Braun, H.; Sprenger, M.; Weiler, M.; Tetzlaff, D. Influence of forest and shrub canopies on precipitation partitioning and isotopic signatures. Hydrol. Process. 2017, 31, 4282–4296. [Google Scholar] [CrossRef] [Green Version]
- Brodersen, C.; Pohl, S.; Lindenlaub, M.; Leibundgut, C.; Wilpert, K.V. Influence of vegetation structure on isotope content of throughfall and soil water. Hydrol. Process. 2000, 14, 1439–1448. [Google Scholar] [CrossRef]
- Liu, W.J.; Liu, W.Y.; Li, J.T.; Wu, Z.W.; Li, H.M. Isotope variations of throughfall, stemflow and soil water in a tropical rain forest and a rubber plantation in Xishuangbanna, SW China. Hydrol. Res. 2008, 39, 437–449. [Google Scholar] [CrossRef]
- Rao, W.B.; Han, L.F.; Tan, H.B.; Wang, S. Isotope fractionation of sandy-soil water during evaporation–An experimental study. Isot. Environ. Health Studies 2017, 53, 313. [Google Scholar] [CrossRef] [PubMed]
- Oerter, E.J.; Bowen, G.J. Spatio-temporal heterogeneity in soil water stable isotopic composition and its ecohydrologic implications in semiarid ecosystems. Hydrol. Process. 2019, 33, 1724–1738. [Google Scholar] [CrossRef]
- Lonschinski, M.; Kn¨oller, K.; Merten, D.; Georg, B. Flow dynamics of groundwater and soil water in the former heap Gessenhalde at the uranium mining area of Ronneburg: A stable isotope approach. Hydrol. Process. 2011, 25, 861–872. [Google Scholar] [CrossRef]
- Yu, X.N.; Huang, Y.M.; Li, E.G.; Li, X.Y.; Guo, W.H. Effects of vegetation types on soil water dynamics during vegetation restoration in the Mu Us Sandy Land, northwestern China. J. Arid Land 2017, 9, 188–199. [Google Scholar] [CrossRef]
- Mahindawansha, A.; Külls, C.; Kraft, P.; Breuer, L. Estimating water flux and evaporation losses using stable isotopes of soil water from irrigated agricultural crops in tropical humid regions. Hydrol. Earth Syst. Sci. Discuss. 2019, 213, 1–28. [Google Scholar]
- Ma, J.Y.; Li, Z.B.; Ma, B.; Li, C.D.; Xiao, J.B.; Zhang, L.T. Effects of vegetation types in small watershedon soil water cycle in gully-slope land of loess region. Acta Ecol. Sin. 2020, 40, 1–9. (In Chinese) [Google Scholar]
Figure 1.
Sketch map of the study area and sample plots.

Figure 2.
Monthly variations of air temperature and precipitation (a) and soil water storage (b).

Figure 3.
Daily variations of δ18O, lc-excess (the difference between the value of δ2H and the location of the meteoric water line), and precipitation.
Figure 3.
Daily variations of δ18O, lc-excess (the difference between the value of δ2H and the location of the meteoric water line), and precipitation.

Figure 4.
Temporal variations of δ18O and lc-excess in soil water at different depths and groundwater (Arbor land: (a,b); Shrubland: (c,d); Grassland: (e,f)).
Figure 4.
Temporal variations of δ18O and lc-excess in soil water at different depths and groundwater (Arbor land: (a,b); Shrubland: (c,d); Grassland: (e,f)).


Figure 5.
The relationship between δ2H and δ18O in precipitation, soil water, and groundwater.


Table 1.
The basic information of the sampling plots.
| Vegetation Types | Sample Plot | Latitude and Longitude | Altitude (m) | Aspect | Major Plant Species | Cover Degree (%) |
|---|---|---|---|---|---|---|
| Arbor land | A-1 | 102°46′11″ E 23°5′37″ N | 2069.2 | E | Camellia pitardii, Schima khasiana, Castanopsis orthacanthus Franch, Alnus nepalensis D.Don | 80 |
| A-2 | 102°46′10″ E 23°5′37″ N | 2068.2 | 90 | |||
| A-3 | 102°46′11″ E 23°5′37″ N | 2057.1 | 85 | |||
| Shrubland | S-1 | 102°46′17″ E 23°5′44″ N | 1976.5 | E | Melastoma candidum, Clerodendrum bungei, Neolitsea homilantha, Melodinus suaveolens Champ. ex Benth. | 98 |
| S-2 | 102°46′18″ E 23°5′44″ N | 1968.1 | 98 | |||
| S-3 | 102°46′18″ E 23°5′45″ N | 1966.8 | 96 | |||
| Grassland | G-1 | 102°46′16″ E 23°5′57″ N | 1924.2 | E | Rostellularia procumbens, Phyllanthus urinaria, Achnatherum splendens | 90 |
| G-2 | 102°46′16″ E 23°7′27″ N | 1923.8 | 85 | |||
| G-3 | 102°46′16″ E 23°5′51″ N | 1921.5 | 90 |
Table 2.
The relationship between δ2H and δ18O in different water bodies.
| Water Bodies | Relationship between the Hydrogen and Oxygen Isotopes | R | P | Number of Samples | |
|---|---|---|---|---|---|
| Precipitation | δ2H = 7.67 δ18O + 7.87 | 0.968 | 0.000 | 99 | |
| Groundwater | δ2H = 5.96 δ18O − 6.55 | 0.968 | 0.001 | 13 | |
| Soil water | Arbor land | δ2H = 7.19 δ18O + 1.11 | 0.968 | 0.003 | 216 |
| Shrubland | δ2H = 7.19 δ18O + 0.36 | 0.973 | 0.002 | 216 | |
| Grassland | δ2H = 7.23 δ18O + 1.21 | 0.984 | 0.001 | 216 | |
Table 3.
Statistics list of stable isotopes in precipitation, soil water, and groundwater.
| Items | Annual | Dry Season | Wet Season | |||||
|---|---|---|---|---|---|---|---|---|
| δ18O (‰) | lc-Excess (‰) | δ18O (‰) | lc-Excess (‰) | δ18O (‰) | lc-Excess (‰) | |||
| Precipitation | −10.69 ± 3.65 | 0 ± 7.25 | −7.38 ± 2.42 | 1.25 ± 6.78 | −11.71 ± 3.56 | −0.96 ± 7.52 | ||
| Soil water | Arbor land | 0–10 cm | −8.79 ± 1.94 | −3.41 ± 2.49 | −7.77 ± 1.40 | −3.65 ± 3.30 | −9.82 ± 1.96 | −3.18 ± 1.62 |
| 10–20 cm | −9.59 ± 1.92 | −2.52 ± 2.88 | −8.66 ± 1.55 | −2.38 ± 2.32 | −10.53 ± 1.91 | −2.65 ± 3.59 | ||
| 20–40 cm | −10.13 ± 1.42 | −1.91 ± 1.55 | −9.46 ± 1.21 | −1.78 ± 2.98 | −10.84 ± 1.19 | −2.07 ± 1.93 | ||
| 40–60 cm | −10.26 ± 0.67 | −1.92 ± 2.40 | −9.83 ± 0.73 | −1.82 ± 5.22 | −11.06 ± 0.73 | −2.64 ± 1.69 | ||
| 60–80 cm | −10.64 ± 0.54 | −1.41 ± 2.43 | −10.44 ± 0.15 | −1.75 ± 2.62 | −10.44 ± 0.47 | −1.08 ± 2.42 | ||
| 80–100 cm | −10.11 ± 0.70 | −1.07 ± 3.92 | −9.86 ± 0.95 | −1.18 ± 1.06 | −10.36 ± 0.21 | −0.33 ± 2.30 | ||
| average | −9.92 ± 1.42 | −2.06 ± 2.74 | −9.34 ± 1.36 | −2.09 ± 3.04 | −10.51 ± 1.24 | −2.03 ± 2.44 | ||
| Shrubland | 0–10 cm | −8.24 ± 2.62 | −3.61 ± 3.64 | −6.54 ± 2.11 | −3.98 ± 5.50 | −9.94 ± 1.94 | −3.56 ± 3.25 | |
| 10–20 cm | −9.29 ± 2.26 | −3.27 ± 4.25 | −7.96 ± 1.78 | −3.94 ± 3.52 | −10.81 ± 1.97 | −2.96 ± 2.99 | ||
| 20–40 cm | −10.20 ± 1.32 | −3.16 ± 2.71 | −9.60 ± 0.87 | −3.67 ± 4.31 | −10.86 ± 1.29 | −2.55 ± 2.88 | ||
| 40–60 cm | −10.41 ± 1.15 | −3.07 ± 2.95 | −9.97 ± 1.52 | −3.17 ± 3.19 | −11.00 ± 0.79 | −2.38 ± 1.52 | ||
| 60–80 cm | −10.60 ± 0.58 | −1.62 ± 3.15 | −10.40 ± 0.21 | −2.12 ± 2.15 | −10.62 ± 0.26 | −1.11 ± 4.07 | ||
| 80–100 cm | −10.44 ± 0.57 | −2.10 ± 1.74 | −10.20 ± 0.53 | −2.58 ± 2.36 | −10.47 ± 0.82 | −1.61 ± 0.70 | ||
| average | −9.86 ± 1.78 | −2.80 ± 3.14 | −9.11 ± 1.89 | −3.24 ± 3.48 | −10.62 ± 1.28 | −2.36 ± 2.72 | ||
| Grassland | 0–10 cm | −7.58 ± 2.88 | −4.10 ± 4.86 | −5.71 ± 2.45 | −5.24 ± 6.49 | −9.45 ± 1.98 | −3.15 ± 2.87 | |
| 10–20 cm | −8.89 ± 2.28 | −2.29 ± 2.02 | −7.31 ± 2.09 | −2.96 ± 2.58 | −10.47 ± 1.04 | −2.17 ± 0.85 | ||
| 20–40 cm | −10.21 ± 1.48 | −2.16 ± 2.58 | −9.33 ± 1.49 | −2.70 ± 2.08 | −11.10 ± 0.83 | −1.88 ± 2.06 | ||
| 40–60 cm | −11.28 ± 0.50 | −1.86 ± 1.64 | −11.02 ± 0.47 | −2.11 ± 1.69 | −11.54 ± 0.40 | −1.52 ± 2.56 | ||
| 60–80 cm | −10.86 ± 0.60 | −1.82 ± 2.09 | −10.37 ± 0.41 | −2.03 ± 2.20 | −11.39 ± 0.85 | −1.56 ± 2.24 | ||
| 80–100 cm | −10.84 ± 0.85 | −1.40 ± 2.70 | −10.28 ± 0.35 | −1.17 ± 2.00 | −11.34 ± 0.22 | −0.77 ± 3.19 | ||
| average | −9.94 ± 2.09 | −2.27 ± 2.88 | −9.00 ± 2.35 | −2.42 ± 2.21 | −10.88 ± 1.22 | −2.12 ± 3.45 | ||
| Groundwater | −9.16 ± 0.55 | 1.19 ± 1.27 | −8.94 ± 0.66 | 1.55 ± 0.67 | −9.35 ± 0.38 | 0.78 ± 1.72 | ||
Note: The value is mean ± standard deviation.
Publisher’s Note: MDPI stays neutral with regard to jurisdictional claims in published maps and institutional affiliations. |
© 2020 by the authors. Licensee MDPI, Basel, Switzerland. This article is an open access article distributed under the terms and conditions of the Creative Commons Attribution (CC BY) license (http://creativecommons.org/licenses/by/4.0/).
Share and Cite
MDPI and ACS Style
Pu, H.; Song, W.; Wu, J. Using Soil Water Stable Isotopes to Investigate Soil Water Movement in a Water Conservation Forest in Hani Terrace. Water 2020, 12, 3520. https://doi.org/10.3390/w12123520
AMA Style
Pu H, Song W, Wu J. Using Soil Water Stable Isotopes to Investigate Soil Water Movement in a Water Conservation Forest in Hani Terrace. Water. 2020; 12(12):3520. https://doi.org/10.3390/w12123520
Chicago/Turabian StylePu, Huimei, Weifeng Song, and Jinkui Wu. 2020. "Using Soil Water Stable Isotopes to Investigate Soil Water Movement in a Water Conservation Forest in Hani Terrace" Water 12, no. 12: 3520. https://doi.org/10.3390/w12123520
Note that from the first issue of 2016, this journal uses article numbers instead of page numbers. See further details here.