Changes in the Compound Drought and Extreme Heat Occurrence in the 1961–2018 Period at the European Scale


Faculty of Civil and Geodetic Engineering, University of Ljubljana, Jamova Cesta 2, 1000 Ljubljana, Slovenia
*
Author to whom correspondence should be addressed.
Water 2020, 12(12), 3543; https://doi.org/10.3390/w12123543
Submission received: 12 November 2020
/
Revised: 8 December 2020
/
Accepted: 13 December 2020
/
Published: 16 December 2020
(This article belongs to the Section Hydrology)
Abstract
:Compound extreme weather events can cause large economic damage and endanger human lives. Therefore, identification of changes in such compound event frequency and magnitude is important information that could be useful for decision makers and practitioners in water management and agriculture sector. This is especially the case for dry hazards that can be significantly influenced by the increasing air temperature and can have significant impact on water availability and consumption as well as on agricultural production. This study investigated changes in the compound occurrence of drought and extreme heat at the European scale using Uncertainties in Ensembles of Regional Reanalyses (UERRA) regional reanalysis data for the 1961–2018 period. The effective drought index (EDI) and the air temperature percentile threshold were used for the identification of the compound events at the catchment scale where entire Europe was divided into more than 4000 catchments. The results revealed multiple hotspots of compound drought and extreme heat events such as parts of Western Europe, Italy, Balkan Peninsula and Northern and Eastern Europe. At the continental scale, no uniform trend pattern could be detected. However, multiple areas with either positive or negative changes were identified. A positive change was characteristic for parts of Western Europe, Italy, Balkan Peninsula, etc. In these cases, the trend was mostly driven by the decreasing total precipitation trend and was not directly affected by the increasing air temperature trend. Areas with negative changes include parts of Northern and Eastern Europe and British Isles. In these cases, the detected trend was mostly driven by an increasing total precipitation trend. However, local drivers could be different.
1. Introduction
Investigations of compound events have gained significant attention of the research community in recent years [1,2,3,4,5,6]. Compound events are caused by the simultaneous occurrence of multiple climate hazards or drivers and lead to environmental and societal risk [6]. According to the recent typology definition of compound events [6], multiple cases can be defined as compound events, e.g., preconditioned events such as rain-on-snow floods [7,8] or multivariate events such as compound drought, heatwave and fire occurrence [5]. Moreover, events can also be described as being temporally compound such as a sequence of events [5,9] and spatially compound such as a simultaneous occurrence of floods at large scales [10].
Since most studies have focused on a single hazard rather than on multiple hazards, especially at regional or continental scales, more focus should be placed on to the investigation of the simultaneous occurrence of different hazards at larger scales [5,11,12]. Especially because dry hazards, such compound drought and extreme heat occurrence, can have a significant effect on agricultural production or forest fires. Indeed, some recent studies have investigated compound events at the continental scale [3,5,13,14,15]. For example, Sutanto et al. [5] recently investigated the characteristics of the compound and cascade occurrence of droughts, heatwaves and fires in Europe. They investigated the characteristics of the compound events in the last 30 years, but they have not addressed the temporal changes in the characteristics of these events and have focused only on the summer season. Moreover, Hao et al. [15] investigated changes in the severity of the compound hot extremes and droughts at global scale. However, the spatial data resolution used was 0.5° and they used monthly data. Additionally, they focused on the warm season where this was defined based on the hottest three-month period. Due to climate change (and increasing air temperature and change in precipitation patterns) the probability of dry hazards is expected to increase [16,17,18,19], which could have an effect on the critical infrastructure and agriculture [18]. Therefore, detection of changes is of general interest for decision makers and the general public. Especially because such compound events can cause large economic damage and even endanger thousands of lives [20,21], while millions of people worldwide are exposed to two or more hazards [5]. Therefore, the main aim of this study was to investigate changes in the simultaneous occurrence of droughts and extreme heat in the 1961–2018 period at the pan-European scale using high spatial resolution data at a daily time scale. Thus, compared to previously published studies [5,15], this study uses longer time period and different type of input data [5] and uses higher spatial resolution data at daily time scale [15]. Moreover, previous studies only focused on summer or warm-period [5,15]. However, it is important to investigate drought and heat conditions that can also occur in autumn and spring in parts of Europe since some plants such as trees can respond to drought conditions at longer time scales (e.g., more than 5 months) [22]. In this study, a compound event (i.e., day) was defined as a simultaneous occurrence of two events on the same day and in the same region [5,23]. Additionally, sensitivity analysis regarding the selection of the thresholds used for the drought and extreme heat was carried out. As input daily air temperature and precipitation data derived from the Uncertainties in Ensembles of Regional Reanalyses (UERRA), regional reanalysis was used [24,25,26]. All the calculations were done at the catchment scale (i.e., 7th Pfafstetter level) using the HydroSHEDS database [27,28].
2. Data and Methods
To investigate the changes in the compound drought and extreme heat occurrence, the UERRA regional reanalysis dataset was used together with the HydroSHEDS (a suite of geo-referenced datasets in raster and vector format available at https://hydrosheds.org/) catchment areas. The investigation of changes was made at the catchment scale where Europe was divided into more than 4000 catchments. Effective drought index (EDI) and percentile method were used for identifying droughts and extreme heat occurrence, respectively [5,29].
2.1. UERRA and HydroSHEDS Datasets
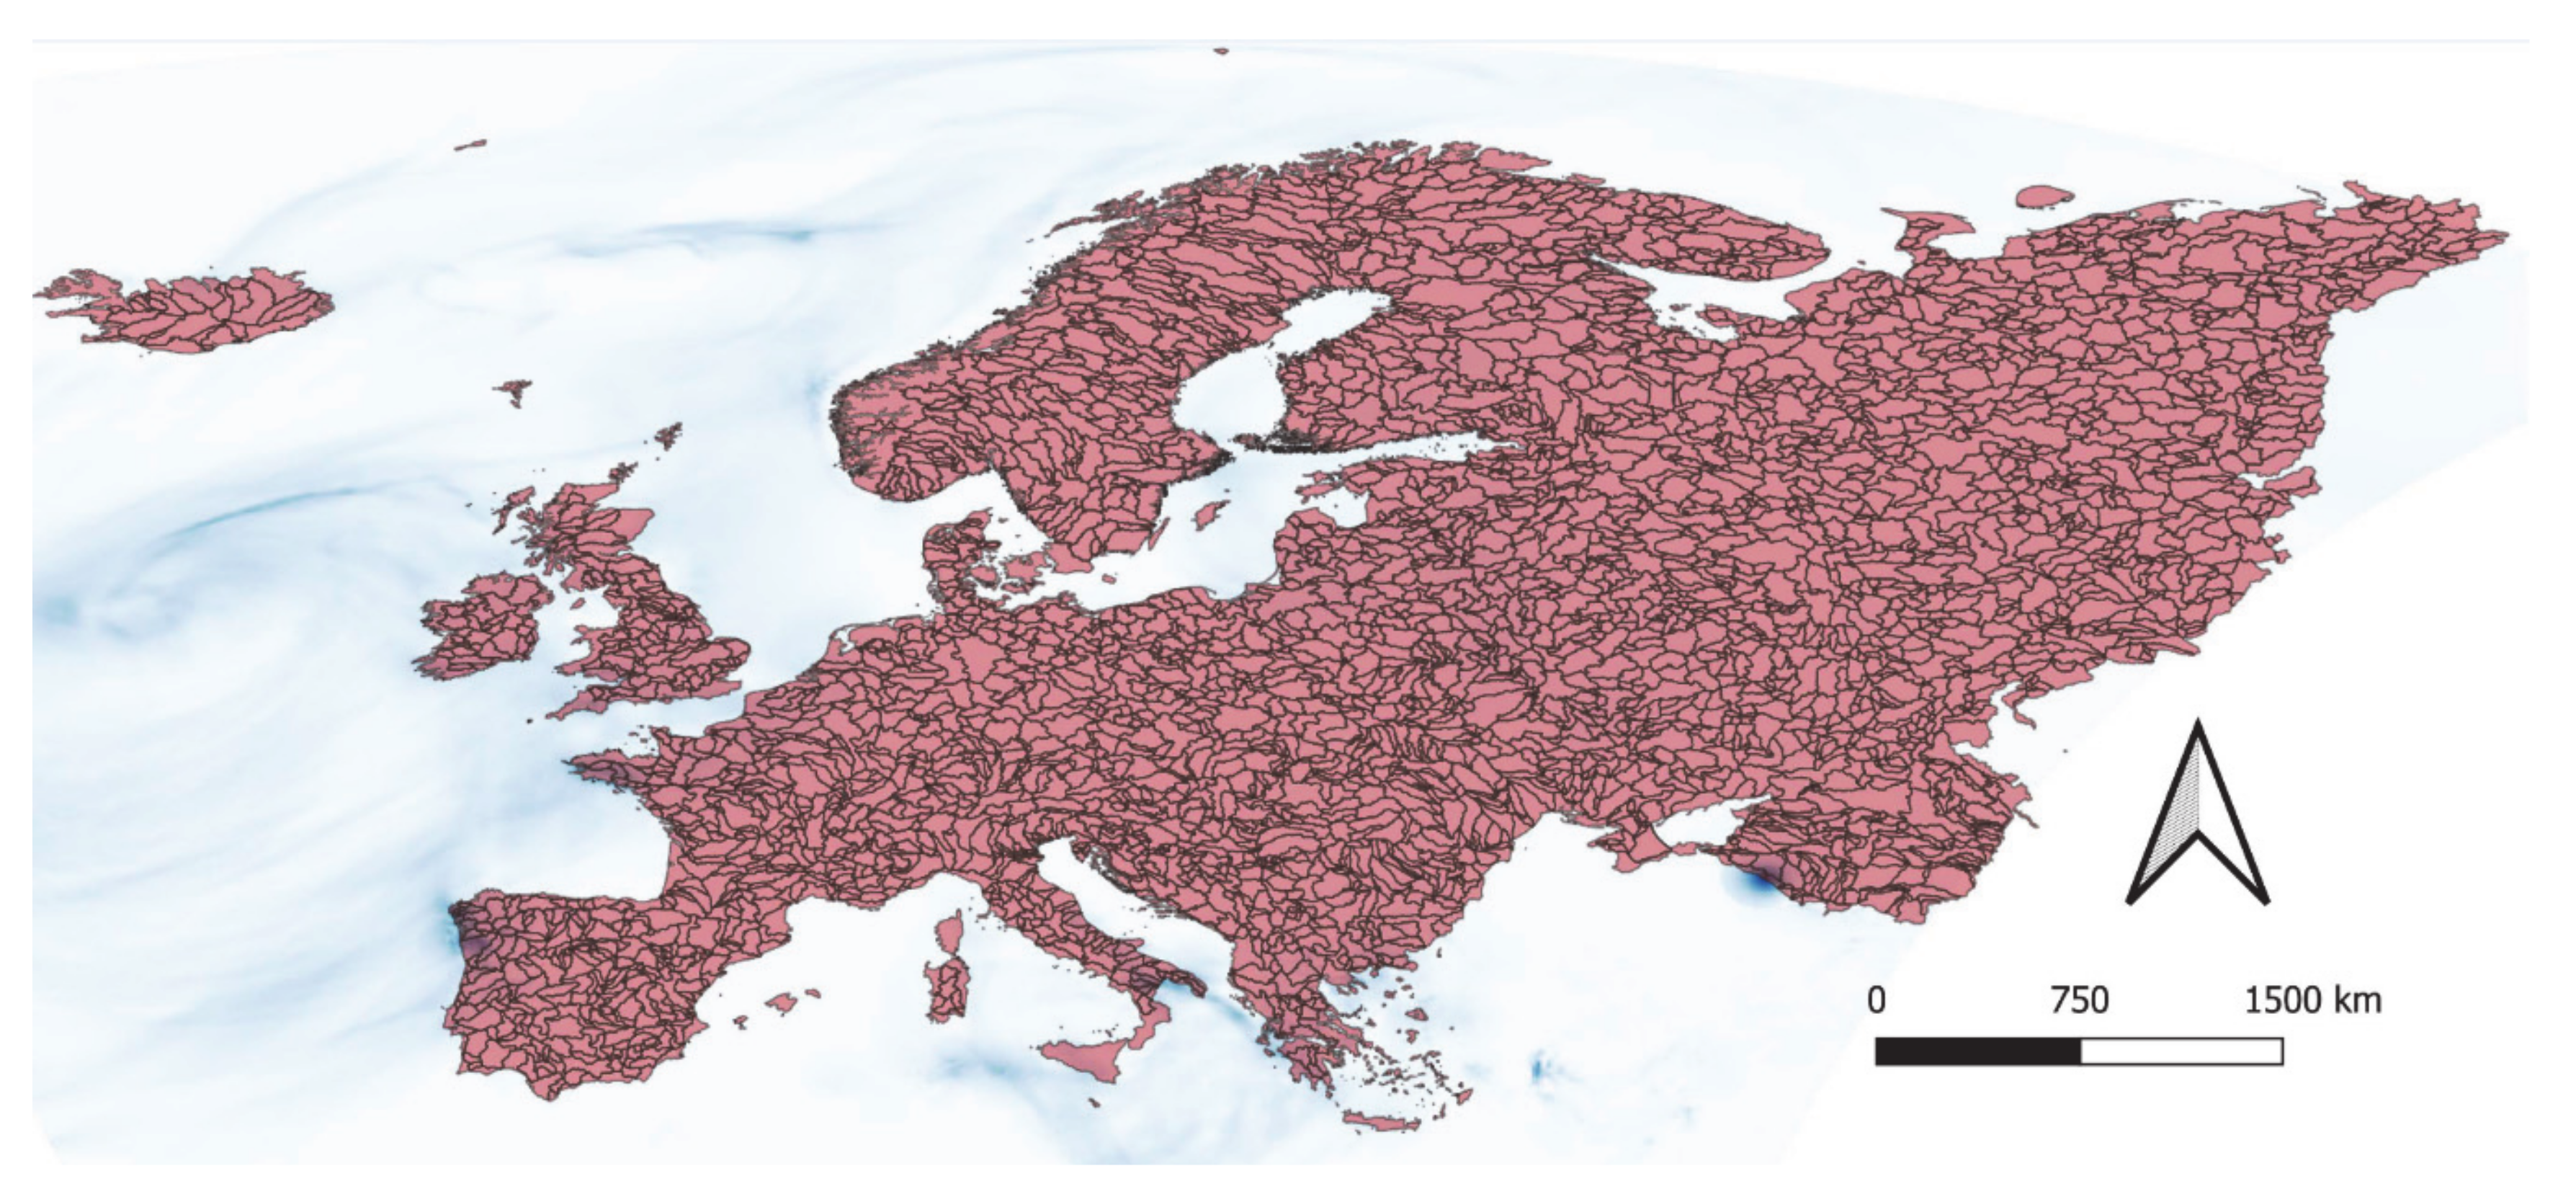
The Uncertainties in Ensembles of Regional Reanalyses (UERRA) regional reanalysis dataset was used in this study [24,25,26]. More specifically, the daily total precipitation and 2-m temperature were used. The total precipitation represents all types of precipitation accumulated over 24 h at a grid cell. 2-m temperature is grid-cell air temperature at 2 m above ground. The UERRA (i.e., MESCAN-SURFEX) calculation domain covers an area between northern Africa and the northern tip of Scandinavia and between Ural and goes far into the Atlantic Ocean (https://cds.climate.copernicus.eu/) (Figure 1). Horizontal resolution is 5.5 by 5.5 km. The UERRA regional reanalysis dataset includes its own uncertainties (e.g., measuring network changes across time and space) but it was shown that it has an adequate probabilistic capability and can capture small scale features [24,30]. Therefore, the selected dataset can be regarded as one of the best available high spatial and temporal resolution datasets covering the pan-European scale. The focus of this study was the 1961–2018 period.
Investigation of changes in the compound drought and extreme heat occurrence was performed at the catchment scale. For this purpose, the HydroSHEDS dataset was used [27,28]. In order to reduce the computational requirements, the calculations were performed using catchment boundaries derived at the 7th Pfafstetter level [27,28]. For the investigated area, this yields more than 4000 catchment areas with a mean catchment area of around 2400 km2 (Figure 1). Using the 8th Pfafstetter level would yield a much larger number of catchment areas (i.e., around 14,000 with mean catchment area of around 150 km2) and using the 6th Pfafstetter level would yield a smaller number of catchment areas (i.e., around 1250 with a mean catchment area of around 8500 km2). Thus, it was decided that the 7th Pfafstetter level is the optimal selection with the aim to capture also the meso-scale patterns in the compound drought and extreme heat occurrence at the pan-European scale. Mean conditions over the catchment boundary for specific days were considered, using catchment-average values for temperatures and rainfall totals.
2.2. Drought Definition
There are multiple indices available for the investigation of drought characteristics [31,32,33,34]. However, most of the indices do not use daily data but rather focus on the monthly or even annual data, which is a positive characteristic in data sparse areas [31,34]. Since daily data were available and used in the presented study it was decided to select an index that determines drought events based at the daily time step. Therefore, the effective drought index (EDI), which was proposed by Byun and Wilhite [29], was used in this study [35]:
where Pi is precipitation m − 1 days before the current day, is the mean of all effective precipitation (EP) values, DEP are deviations from the mean of effective precipitation EP, and SD(DEP) is the standard deviation of DEP [29,32,35]. N is the duration of the antecedent precipitation considered in the calculation. Previous studies have most frequently used 365 days, which means that for the calculation of daily EDI precipitation data from the previous 365 days are needed [31,35]. In our case, this means that the entire year of 1961 is considered as the antecedent precipitation input for the EDI for 1 January 1962. It was argued that 365 days is the most commonly used precipitation cycle worldwide [29,35], although it is obvious that EDI results depend on this selection (i.e., N value). Therefore, in this study 15 days, 180 days and 365 days were used as N in order to test the sensitivity of the results. Fifteen days was also used by Byun and Wilhite [29] and 180 days was used as a value between 15 and 365 days. Another step that was made is the definition of the drought severity. The following definition was proposed by Byun and Wilhite [29]: extreme drought if , severe drought if , moderate drought if . Moreover, near normal conditions are observed when EDI is between 1 and −1 [29,35].
2.3. Extreme Heat Definition
Similarly as in the case of droughts, there are multiple methods available for the definition of the heatwave; nevertheless, none of the methods can be regarded as general at the continental or global scales [5,36,37,38]. Therefore, in this study, the 90th percentile value concept was applied in order to define the extreme heat day [5,38]. However, since only mean air temperature data are available in the UERRA regional reanalysis, the extreme heat day was defined as the day where the air temperature exceeds the 90th percentile value. Additionally, the sensitivity of this selection was investigated and the 95th and 80th percentile values were also tested. When an extreme heat day is identified for several (i.e., n) continuous days, this can be regarded as an n-day heatwave.
2.4. Investigation of Changes
In this study, the compound event (i.e., day) was defined as the simultaneous drought and extreme heat occurrence at the same day at a specific catchment. By such a definition of a compound event, also 1-day compound events were taken into consideration that were not necessarily detected during n-day heat waves. Multiple combinations of EDI and air temperature percentile values were tested:
- -
- A compound day was defined as the case when EDI was smaller than −1.5 (i.e., severe drought) and the air temperature was higher than the 90th percentile (basic case);
- -
- A compound day was defined as the case when EDI was smaller than −2 (i.e., extreme drought) and the air temperature was higher than the 95th percentile (extreme case);
- -
- A compound day was defined as the case when EDI was smaller than −1 (i.e., moderate drought) and the air temperature was higher than the 80th percentile (mild case).
All the calculations were repeated using 15, 180, and 365 days antecedent precipitation values (N) that were used for the EDI calculation. This kind of investigation, as a result, yielded the number of days per year that are identified as a compound drought and extreme heat occurrence at the catchment scale. Such compound events may well appear not only during heat waves. For further analysis, the mean and maximum annual numbers of compound days were used. The Mann–Kendall test was applied in order to test if there are significant changes in the compound occurrence of drought and extreme heat in Europe [39,40]. The Mann–Kendall test is one of most frequently applied methods for detecting changes in the environmental data series [38,41,42]. A significance level of 0.05 was used to identify statistically significant trends. Additionally, the slope of the fitted linear regression model was used to identify the rate of change per decade. It should be noted that there are also other trend tests available such as Sen’s slope estimator [43,44].
3. Results and Discussion
3.1. Characteristics of the Compound Drought and Extreme heat
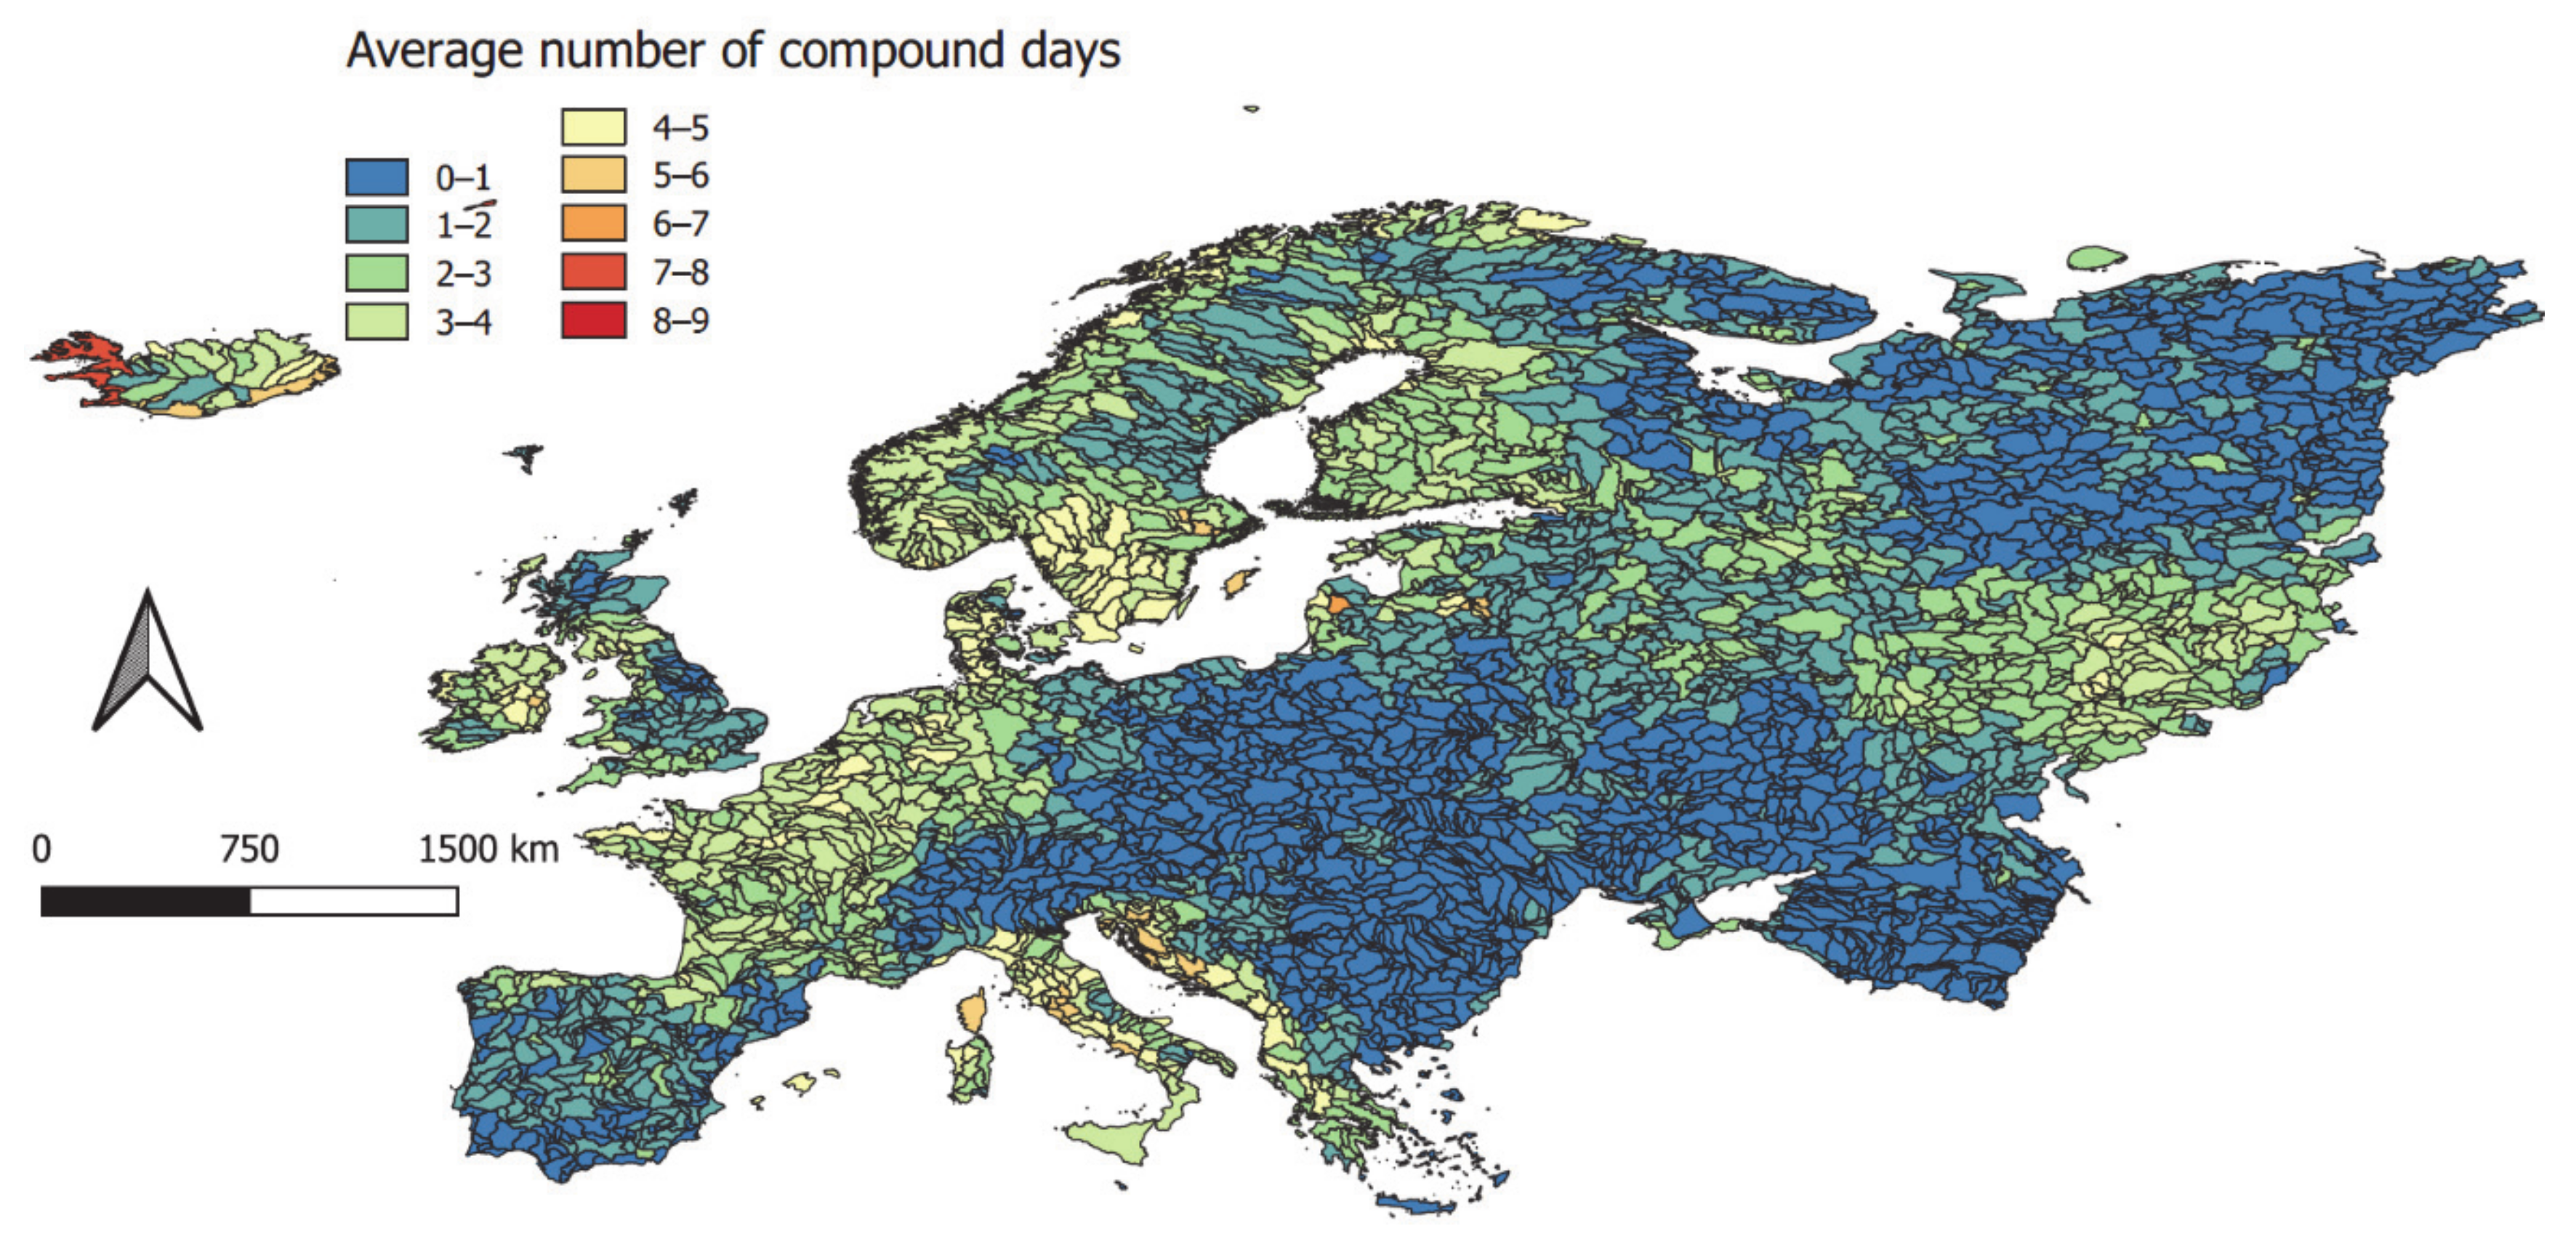
Firstly, the investigation of the basic case using the 365-day precipitation interval (N) was carried out. Figure 2 shows the mean annual number of days with a compound occurrence of drought and extreme heat according to the selected definition. The map shown in Figure 2 was visually (qualitatively) compared with the hotspot map of compound drought and heatwave occurrence that was produced by Sutanto et al. [5]. The previously mentioned study that focused only on summer 1990–2018 also identified most of Italy (e.g., Sardinia), Balkan Peninsula (e.g., Dalmatian coast), parts of Western Europe (e.g., France, Benelux countries), parts of Northern Europe, etc. as hotspots of compound dry hazards. Moreover, map shown in Figure 2 can be regarded as a hotspot map since the average number of compound days depends on the selected thresholds (i.e., EDI, percentile threshold and antecedent precipitation). Therefore, a relatively good visual agreement can be detected in the previously mentioned areas. However, there are regions, such as parts of Eastern Europe (i.e., Hungary, parts of Ukraine), where discrepancies between the two approaches were larger. The main reason was because Sutanto et al. [5] applied a different methodology and did not use the same input data and focused only on part of the year (i.e., 1990–2018). For example, soil moisture data were used in order to identify drought conditions [5]. Additionally, the maps that show the maximum number of compound days (Figure S1) and the number of years with at least one compound day (Figure S2) for the basic case and N = 365 days (Section 2) were also derived. The maximum number of compound days in a specific year can be identified in parts of Eastern Europe, Italy, Western Europe and Northern Europe. In these cases, the maximum number of compound days can exceed 2 months, which means that heatwaves can also be identified and compound dry hazards can also occur in other parts of the year and not just in summer (Figure S1). Additionally, one can also notice that at least one compound day per year most frequently occurred in Northern Europe whereas in Eastern Europe the number of years was generally below five (Figure S2). This means that there were five years in which at least one compound day was identified in the investigation period (i.e., 1961–2018). A direct comparison of the map shown in Figure 2 with the results of an analysis of top ten European heatwaves since 1950 [45] shows only a general agreement with the areas that were hit in the period 1950–2014 by a heatwave (using a novel HWMI—heat wave magnitude index: Russia 2010, France 2003, Finland 1972, British Isles 1976, Norway 1969, Southern Europe 2007, etc.). A better agreement is achieved looking at the average number of extreme compound days, presented in Figure S7. Thus, this map identifies the area of the 2003 heatwave that was the most devastating in France as well as several other events such as July 1972 heat in Helsinki or July 2010 heat wave that occurred in Russia [45]. Thus, relatively good qualitatively agreement between both studies can be identified.
3.2. Changes in the Compound Drought and Extreme heat Occurrence
Based on the annual number of days with a compound occurrence of drought and extreme heat, changes in the annual series for all investigated catchments were also identified (1961–2018). Using the Pettitt test [46], the breakpoints in time series for analyzed catchments are spread all over the time period of 1961–2018 (Min. = 1 year, Max. = 56 years, 1st Quartile = 20 years and 3rd Quartile = 38 years), with the mean and median value of ~30 years, i.e., the mean turning point is around 1991–1992. The breakpoint is statistically significant for only 1–2% of the catchments (i.e., significance level of 0.05). Thus, this indicates that in only small number of cases the detected turning point is statistically significant. Therefore, no single significant turning point (calendar year) could be detected in the analyzed data at the pan-European level.
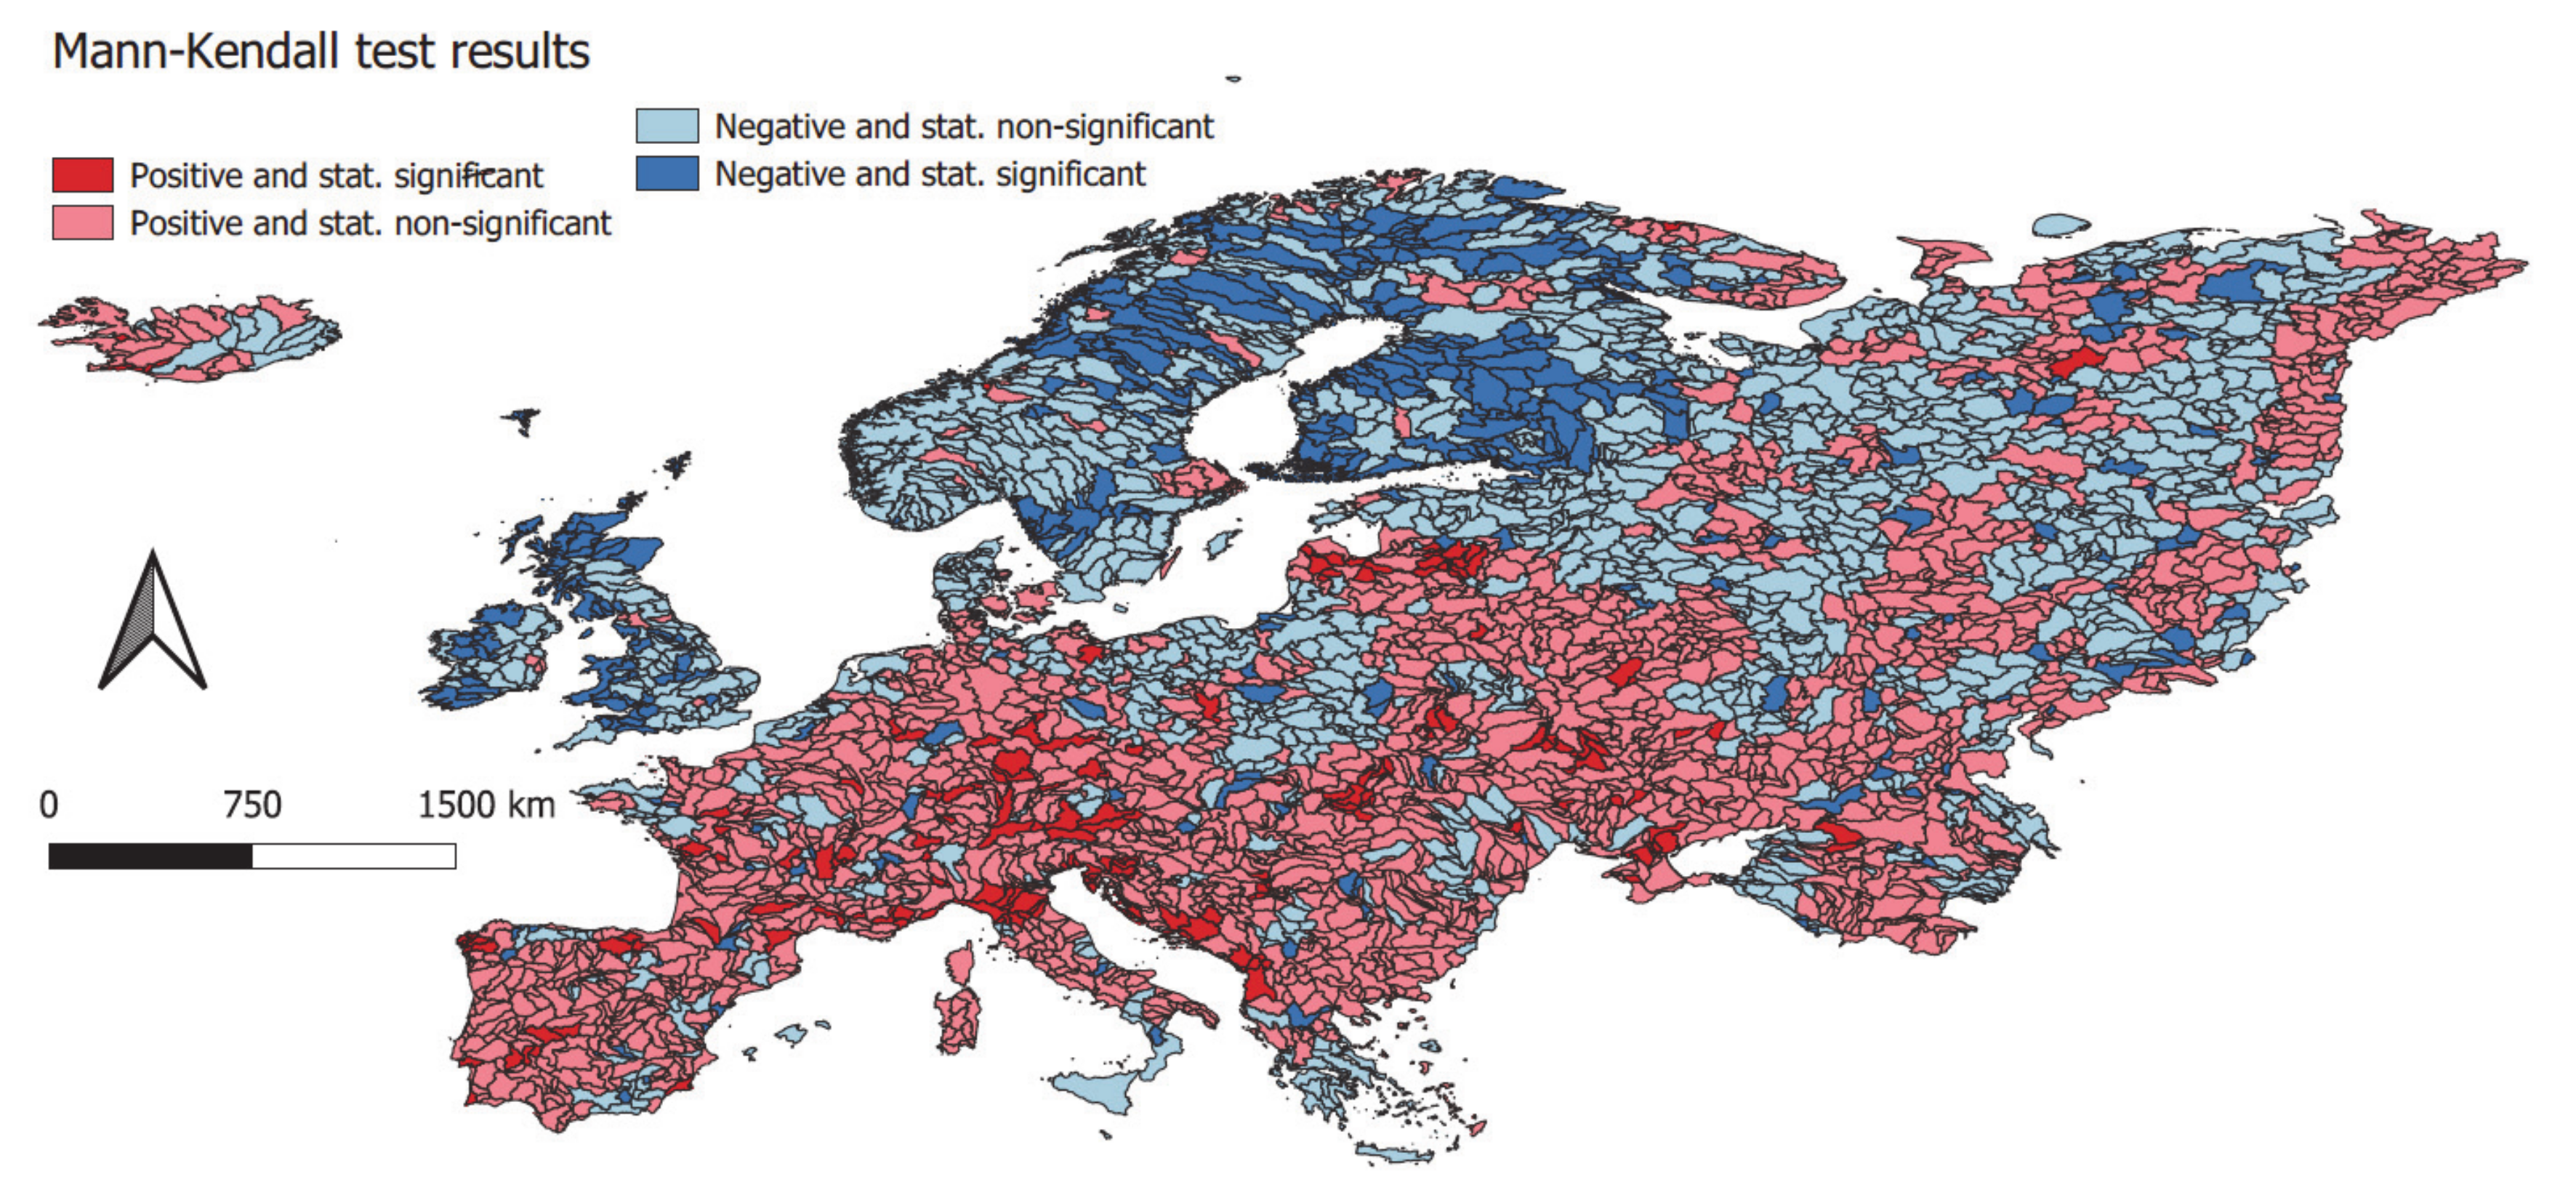
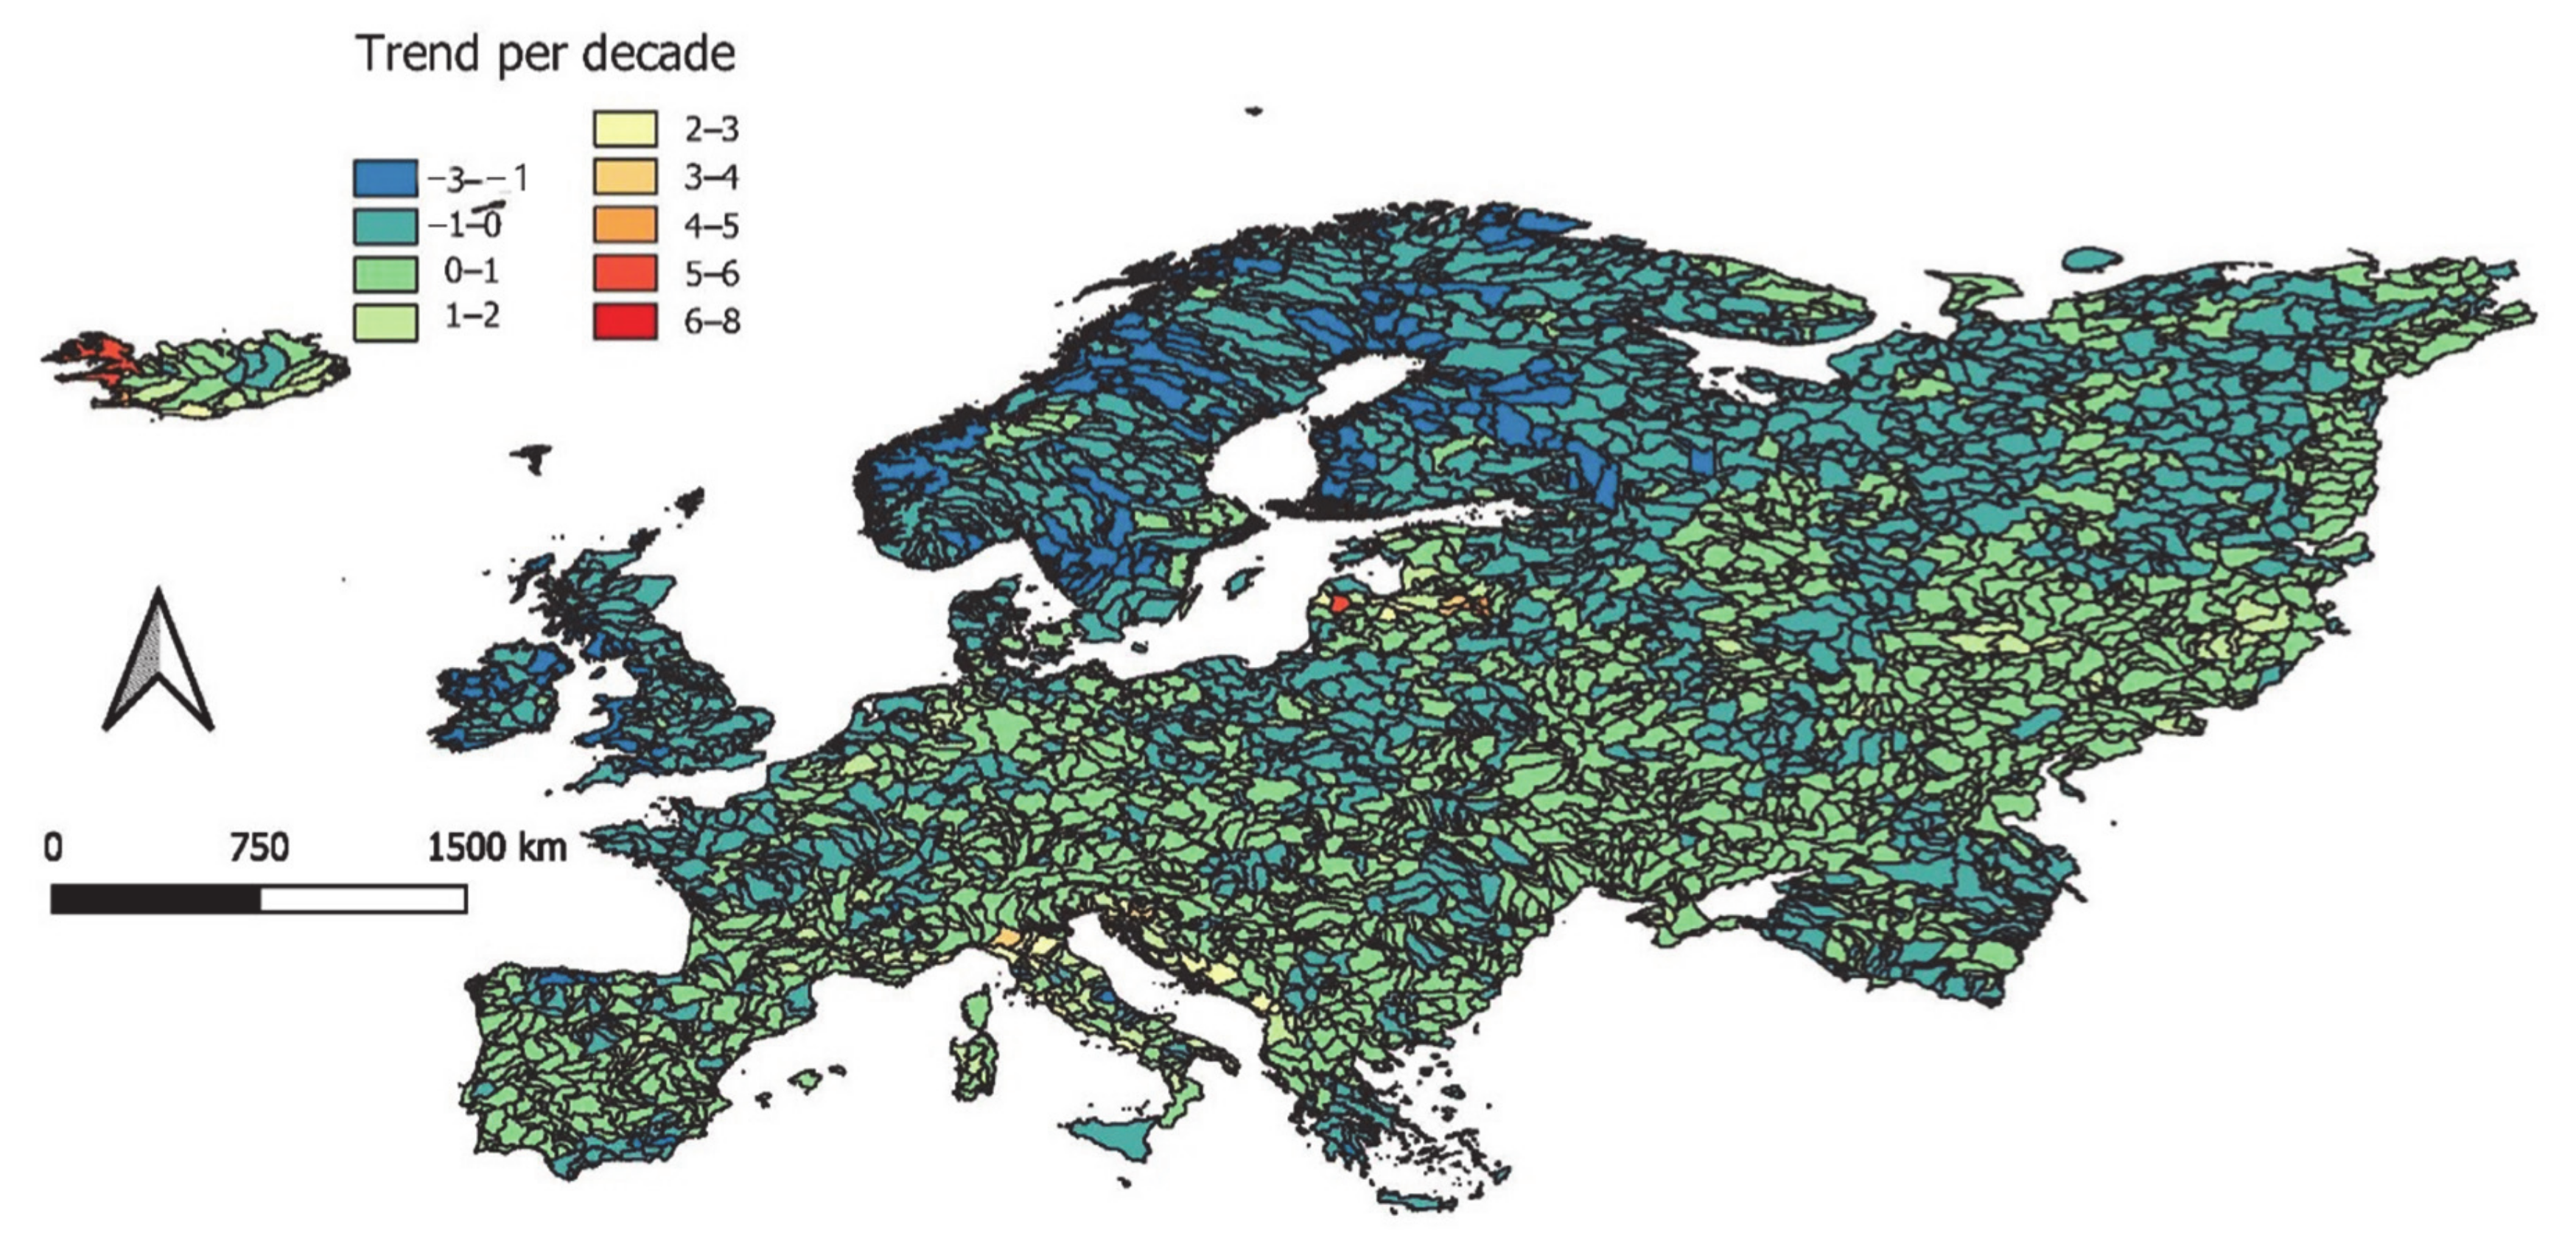
Figure 3 and Figure 4 show Mann–Kendall trend results and trend per decade for the 1961–2018 period. A positive trend was detected for Southern Europe, most of Western and Central Europe and parts of Eastern Europe (Figure 3 and Figure 4). Negative change was detected for most of Northern Europe, British Isles and parts of Eastern Europe (Figure 3 and Figure 4). More specifically, there were around 5% and 7% of catchments with positive and negative statistically significant trends, respectively (Figure 3). Furthermore, there were around 50% and 38% of positive and negative non-significant trends, respectively (Figure 3). Thus, a slightly larger percent of catchments was characterized by a positive change. Although it should be noted that the percentage of statistically significant trends was relatively low. In terms of the area, around 4% of the total area was characterized by a positive statistically significant trend and around 12% by a negative statistically significant trend. Moreover, around 48% and 52% of the area was characterized by positive and negative trends, respectively. Furthermore, some areas with a high average number of compound days (e.g., Western Europe, Italy, Balkan Peninsula) were characterized by a positive change (Figure 2 and Figure 3). On the other hand, Northern Europe was mostly characterized by a negative change (Figure 2 and Figure 3). If the results shown in Figure 3 and Figure 4 are visually compared to the maps presented by Hao et al. [15], one can notice a relatively good visual agreement for the areas with a positive change in the compound occurrence of drought and heat conditions. Disagreement with the results presented by Hao et al. [15] can be seen for Great Britain and parts of Northern Europe. Compared to Hao et al. [15] the results of this study are based on the daily data and provide details for specific catchments, which could be useful for practitioners such as water resources managers and did not focus only on the warm-period. Moreover, in areas with non-significant seasonal air temperature pattern, compound extremes can also occur in other months and not just in the warmest three-month period. A positive trend in the compound drought and extreme heat extreme occurrence was also observed in some other areas around the world such as parts of Africa, Asia, North and South America [13,15,47,48].
3.3. Impact of Precipitation and Air Temperature on Detected Changes
Since changes in the compound occurrence of drought and extreme heat are driven by the changes in precipitation and air temperature, trends in these two variables were also investigated (Figures S3 and S4). It is clear that the air temperature increased in the investigated period where the mean increase per decade was around 0.6 K (Figure S4). A more complex pattern can be observed for the precipitation trend. Precipitation increased for most of Northern Europe, British Isles and parts of Eastern Europe while it decreased for most of Western Europe and parts of Southern and Eastern Europe (Figure S3). Moreover, the mean change at the pan-European level was around zero. Thus, it should be noted that these were changes in the mean annual precipitation and the mean annual air temperature, while different regions can exhibit changes in seasonal patterns. These detected trends were in a relatively good visual agreement with the results published in previous studies [15,49,50]. Additionally, the mean Pearson correlation coefficient between the annual precipitation and the annual number of compound days for all catchments was around −0.4, which means that the number of compound days increased with decreasing precipitation. On the other hand, the mean Pearson correlation coefficient between the air temperature and the annual number of compound days for all catchments was around 0.1. Thus, it seems that a decrease in the compound occurrence of drought and extreme heat in, e.g., Northern Europe and British Isles was a consequence of increasing total precipitation. Thus, a precipitation increase was a dominant factor. Similarly, the positive changes detected in parts of Central, Western and Eastern Europe were mainly driven by the decreasing precipitation trend and perhaps (i.e., according to the mean correlations) to a much lesser extent by a positive trend in the air temperature (Figures S3 and S4). Furthermore, it should be noted that local drivers could be different and that in some areas changes in temperature could be more dominant.
3.4. Sensitivity of the Results
Additionally, investigation of the sensitivity of the results with respect to the parameters mentioned in Section 2.4 was also carried out (Table 1). Therefore, the calculations were repeated for the extreme and mild cases for three different values of N (i.e., 15, 180 and 365 days). Other researchers have used 90 days, but the data in Table 1 suggest that the relationship between N and the number of compound days can be quite well described using a linear function. Thus, estimation of the mean values for the 90 days interval could be done based on the results presented in Table 1. Using more extreme EDI and air temperature percentile thresholds yielded a smaller number of identified compound days (Table 1). On the other hand, using milder conditions for the identification of events yielded a larger number of compound days that can also occur in different seasons (Table 1). This applied for all three N values that were tested. The N value also had an important effect on the basic characteristics of the detected compound days (Table 1). For smaller N values, the average and maximum numbers of events decreased. The same can be said for the mean number of years for basic and extreme cases (Table 1). Thus, it is clear that the consideration of a shorter antecedent precipitation in the EDI calculation identified fewer events that can be regarded as potentially compound. Moreover, the parameters used for the compound day definition also had an impact on the detected changes in the compound occurrence of drought and extreme heat. For example, using the mild case (N = 365) yielded 62% and 38% of positive and negative trends, respectively (Figure S5). Additionally, the positive trend covered a slightly larger percent of the total area (i.e., 57% of the area where the statistically significant trend covers around 12% of the total area). Moreover, slightly smaller percentage of positive trends is characteristic of extreme case for N = 365 days (i.e., 33%) (Figure S6). However, it should be noted that in the extreme case there were around 1500 catchments where no compound event (i.e., day) could be identified in the selected period. It seems that a large portion of the catchments identified in the mild case as those with a positive change did not have any event detected in the extreme. A large number of catchments without any compound events was also identified for shorter time periods N. For example, for the basic case and N = 180 there were around 500 catchments without any identified events. Furthermore, in this case around 58% of trends were positive and 5% positive and statistically significant. Thus, in these cases the identification of trends should not be conducted. However, this information could be used for identifying areas where compound events were more severe (Figure S7), particularly parts of Western Europe, Italy, Balkan Peninsula, Northern Europe and some areas in Eastern Europe. Some of these areas were in the past hit by the extreme heat waves [45].
3.5. Study Limitations
Several limitations can be identified in relation to this study. As discussed, the regional UERRA reanalysis dataset contains its own uncertainties that also have an impact on the results in this study. As presented in the previous sub-section, the trend results are sensitive to the selected drought and extreme heat indices and their parameters. The sensitivity of the input parameters was addressed; nevertheless, the use of a different index for the drought or extreme heat definition would yield different results. Notably, there are not many drought indices developed that use daily data as an input. Additionally, application of soil-water characteristic data would also lead to different results. Furthermore, the detected trends depend on the number and size of the catchment areas. The impact of a different catchment delineation was outside of the scope of the study and needs to be investigated as a part of a new sensitivity study. Furthermore, an analysis of compound event hotspots at the European level would be interesting to perform if raster data would have been used as was done in the studies performed by [5,15]. Furthermore, use of a different dataset such as E-OBS gridded dataset (https://www.ecad.eu/download/ensembles/download.php) would probably yield different results. Thus, a comparison of multiple datasets would be useful in future.
3.6. Possible Applications
Information on compound extreme events at the European scale can be applied manifold, among others for a possible long-term forest management in areas hit hard by droughts according to selected climate scenarios or estimation of forest fire hazard in selected areas. This information can be used for planning of adequate surface water sources for firefighting in cases or real forest fires. The former case of application should consider that there are several (numerous) climate change scenarios that yield a large uncertainty (scatter) in extrapolating current climate conditions in an area under investigation to future conditions relevant for, e.g., forest management. The latter case of application is of more immediate use, especially since occurrence of large forest fires in the last decade threatens different parts of the world [51,52].
In Europe, the European Forest Fire Information System is available for early warnings on fires [53] that gives insight into the current fire hazard situation for the whole Europe [54] or looking into the archives of past situations. Long-term forecast is of interest for the spatial planning, and at European level, fire hazard should be incorporated into physical planning in regions under high forest fire risk. Moreira et al. [55] analyzed fire hazard conditions in the South Europe and its implications for landscape management. Syphard et al. [56] analyzed climate change and urbanization growth and concluded that land use planning should consider forest fires in order to decrease housing losses in fires. Moreno et al. [57] analyzed fire regime in Spain for the period 1968–2010 and concluded that for fire safety landscape architecture and forest management are critical factors. Keeley and Syphard [58] analyzed the impacts of rising temperatures and changing precipitation on ecosystems. Especially vulnerable are mountain forest ecosystems in spring and autumn, for lowland ecosystems more than climate change the urbanization is a responsible factor for future fires. Such conclusions found a way to adapt to increasing threats of forest fires. Galiana-Martin [59] analyzed urban areas in the European part of the Mediterranean and found out increasing vulnerability of this area to natural forest fires. In order to decrease fire hazards of built environment, land-use planning and spatial, i.e., urban planning is of special importance. One may conclude that the presented maps of compound heat and drought events at the European scale will find different applications in water management, forest management and spatial and urban planning procedures at national and regional (local) level.
4. Conclusions
In the presented study, investigation of change in the compound occurrence of drought and heat conditions was carried out at the pan-European scale. The UERRA regional reanalysis dataset was used and the calculations were performed at the daily time scale where Europe was divided into more than 4000 catchments. Based on the presented results the following conclusions can be drawn:
- -
- Multiple hotspots of compound drought and extreme heat conditions were identified in Europe. These include, among others, France, Benelux countries, Italy, Balkan Peninsula, parts of British Isles and Eastern Europe and some areas in Northern Europe.
- -
- Trend detection revealed that some of these areas, such as parts of Western Europe, Italy, Balkan Peninsula, were characterized by an increasing trend in the compound occurrence of drought and heat extremes. On the other hand, a negative change was detected for most of Northern Europe and British Isles.
- -
- It can be argued that the negative trend was mostly driven by the increasing total precipitation trend and vice versa, while the positive trends detected in the compound drought and extreme heat occurrence could not be directly related to the increasing air temperature according to the mean conditions. However, local drivers could be different.
- -
- If the detected trends were averaged over the entire continent it can be argued that likely no uniform significant positive or negative changes would be identified. However, there were multiple areas where changes are statistically significant.
- -
- The identified changes were to some extent sensitive to the selection of the parameters used for the identification of compound days. However, the main spatial patterns of the detected trends were not significantly influenced by these parameters.
The analysis of compound events has gained a significant focus of the community in recent years, but there are still many open topics that could be investigated. For example, further investigations could focus on the consideration of additional variables such as soil moisture for identifying droughts or water shortage conditions and the concurrent compound events.
Supplementary Materials
The following are available online at https://www.mdpi.com/2073-4441/12/12/3543/s1, Figure S1: Maximum number of days with compound occurrence of drought and extreme heat according to the basic case and 365 days used as the antecedent precipitation (N), Figure S2: Number of years with at least one compound occurrence of drought and extreme heat according to the basic case and 365 days used as the antecedent precipitation (N), Figure S3: Annual precipitation trend per decade [mm] for the investigated period 1961–2018, Figure S4: Air temperature trend per decade (K) for the investigated period 1961–2018, Figure S5: Mann–Kendall trend test results using mean annual number of days with compound occurrence of drought and extreme heat in the 1961–2018 period. Results for the mild case and N = 365 days are presented, Figure S6: Mann–Kendall trend test results using mean annual number of days with compound occurrence of drought and extreme heat in the 1961–2018 period. Results for the extreme case and N = 365 days are presented, Figure S7: Mean annual number of days with compound occurrence of drought and extreme heat according to the extreme case and 365 days used as the antecedent precipitation.
Author Contributions
Conceptualization, N.B. and M.M.; investigation, N.B.; writing—original draft preparation, N.B.; writing—review and editing, M.M. All authors have read and agreed to the published version of the manuscript.
Funding
The authors would like to acknowledge the financial support by the Slovenian Research Agency (ARRS) through research core funding No. P2-0180.
Acknowledgments
Authors would like to acknowledge M. Vilfan support with English editing.
Conflicts of Interest
The authors declare no conflict of interest.
References
- Poschlod, B.; Zscheischler, J.; Sillmann, J.; Wood, R.R.; Ludwig, R. Climate change effects on hydrometeorological compound events over southern Norway. Weather Clim. Extrem. 2020, 28. [Google Scholar] [CrossRef]
- Zscheischler, J.; Westra, S.; Van Den Hurk, B.J.J.M.; Seneviratne, S.I.; Ward, P.J.; Pitman, A.; Aghakouchak, A.; Bresch, D.N.; Leonard, M.; Wahl, T.; et al. Future climate risk from compound events. Nat. Clim. Chang. 2018, 8, 469–477. [Google Scholar] [CrossRef]
- Vogel, M.M.; Zscheischler, J.; Wartenburger, R.; Dee, D.; Seneviratne, S.I. Concurrent 2018 Hot Extremes Across Northern Hemisphere Due to Human-Induced Climate Change. Earth’s Future 2019, 7, 692–703. [Google Scholar] [CrossRef] [PubMed]
- Raymond, C.; Horton, R.M.; Zscheischler, J.; Martius, O.; AghaKouchak, A.; Balch, J.; Bowen, S.G.; Camargo, S.J.; Hess, J.; Kornhuber, K.; et al. Understanding and managing connected extreme events. Nat. Clim. Chang. 2020, 10, 611–621. [Google Scholar] [CrossRef]
- Sutanto, S.J.; Vitolo, C.; Di Napoli, C.; D’Andrea, M.; Van Lanen, H.A.J. Heatwaves, droughts, and fires: Exploring compound and cascading dry hazards at the pan-European scale. Environ. Int. 2020, 134. [Google Scholar] [CrossRef]
- Zscheischler, J.; Martius, O.; Westra, S.; Bevacqua, E.; Raymond, C.; Horton, R.M.; van den Hurk, B.; AghaKouchak, A.; Jézéquel, A.; Mahecha, M.D.; et al. A typology of compound weather and climate events. Nat. Rev. Earth Environ. 2020, 1, 333–347. [Google Scholar] [CrossRef]
- Sezen, C.; Šraj, M.; Medved, A.; Bezak, N. Investigation of rain-on-snow floods under climate change. Appl. Sci. 2020, 10, 1242. [Google Scholar] [CrossRef] [Green Version]
- Wachowicz, L.J.; Mote, T.L.; Henderson, G.R. A rain on snow climatology and temporal analysis for the eastern United States. Phys. Geogr. 2020, 41, 54–69. [Google Scholar] [CrossRef]
- Mikoš, M.; Četina, M.; Brilly, M. Hydrologic conditions responsible for triggering the Stože landslide, Slovenia. Eng. Geol. 2004, 73, 193–213. [Google Scholar] [CrossRef]
- Berghuijs, W.R.; Allen, S.T.; Harrigan, S.; Kirchner, J.W. Growing Spatial Scales of Synchronous River Flooding in Europe. Geophys. Res. Lett. 2019, 46, 1423–1428. [Google Scholar] [CrossRef] [Green Version]
- AghaKouchak, A.; Huning, L.S.; Mazdiyasni, O.; Mallakpour, I.; Chiang, F.; Sadegh, M.; Vahedifard, F.; Moftakhari, H. How do natural hazards cascade to cause disasters? Nature 2018, 561, 458–460. [Google Scholar] [CrossRef] [PubMed] [Green Version]
- Kappes, M.S.; Keiler, M.; von Elverfeldt, K.; Glade, T. Challenges of analyzing multi-hazard risk: A review. Nat. Hazards 2012, 64, 1925–1958. [Google Scholar] [CrossRef] [Green Version]
- Mazdiyasni, O.; AghaKouchak, A. Substantial increase in concurrent droughts and heatwaves in the United States. Proc. Natl. Acad. Sci. USA 2015, 112, 11484–11489. [Google Scholar] [CrossRef] [PubMed] [Green Version]
- Vitolo, C.; Di Napoli, C.; Di Giuseppe, F.; Cloke, H.L.; Pappenberger, F. Mapping combined wildfire and heat stress hazards to improve evidence-based decision making. Environ. Int. 2019, 127, 21–34. [Google Scholar] [CrossRef] [PubMed]
- Hao, Z.; Hao, F.; Singh, V.P.; Zhang, X. Changes in the severity of compound drought and hot extremes over global land areas. Environ. Res. Lett. 2018, 13, 124022. [Google Scholar] [CrossRef]
- AghaKouchak, A.; Cheng, L.; Mazdiyasni, O.; Farahmand, A. Global warming and changes in risk of concurrent climate extremes: Insights from the 2014 California drought. Geophys. Res. Lett. 2014, 41, 8847–8852. [Google Scholar] [CrossRef] [Green Version]
- Forzieri, G.; Feyen, L.; Russo, S.; Vousdoukas, M.; Alfieri, L.; Outten, S.; Migliavacca, M.; Bianchi, A.; Rojas, R.; Cid, A. Multi-hazard assessment in Europe under climate change. Clim. Chang. 2016, 137, 105–119. [Google Scholar] [CrossRef] [Green Version]
- Forzieri, G.; Bianchi, A.; Silva, F.B.E.; Marin Herrera, M.A.; Leblois, A.; Lavalle, C.; Aerts, J.C.J.H.; Feyen, L. Escalating impacts of climate extremes on critical infrastructures in Europe. Glob. Environ. Chang. 2018, 48, 97–107. [Google Scholar] [CrossRef]
- Spinoni, J.; Naumann, G.; Vogt, J.V. Pan-European seasonal trends and recent changes of drought frequency and severity. Glob. Planet. Chang. 2017, 148, 113–130. [Google Scholar] [CrossRef]
- Robine, J.-M.; Cheung, S.L.K.; Le Roy, S.; Van Oyen, H.; Griffiths, C.; Michel, J.-P.; Herrmann, F.R. Death toll exceeded 70,000 in Europe during the summer of 2003. Comptes Rendus Biol. 2008, 331, 171–178. [Google Scholar] [CrossRef]
- Di Napoli, C.; Pappenberger, F.; Cloke, H.L. Assessing heat-related health risk in Europe via the Universal Thermal Climate Index (UTCI). Int. J. Biometeorol. 2018, 62, 1155–1165. [Google Scholar] [CrossRef] [PubMed] [Green Version]
- Pasho, E.; Camarero, J.J.; de Luis, M.; Vicente-Serrano, S.M. Impacts of drought at different time scales on forest growth across a wide climatic gradient in north-eastern Spain. Agric. For. Meteorol. 2011, 151, 1800–1811. [Google Scholar] [CrossRef]
- Leonard, M.; Westra, S.; Phatak, A.; Lambert, M.; van den Hurk, B.; Mcinnes, K.; Risbey, J.; Schuster, S.; Jakob, D.; Stafford-Smith, M. A compound event framework for understanding extreme impacts. Wiley Interdiscip. Rev. Clim. Chang. 2014, 5, 113–128. [Google Scholar] [CrossRef]
- Bach, L.; Schraff, C.; Keller, J.D.; Hense, A. Towards a probabilistic regional reanalysis system for Europe: Evaluation of precipitation from experiments. Tellus Ser. A Dyn. Meteorol. Oceanogr. 2016, 68, 32209. [Google Scholar] [CrossRef] [Green Version]
- Bazile, E.; Abida, R.; Verrelle, A.; Le Moigne, P.; Szczypta, C. Report for the 55 years of MESCAN-SURFEX re-Analysis; Météo-France/CNRS: Toulouse, France, 2017; 22p. [Google Scholar]
- Dahlgren, P.; Landelius, T.; Kållberg, P.; Gollvik, S. A high-resolution regional reanalysis for Europe. Part 1: Three-dimensional reanalysis with the regional HIgh-Resolution Limited-Area Model (HIRLAM). Q. J. R. Meteorol. Soc. 2016, 142, 2119–2131. [Google Scholar] [CrossRef]
- Lehner, B.; Verdin, K.; Jarvis, A. New global hydrography derived from spaceborne elevation data. Eos 2008, 89, 93–94. [Google Scholar] [CrossRef]
- Lehner, B.; Grill, G. Global river hydrography and network routing: Baseline data and new approaches to study the world’s large river systems. Hydrol. Process. 2013, 27, 2171–2186. [Google Scholar] [CrossRef]
- Byun, H.-R.; Wilhite, D.A. Objective quantification of drought severity and duration. J. Clim. 1999, 12, 2747–2756. [Google Scholar] [CrossRef]
- Kaiser-Weiss, A.K.; Borsche, M.; Niermann, D.; Kaspar, F.; Lussana, C.; Isotta, F.A.; van den Besselaar, E.; van der Schrier, G.; Undén, P. Added value of regional reanalyses for climatological applications. Environ. Res. Commun. 2019, 1, 071004. [Google Scholar] [CrossRef]
- Morid, S.; Smakhtin, V.; Moghaddasi, M. Comparison of seven meteorological indices for drought monitoring in Iran. Int. J. Climatol. 2006, 26, 971–985. [Google Scholar] [CrossRef]
- Jain, V.K.; Pandey, R.P.; Jain, M.K.; Byun, H.-R. Comparison of drought indices for appraisal of drought characteristics in the Ken River Basin. Weather Clim. Extrem. 2015, 8, 1–11. [Google Scholar] [CrossRef] [Green Version]
- Mishra, A.K.; Singh, V.P. A review of drought concepts. J. Hydrol. 2010, 391, 202–216. [Google Scholar] [CrossRef]
- Zargar, A.; Sadiq, R.; Naser, B.; Khan, F.I. A review of drought indices. Environ. Rev. 2011, 19, 333–349. [Google Scholar] [CrossRef]
- Kim, D.-W.; Byun, H.-R.; Choi, K.-S.; Oh, S.-B. A spatiotemporal analysis of historical droughts in Korea. J. Appl. Meteorol. Climatol. 2011, 50, 1895–1912. [Google Scholar] [CrossRef]
- Meehl, G.A.; Tebaldi, C. More intense, more frequent, and longer lasting heat waves in the 21st century. Science 2004, 305, 994–997. [Google Scholar] [CrossRef] [Green Version]
- Robinson, P.J. On the definition of a heat wave. J. Appl. Meteorol. 2001, 40, 762–775. [Google Scholar] [CrossRef]
- Perkins, S.E.; Alexander, L.V. On the measurement of heat waves. J. Clim. 2013, 26, 4500–4517. [Google Scholar] [CrossRef]
- Kendall, M.G. A Course in Multivariate Analysis; Hafner Pub. Co.: New York, NY, USA, 1957. [Google Scholar]
- McLeod, A.I. Package “Kendall”—Kendall Rank Correlation and Mann-Kendall Trend Test. 2011. Available online: https://cran.r-project.org/web/packages/Kendall/Kendall.pdf (accessed on 15 December 2020).
- Maček, U.; Bezak, N.; Šraj, M. Reference evapotranspiration changes in Slovenia, Europe. Agric. For. Meteorol. 2018, 260–261, 183–192. [Google Scholar] [CrossRef]
- Burn, D.H.; Hag Elnur, M.A. Detection of hydrologic trends and variability. J. Hydrol. 2002, 255, 107–122. [Google Scholar] [CrossRef]
- Ptak, M.; Sojka, M.; KaBvła, T.; ChojDski, A.; Nowak, B. Long-term water temperature trends of the Warta River in the years 196P_2009. Ecohydrol. Hydrobiol. 2019, 19, 441–451. [Google Scholar] [CrossRef]
- Ptak, M.; Sojka, M.; Nowak, B. Effect of climate warming on a change in thermal and ice conditions in the largest lake in Poland—Lake Śniardwy. J. Hydrol. Hydromech. 2020, 68, 260–270. [Google Scholar] [CrossRef]
- Russo, S.; Sillmann, J.; Fischer, E.M. Top ten European heatwaves since 1950 and their occurrence in the coming decades. Environ. Res. Lett. 2015, 10, 124003. [Google Scholar] [CrossRef]
- Pohlert, T. Package “Trend”—Non-Parametric Trend Tests and Change-Point Detection. 2020. Available online: https://cran.r-project.org/web/packages/trend/trend.pdf (accessed on 15 December 2020).
- Sharma, S.; Mujumdar, P. Increasing frequency and spatial extent of concurrent meteorological droughts and heatwaves in India. Sci. Rep. 2017, 7, 15582. [Google Scholar] [CrossRef] [PubMed] [Green Version]
- Wu, X.; Hao, Z.; Zhang, X.; Li, C.; Hao, F. Evaluation of severity changes of compound dry and hot events in China based on a multivariate multi-index approach. J. Hydrol. 2020, 583, 124580. [Google Scholar] [CrossRef]
- European Environment Agency Global and European Temperature. Available online: https://www.eea.europa.eu/data-and-maps/indicators/global-and-european-temperature-9/assessment (accessed on 8 December 2020).
- European Environment Agency Mean Precipitation. Available online: https://www.eea.europa.eu/data-and-maps/indicators/european-precipitation-2/assessment (accessed on 8 December 2020).
- WWF. Forest Ablaze—Causes and Effects of Global Forest Fires; World Wide Fund: Berlin, Deutschland, 2016; 107p, Available online: https://www.wwf.de/fileadmin/fm-wwf/Publikationen-PDF/WWF-Study-Forests-Ablaze.pdf (accessed on 8 December 2020).
- WWF. Fires, Forests and the Future: A Crisis Raging Out of Control? World Wide Found: Gland, Switzerland; Boston Consulting Group: Boston, MS, USA, 2020; 20p, Available online: https://wwfeu.awsassets.panda.org/downloads/wwf_fires_forests_and_the_future_report.pdf (accessed on 8 December 2020).
- EFFIS. Emergency Management System—European Forest Fire Information System. Available online: http://effis.jrc.ec.europa.eu/ (accessed on 8 December 2020).
- EFFIS. Emergency Management System—European Forest Fire Information System—Current Situation Viewer. Available online: http://effis.jrc.ec.europa.eu/static/effis_current_situation/public/index.html (accessed on 8 December 2020).
- Moreira, F.; Viedma, O.; Arianoutsou, M.; Curt, T.; Koutsias, N.; Rigolot, E.; Barbati, A.; Corona, P.; Vaz, P.; Xanthopoulos, G.; et al. Landscape—Wildfire interactions in southern Europe: Implications for landscape management. J. Environ. Manag. 2011, 92, 2389–2402. [Google Scholar] [CrossRef] [PubMed] [Green Version]
- Syphard, A.D.; Bar Massada, A.; Butsic, V.; Keeley, J.E. Land Use Planning and Wildfire: Development Policies Influence Future Probability of Housing Loss. PLoS ONE 2013, 8, e71708. [Google Scholar] [CrossRef] [PubMed] [Green Version]
- Moreno, M.V.; Conedera, M.; Chuvieco, E.; Pezzatti, G.B. Fire regime changes and major driving forces in Spain from 1968 to 2010. Environ. Sci. Policy 2014, 37, 11–22. [Google Scholar] [CrossRef]
- Keeley, J.E.; Syphard, A.D. Climate change and future fire regimes: Examples from California. Geosciences 2016, 6, 37. [Google Scholar] [CrossRef] [Green Version]
- Galiana-Martín, L. Spatial Planning Experiences for Vulnerability Reduction in the Wildland-Urban Interface in Mediterranean European Countries. Eur. Countrys. 2017, 9, 577–593. [Google Scholar] [CrossRef] [Green Version]
Figure 1.
Example of the UERRA regional reanalysis total precipitation data for 1 January 2001 and HydroSHEDS catchment polygons at the 7th Pfafstetter level.
Figure 1.
Example of the UERRA regional reanalysis total precipitation data for 1 January 2001 and HydroSHEDS catchment polygons at the 7th Pfafstetter level.

Figure 2.
Mean annual number of days with a compound occurrence of drought and extreme heat according to the basic case and 365 days used as the antecedent precipitation (N).
Figure 2.
Mean annual number of days with a compound occurrence of drought and extreme heat according to the basic case and 365 days used as the antecedent precipitation (N).

Figure 3.
Mann–Kendall trend test results using the mean annual number of days with a compound occurrence of drought and extreme heat in the 1961–2018 period. Results for the basic case and N = 365 days are presented.
Figure 3.
Mann–Kendall trend test results using the mean annual number of days with a compound occurrence of drought and extreme heat in the 1961–2018 period. Results for the basic case and N = 365 days are presented.

Figure 4.
Changes in the mean annual number of days with a compound occurrence of drought and extreme heat in the 1961–2018 period. Results for the basic case and N = 365 days are presented.
Figure 4.
Changes in the mean annual number of days with a compound occurrence of drought and extreme heat in the 1961–2018 period. Results for the basic case and N = 365 days are presented.


Table 1.
Impact of the input parameters used for the definition of compound events related to the basic characteristics of the identified events.
Table 1.
Impact of the input parameters used for the definition of compound events related to the basic characteristics of the identified events.
| Case | Mean Number of Compound Days | Mean Maximum Number of Compound Days | Mean Number of Years with at Least One Event |
|---|---|---|---|
| Basic (N = 365) | 1.7 | 31.5 | 8.9 |
| Basic (N = 180) | 1 | 18.6 | 6.6 |
| Basic (N = 15) | 0.1 | 0.2 | 0.3 |
| Extreme (N = 365) | 0.2 | 6.6 | 1.2 |
| Extreme (N = 180) | 0.1 | 2.4 | 0.5 |
| Extreme (N = 15) | / | / | / |
| Mild (N = 365) | 10.9 | 78.8 | 29.3 |
| Mild (N = 180) | 8.9 | 60.9 | 30.0 |
| Mild (N = 15) | 7.9 | 31.5 | 43.5 |
Publisher’s Note: MDPI stays neutral with regard to jurisdictional claims in published maps and institutional affiliations. |
© 2020 by the authors. Licensee MDPI, Basel, Switzerland. This article is an open access article distributed under the terms and conditions of the Creative Commons Attribution (CC BY) license (http://creativecommons.org/licenses/by/4.0/).
Share and Cite
MDPI and ACS Style
Bezak, N.; Mikoš, M. Changes in the Compound Drought and Extreme Heat Occurrence in the 1961–2018 Period at the European Scale. Water 2020, 12, 3543. https://doi.org/10.3390/w12123543
AMA Style
Bezak N, Mikoš M. Changes in the Compound Drought and Extreme Heat Occurrence in the 1961–2018 Period at the European Scale. Water. 2020; 12(12):3543. https://doi.org/10.3390/w12123543
Chicago/Turabian StyleBezak, Nejc, and Matjaž Mikoš. 2020. "Changes in the Compound Drought and Extreme Heat Occurrence in the 1961–2018 Period at the European Scale" Water 12, no. 12: 3543. https://doi.org/10.3390/w12123543
Note that from the first issue of 2016, this journal uses article numbers instead of page numbers. See further details here.