Article

Electrochemical Oxidation of Effluents from Food Processing Industries: A Short Review and a Case-Study

1
FibEnTech/UBI-Fiber Materials and Environmental Technologies Research Unit, Universidade da Beira Interior, 6201-001 Covilhã, Portugal
2
Institute of Engineering, National Autonomous University of Mexico, Circuito Escolar s/n, Ciudad Universitaria, Delegación Coyoacán, Mexico City 04510, Mexico
3
Department of Chemistry, Universidade da Beira Interior, 6201-001 Covilhã, Portugal
4
Department of Technology and Applied Sciences, School of Agriculture, Polytechnic Institute of Beja, 7800-295 Beja, Portugal
*
Author to whom correspondence should be addressed.
Water 2020, 12(12), 3546; https://doi.org/10.3390/w12123546
Submission received: 9 November 2020 / Revised: 12 December 2020 / Accepted: 15 December 2020 / Published: 17 December 2020
(This article belongs to the Section Wastewater Treatment and Reuse)

Abstract

:
A short review on the treatment of effluents from food processing industries by electrochemical oxidation (EO) was performed. Olive mill wastewater (OMW) and boron-doped diamond (BDD) are the most reported effluent and anode material, respectively. The addition of NaCl or Na2SO4 as supporting electrolytes is common in these studies, and their influence on the EO performance depends, among other things, on the anode material, since the electrolyte oxidation mechanism is different when active and non-active anode materials are utilized. A case-study on the application of a pilot plant, working in batch mode with recirculation, equipped with a BDD anode, to treat 4 L of OMW, slaughterhouse (SW) and winery (WW) wastewaters, with initial chemical oxygen demands (COD) of 20.5, 3.6 and 0.26 g L−1, respectively, is presented and discussed. In 16 h assays, 94% COD removal was achieved for OMW, and for SW and WW the Portuguese COD legal discharge limit of 150 mg L−1 was accomplished. Process efficiency decreased for lower organic load. NaCl addition increased COD removal in SW and WW, but presented an adverse effect for OMW COD removal, when compared to Na2SO4 addition. Nevertheless, lower specific energy consumptions were attained in chloride medium (48 Wh (g COD)−1).

1. Introduction

Food processing is an important activity for the economy of Mediterranean countries, given the number of companies and the large industrial production in this area [1]. However, the food processing industry generally requires large amounts of water and, thus, a large volume of effluents is produced, which can represent a serious environmental concern [2].
Wastewaters from food processing industries vary significantly in flow rate, constituents and pollution strength, depending on the type of feedstock and industrial process [2]. Often, this type of wastewaters is discharged untreated into water streams and soil, since it is considered readily degradable and free from toxicity [2]. Nevertheless, the high biochemical and chemical oxygen demands of those effluents, BOD and COD, respectively, and the presence of large quantities of nutrients, organic carbon, organic nitrogen, inorganics, suspended and dissolved solids, may cause deoxygenation of rivers, contamination of groundwater and contribute to the change in abiotic factors in the environment [3]. Thus, the treatment of effluents from food processing industries before disposal has become mandatory, with more stringent environmental regulations [4,5].
Although the treatment by typical aerobic and anaerobic biological processes may seem attractive, due to the high biodegradability of these effluents, the presence of constituents that can inhibit the biodegradation processes and the seasonality of many food processing industries can prevent its application [6,7]. Since each type of food processing wastewater has special factors to consider, the ideal solution passes through the development of efficient treatment methods, adaptable to the different effluents by small tuning.
Among the emerging technologies studied for wastewater treatment, electrochemical oxidation (EO) presents a set of characteristics that can be advantageous in the management of food processing effluents: small size treatment units, when compared to biological systems, of simple construction, assembly, operation and maintenance, allowing the treatment to be carried out in the place where the effluent is produced; versatility, with easy adjustment of the operational variables, according to the quality and quantity of the effluent, and the process disruption, for seasonal effluent production [8,9,10].
The application of the EO process to treat effluents from food processing industries has been reported by several authors. A summary of the studies performed and of the main experimental conditions tested, as well as the respective results, is presented in Table 1.
Several anode materials have been investigated for the electro-oxidation of effluents from food processing industries, with boron-doped diamond (BDD) the most studied. The fact that BDD is the most applied anode material in EO studies is related to its high performance in producing highly reactive species, such as hydroxyl radicals, and to its consequent great ability in removing different organic and inorganic pollutants [11]. Furthermore, BDD electrodes present important properties that distinguish them from other materials: extremely wide potential window in aqueous and non-aqueous electrolytes, corrosion stability in very aggressive media, inert surface with low adsorption properties and strong tendency to resist deactivation, and very low double-layer capacitance and background current [12].
Besides the anode material, there are other factors that influence the efficacy of the EO process, such as current density. Usually, lower applied current densities lead to lower energy consumptions and higher current efficiencies. Nevertheless, at higher current densities, the reaction rate is higher, reducing the operation time [13]. In the literature revision compiled in Table 1, applied current densities ranged from 9.1 to 4286 A m−2. Generally, an increase in current density increases COD removal rate, as reported in the EO of brewery wastewater, using a BDD anode, with COD removals of 65, 91 and 98% after 6 h treatments at 80, 160, and 240 A m−2, respectively [14]. According to these authors, this increase is due to the higher production of hydroxyl radicals and other oxidants, such as chlorine, hydrogen peroxide, chlorine dioxide, and molecular oxygen. However, when energy consumptions are analyzed, the increase in current density also led to an increase in energy consumption, since a higher electrical charge was involved, which leads to a lower current efficiency when COD is reduced [14].
The effect of supporting electrolytes in EO efficacy of food processing wastewaters has also been widely studied, with NaCl and Na2SO4 being the most studied electrolytes. In the EO treatment of olive mill wastewater (OMW), using a BDD anode, Cañizares et al. found that the addition of chlorides decreased the mineralization efficiency, but the addition of sulfate significantly increased the average efficiency [15]. During the EO study of OMW at a Ti/Pt anode, Kul et al. found that COD and total organic carbon (TOC) removals were lower with Na2SO4 as support electrolyte than with KCl or NaCl [23]. The different results obtained with BDD or other anode materials are mainly due to the fact that BDD is a non-active anode material that exhibits weak interaction with the hydroxyl radicals formed and high oxygen evolution overpotential, favoring the direct reaction of these radicals with the solution constituents [34]. Thus, in the presence of sulfate, the reactive hydroxyl radicals produced on the BDD surface can react with the electrolyte. The contribution of the hydroxyl radicals available on the anode surface, as well as their interaction with SO42, favors the production of SO4−• and S2O82 (Equations (1) and (2)), strong oxidants that remove organic matter (OM) from solution efficiently, according to Equations (3) and (4) [34].
SO42− + OH → SO4−• + OH,
SO4−• + SO4−• → S2O82−,
SO4−• + OM → Oxidation products → → → CO2 + H2O + SO42−,
S2O82− + OM → Oxidation products → → → CO2 + H2O + 2SO42−,
In the case of chloride, its direct oxidation generates active chlorine species, mainly chlorine and hypochlorite, through Equations (5) to (7). This occurs preferentially when dimensionally stable anodes (DSA) and Pt anodes are used [34].
2Cl → Cl2 + 2e,
Cl2 + H2O ↔ HClO + H+ + Cl,
HClO ↔ ClO + H+,
However, when BDD anodes are utilized, the large quantities of hydroxyl radicals produced enhance the catalytic reaction of these radicals to successively oxidize chloride ion to different oxochlorinated compounds (Equations (8) to (11)) [34].
Cl + OH → ClO + H+ + e,
ClO + OH → ClO2 + H+ + e,
ClO2 + OH → ClO3 + H+ + e,
ClO3 + OH → ClO4 + H+ + e,
The different electrolytes oxidation mechanism, occurring at BDD or other anode materials, significantly influence the oxidation of the organic matter, resulting in different outcomes for sulfate and chloride influences.
With the aim of comparing the EO efficacy in the treatment of effluents from different food processing industries, with dissimilar characteristics, a case-study was carried out where the electrochemical oxidation of OMW, winery (WW) and slaughterhouse wastewater (SW) was performed in batch mode with recirculation, utilizing a 4 dm2 BDD anode and using a volume of 4 L. The influence of supporting electrolyte, NaCl or Na2SO4, in the EO performance was assessed for each studied effluent. It is the first time that a comparative study of the EO performance in the treatment of effluents from different food processing industries, with dissimilar characteristics, is presented. This comparative study facilitates an understanding of the degradation mechanism as a function of the effluents’ characteristics and the supporting electrolytes present.

2. Materials and Methods

The OMW, SW and WW samples used in this study were collected at Portuguese industries, before being submitted to any treatment, and were kept refrigerated until their use. Before use, samples were filtered (500 μm mesh) to remove larger suspended solids. Samples characterization, after filtration, is presented in Table 2.
Because the OMW, SW and WW samples presented low electrical conductivity values (Table 2), the addition of a background electrolyte was required. Two supporting electrolytes were studied, NaCl and Na2SO4, in a concentration of 5 g L−1.
The EO experiments were conducted in batch mode with recirculation, at a flow rate of 360 L h−1, room temperature, using 4 L of effluent at natural pH. A BDD anode and a stainless-steel cathode, both with an area of 4 dm2, were used. The assays were performed for 16 h, at an applied anodic current density of 500 A m−2, using a DiaCell-PS1500 power supply. This high applied anodic current density ensured that the experiments were run in the potential region of water oxidation and that no deactivation of the BDD anode surface occurred [45]. In all the experiments, samples were collected every 2 h, to perform analytical determinations and monitor the experiments. The samples were collected without interrupting the assay, and the volume collected in each sample (10 mL) was the minimum required to perform the different analyses in triplicate. All the EO experiments were performed in duplicate, with reproducibility found in all the experimental conditions studied. The data presented for the parameters used to follow the assays correspond to the mean values obtained from the analysis results, in triplicate, of the two assays performed.
The samples collected before, during and after the electrodegradation assays were analyzed, according to the procedures described elsewhere [46], for the following parameters: COD, total dissolved carbon (TDC), dissolved organic carbon (DOC), dissolved inorganic carbon (DIC) and total dissolved nitrogen (TDN). COD determinations were made using the closed reflux titrimetric method. TDC, DOC, DIC and TDN were measured in a Shimadzu TOC-VCPH analyzer combined with a TNM-1 unit. For TDC, DOC, DIC and TDN determinations, samples were filtered through 0.45 μm membrane filters. pH was measured with a HANNA pH meter (HI 931400) and the conductivity with a Mettler Toledo conductivity meter (SevenEasy S30K).
The specific energy consumptions, Esp, in W h (g COD)−1, were calculated by means of Equation (12), where U is the cell voltage, in V, resulting from the applied current intensity I, in A, Δt is the duration of the electrolysis, in s, V is the volume of the solution in L and ΔCOD is the removed COD, in mg L−1, during Δt.
E sp = U × I × Δ t 3.6 × V × Δ COD ,

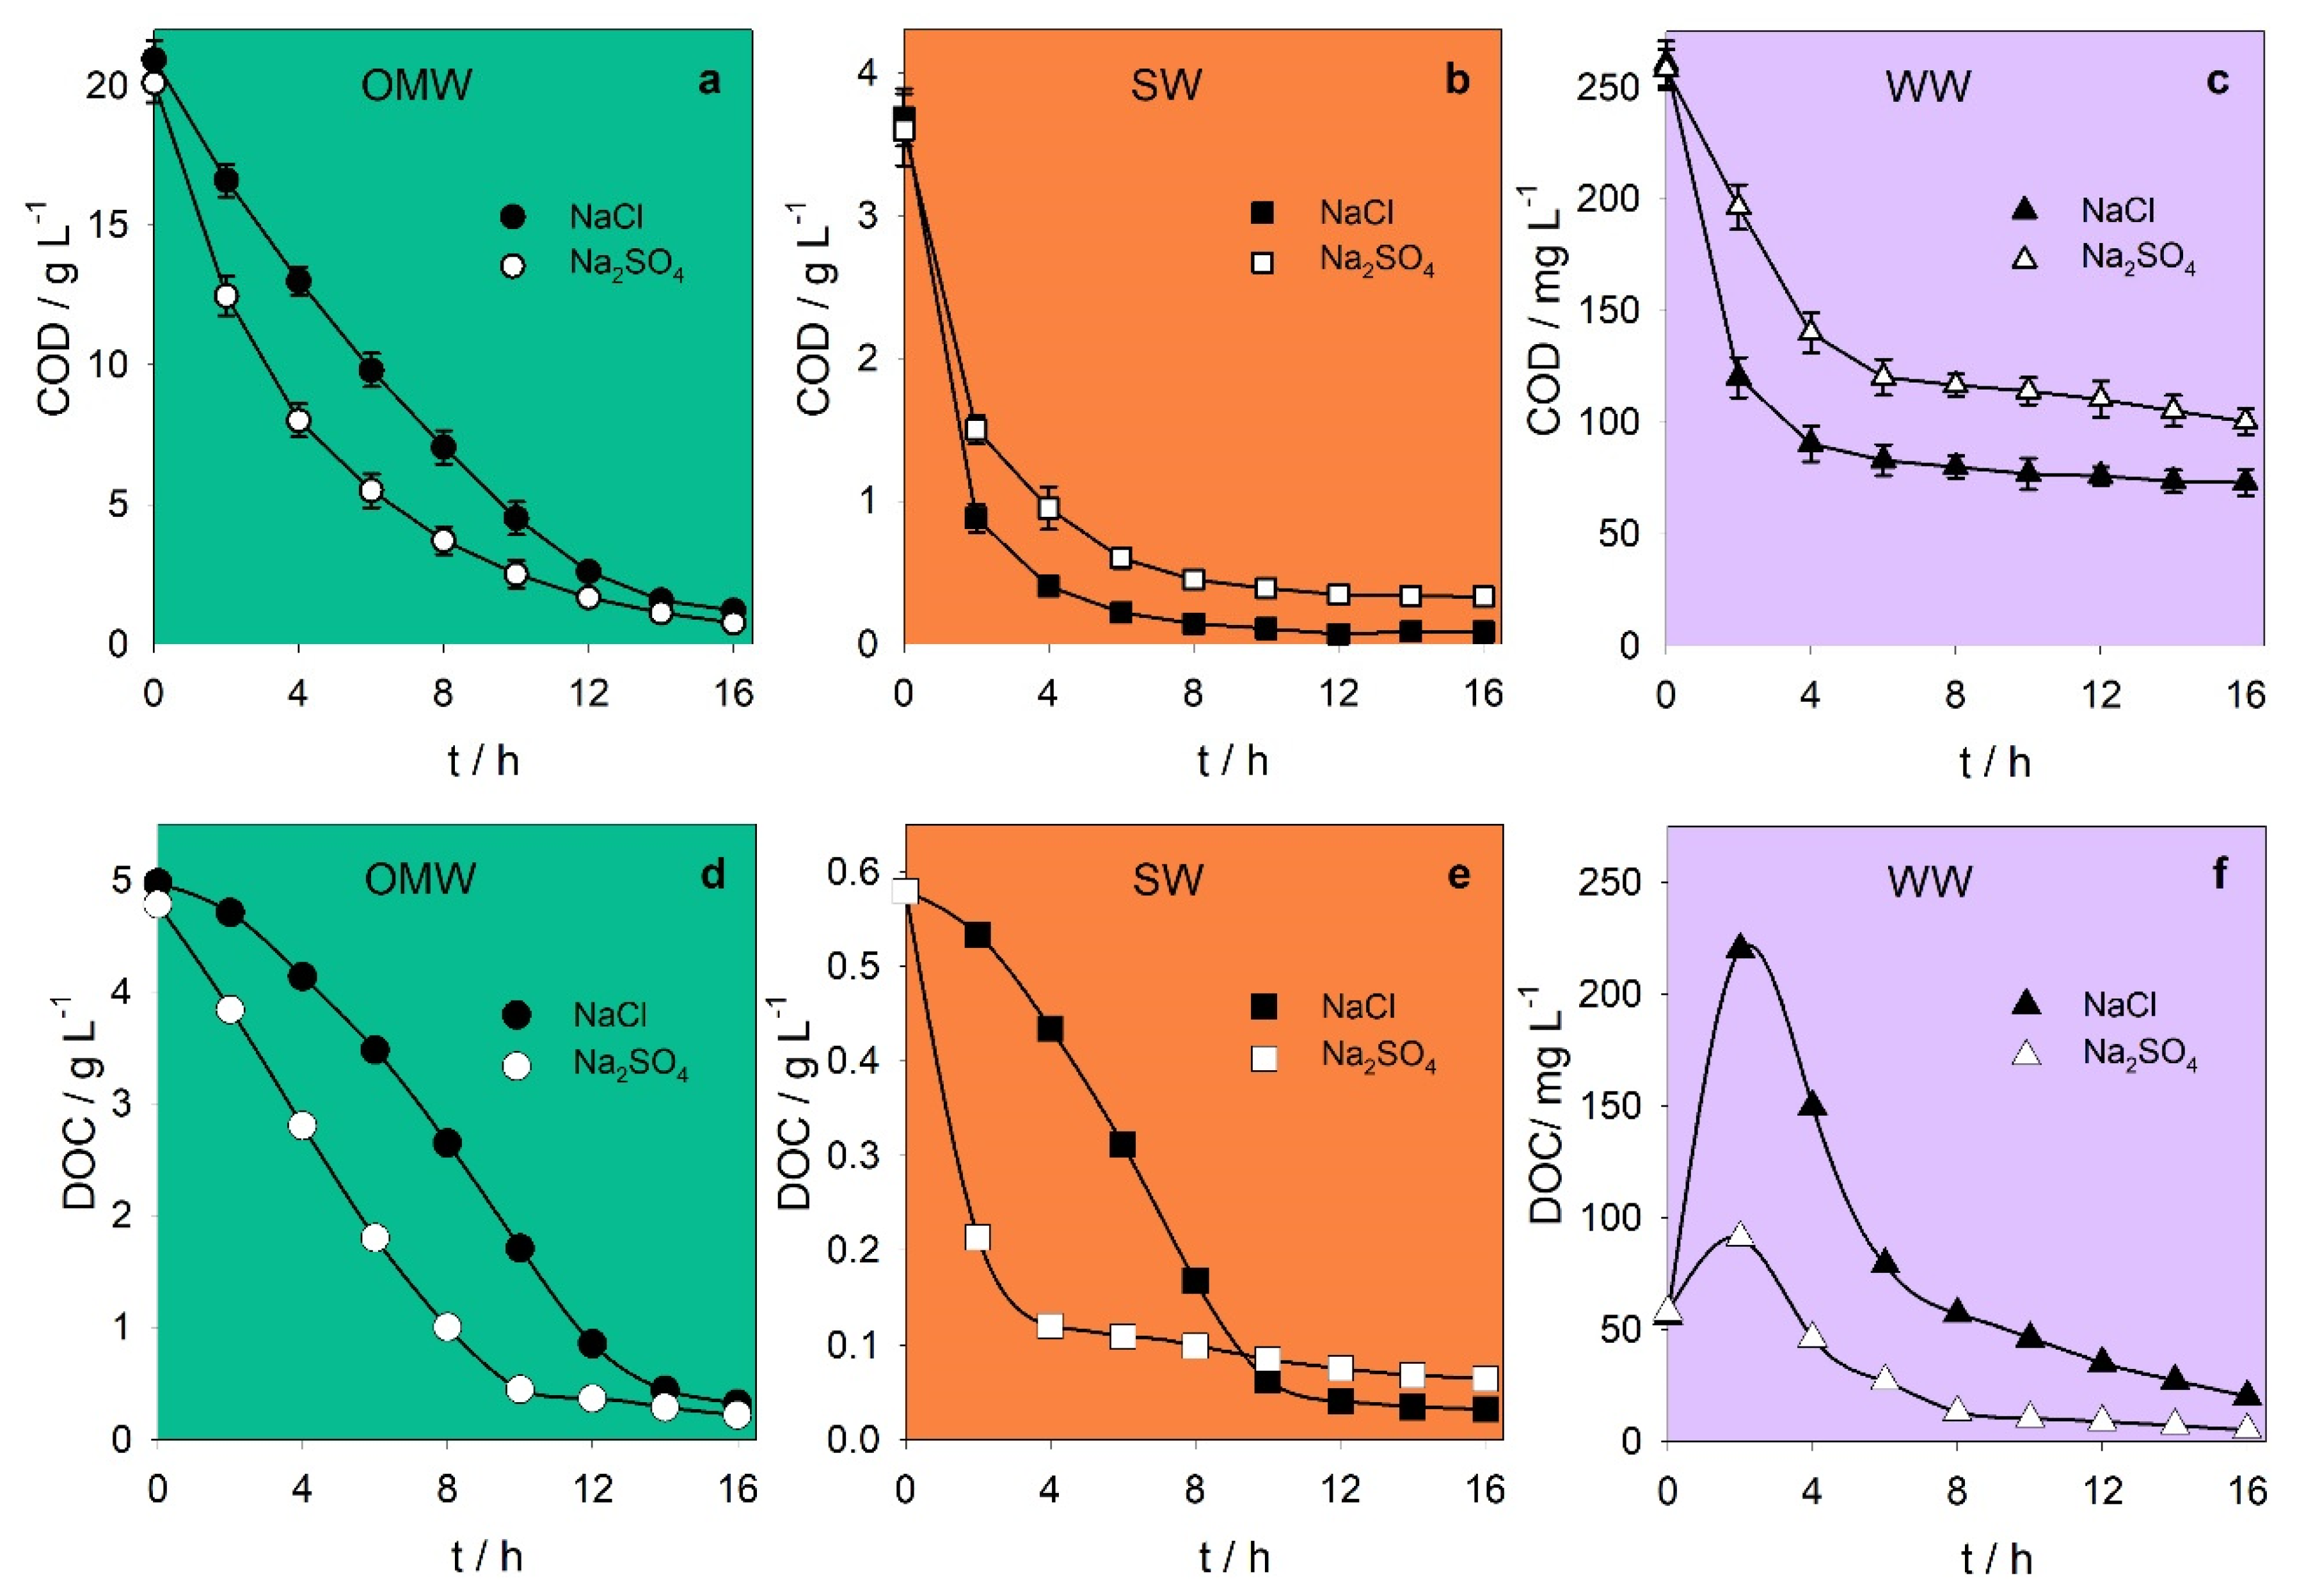
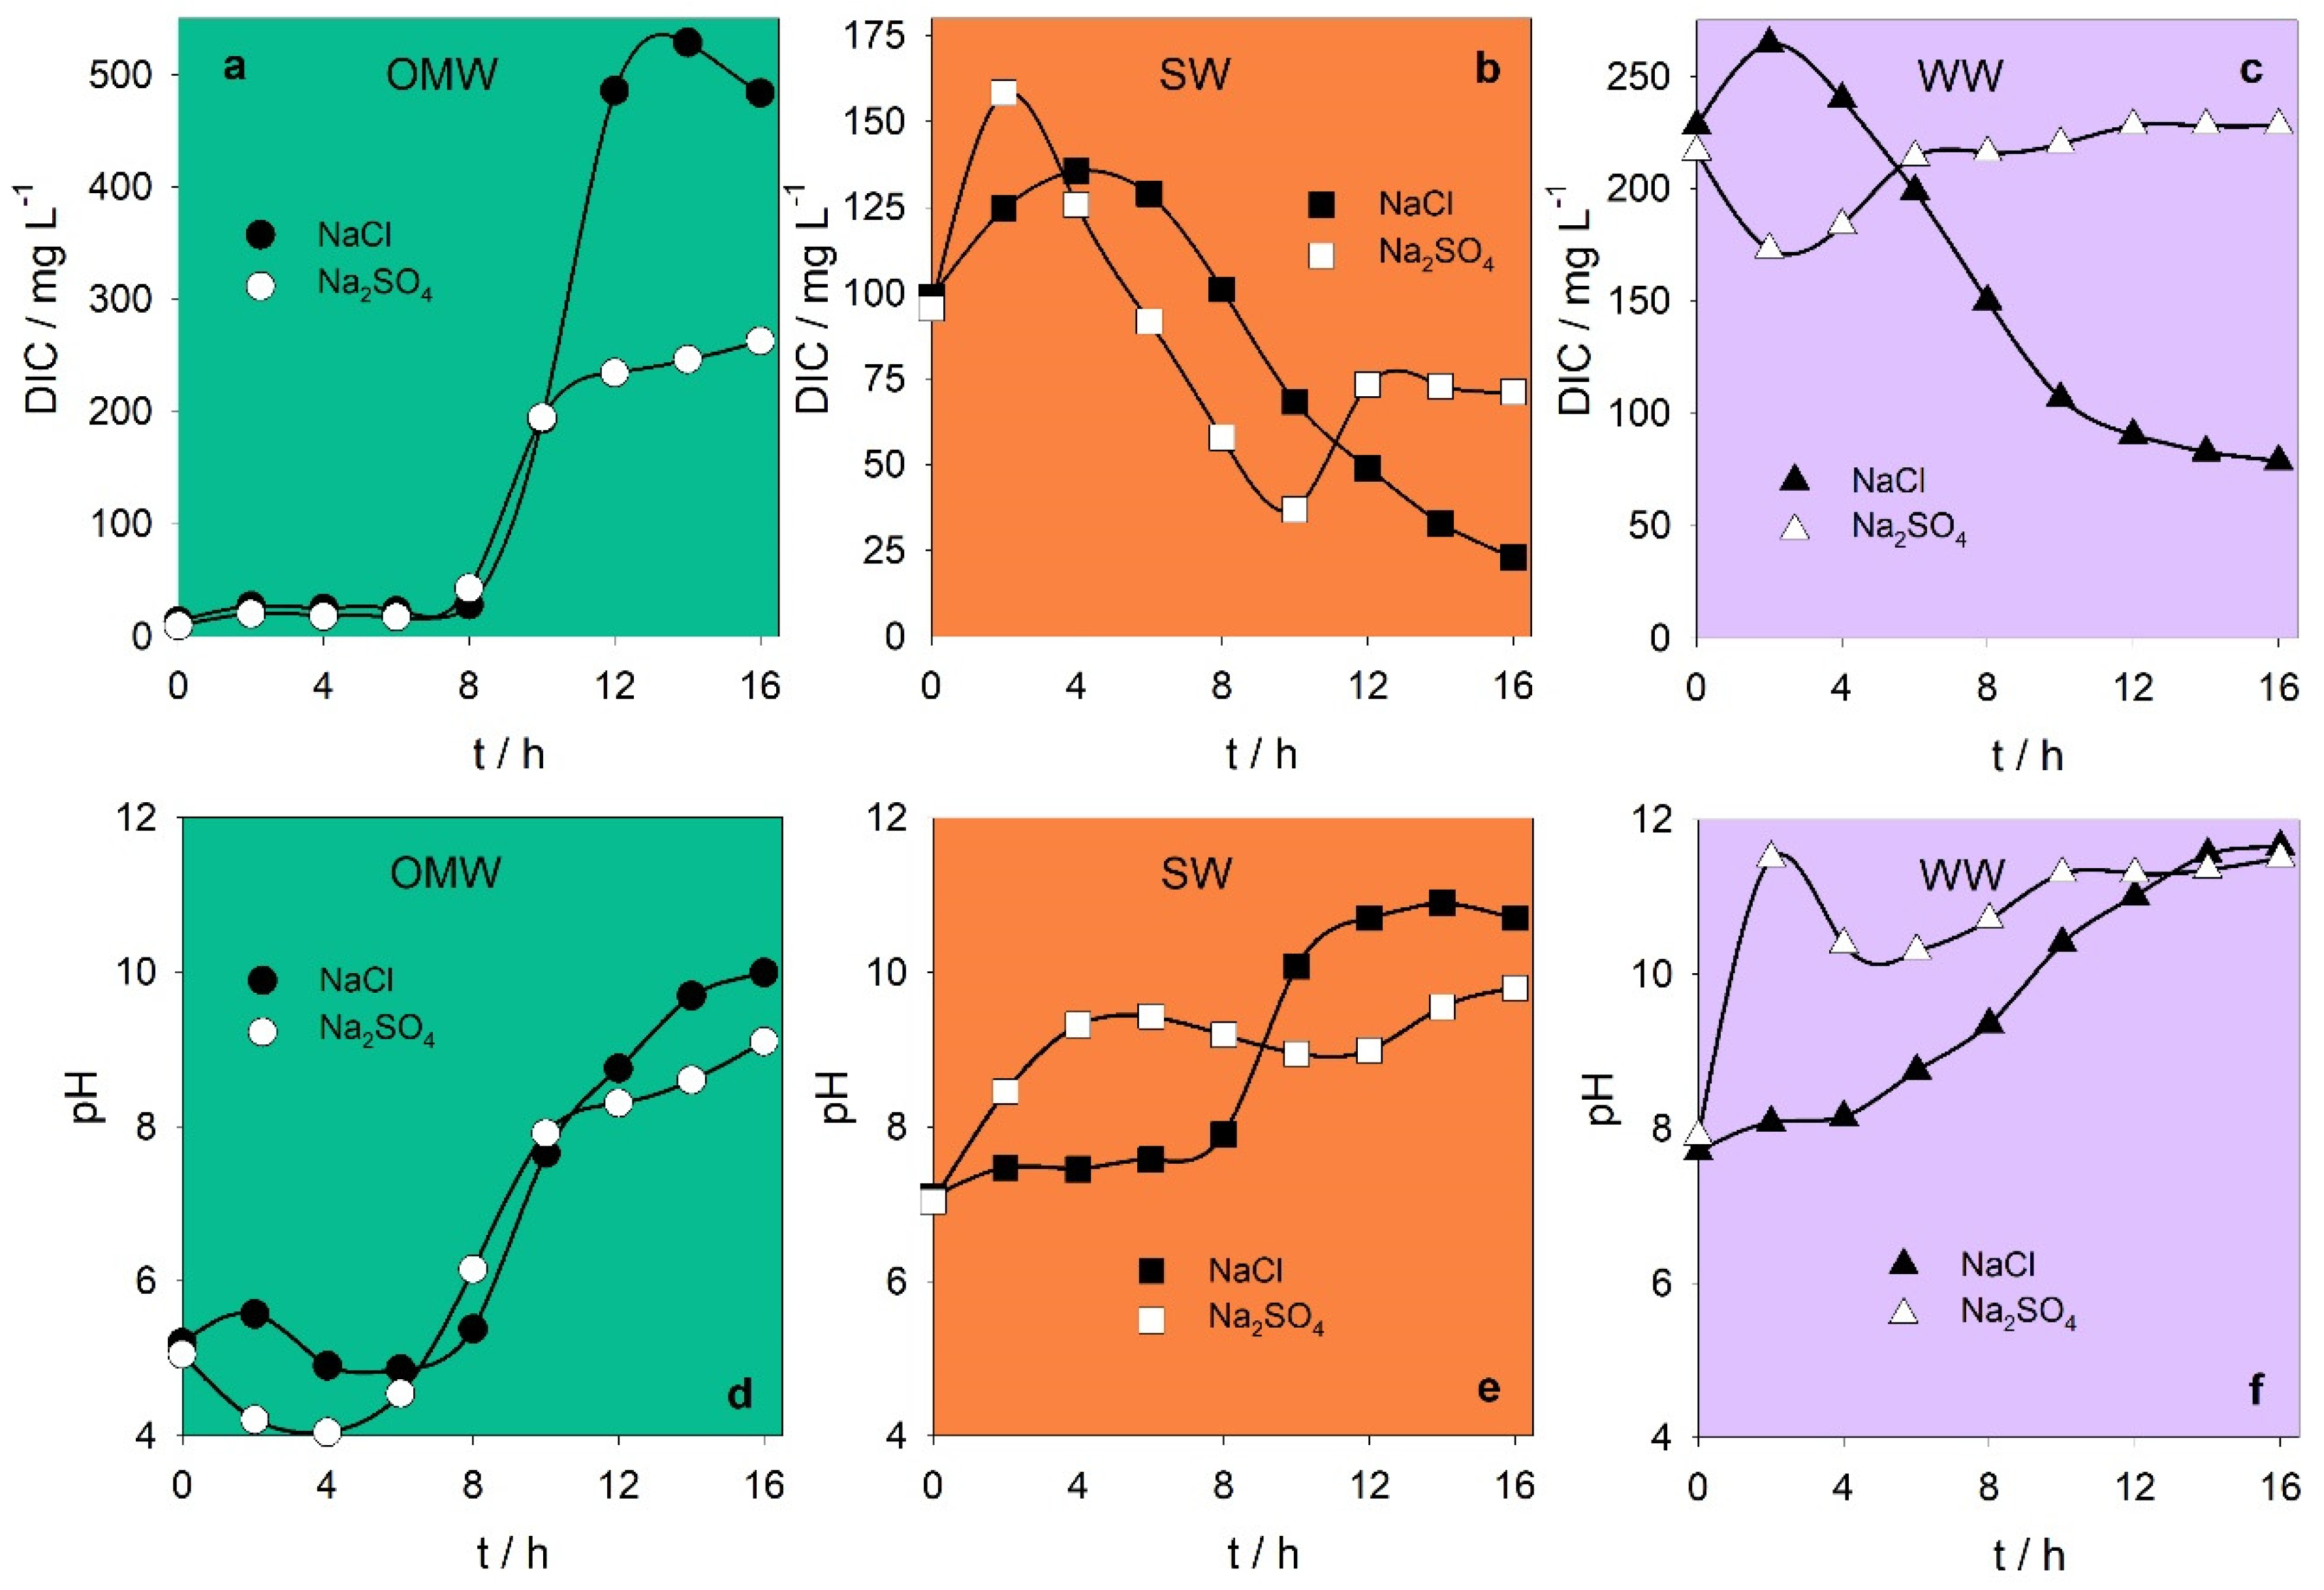
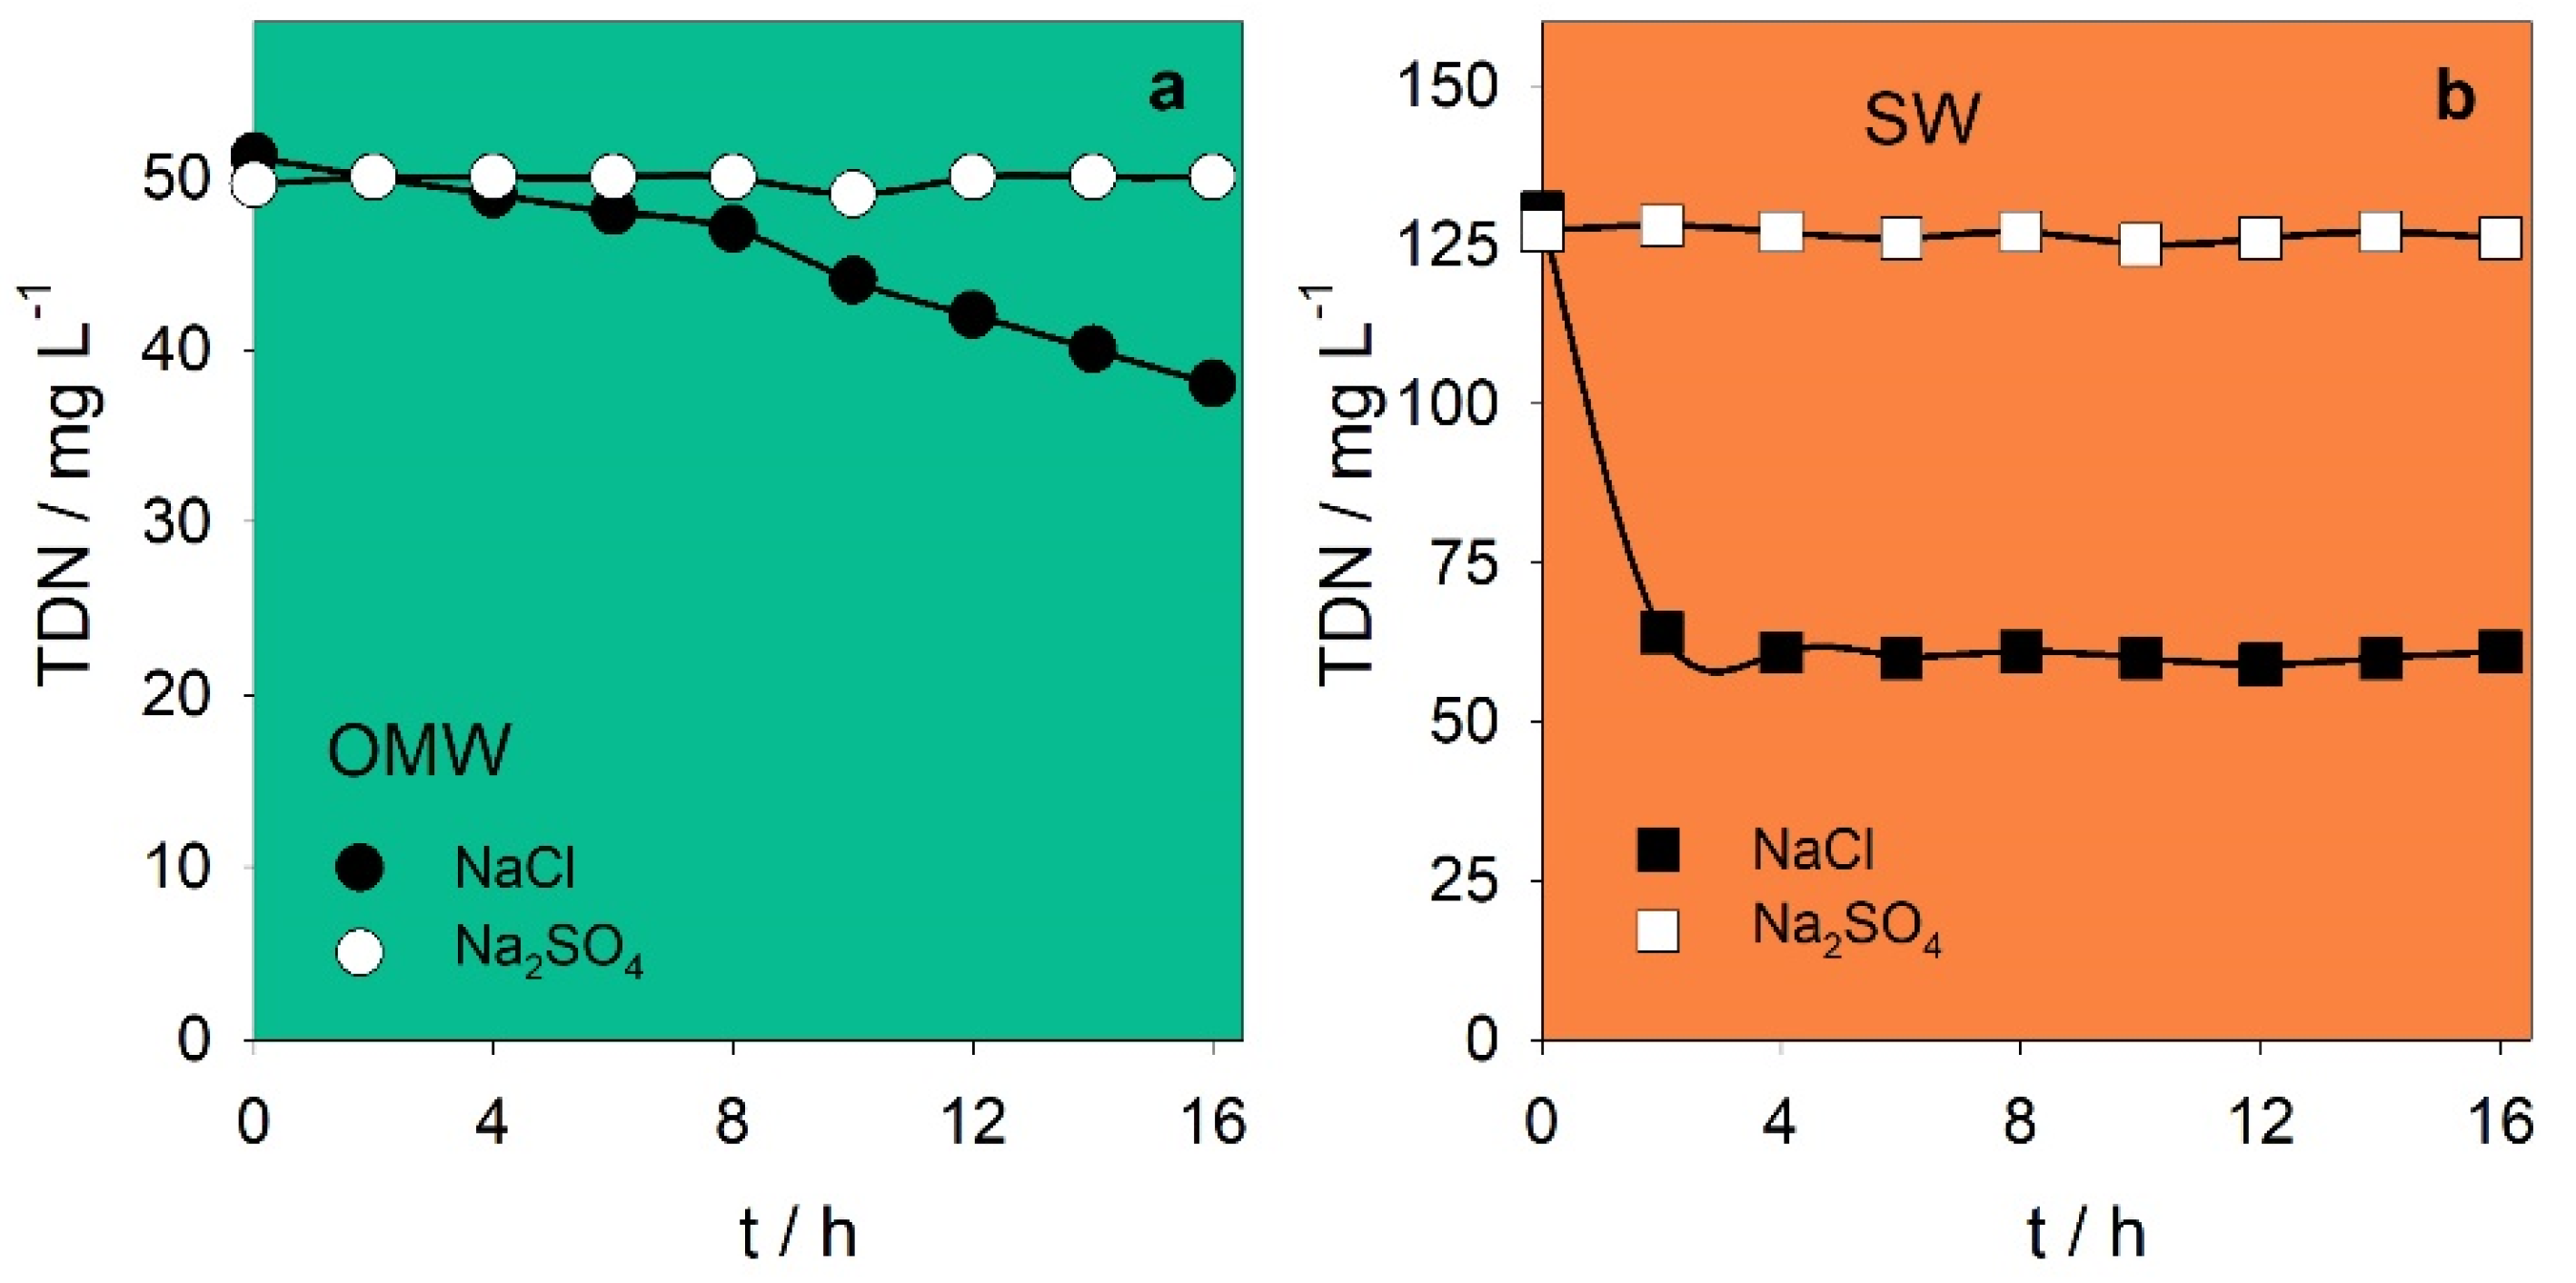
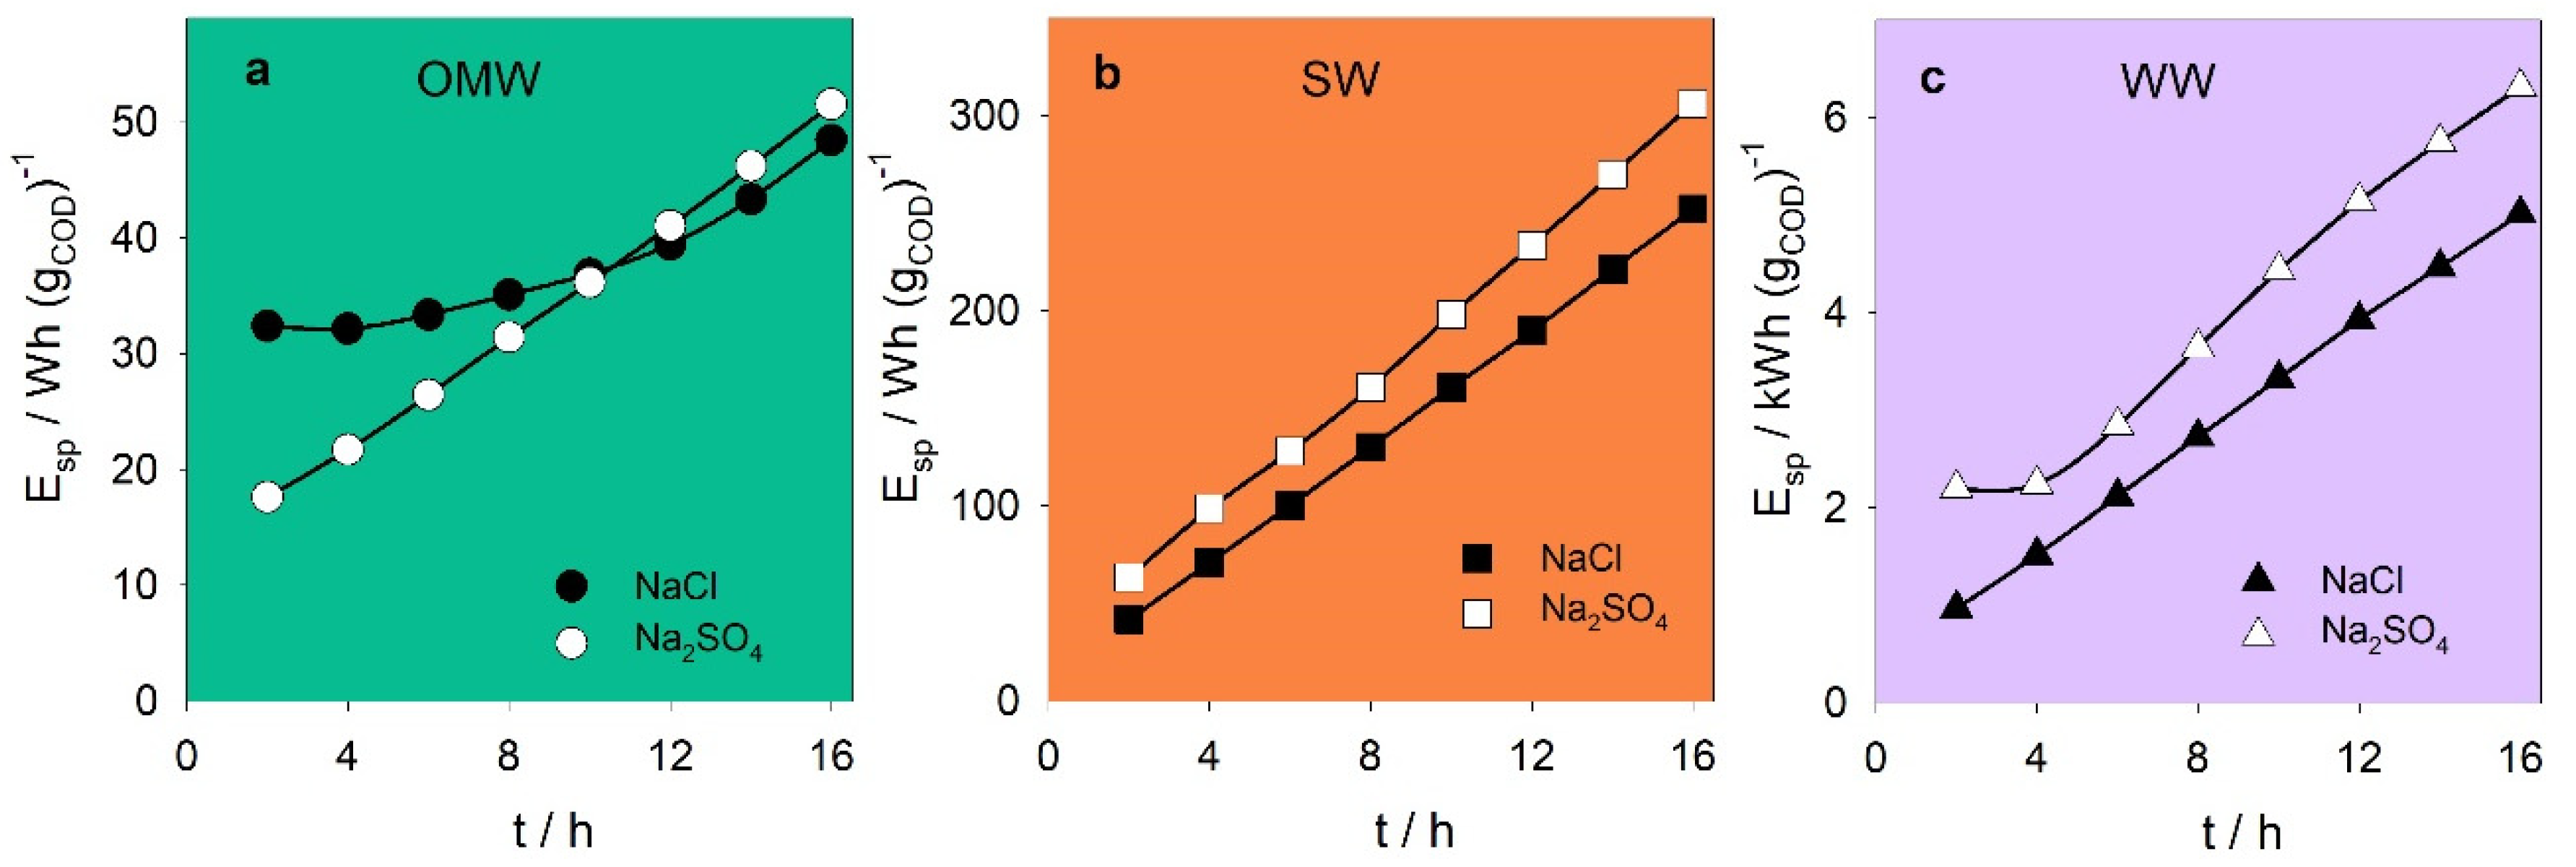
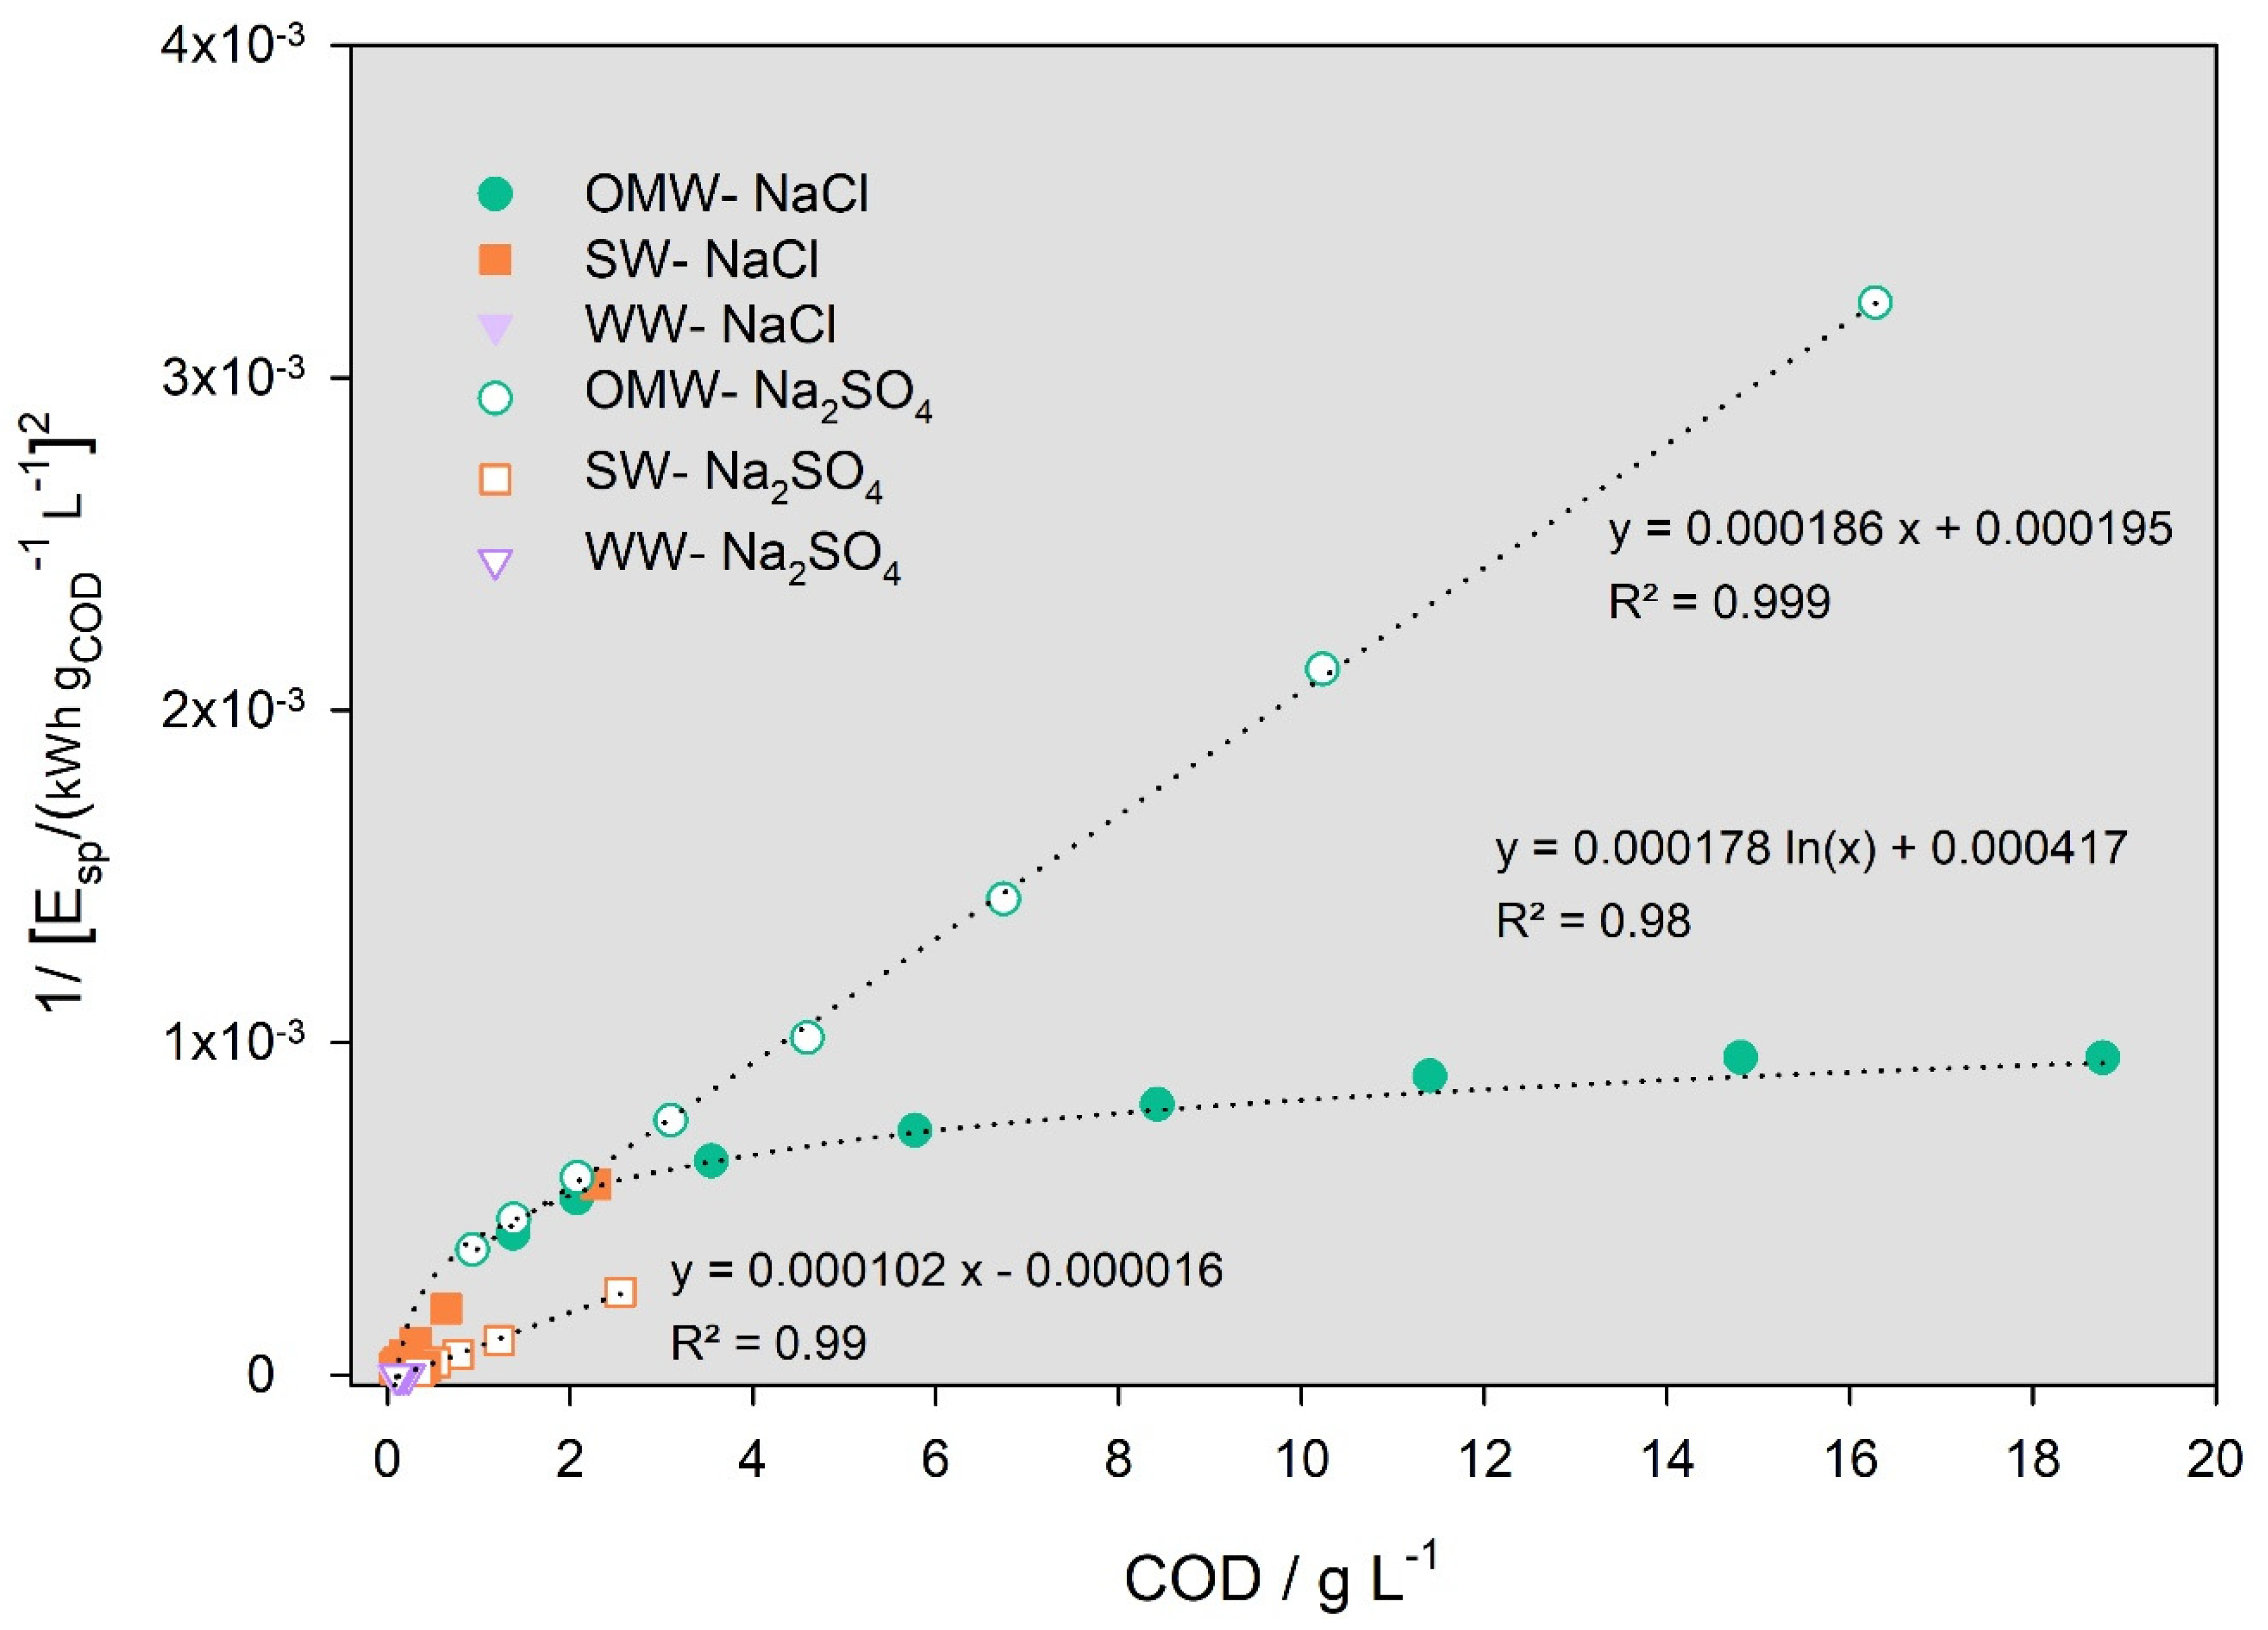
3. Results and Discussion

Figure 1a–c, present COD decays along the EO treatment of OMW, SW and WW samples, respectively. COD removal rate increases with samples initial COD, being higher for OMW. After 16 h assay, COD decreased approximately by 20 g L−1 in the EO experiments performed with OMW, but only by 3 and 0.2 g L−1 in the SW and WW assays, respectively. These results are in accordance with those previously reported in literature and can be explained by the higher process efficiency when operating at high COD conditions, since it is under current control for a longer time [47].
In fact, for all the samples studied, COD removal rate decreased with time, confirming that, as COD concentration became lower, the process tended to become diffusion controlled [47]. If the results obtained for OMW are compared with those reported in Table 1, for BDD anode, it can be observed that the highest COD removal was obtained in this case-study, even when higher current densities were applied. These different results can be due to the different composition of the OMW subjected to electrochemical treatment and to the different volumes and flow rates used in those studies, showing the importance of controlling the different experimental variables. For SW and WW, similar results were observed, despite their different physical–chemical characteristics and experimental conditions used.
Regarding the influence of supporting electrolyte in COD removal, OMW attained better results in the presence of sulfate, whereas SW and WW samples presented higher removal rates when chloride was used. Besides differences in mass transport coefficients of the different samples, due to the samples’ composition, the lower the samples COD, the lower the amount of pollutant molecules that reach the anode surface, with bulk oxidation being favored over oxidation on the anode surface. Active chlorine species, strong oxidants produced from chlorides during EO process, are known to be present in the bulk of the solution, when chlorides are naturally present or are added to the solution [48]. Thus, SW and WW samples with added NaCl benefited by the additional indirect oxidation through these active chlorine species. Although, in solutions with sulfate, additional indirect oxidation through SO4−• and S2O82− oxidants may occur, the lower SO42− diffusion coefficient and smaller lifetime of sulfate radicals compared to chlorine active species can explain the lower COD removals attained for SW and WW samples containing sulfate. In OMW experiments, there were no mass transport limitations, at least in the first hours of the assay, due to the high COD, and thus pollutant oxidation occurred mainly through hydroxyl radicals at the anode surface. In this situation, both chloride and sulfate oxidation were a constraint to the pollutants’ oxidation, and since Cl concentration (0.086 mol L−1) was higher than that of SO42− (0.035 mol L−1), the negative influence was more pronounced in the chloride-containing OMW sample.
Regarding DOC results for the different samples (Figure 1d–f, for OMW, SW and WW samples, respectively), the presence of chloride hinders its removal rate, when compared to EO performed with sulfate, since the indirect oxidation by active chloride species favors the organic compounds’ partial oxidation (conversion) rather than their complete mineralization, favored in the oxidation through OH [40]. For winery wastewater, an increase in DOC content during the first hours of the assay was observed, being more pronounced in chloride-containing solution. This increase might be due to the solubilization of aggregates of organic matter, which were present and retained in the filter during the pre-filtration of initial sample to perform DOC analysis [47].
Figure 2a–c depict DIC variation along the EO treatment of OMW, SW and WW samples, respectively. For OMW, a sharp increase in DIC concentration was observed after the eighth hour of the assay, being more pronounced in the solutions with added NaCl, from 28 mg L−1 at 8 h to 528 mg L−1 at 14 h. According to the literature, this increase in DIC concentration is probably due to the oxidation of some by-products, such as carboxylic acids, to CO2, which react and lead to the formation of carbonates and bicarbonates [49]. In fact, the increase in pH, after the eighth hour of the assay, observed for the OMW assays (Figure 2d), is consistent with the formation of bicarbonates [49].
For SW and WW samples, a different behavior was observed regarding DIC variation. In both samples, lower DIC concentrations were attained when using NaCl as supporting electrolyte. After an increase at the initial period of the assays, DIC concentration dropped to 23 and 79 mg L−1, for SW and WW, respectively. The increase in DIC concentration during the first period of the assays has been reported in the literature, being attributed to the oxidation of DOC to DIC [50]. The subsequent decrease is explained by the CO2 release from the reaction between bicarbonate and active chloride species, according to Equations (13) and (14) [50]:
Cl2 + HCO3 → CO2 + HOCl + Cl,
HOCl + HCO3 → CO2 + OCl + H2O,
The occurrence of these reactions, together with others that lead to hydroxide ion formation, such as the reaction described by Equation (15), can explain the increase in pH observed for the SW and WW experiments performed with added NaCl (Figure 2e,f, respectively) [51].
2H2O + 2e → 2OH + H2,
For the SW sample with added sulfate, an increase in DIC concentration in the first hours of the assay was followed by a sharp decrease and a subsequent increase. These variations can be explained by an initial oxidation of DOC to DIC [50], followed by the conversion of DIC to CO2, through Equations (16) and (17) [52], and a subsequent increase in bicarbonate formation from the oxidation of carboxylic acids [49]. pH variation (Figure 2e) is consistent with this explanation, with increases in the periods of bicarbonate formation.
OH + HCO3 → CO3−• + H2O,
CO3−• + CO3−• → CO2 + CO42−,
In WW samples with added sulfate, no increase in DIC concentration was observed, since DOC concentration was low, even after the organic matter aggregates solubilization. In fact, DIC concentration decreased in the first hours of assay, probably due to the reactions described by Equations (16) and (17), but then started to increase, as a consequence of bicarbonate formation from the oxidation of organics, and ended in a plateau, since the remaining organic compounds could not be further oxidized.
Nitrogen variation along the assays was also assessed. Figure 3 presents the TDN variation for the experiments performed with OMW and SW samples. WW samples presented a low initial TDN concentration of 5 ± 1 mg L−1 and no variation was observed along the assays with added sulfate or chloride (data not shown). In addition, for OMW and SW samples with added Na2SO4, no TDN removal was attained (Figure 3a,b, respectively). However, when NaCl was the added electrolyte, removals of 26%, from 51 to 38 mg L−1, and 53%, from 130 to 61 mg L−1, were observed, respectively, for OMW and SW samples. According to Lacasa et al. [53], the higher nitrogen removal obtained in the presence of chloride, when compared with sulfate-containing solutions, is explained by the chemical reaction of ammonium ions with hypochlorite, which lead to the complete oxidation of nitrogen to gaseous nitrogen, with chloride recovery. According to Caliari et al. [54], during EO in chloride medium, ammonia nitrogen is also converted to nitrate, besides nitrogen gas, and organic nitrogen is oxidized first to ammonia and then to nitrate and gaseous nitrogen compounds.
The fact that, in the OMW experiment with added NaCl, TDN removal occurred only in the last hours of the assay indicates that nitrogen was mainly in the form of organic nitrogen. On the other hand, for SW samples with added NaCl, TDN removal occurred in the first 2 h of the assay and after that no further removal occurred, indicating that ammonia nitrogen was converted to gaseous nitrogen compounds and nitrate.
The specific energy consumptions for the different experiments performed are presented in Figure 4.
The lower specific energy consumptions were obtained for the OMW electrodegradations, with the assays with added sulfate being the most energetically efficient until the eighth hour of the assay. Similarly, Cañizares et al. found lower energy consumptions when utilizing Na2SO4 as supporting electrolyte, during the EO of OMW with a BDD anode (Table 1) [15]. If the 16th hour of the assays is considered, OMW assays with added chloride presented the lowest Esp (48 Wh (g COD)−1), since, in the last hours of the assays, COD removal was similar for both sulfate and chloride mediums, but the cell voltage was lower in the experiments with added chloride, due to the higher electric conductivity (data not shown). From the studies presented in Table 1 for OMW eletrodegradation with BDD anode, only that performed by Barbosa et al. attained lower energy consumptions, probably due to lower applied current density [18].
For all the samples and experimental conditions studied, specific energy consumption increases with assay duration, since COD becomes lower and the process is less efficient. SW and WW presented lower Esp values for the experiments performed with added chloride, which is due to the higher COD removal obtained in these assays and the lower cell voltage, as referred above. For SW with added chloride, the Portuguese COD legal discharge limit (150 mg L−1) was accomplished at 8 h assay with a specific energy consumption of 130 Wh (g COD)−1. For similar COD removal, Ghazouani et al. attained higher energy consumption (163 Wh (g COD)−1), during the EO of SW using a BDD anode, probably due to the lower initial COD and different experimental conditions applied (Table 1) [33]. WW achieved the legal discharge limit in 2 h, but the Esp was much higher, 971 Wh (g COD)−1, showing that, at the experimental conditions applied, namely the high applied current density, the EO process is not suitable to treat effluents with such a low organic load due to high energetic costs.
Specific energy consumption was correlated with the medium COD (Figure 5) and it was found that, when sodium chloride is the electrolyte, a single equation of 1/(Esp)2 vs. lnCOD can be adjusted to all experimental data obtained with the three tested effluents. This result must mean that a similar oxidation mechanism is responsible for the degradation, regardless of the organic load concentration and experimental conditions, which must be mainly bulk oxidation by the chlorine active species formed at the BDD anode. On the other hand, the utilization of sulfate as electrolyte leads to different oxidation mechanisms for high COD higher or lower than approximately 2 g L−1. With this electrolyte, for higher organic load concentration, energy consumption is lower, since there is no diffusion hindrance and energy is mainly devoted to the oxidation of the organic matter, rather than the oxidation of the electrolyte; for lower COD, diffusion starts to command and sulfate radical species are less effective than chlorine active species for bulk oxidation.

4. Conclusions

A short review on the application of electrochemical oxidation process to treat effluents from different food processing industries shows that BDD is the most applied anode material, due to its high performance in producing hydroxyl radicals. Current density and type of supporting electrolyte are other factors that significantly influence the efficacy of the EO treatment of food processing wastewaters. Generally, organic load removal rate increases with applied current density, due to the higher production of oxidant species. However, energy consumptions are also increased. The influence of supporting electrolyte depends on the anode material utilized: with BDD, chloride medium usually leads to lower mineralization efficiencies than sulfate medium; with active anode materials, higher pollutant removal is achieved in the presence of chloride. This different behavior is related to the different oxidation pathways of chloride and sulfate when utilizing non-active or active anode materials.
The EO of olive mill, slaughterhouse and winery wastewaters, utilizing a pilot plant, working in batch mode with recirculation, equipped with a BDD anode, showed that, when applying the same experimental conditions, namely a constant current density of 500 A m−2, the process efficiency increases with the effluents’ organic load. For OMW, with an initial COD of 20.5 g L−1, a COD removal of 94% was achieved with a specific energy consumption of 48 W h (g COD)−1, corresponding to the best results reported in the literature for OMW electrodegradation using a BDD anode. For SW and WW, with an initial COD of 3.6 and 0.26 g L−1, respectively, the Portuguese COD legal discharge limit (150 mg L−1) was accomplished in 8 and 2 h of electrooxidation, respectively. However, the application of 500 A m−2 to treat effluents with such a low organic load, as with WW, led to very high specific energy consumptions, making the EO process impracticable due to energy costs. Regarding the influence of chloride and sulfate ions on the EO of the food processing wastewaters utilized in the case-study, results showed that the addition of 5 g L−1 of NaCl, when compared with the similar addition of Na2SO4, promoted the COD removal in the effluents with the lowest organic load, through additional oxidation in bulk by active chlorine species. However, it was showed to be disadvantageous for the COD removal of the effluent with the highest organic load, since, for OMW, pollutants oxidation occurred mainly through hydroxyl radicals at the anode surface and, thus, the electrolyte oxidation was a constraint. Furthermore, the presence of chloride, when compared to sulfate, was showed to be advantageous for nitrogen removal but unfavorable for organic compounds mineralization, since nitrogen removal occurs mainly through active chloride species, but these species favor the organic compounds’ partial oxidation rather than their complete mineralization.
The EO process, using a BDD anode, can be successfully applied to treat effluents from different food processing industries, with dissimilar characteristics; all that is required is the adjustment of the operational parameters according to the effluent’s characteristics. Although the experimental conditions were not studied/optimized for a possible scale up of the process, the findings described can add a valuable contribution for future industrial applications.

Author Contributions

Conceptualization, F.C. and A.L.; investigation, A.M.-C., A.A., L.M. and S.L.; methodology, A.F.; project administration, A.L.; resources, L.C. and M.J.P.; supervision, A.F.; validation, A.F. and A.L.; visualization, M.J.P.; writing—original draft, A.M.-C. and A.F.; writing—review and editing, L.C., M.J.P., F.C. and A.L. All authors have read and agreed to the published version of the manuscript.

Funding

This research was funded by Fundação para a Ciência e a Tecnologia, FCT, through the funding of the UID Fiber Materials and Environmental Technologies (FibEnTech), project UIDB/00195/2020, the funding of the grants SFRH/BD/129849/2017 and SFRH/BD/137209/2018 awarded to S. Luz and L. Madeira, respectively, and the contract funding awarded to A. Fernandes. This work was also financed by the Program Alentejo 2020, through FEDER, under the scope of “HYDROREUSE” project (ALT20-03-0145-FEDER-000021).

Conflicts of Interest

The authors declare no conflict of interest. The funders had no role in the design of the study; in the collection, analyses, or interpretation of data; in the writing of the manuscript, or in the decision to publish the results.

References

  1. Chatzisymeon, E.; Stypas, E.; Bousios, S.; Xekoukoulotakis, N.P.; Mantzavinos, D. Photocatalytic treatment of black table olive processing wastewater. J. Hazard. Mater. 2008, 154, 1090–1097. [Google Scholar] [CrossRef] [PubMed]
  2. Abdallh, M.N.; Abdelhalim, W.S.; Abdel-Halim, H.S. Industrial wastewater treatment of food industry using best techniques. Int. J. Eng. Sci. Invent. 2016, 5, 15–28. [Google Scholar]
  3. Iskandar, M.J.; Baharum, A.; Anuar, F.A.; Othaman, R. Palm oil industry in South East Asia and the effluent treatment technology—A review. Environ. Technol. Innov. 2018, 9, 169–185. [Google Scholar] [CrossRef]
  4. Commission Implementing Decision (EU) 2019/2031. Official Journal of the European Union. 2019, pp. L313/60–L313/93. Available online: http://data.europa.eu/eli/dec_impl/2019/2031/oj (accessed on 7 September 2020).
  5. Feitshans, T.A. Environmental Regulations and the Food Industry. In Guide to US Food Laws and Regulations, 2nd ed.; Curtis, P.A., Ed.; John Wiley & Sons, Ltd.: Hoboken, NJ, USA, 2013; pp. 121–141. [Google Scholar] [CrossRef]
  6. Hou, L.; Ji, D.; Zang, L. Inhibition of anaerobic biological treatment: A Review. Iop Conf. Ser. Earth Environ. Sci. 2018, 112, 012006. Available online: https://iopscience.iop.org/article/10.1088/1755-1315/112/1/012006/pdf (accessed on 10 September 2020). [CrossRef]
  7. Welz, P.J.; Holtman, G.; Haldenwang, R.; le Roes-Hill, M. Characterisation of winery wastewater from continuous flow settling basins and waste stabilisation ponds over the course of 1 year: Implications for biological wastewater treatment and land application. Water Sci. Technol. 2016, 74, 2036–2050. [Google Scholar] [CrossRef] [Green Version]
  8. Brillas, E.; Cabot, P.L.; Casado, J. Electrochemical methods for degradation of organic pollutants in aqueous media. In Chemical Degradation Methods for Wastes and Pollutants. Environmental and Industrial Applications; Tarr, M., Ed.; Marcel Dekker: New York, NY, USA, 2003; pp. 235–304. [Google Scholar]
  9. Comninellis, C.; Kapalka, A.; Malato, S.; Parsons, S.A.; Poulios, I.; Mantzavinos, D. Advanced oxidation processes for water treatment: Advances and trends for R&D. J. Chem. Technol. Biotechnol. 2008, 83, 769–776. [Google Scholar] [CrossRef]
  10. Martínez-Huitle, C.A.; Ferro, S. Electrochemical oxidation of organic pollutants for the wastewater treatment: Direct and indirect processes. Chem. Soc. Rev. 2006, 35, 1324–1340. [Google Scholar] [CrossRef]
  11. Ghazouani, M.; Akrout, H.; Bousselmi, L. Nitrate and carbon matter removals from real effluents using Si/BDD electrode. Environ. Sci. Pollut. Res. 2017, 24, 9895–9906. [Google Scholar] [CrossRef]
  12. Panizza, M.; Brillas, E.; Comninellis, C. Application of boron-doped diamond electrodes for wastewater treatment. J. Environ. Eng. Manag. 2008, 18, 139–153. [Google Scholar]
  13. Zambrano, J.; Min, B. Electrochemical treatment of leachate containing highly concentrated phenol and ammonia using a Pt/Ti anode at different current densities. Environ. Technol. Innov. 2020, 18, 100632. [Google Scholar] [CrossRef]
  14. Sultana, S.; Choudhury, M.R.; Bakr, A.R.; Anwar, N.; Rahaman, M.S. Effectiveness of electro-oxidation and electro-Fenton processes in removal of organic matter from high-strength brewery wastewater. J. Appl. Electrochem. 2018, 48, 519–528. [Google Scholar] [CrossRef]
  15. Cañizares, P.; Martínez, L.; Paz, R.; Sáez, C.; Lobato, J.; Rodrigo, M.A. Treatment of Fenton-refractory olive oil mill wastes by electrochemical oxidation with boron-doped diamond anodes. J. Chem. Technol. Biotechnol. 2006, 81, 1331–1337. [Google Scholar] [CrossRef]
  16. Deligiorgis, A.; Xekoukoulotakis, N.P.; Diamadopoulos, E.; Mantzavinos, D. Electrochemical oxidation of table olive processing wastewater over boron-doped diamond electrodes: Treatment optimization by factorial design. Water Res. 2008, 42, 1229–1237. [Google Scholar] [CrossRef] [PubMed]
  17. Chatzisymeon, E.; Xekoukoulotakis, N.P.; Diamadopoulos, E.; Katsaounis, A.; Mantzavinos, D. Boron-doped diamond anodic treatment of olive mill wastewaters: Statistical analysis, kinetic modeling and biodegradability. Water Res. 2009, 43, 3999–4009. [Google Scholar] [CrossRef] [PubMed] [Green Version]
  18. Barbosa, J.; Fernandes, A.; Ciríaco, L.; Lopes, A.; Pacheco, M.J. Electrochemical treatment of olive processing wastewater using a boron-doped diamond anode. Clean Soil Air Water 2016, 44, 1242–1249. [Google Scholar] [CrossRef]
  19. Israilides, C.J.; Vlyssides, A.G.; Mourafeti, V.N.; Karvouni, G. Olive oil wastewater treatment with the use of an electrolysis system. Bioresour. Technol. 1997, 61, 163–170. [Google Scholar] [CrossRef]
  20. Belaid, C.; Kallel, M.; Khadraoui, M.; Lalleve, G.; Elleuch, B.; Fauvarque, J.F. Electrochemical treatment of olive mill wastewaters: Removal of phenolic compounds and decolourization. J. Appl. Electrochem. 2006, 36, 1175–1182. [Google Scholar] [CrossRef]
  21. Kotta, E.; Kalogerakis, N.; Mantzavinos, D. The effect of solids on the electrochemical treatment of olive mill effluents. J. Chem. Technol. Biotechnol. 2007, 82, 504–511. [Google Scholar] [CrossRef]
  22. Belaid, C.; Khadraoui, M.; Mseddi, S.; Kallel, M.; Elleuch, B.; Fauvarque, J.F. Electrochemical treatment of olive mill wastewater: Treatment extent and effluent phenolic compounds monitoring using some uncommon analytical tools. J. Environ. Sci. 2013, 25, 220–230. [Google Scholar] [CrossRef]
  23. Kul, S.; Boncukcuoglu, R.; Yilmaz, A.E.; Fil, B.A. Treatment of olive mill wastewater with electro-oxidation method. J. Electrochem. Soc. 2015, 162, G41–G47. Available online: https://iopscience.iop.org/article/10.1149/2.0451508jes (accessed on 10 September 2020). [CrossRef]
  24. Gotsi, M.; Kalogerakis, N.; Psillakisa, E.; Samaras, P.; Mantzavinos, D. Electrochemical oxidation of olive oil mill wastewaters. Water Res. 2005, 39, 4177–4187. [Google Scholar] [CrossRef] [PubMed]
  25. Giannis, A.; Kalaitzakis, M.; Diamadopoulos, E. Electrochemical treatment of olive mill wastewater. J. Chem. Technol. Biotechnol. 2007, 82, 663–671. [Google Scholar] [CrossRef]
  26. Un, U.T.; Altay, U.; Koparal, A.S.; Ogutveren, U.B. Complete treatment of olive mill wastewaters by electrooxidation. Chem. Eng. J. 2008, 139, 445–452. [Google Scholar] [CrossRef]
  27. Papastefanakis, N.; Mantzavinos, D.; Katsaounis, A. DSA electrochemical treatment of olive mill wastewater on Ti/RuO2 anode. J. Appl. Electrochem. 2010, 40, 729–737. [Google Scholar] [CrossRef]
  28. Panizza, M.; Cerisola, G. Olive mill wastewater treatment by anodic oxidation with parallel plate electrodes. Water Res. 2006, 40, 1179–1184. [Google Scholar] [CrossRef] [PubMed]
  29. Chatzisymeon, E.; Dimou, A.; Mantzavinos, D.; Katsaounis, A. Electrochemical oxidation of model compounds and olive mill wastewater over DSA electrodes: 1. The case of Ti/IrO2 anode. J. Hazard. Mater. 2009, 167, 268–274. [Google Scholar] [CrossRef]
  30. Gonçalves, M.R.; Marques, I.P.; Correia, J.P. Electrochemical mineralization of anaerobically digested olive mill wastewater. Water Res. 2012, 46, 4217–4225. [Google Scholar] [CrossRef]
  31. Sharma, S.; Simsek, H. Treatment of canola-oil refinery effluent using electrochemical methods: A comparison between combined electrocoagulation + electrooxidation and electrochemical peroxidation methods. Chemosphere 2019, 221, 630–639. [Google Scholar] [CrossRef]
  32. Markou, V.; Kontogianni, M.-C.; Frontistis, Z.; Tekerlekopoulou, A.G.; Katsaounis, A.; Vayenas, D. Electrochemical treatment of biologically pre-treated dairy wastewater using dimensionally stable anodes. J. Environ. Manag. 2017, 202, 217–224. [Google Scholar] [CrossRef]
  33. Ghazouani, M.; Akrout, H.; Jellali, S.; Bousselmi, L. Comparative study of electrochemical hybrid systems for the treatment of real wastewaters from agri-food activities. Sci. Total Environ. 2019, 647, 1651–1664. [Google Scholar] [CrossRef]
  34. Candia-Onfray, C.; Espinoza, N.; Sabino da Silva, E.B.; Toledo-Neira, C.; Espinoza, L.C.; Santander, R.; García, V.; Salazar, R. Treatment of winery wastewater by anodic oxidation using BDD electrode. Chemosphere 2018, 206, 709–717. [Google Scholar] [CrossRef] [PubMed]
  35. Manisankar, P.; Viswanathan, S.; Rani, C. Electrochemical treatment of distillery effluent using catalytic anodes. Green Chem. 2003, 5, 270–274. [Google Scholar] [CrossRef]
  36. Piya-Areetham, P.; Shenchunthichai, K.; Hunsom, M. Application of electrooxidation process for treating concentrated wastewater from distillery industry with a voluminous electrode. Water Res. 2006, 40, 2857–2864. [Google Scholar] [CrossRef] [PubMed]
  37. Alvarez-Pugliese, C.E.; Moreno-Wiedman, P.; Machuca-Martínez, F.; Marriaga-Cabrales, N. Distillery wastewater treated by electrochemical oxidation with boron-doped diamond electrodes. J. Adv. Oxid. Technol. 2011, 14, 213–219. [Google Scholar] [CrossRef]
  38. Alvarez-Pugliese, C.E.; Martinez-Hernández, L.; Imbachi-Ordoñez, S.; Marriaga-Cabrales, N.; Machuca-Martinez, F. Pilot scale anodic oxidation of pretreated vinasse using boron doped diamond electrodes. CTF Cienc. Tecnol. Y Futuro 2016, 6, 67–78. [Google Scholar] [CrossRef] [Green Version]
  39. Vijayaraghavan, K.; Ahmad, D.; Lesa, R. Electrolytic treatment of beer brewery wastewater. Ind. Eng. Chem. Res. 2006, 45, 6854–6859. [Google Scholar] [CrossRef]
  40. Indhumathi, P.; Chellammal, S.; Basha, C.A.; Raghavan, M. Electrochemical treatment of starch effluent using RuO2/Ti and PbO2/Ti electrodes. Bull. Electrochem. 2001, 17, 535–538. Available online: https://krc.cecri.res.in/ro_2001/30-2001.pdf (accessed on 14 September 2020).
  41. Sharma, S.; Simsek, H. Sugar beet industry process wastewater treatment using electrochemical methods and optimization of parameters using response surface methodology. Chemosphere 2020, 238, 124669. [Google Scholar] [CrossRef]
  42. Chiang, L.-C.; Chang, J.-E.; Wen, T.-C. Electrochemical oxidation process for the treatment of coke-plant wastewater. J. Environ. Sci. Health Part. A-Toxic/Hazard. Subst. Environ. Eng. 1995, 30, 753–771. [Google Scholar] [CrossRef]
  43. Oliveira, E.M.S.; Silva, F.R.; Morais, C.C.O.; Oliveira, T.M.B.F.; Martínez-Huitle, C.A.; Motheo, A.J.; Albuquerque, C.C.; Castro, S.S.L. Performance of (in)active anodic materials for the electrooxidation of phenolic wastewaters from cashew-nut processing industry. Chemosphere 2018, 201, 740–748. [Google Scholar] [CrossRef]
  44. Da Costa, P.R.F.; Costa, E.C.T.A.; Castro, S.S.L.; Fajardo, A.S.; Martínez-Huitle, C.A. A sequential process to treat a cashew-nut effluent: Electrocoagulation plus electrochemical oxidation. J. Electroanal. Chem. 2019, 834, 79–85. [Google Scholar] [CrossRef]
  45. Bensalah, N.; Abdel-Wahab, A. Electrochemical treatment of synthetic and actual dyeing wastewaters using BDD anodes. Air Soil Water Res. 2010, 3, 45–56. [Google Scholar] [CrossRef]
  46. Eaton, A.; Clesceri, L.; Rice, E.; Greenberg, A.; Franson, M.A. Standard Methods for Examination of Water and Wastewater, 21st ed.; American Public Health Association: Washington, DC, USA, 2005. [Google Scholar]
  47. Fernandes, A.; Pacheco, M.J.; Ciríaco, L.; Lopes, A. Anodic oxidation of a biologically treated leachate on a boron-doped diamond anode. J. Hazard. Mater. 2012, 199–200, 82–87. [Google Scholar] [CrossRef] [PubMed]
  48. Martínez-Huitle, C.A.; Panizza, M. Electrochemical oxidation of organic pollutants for wastewater treatment. Curr. Opin. Electrochem. 2018, 11, 62–71. [Google Scholar] [CrossRef]
  49. Fernandes, A.; Santos, D.; Pacheco, M.J.; Ciríaco, L.; Simões, R.; Gomes, A.C.; Lopes, A. Electrochemical treatment of cork boiling wastewater with a boron-doped diamond anode. Environ. Technol. 2015, 36, 26–35. [Google Scholar] [CrossRef]
  50. Fernandes, A.; Pereira, C.; Kozioł, V.; Pacheco, M.J.; Ciríaco, L.; Lopes, A. Emerging contaminants removal from effluents with complex matrices by electrooxidation. Sci. Total Environ. 2020, 740, 140153. [Google Scholar] [CrossRef]
  51. Brillas, E.; Martínez-Huitle, C.A. Decontamination of wastewaters containing synthetic organic dyes by electrochemical methods. An updated review. Appl. Catal. B Environ. 2014, 166–167, 603–643. [Google Scholar] [CrossRef]
  52. Mazellier, P.; Leroy, É.; De Laat, J.; Legube, B. Degradation of carbendazim by UV/H2O2 investigated by kinetic modelling. Environ. Chem. Lett. 2003, 1, 68–72. [Google Scholar] [CrossRef]
  53. Lacasa, E.; Llanos, J.; Cañizares, P.; Rodrigo, M.A. Electrochemical denitrificacion with chlorides using DSA and BDD anodes. Chem. Eng. J. 2012, 184, 66–71. [Google Scholar] [CrossRef]
  54. Caliari, P.C.; Pacheco, M.J.; Ciríaco, L.; Lopes, A. Tannery wastewater: Organic load and sulfide removal dynamics by electrochemical oxidation at different anode materials. Environ. Technol. Innov. 2019, 14, 100345. [Google Scholar] [CrossRef]
Figure 1. Chemical oxygen demand (COD) decay along the electrooxidation treatment of (a) Olive mill wastewater (OMW), (b) Slaughterhouse wastewater (SW), and (c) Winery wastewater (WW), utilizing NaCl or Na2SO4 as supporting electrolyte. Dissolved organic carbon (DOC) decay for the same experiments with (d) OMW, (e) SW, and (f) WW.
Water 12 03546 g001
Figure 2. DIC variation in time during the electrooxidation treatment of (a) Olive mill wastewater (OMW), (b) Slaughterhouse wastewater (SW), and (c) Winery wastewater (WW), utilizing NaCl or Na2SO4 as supporting electrolyte. pH variation for the same experiments with (d) OMW, (e) SW, and (f) WW.
Water 12 03546 g002
Figure 3. Total dissolved nitrogen (TDN) variation along the electrooxidation treatment of (a) Olive mill wastewater (OMW) and (b) Slaughterhouse wastewater (SW), utilizing NaCl or Na2SO4 as supporting electrolyte.
Water 12 03546 g003
Figure 4. Specific energy consumption evolution for the electrooxidation treatment of (a) Olive mill wastewater (OMW), (b) Slaughterhouse wastewater (SW), and (c) Winery wastewater (WW), utilizing NaCl or Na2SO4 as supporting electrolyte.
Water 12 03546 g004
Figure 5. Variation of 1/(Esp)2 with COD for the degradation assays performed with different electrolytes and wastewaters: dots—experimental results; lines—adjusted equations. OMW—Olive mill wastewater, SW—Slaughterhouse wastewater, WW—Winery wastewater.
Water 12 03546 g005
Table 1. A summary of the main research results previously reported for the degradation of effluents from food processing industries by electrochemical oxidation.
Type of EffluentAnode MaterialSupporting ElectrolyteCOD0
/mg L−1
pH0Applied Current Intensity, Current Density or VoltageVolume/LRecirculation Flow Rate
/L h−1
Electrolysis Time
/h
COD Removal/%Energy ConsumptionReference
Olive millBoron-doped diamond (BDD)--7007.13300 A m−20.6150(1)≈100 (2)300 kWh m−3 (2)[15]
wastewater NaCl 230 kWh m−3 (2)
Na2SO4 100 kWh m−3
--9350(1)≈4286 A m−2 (2)1012001473174 Wh gCOD−1[16]
Na2SO440,0004.4≈2857 A m−2 (2)10600151996 Wh gCOD−1[17]
Na2SO415,1785.76200 A m−20.254720.224 Wh gCOD−1[18]
15,315 300 A m−2 21.130 Wh gCOD−1
Ti/PtNaCl250,000 (2)5.22600 A m−2 (2)1540109312.3 Wh gCOD−1[19]
--42,0005.2350 A m−2 (2)0.3--540(1)[20]
NaCl234,0005.13125 A m−2 (2)10360072≈50246 Wh gPhenols−1[21]
--65,0005.27350 A m−20.50.121055(1)[22]
--≈50,0004.676.9 A m−20.8--2486(1)[23]
≈10,000 526
2 41
8 32
Na2SO4 4.6 54
KCl 100
NaCl 100
Ti/Ta/Pt/IrNaCl1475(1)5 V1022322582.1 Wh gCOD−1[24]
7 V 2556.1 Wh gCOD−1
9 V 3576.9 Wh gCOD−1
3060 2527.1 Wh gCOD−1
5180 1528.3 Wh gCOD−1
NaCl18,1005.514 V4515858.9(1)[25]
16 V 70.8
18 V 63.4
Na2SO438,100(1) 20 7
Na2SO4 + FeCl320,2008.516 V 739.1
20 V 45.2
24 V 60.2
Ti/RuO2NaCl41,0004.571350 A m−20.428.44799.621.2 Wh gCOD−1 (2)[26]
HClO41220(1)500 A m−20.11--55232.5 Wh gCOD−1 (2)[27]
HClO4 + NaCl 150 A m−2 543.5 Wh gCOD−1 (2)
HClO4 + FeCl3 397 Wh gCOD−1 (2)
HClO4 + Na2SO4 31 (2)7.5 Wh gCOD−1 (2)
Ti/TiRuO2--26,7505.0≈617 A m−2 (2)0.418033 (2)≈89 (2)(1)[28]
NaCl 21 (2)≈96 (2)800 kWh m−3
Ti/IrO2HClO41300(1)500 A m−20.11--20 (2)60(1)[29]
HClO4 + NaCl 7.5≈20 (2)72 Wh gCOD−1
IrO2 based Dimensionally Stable Anode (DSA)KNO31200(1)153 A m−20.03--≈48 (2)16(1)[30]
RuO2 based DSA 1100 69 A m−2 99
Canola-oilBDDNaCl1750 (2)(1)9.1 A m−21--723(1)[31]
refinery 91 A m−2 96
wastewater 136.6 A m−2 96
DairyPt/TiNaCl4000(1)2000 A m−20.15--4≈100 (2)(1)[32]
wastewaterPt-IrO2/Ti ≈78 (2)
IrO2/Ti ≈85 (2)
15,000 1000 A m−2 647
3750 89
Na2SO4 57.7
BDD--33502.17357 A m−21194.4688137 Wh gCOD−1 (2)[33]
Slaughter- houseBDD--22806.68357 A m−21194.4385100 Wh gCOD−1 (2)[11]
wastewaterBDD--23666.3357 A m−21194.4697163 Wh gCOD−1 (2)[33]
WineryBDD--34905.6600 A m−20.1--770(1)[34]
wastewater Na2SO4 6≈100 (2)96 kWh m−3
NaCl 6≈100 (2)(1)
DistilleryPbO2-Ti--≈13,500≈7.1150 A m−20.2--856.32.23 Wh gCOD−1[35]
wastewater NaCl 90.81.31 Wh gCOD−1
RuO2-Ti-- 62.01.91 Wh gCOD−1
NaCl 92.11.19 Wh gCOD−1
Graphite 80.61.13 Wh gCOD−1
Ti sponge--≈920019 A15900651.505.23 Wh gCOD−1[36]
H2O2 67.713.71 Wh gCOD−1
NaCl 89.622.82 Wh gCOD−1
BDD--324112.5300 A m−20.178471.922.8 Wh gCOD−1[37]
216 81.520.1 Wh gCOD−1
400 A m−2 78 75.736.8 Wh gCOD−1
216 88.330.0 Wh gCOD−1
BDDNa2SO412,64710.4600 A m−22545007 (2)81.3173.19 kWh m−3[38]
NaCl 65.7184.45 kWh m−3
BreweryGraphite--24704.5120 A m−2241800.8318(1)[39]
wastewater NaCl 35
372 A m−2 93 (2)
745 A m−2 97 (2)
BDD--18773.080 A m−20.45--665≈22 kWh m−3 (2)[14]
160 A m−2 91≈55 kWh m−3 (2)
240 A m−2 98≈125 kWh m−3 (2)
StarchRuO2/TiNaCl(1)(1)750 A m−20.2--4.275.823.4 Wh gCOD−1[40]
wastewaterPbO2/Ti 50.544.8 Wh gCOD−1
Sugar beet wastewaterBDD--15,6735491 A m−21--4.97528.43 kWh m−3[41]
Coke-plantDSA--21437.2(1)0.6--457.80(1)[42]
wastewaterSn-Pd-Ru oxide coated titanium 59.24
PbO2/Ti 66.51
NaCl 250 A m−2 1264.8
750 A m−2 467.4
1500 A m−2 275.2
Cashew-nut wastewaterTi/RuO2-TiO2--1540(1)1000 A m−20.03--672(1)[43]
BDD 100(1)
BDD--2129.5355 A m−20.35--260 (2)(1)[44]
(1) Value not specified. (2) Value obtained indirectly from data presented in the paper or from a figure.
Table 2. Characterization of the samples of olive mill, slaughterhouse and winery wastewaters used in the case-study.
ParameterMean Value (±SD 1)
Olive Mill
Wastewater
Slaughterhouse
Wastewater
Winery
Wastewater
Chemical oxygen demand/g L−120.5 ± 0.63.64 ± 0.060.259 ± 0.002
Total dissolved carbon/g L−14.9 ± 0.10.677 ± 0.0030.279 ± 0.007
Dissolved organic carbon/g L−14.9 ± 0.10.579 ± 0.0010.057 ± 0.001
Dissolved inorganic carbon/mg L−111 ± 397 ± 2222 ± 8
Total dissolved nitrogen/mg L−150 ± 1129 ± 25 ± 1
pH5.1 ± 0.17.06 ± 0.047.8 ± 0.1
Conductivity/mS cm−11.0 ± 0.10.9 ± 0.10.6 ± 0.1
1 SD—Standard deviation.
Publisher’s Note: MDPI stays neutral with regard to jurisdictional claims in published maps and institutional affiliations.

