Photocatalytic Degradation of Polyamide 66; Evaluating the Feasibility of Photocatalysis as a Microfibre-Targeting Technology

 , ,
, ,  and
and 
Abstract
:1. Introduction
2. Materials and Methods
2.1. Materials
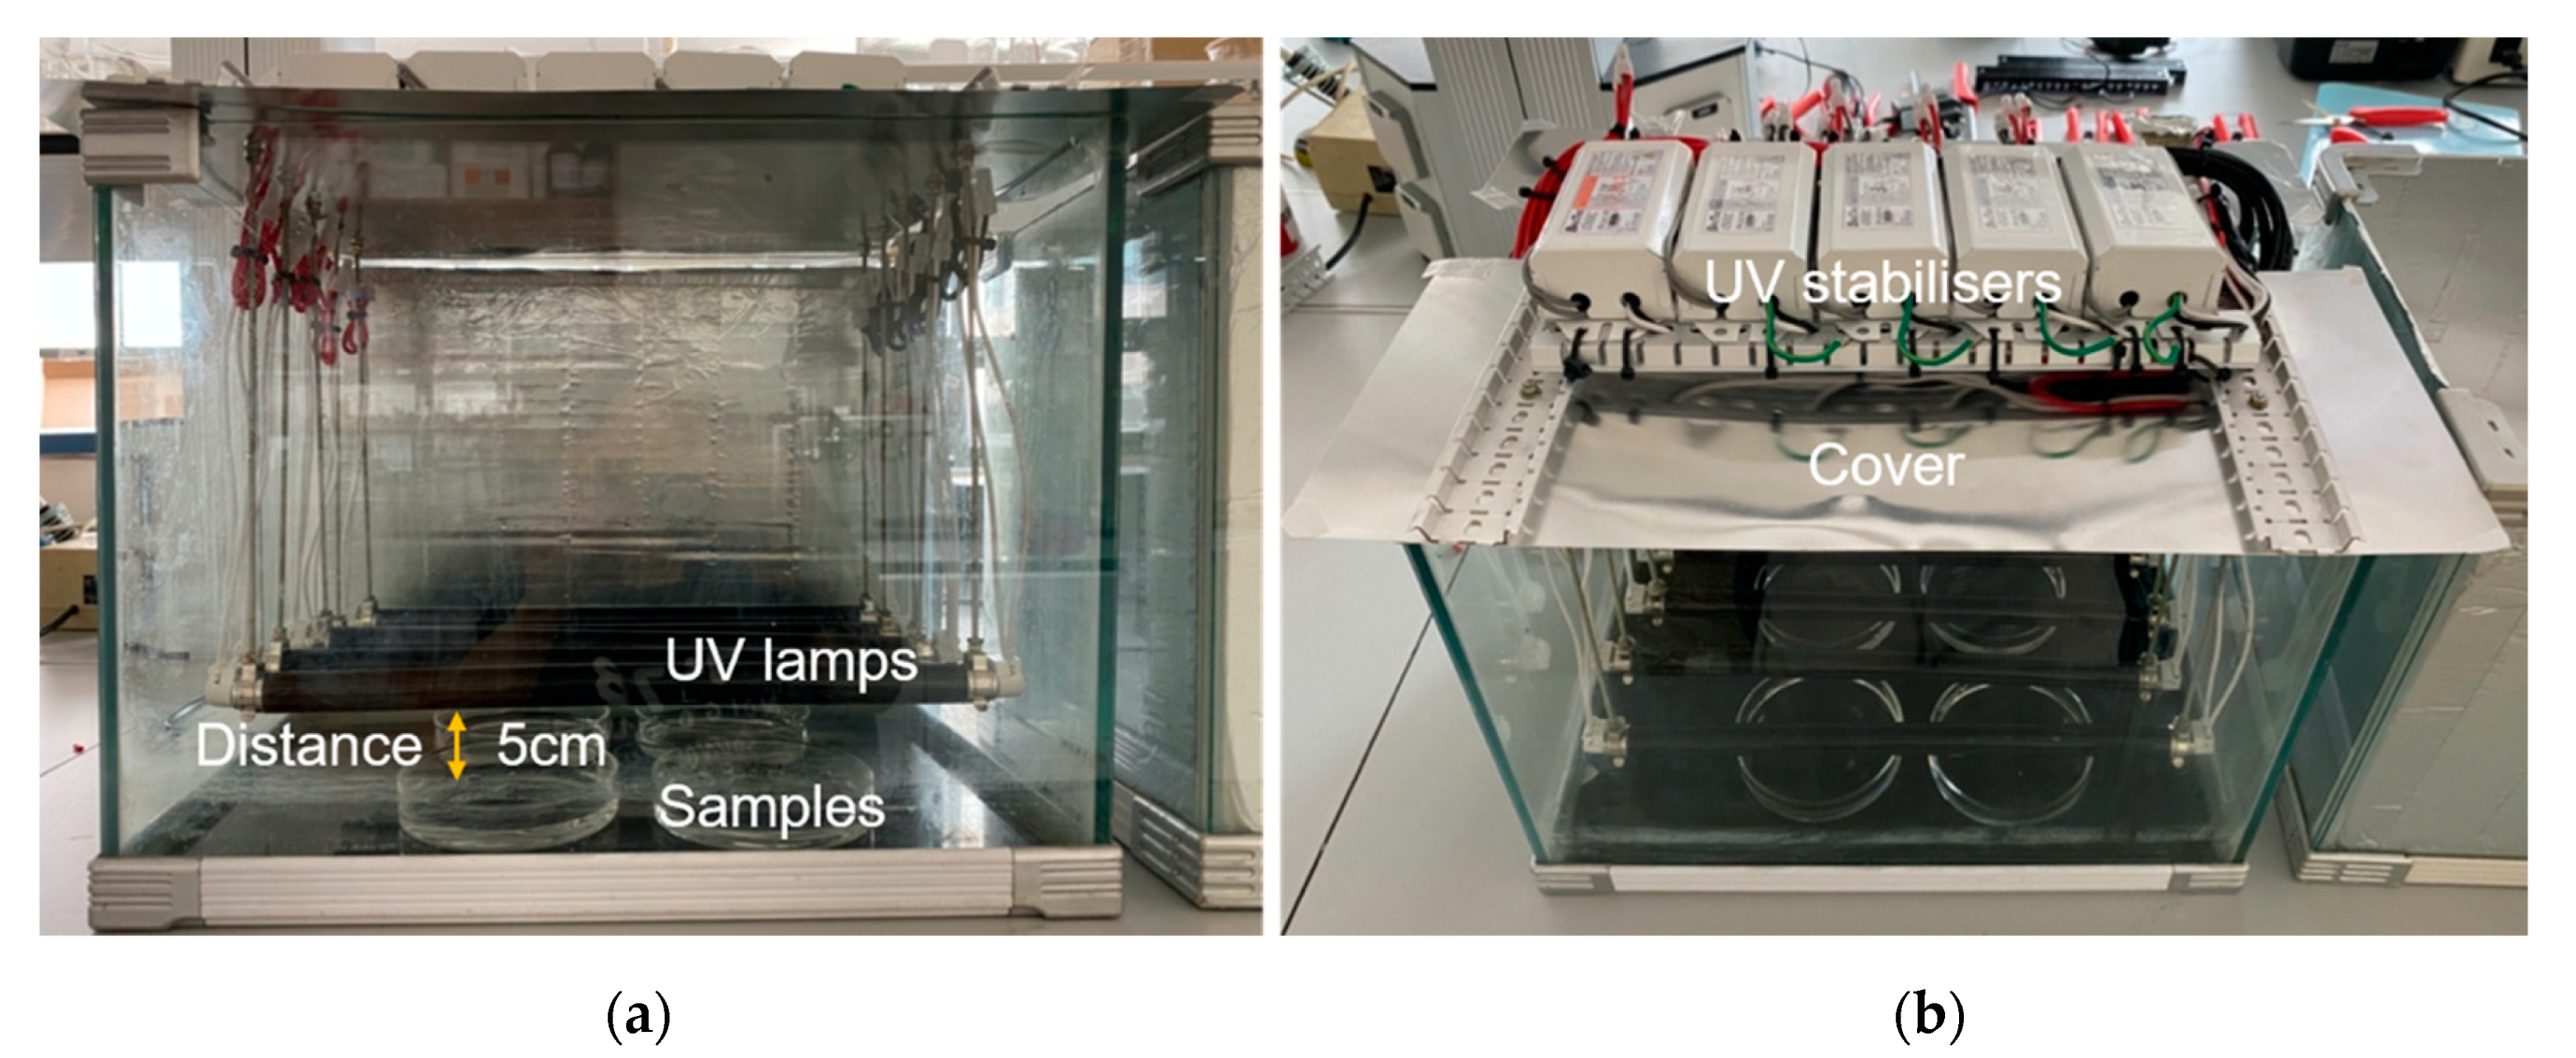
2.2. Construction of Photocatalytic Degradation Reaction Chambers
2.3. Experimental Design
2.4. Measurement of the Degradation of the PA66 Microfibres
2.4.1. Mass Loss
2.4.2. Morphological Properties of PA66 Microfibres
2.4.3. Surface Chemistry of the PA66 Microfibres
2.4.4. Monitoring the Degradation of the Suspension of PA66 Fibres with the Analysis of the Chemical Oxygen Demand (COD) in Solution
3. Results and Discussion
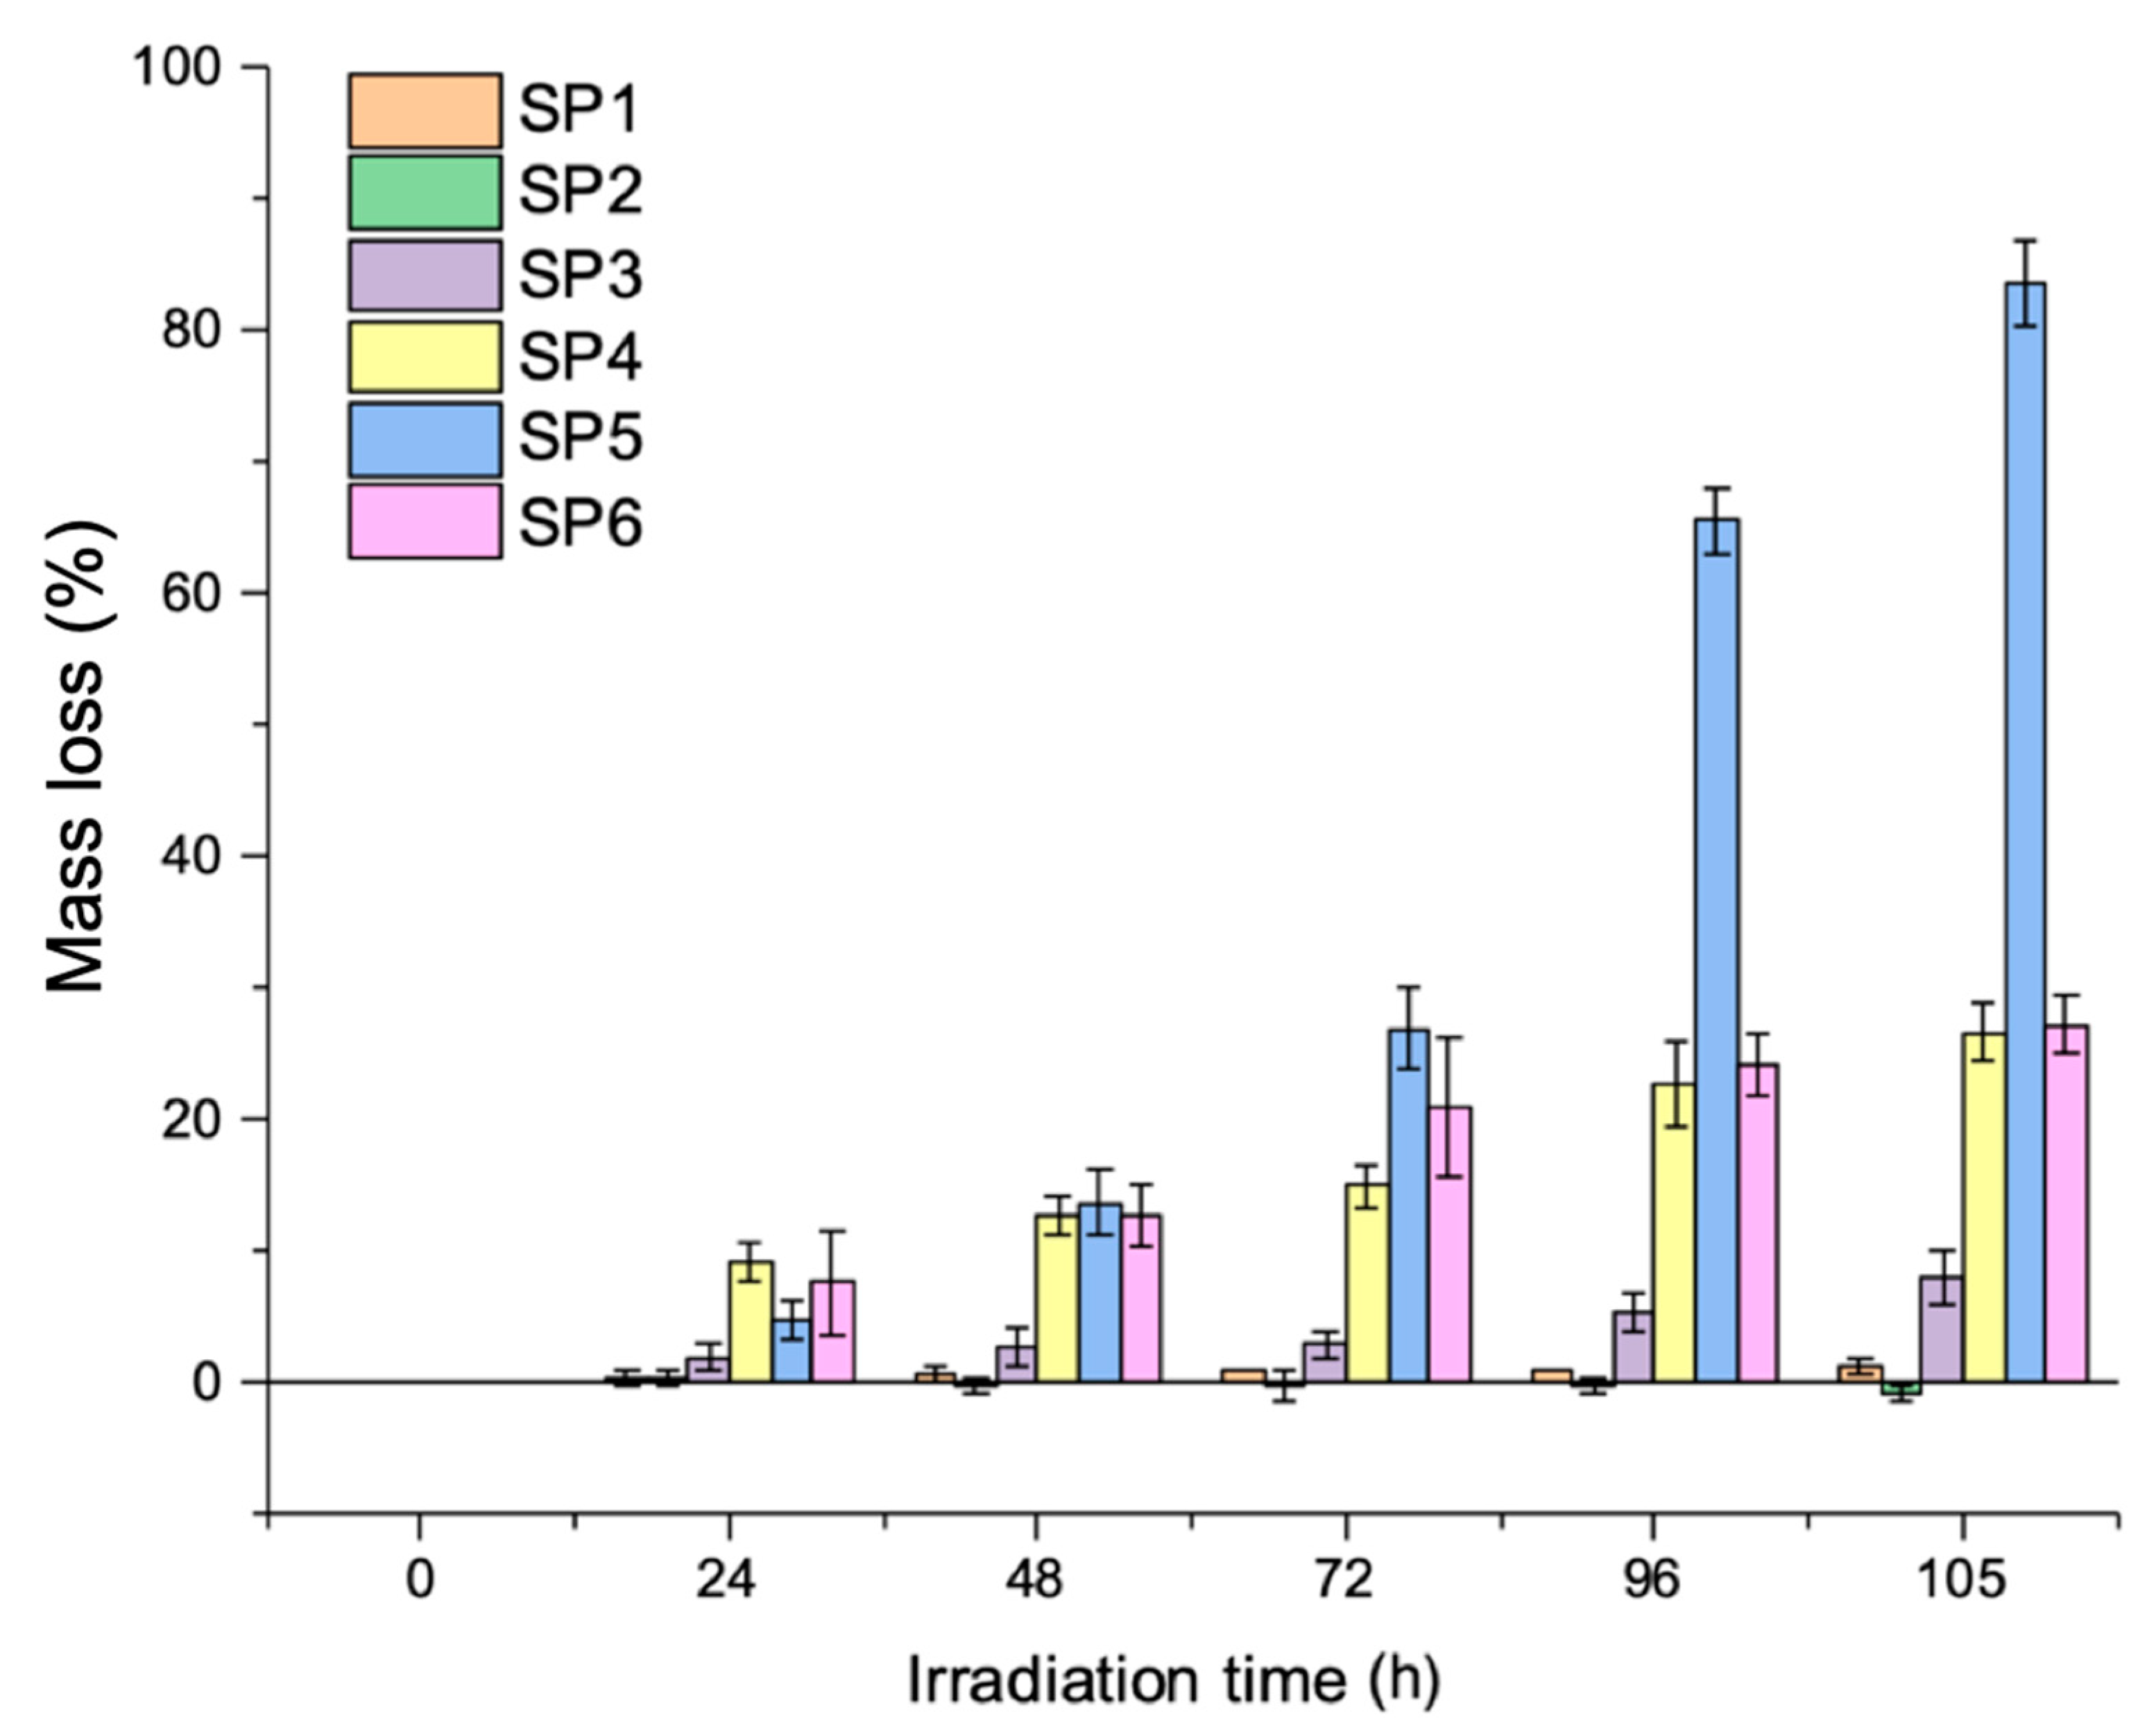
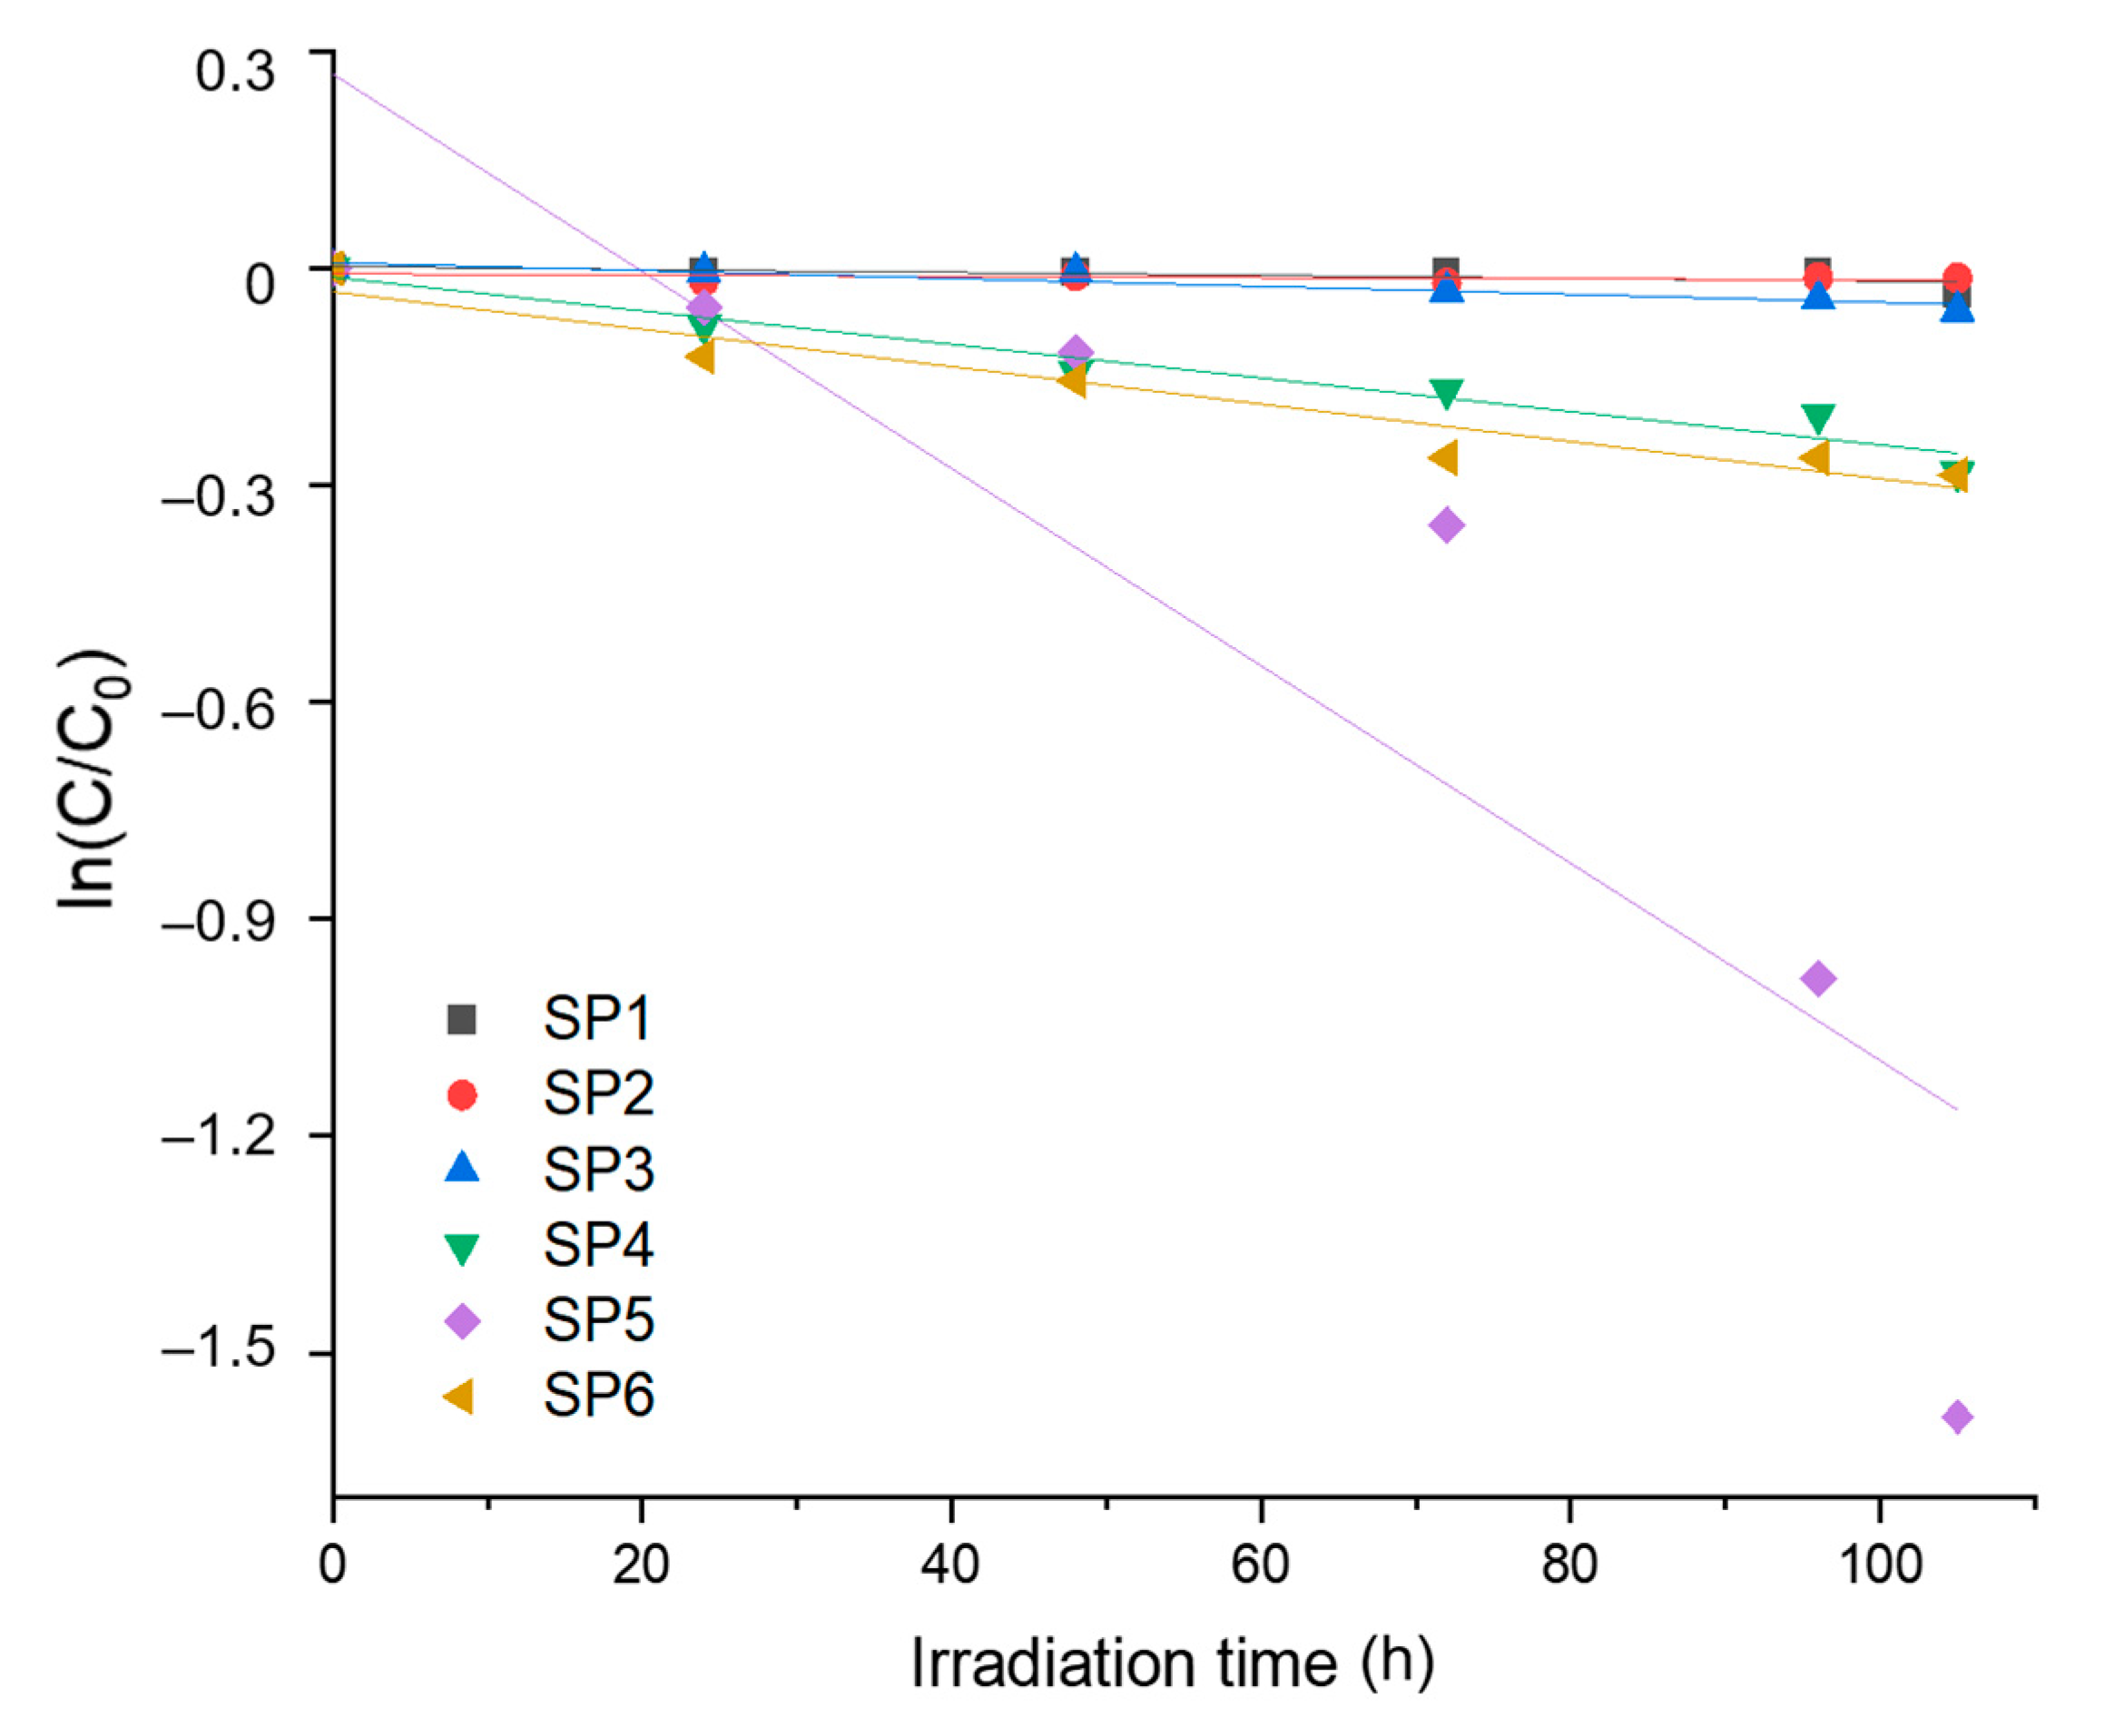
3.1. Effect of UV Irradiation and Catalyst on the Kinetics of the Photocatalytic Degradation of PA66 Microfibres
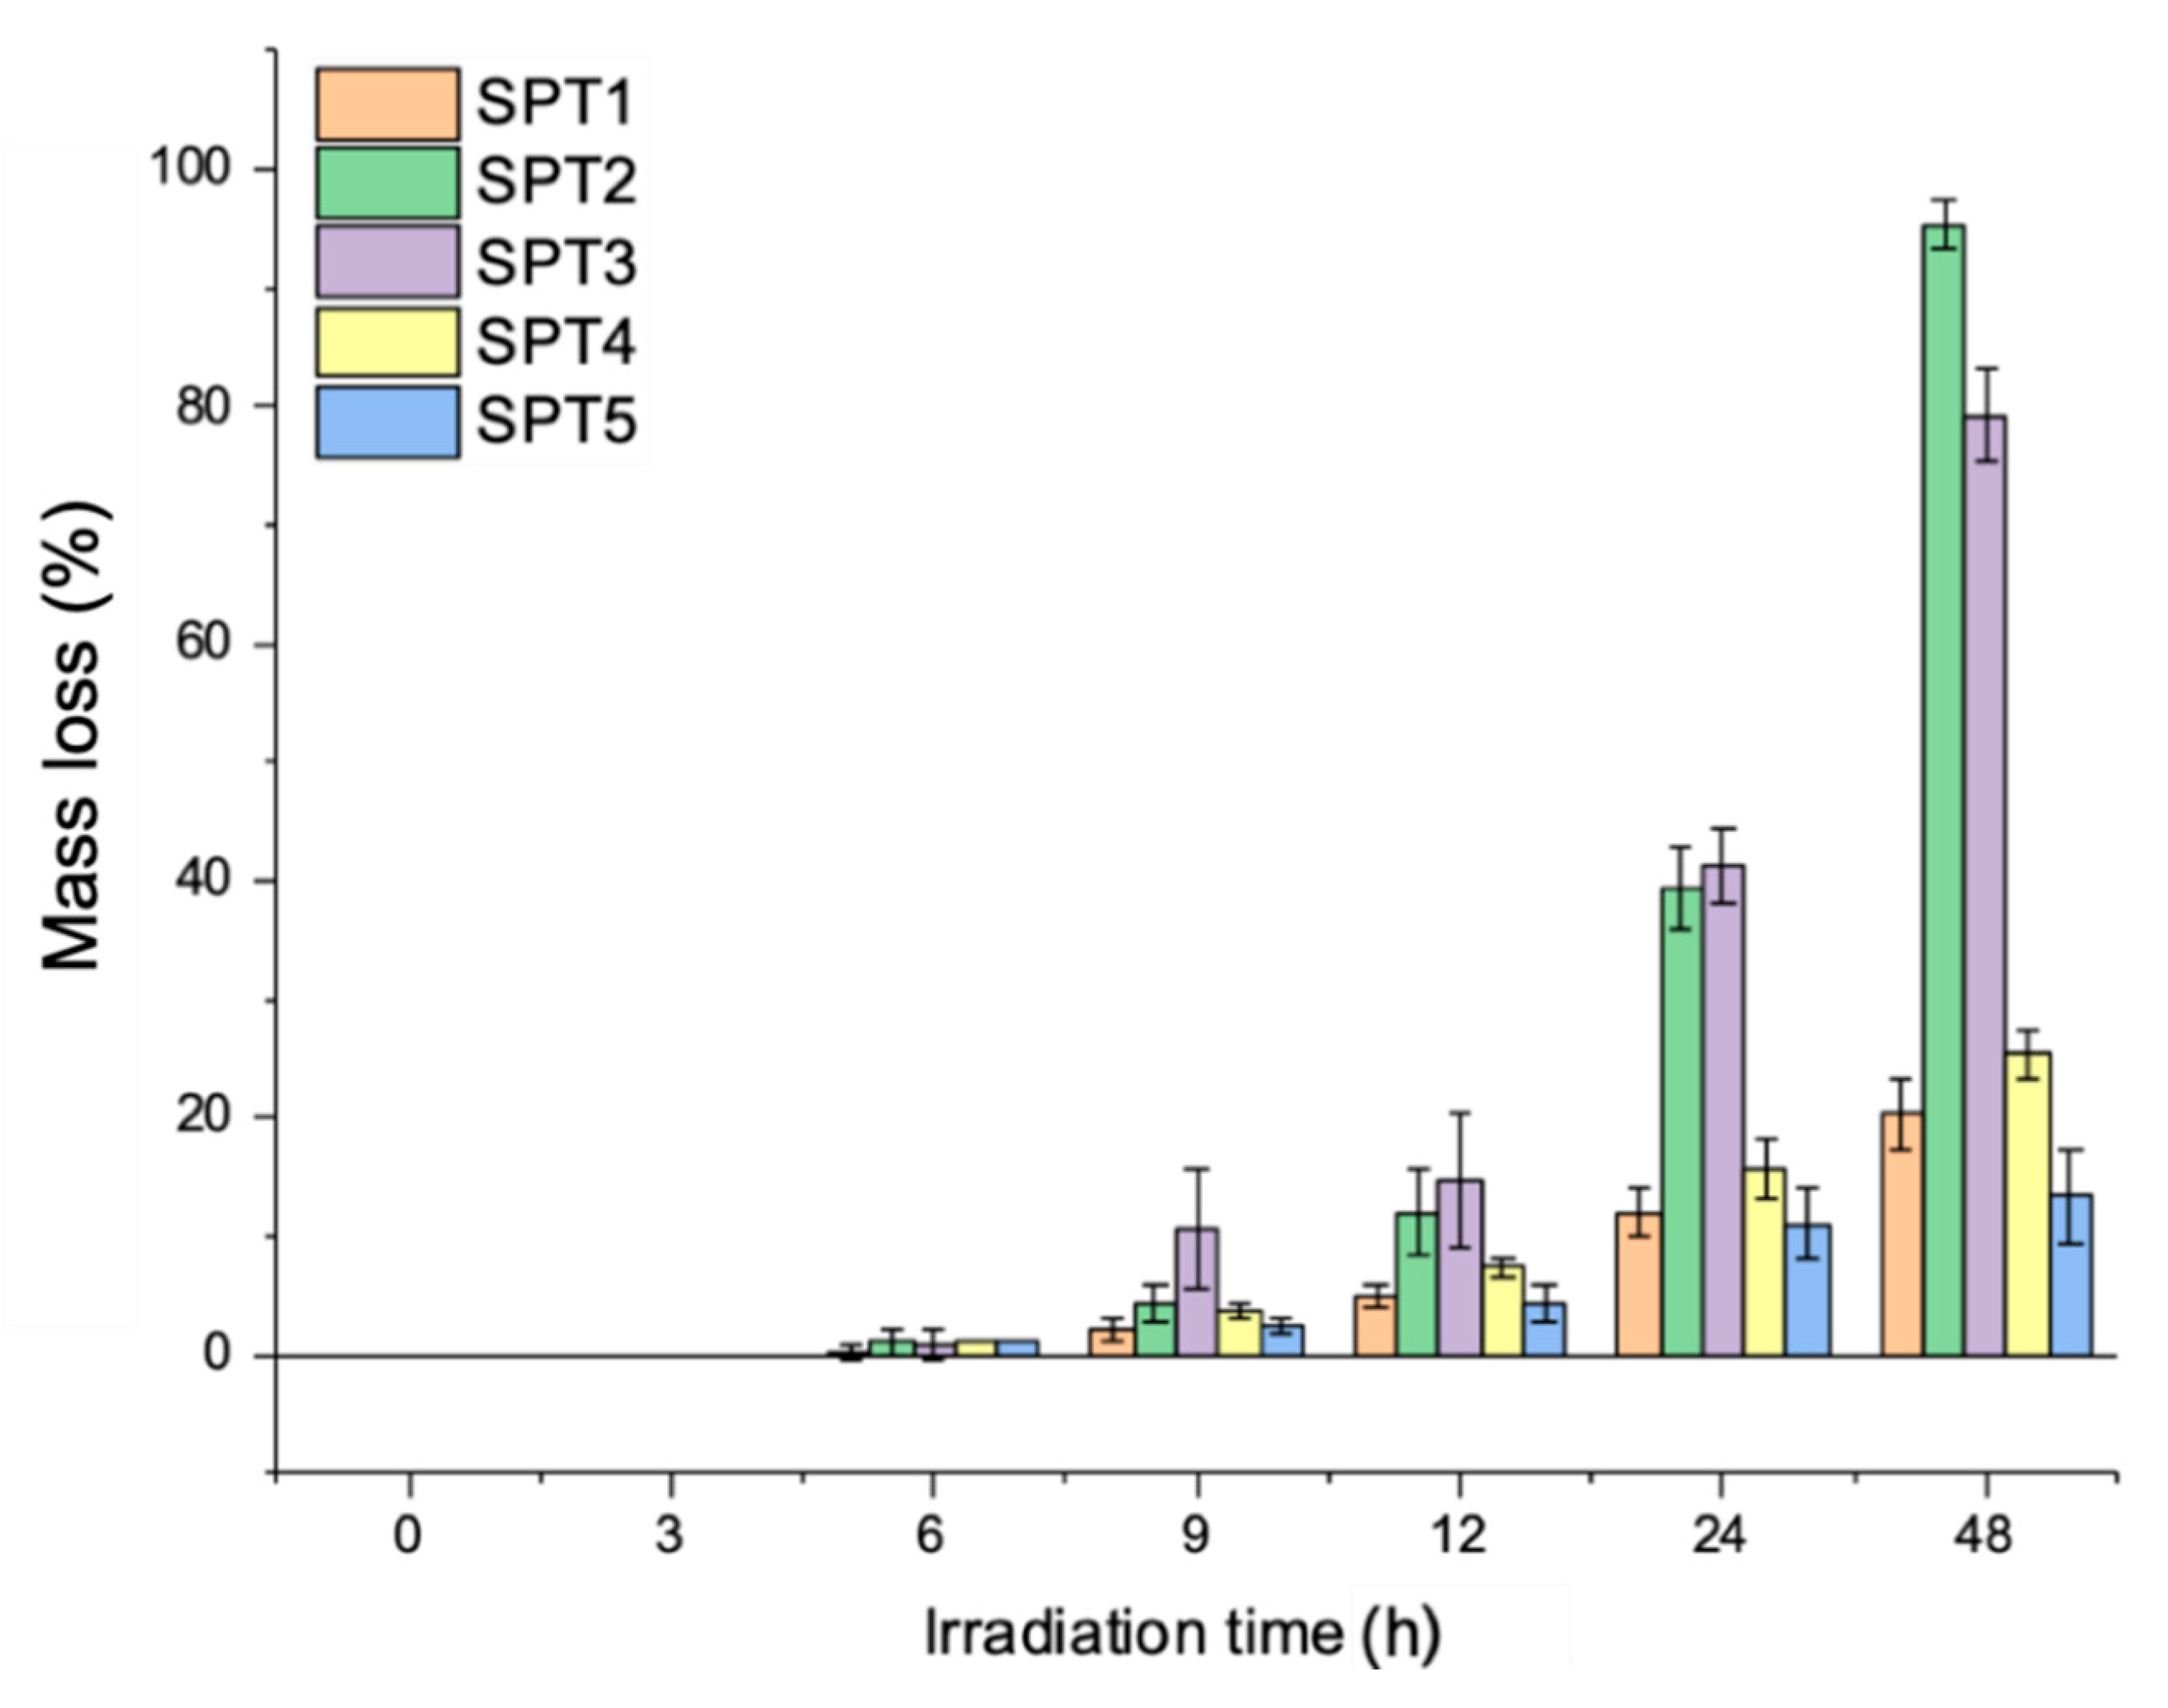
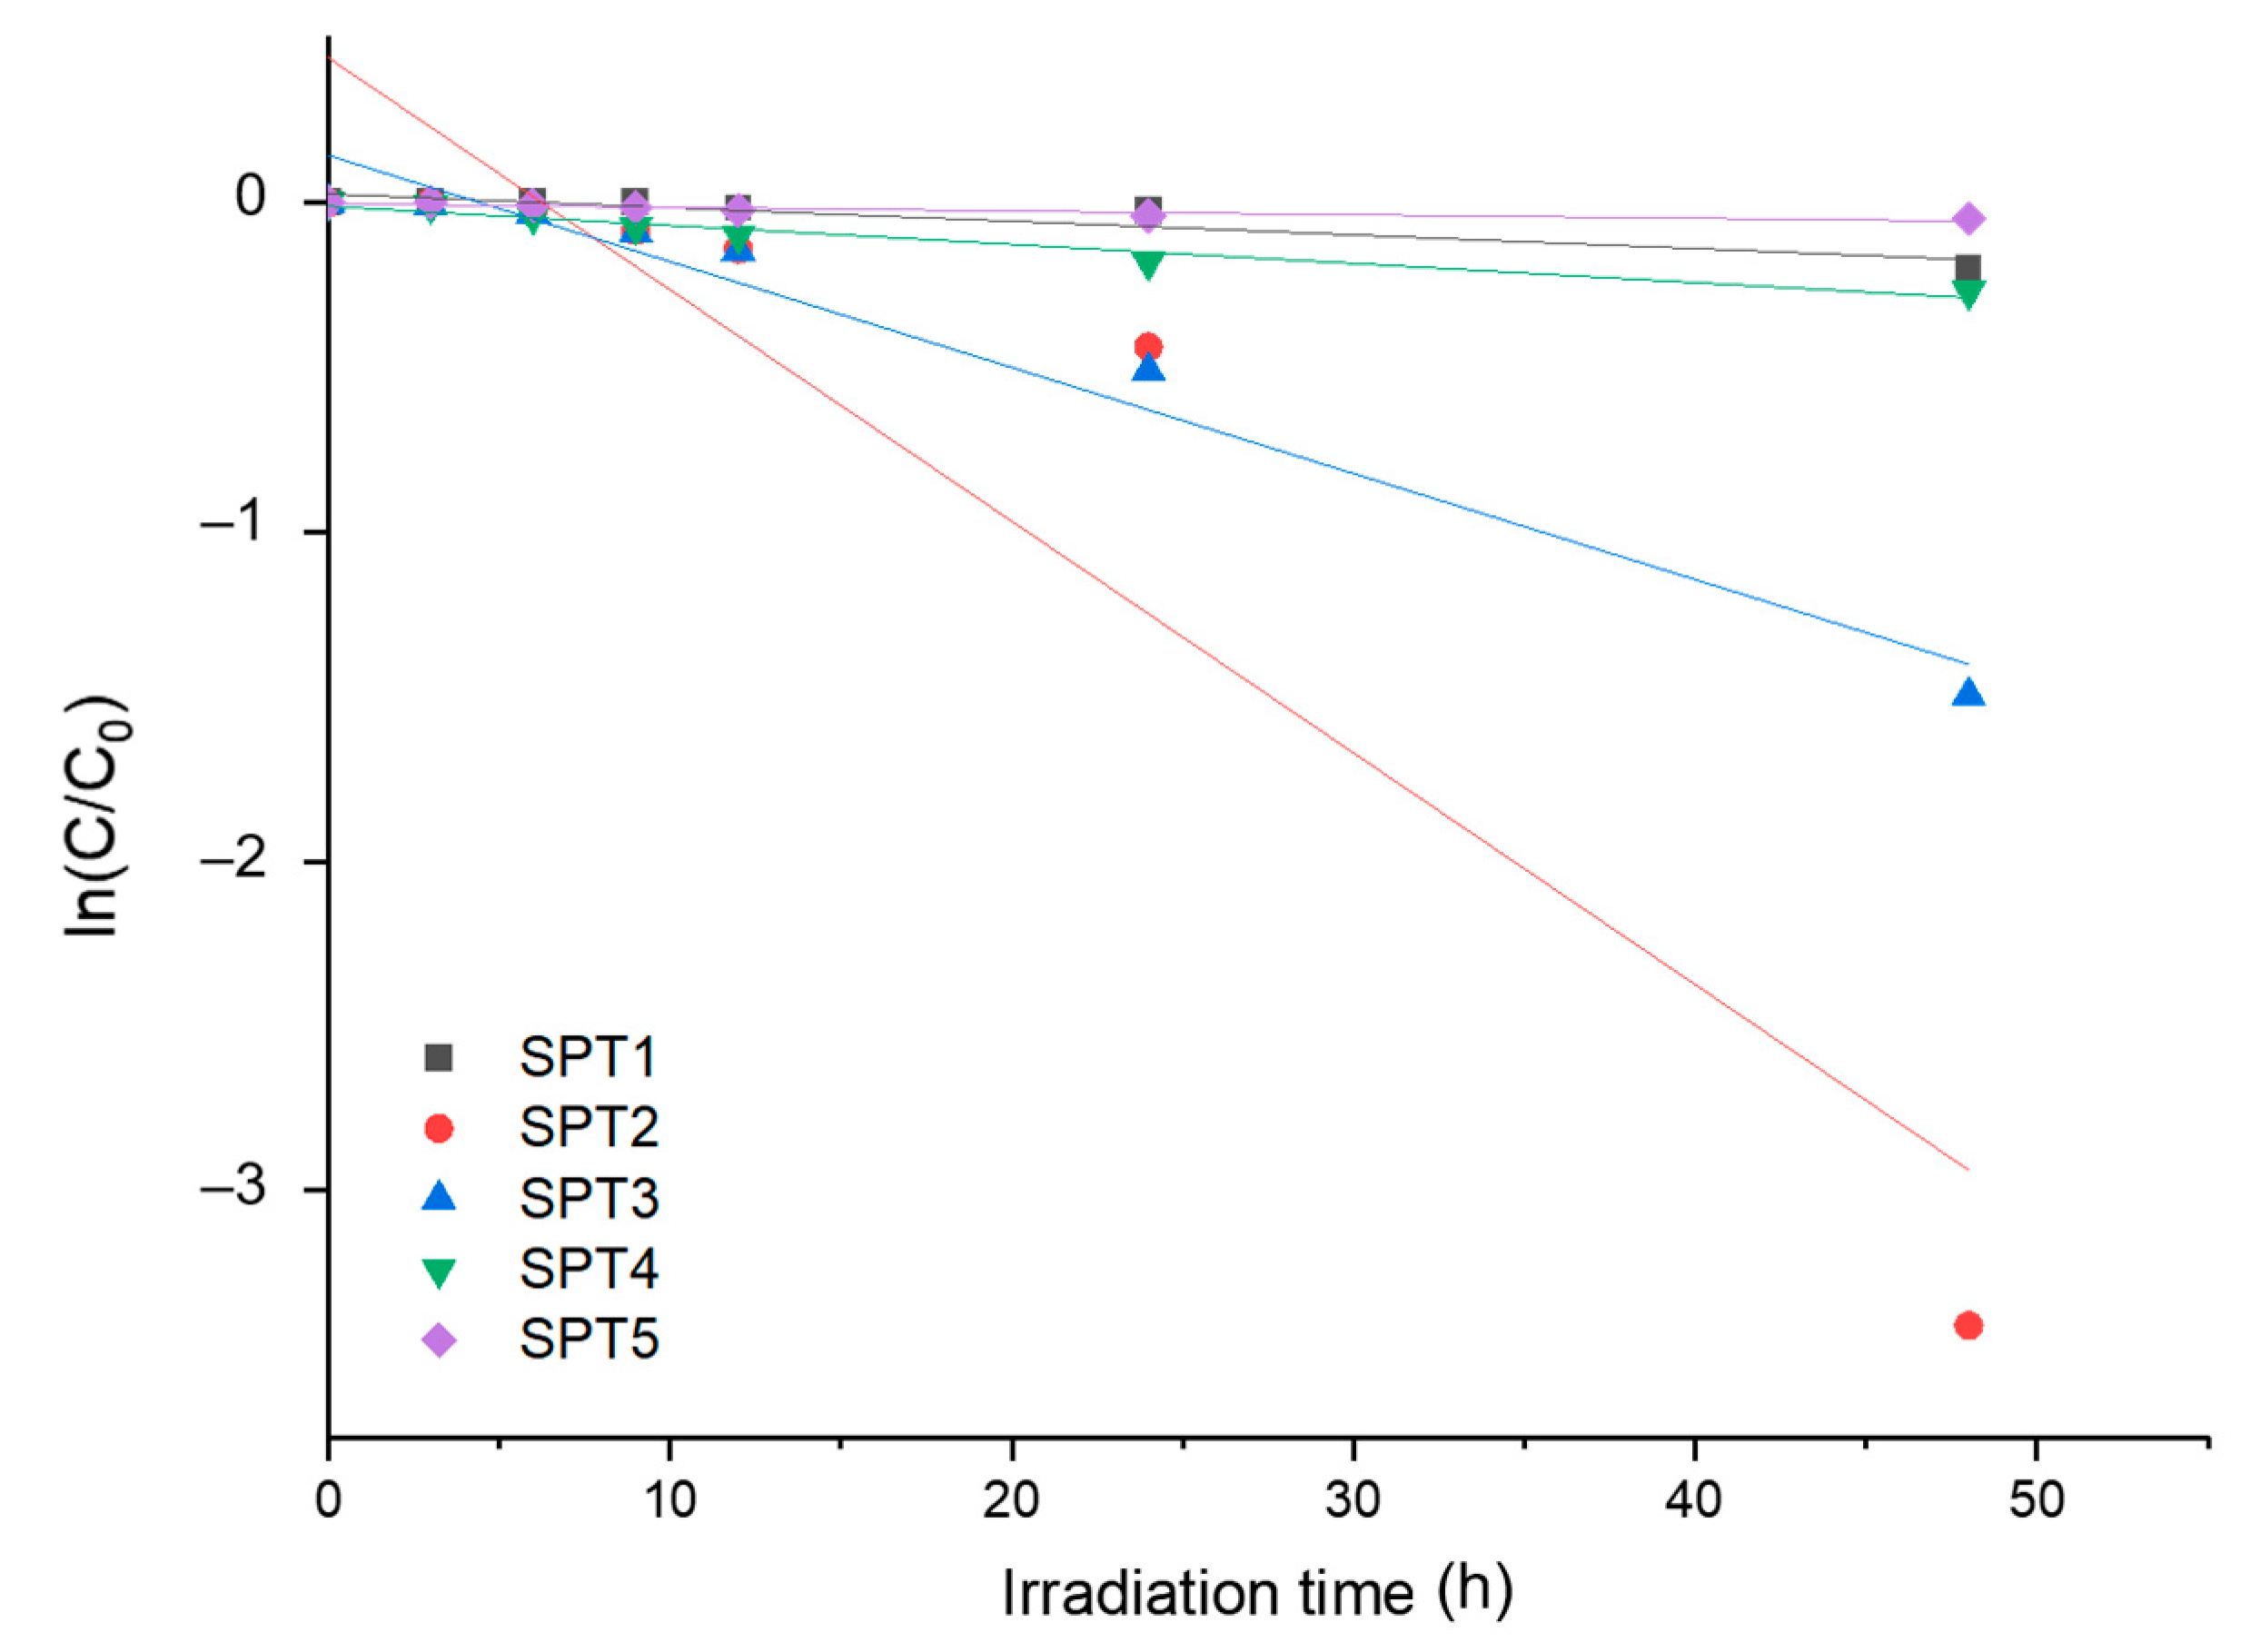
3.2. Mass Loss and Photocatalytic Degradation Kinetics: Effects of the Concentrations of Catalysts
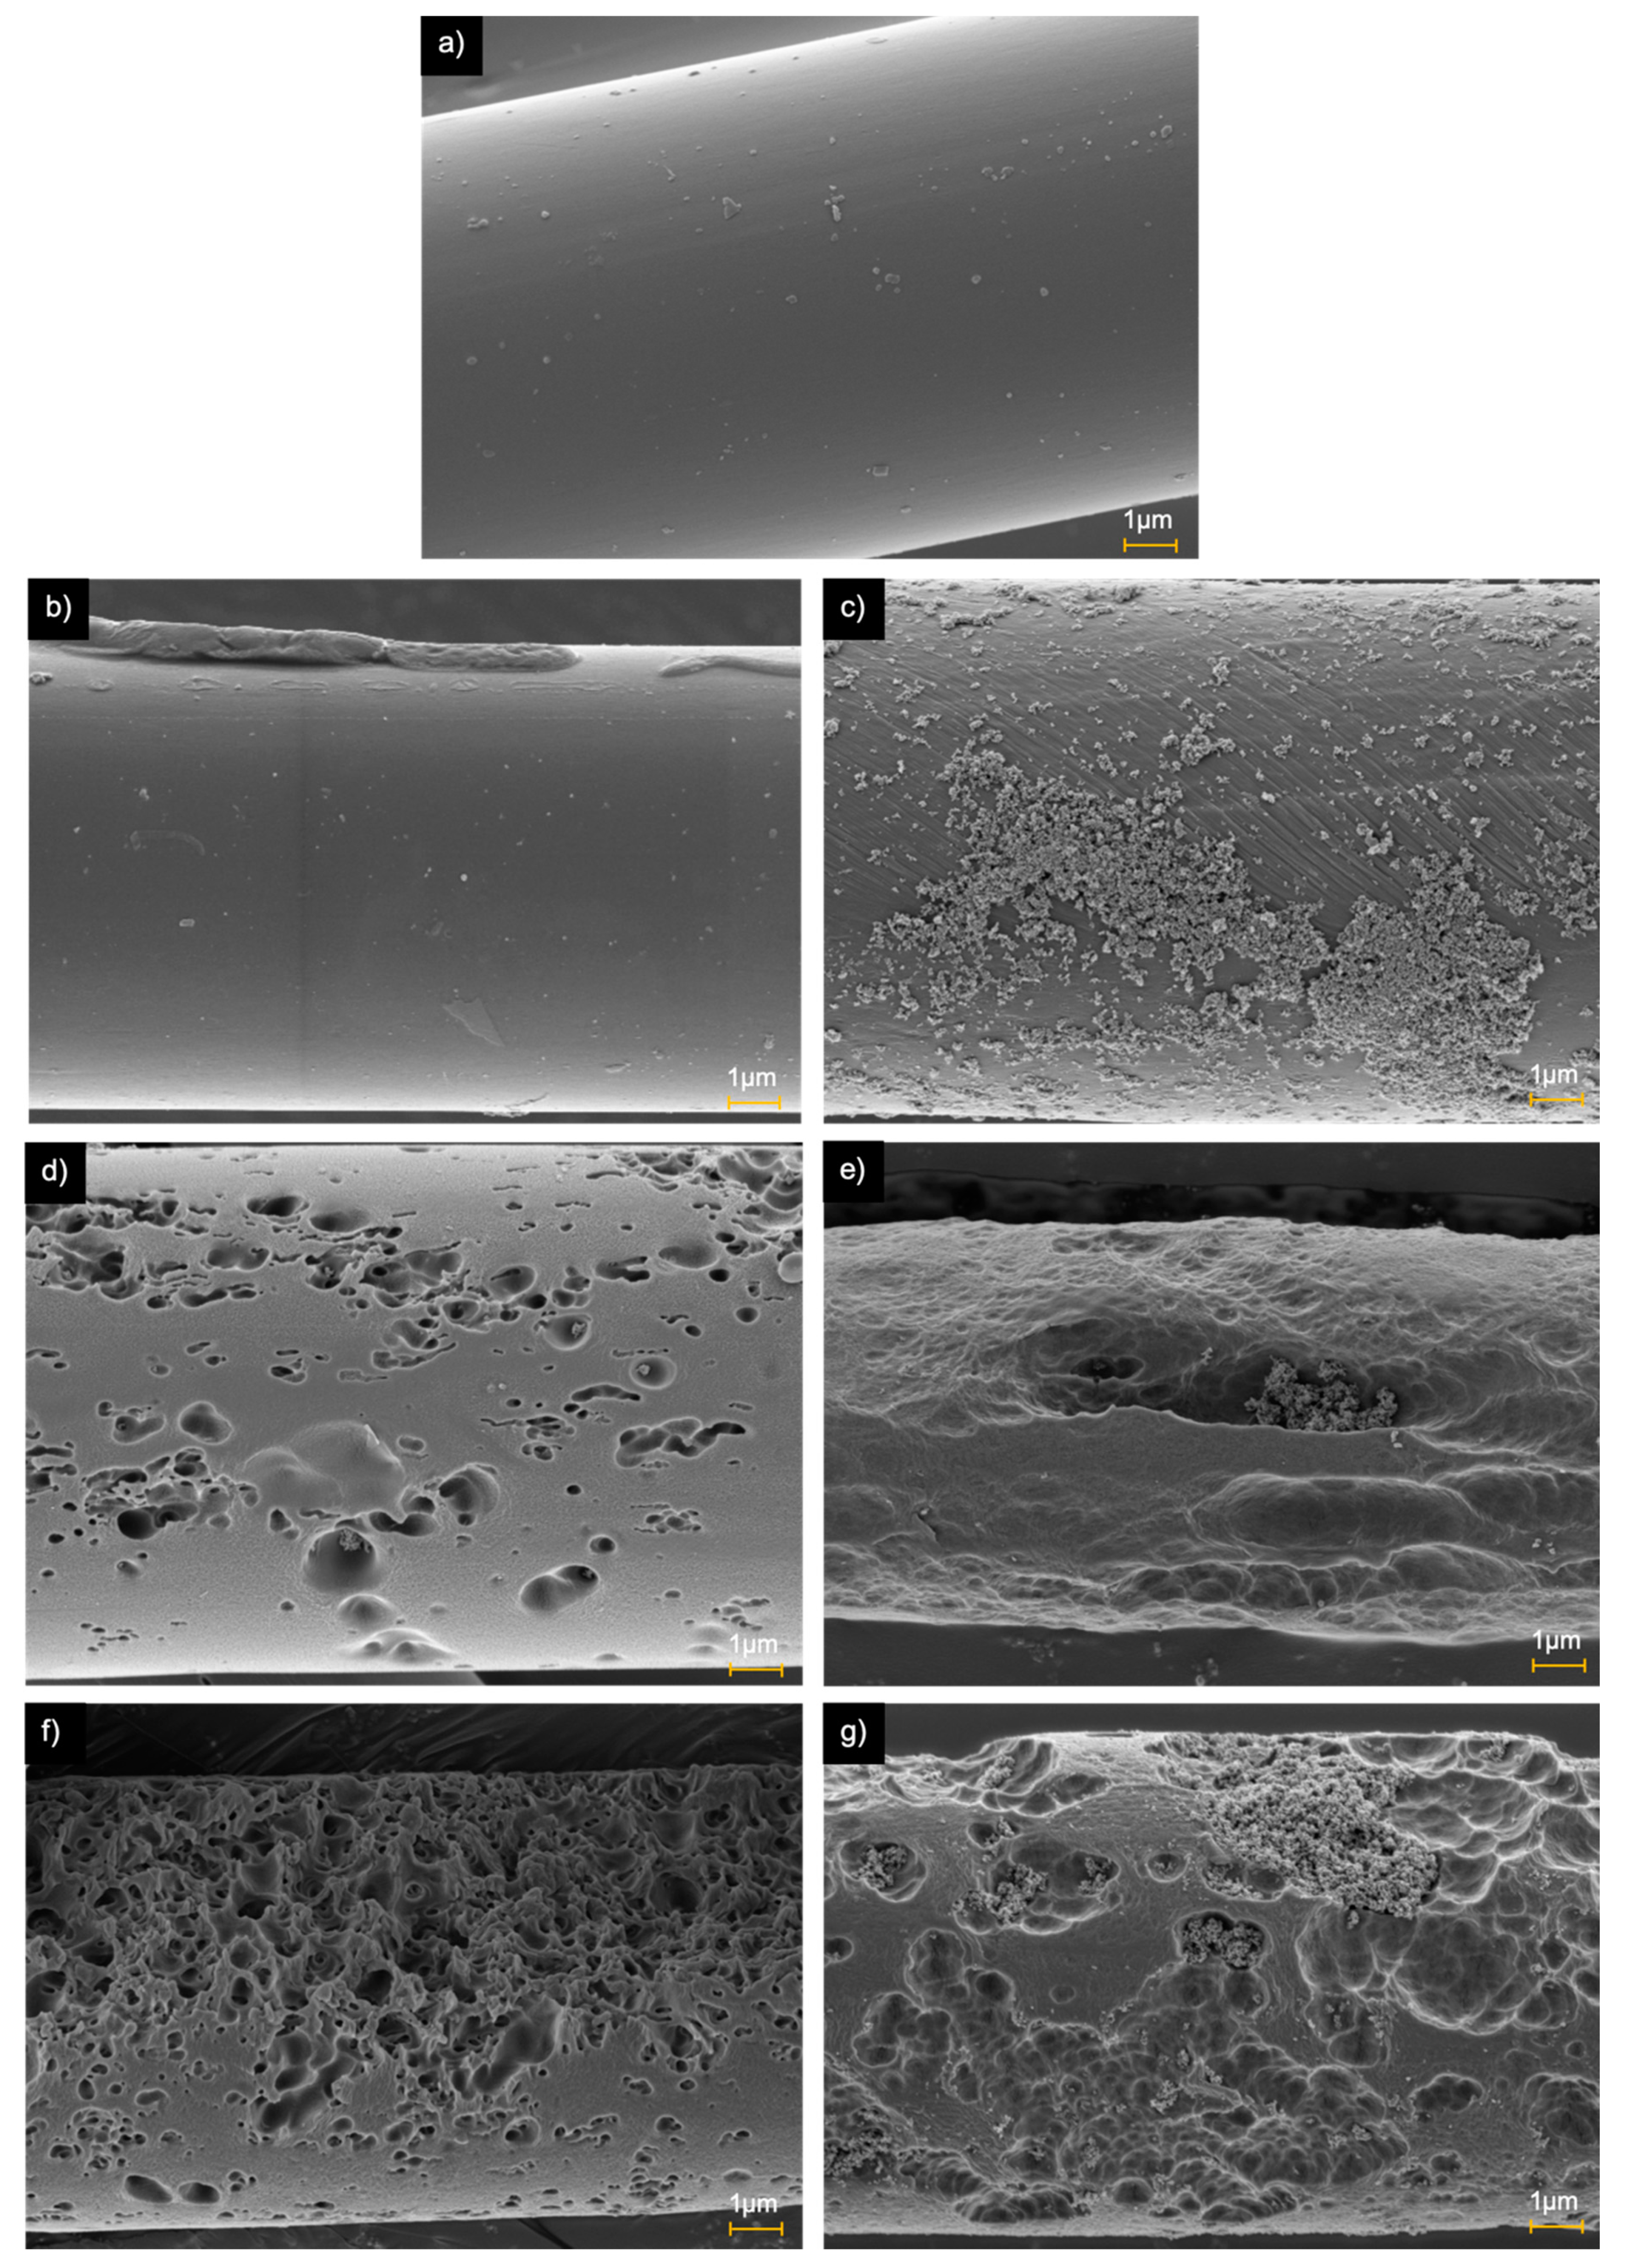
3.3. Morphological Changes of Microfibres
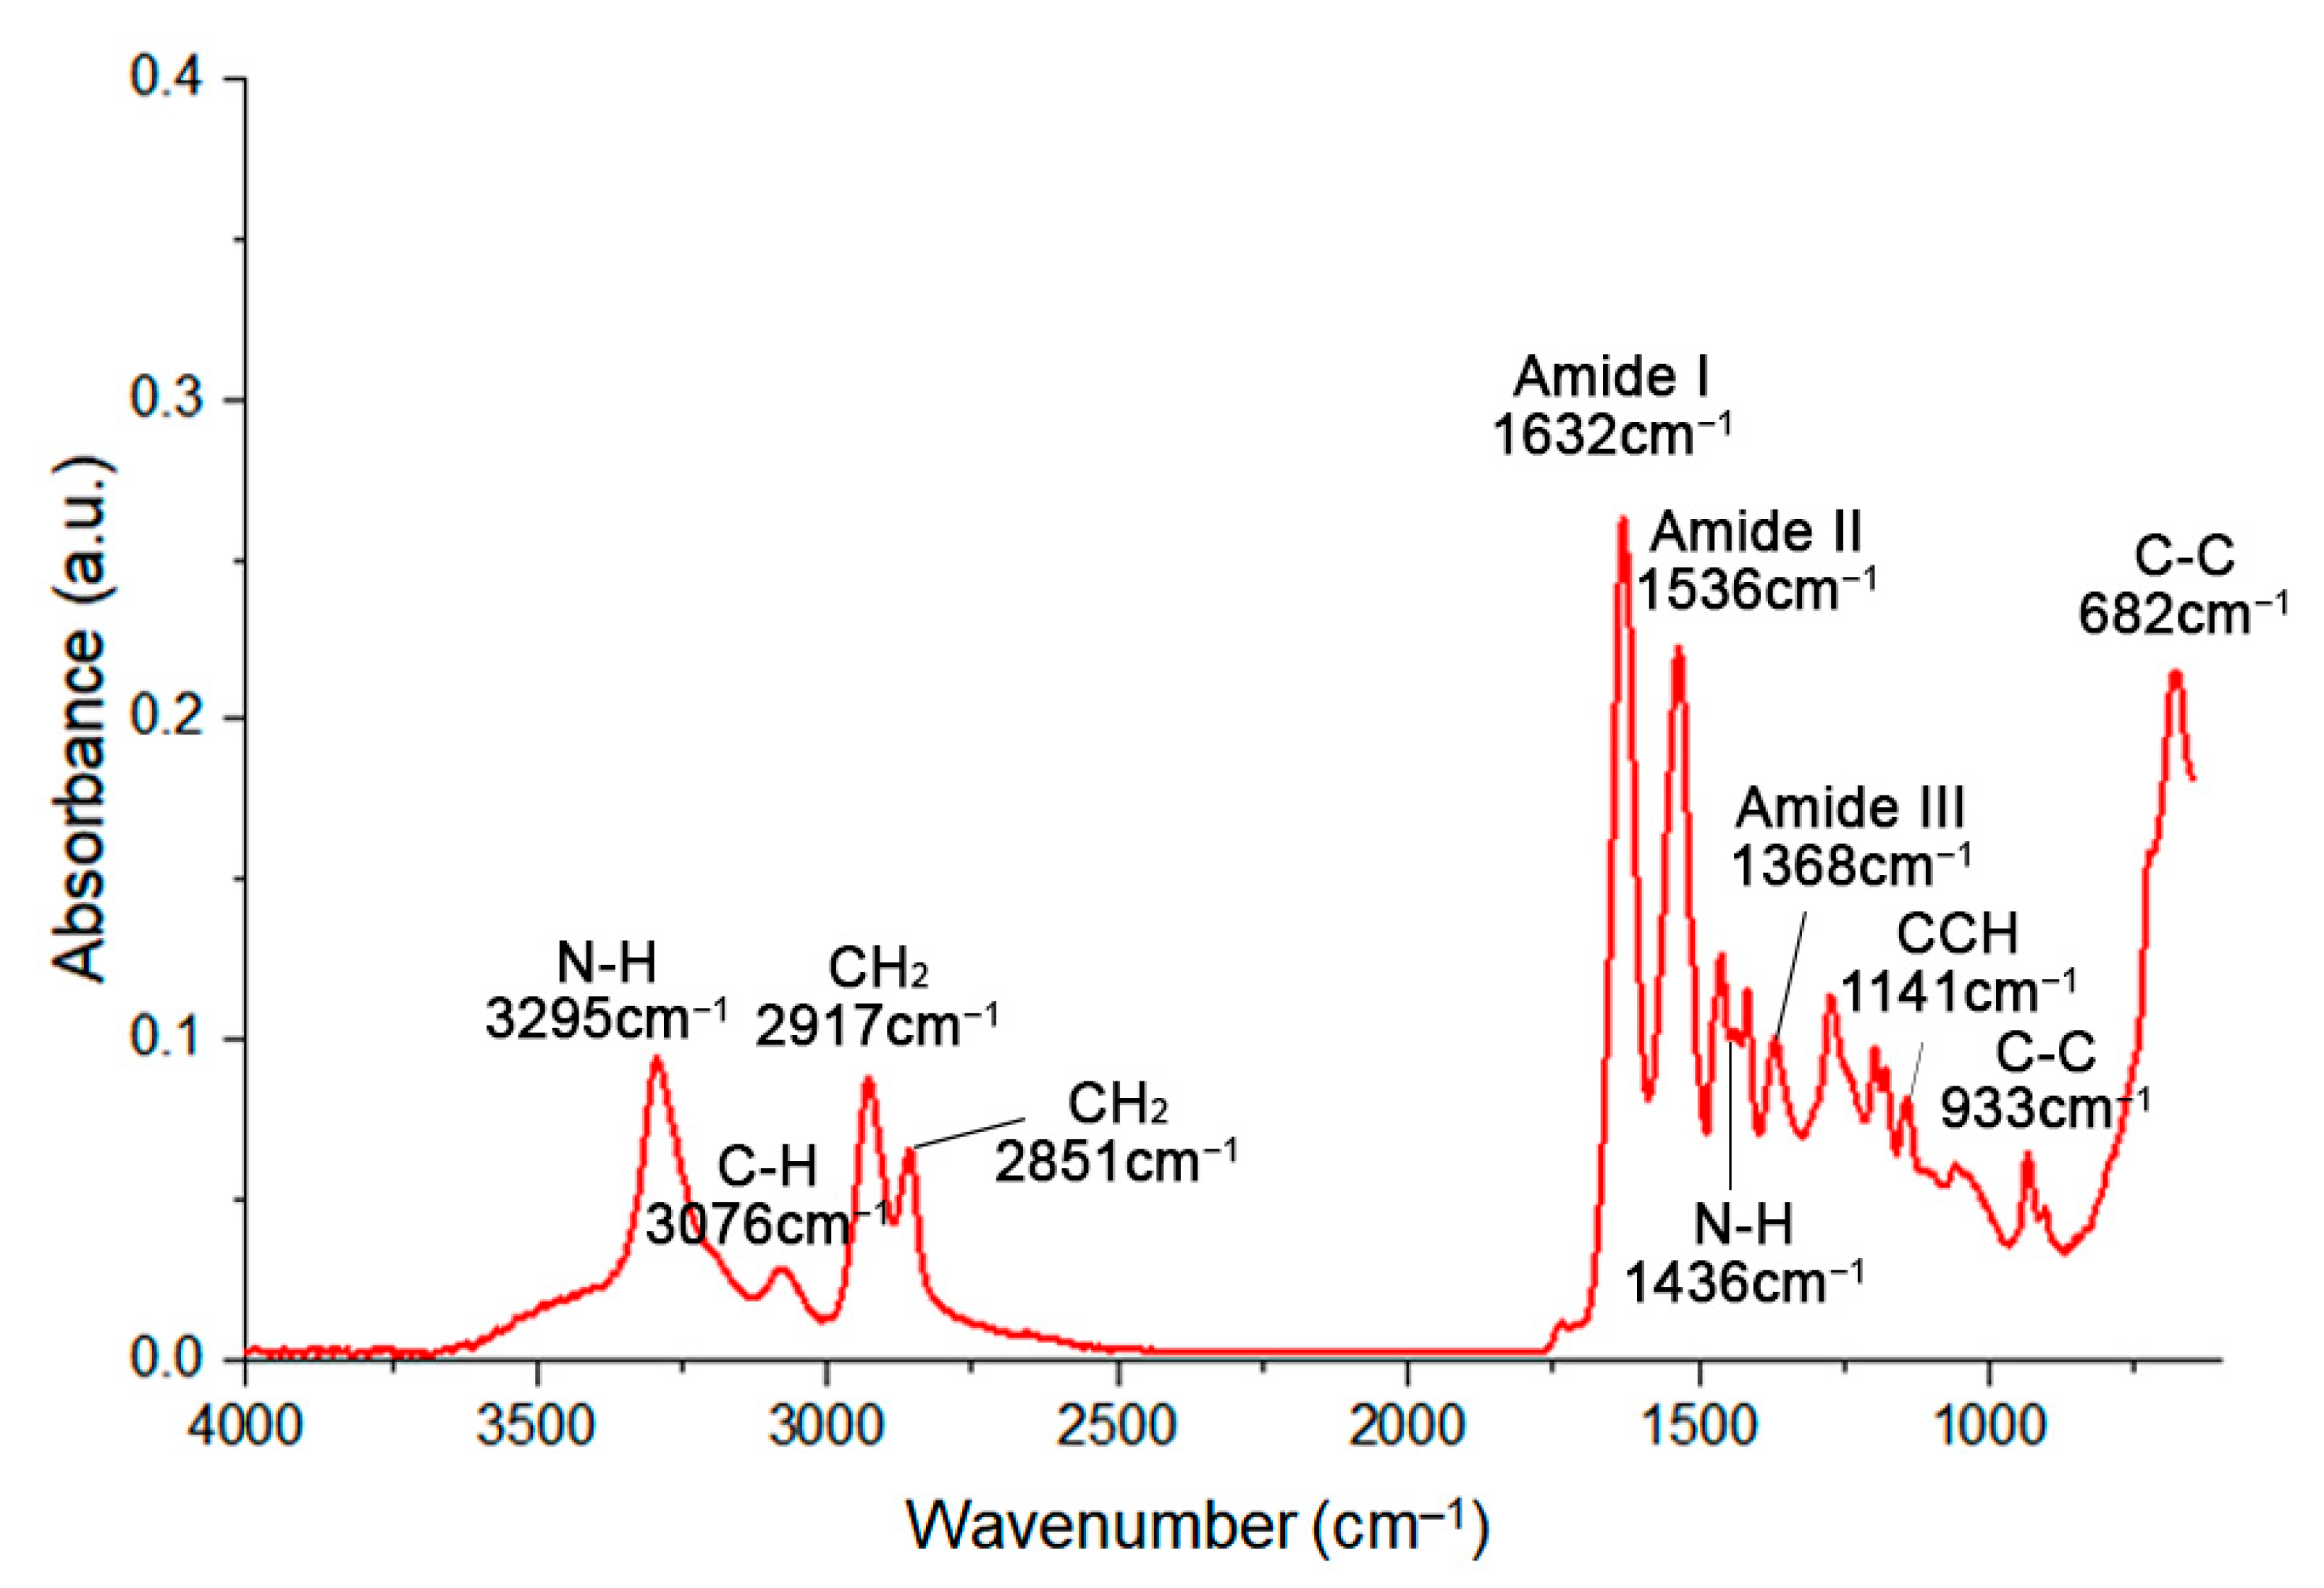
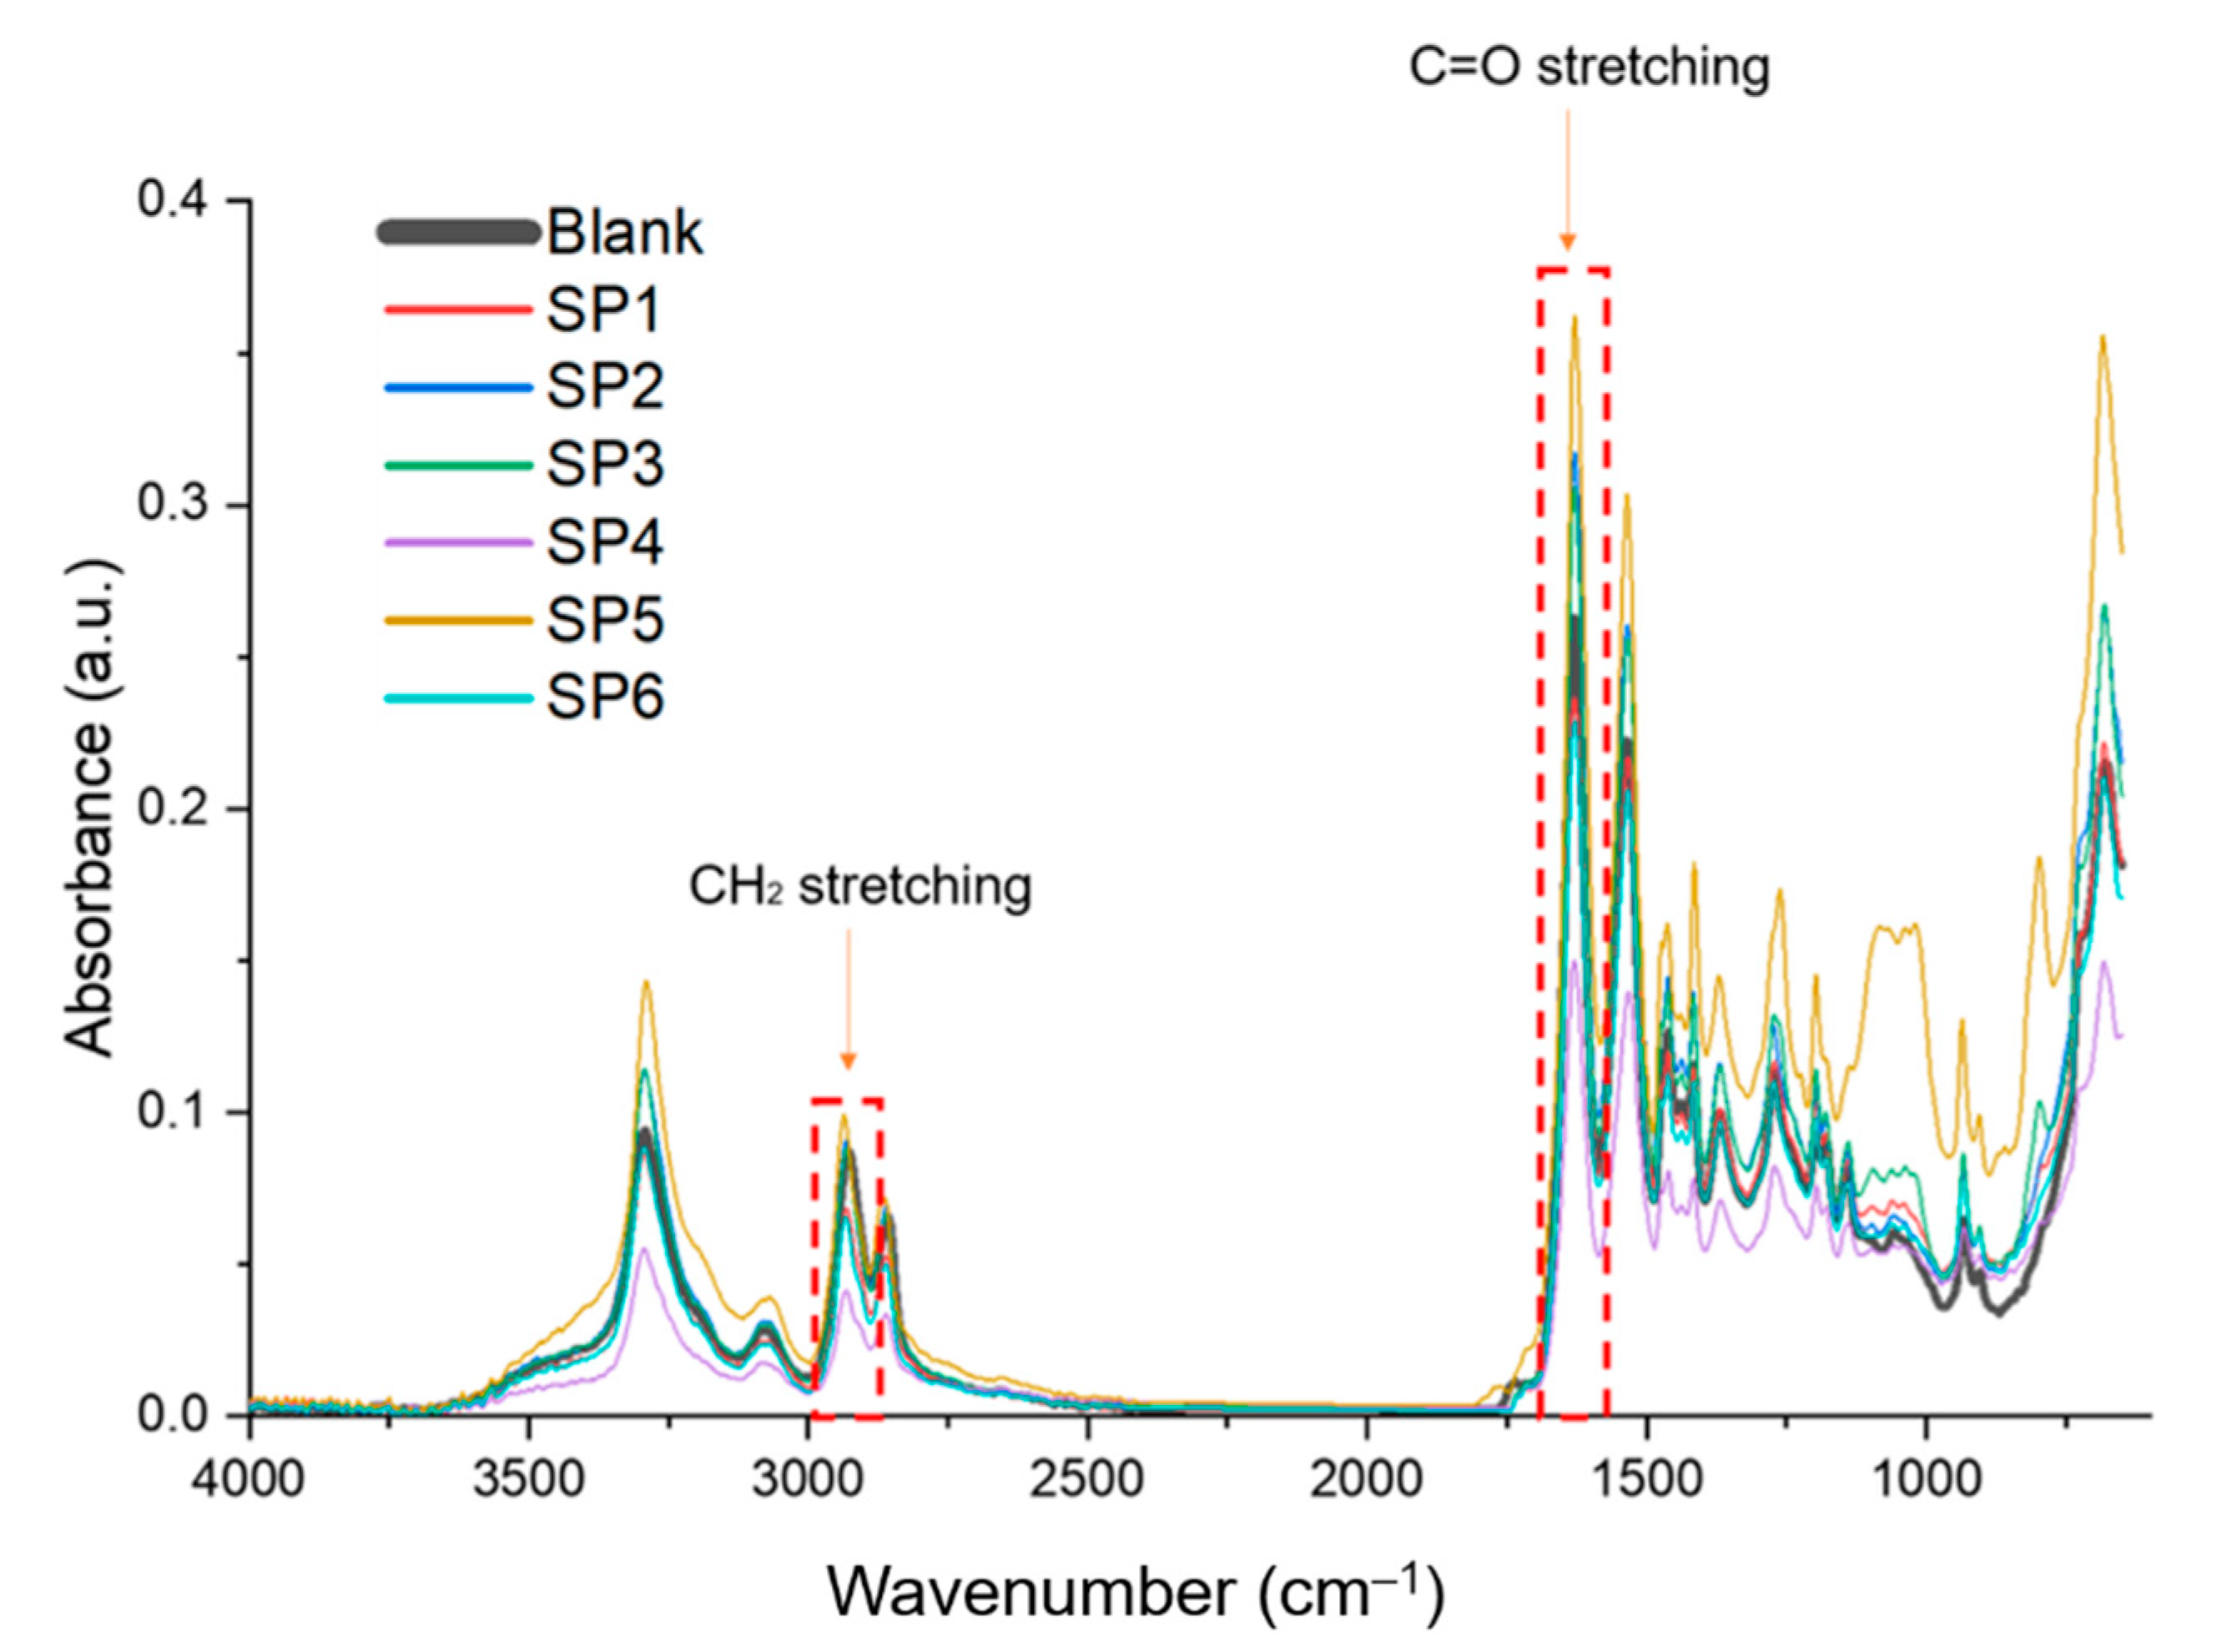
3.4. Changes of Chemical Properties
3.5. Formation of By-Products Due to the Degradation of PA66 Microfibres
3.6. Insights to Microfibre-Targeted Treatment Technology
4. Conclusions
- The degradation of PA66 microfibres was dependent on the wavelengths of UV irradiation during the photo-oxidation. The degradation was more effective when using a short wavelength (254 nm) (approximately 14 times more effective in degrading PA66 microfibres compared to using 365 nm).
- The concentration of TiO2 was an important factor in accelerating the degradation rate of PA66 microfibres. The optimal concentration in this study was 100 mg TiO2/L.
- The photocatalytic degradation of PA66 microfibres generated organic by-products, but it was relatively low compared to photo-oxidation.
Author Contributions
Funding
Conflicts of Interest
References
- Avio, C.G.; Gorbi, S.; Regoli, F. Plastics and microplastics in the oceans: From emerging pollutants to emerged threat. Mar. Environ. Res. 2017, 128, 2–11. [Google Scholar] [CrossRef]
- Alimba, C.G.; Faggio, C. Microplastics in the marine environment: Current trends in environmental pollution and mechanisms of toxicological profile. Environ. Toxicol. Pharm. 2019, 68, 61–74. [Google Scholar] [CrossRef]
- Geyer, R.; Jambeck, J.R.; Law, K.L. Production, use, and fate of all plastics ever made. Sci. Adv. 2017, 3, e1700782. [Google Scholar] [CrossRef] [Green Version]
- Browne, M.A.; Crump, P.; Niven, S.J.; Teuten, E.; Tonkin, A.; Galloway, T.; Thompson, R. Accumulation of microplastic on shorelines woldwide: Sources and sinks. Environ. Sci. Technol. 2011, 45, 9175–9179. [Google Scholar] [CrossRef]
- Boucher, J.; Friot, D. Primary Microplastics in the Oceans: A Global Evaluation of Sources; IUCN: Gland, Switzerland, 2017. [Google Scholar] [CrossRef]
- Peller, J.R.; Eberhardt, L.; Clark, R.; Nelson, C.; Kostelnik, E.; Iceman, C. Tracking the distribution of microfiber pollution in a southern Lake Michigan watershed through the analysis of water, sediment and air. Environ. Sci. Process. Impacts 2019, 21, 1549–1559. [Google Scholar] [CrossRef]
- Singh, R.P.; Mishra, S.; Das, A.P. Synthetic microfibers: Pollution toxicity and remediation. Chemosphere 2020, 257, 127199. [Google Scholar] [CrossRef]
- GESAMP. Sources, Fate and Effects of Microplastics in the Marine Environment: A Global Assessment; IMO: London, UK, 2015; Volume 90, p. 96. [Google Scholar] [CrossRef]
- Hartmann, N.B. Are We Speaking the Same Language? Recommendations for a Definition and Categorization Framework for Plastic Debris. Environ. Sci. Technol. 2019, 53, 1039–1047. [Google Scholar] [CrossRef] [Green Version]
- Barnes, D.K.A.; Galgani, F.; Thompson, R.C.; Barlaz, M. Accumulation and fragmentation of plastic debris in global environments. Philos. Trans. R. Soc. B Biol. Sci. 2009, 364, 1985–1998. [Google Scholar] [CrossRef] [Green Version]
- Cárdenas, A.M.; Halloran, J.O.; van Pelt, F.N.A.M.; Jansen, M.A.K. Rapid fragmentation of microplastics by the freshwater amphipod Gammarus duebeni (Lillj.). Sci. Rep. 2020, 10, 1–12. [Google Scholar] [CrossRef]
- Foley, C.J.; Feiner, Z.S.; Malinich, T.D.; Höök, T.O. A meta-analysis of the effects of exposure to microplastics on fish and aquatic invertebrates. Sci. Total Environ. 2018, 631–632, 550–559. [Google Scholar] [CrossRef] [Green Version]
- Au, S.Y.; Bruce, T.F.; Bridges, W.C.; Klaine, S.J. Responses of Hyalella azteca to acute and chronic microplastic exposures. Environ. Toxicol. Chem. 2015, 34, 2564–2572. [Google Scholar] [CrossRef]
- Ogonowski, M.; Schür, C.; Jarsén, Å.; Gorokhova, E. The Effects of Natural and Anthropogenic Microparticles on Individual Fitness in Daphnia magna. PLoS ONE 2016, 11. [Google Scholar] [CrossRef]
- Sussarellu, R.; Suquet, M.; Thomas, Y.; Lambert, C.; Fabioux, C.; Pernet, M.E.J.; Corporeau, C. Oyster reproduction is affected by exposure to polystyrene microplastics. Proc. Natl. Acad. Sci. USA 2016, 113, 2430–2435. [Google Scholar] [CrossRef] [Green Version]
- Booth, A.M.; Hansen, B.H.; Frenzel, M.; Johnsen, H.; Altin, D. Uptake and toxicity of methylmethacrylate-based nanoplastic particles in aquatic organisms. Environ. Toxicol. Chem. 2016, 35, 1641–1649. [Google Scholar] [CrossRef] [Green Version]
- Besseling, E.; Wegner, A.; Foekema, E.M.; van den Heuvel-Greve, M.J.; Koelmans, A.A. Effects of microplastic on fitness and PCB bioaccumulation by the lugworm Arenicola marina (L.). Environ. Sci. Technol. 2013, 47, 593–600. [Google Scholar] [CrossRef]
- Dalberg, A.; de Wit, W.; Bigaud, N. Assessing Plastic Ingestion from Nature to People (AN ANALYSIS for WWF); The University of New Castle: Callaghan, Australia, 2019. [Google Scholar]
- Liebmann, B.; Köppel, S.; Philipp, K.; Theresa, B.; Thomas, R.; Philipp, S. Assessment of microplastic concentrations in human stool final results of a prospective study. Conf. Nano Microplastics Tech. Freshw. Syst. Microplastics 2018, 28–31. [Google Scholar] [CrossRef]
- von Moos, N.; Burkhardt-Holm, P.; Köhler, A. Uptake and effects of microplastics on cells and tissue of the blue mussel Mytilus edulis L. after an experimental exposure. Environ. Sci. Technol. 2012, 46, 11327–11335. [Google Scholar] [CrossRef]
- Zhang, Q.; Xu, E.G.; Li, J.; Chen, Q.; Ma, L.; Zeng, E.Y.; Shi, H. A Review of Microplastics in Table Salt, Drinking Water, and Air: Direct Human Exposure. Environ. Sci. Technol. 2020, 54, 3740–3751. [Google Scholar] [CrossRef]
- Oberbeckmann, S.; Löder, M.G.J.; Labrenz, M. Marine microplastic-associated biofilms—A review. Environ. Chem. 2015, 12, 551–562. [Google Scholar] [CrossRef]
- Bergmann, M.; Gutow, L.; Klages, M. Marine anthropogenic litter. Mar. Anthr. Litter. 2015, 1–447. [Google Scholar] [CrossRef] [Green Version]
- Prata, J.C. Microplastics in wastewater: State of the knowledge on sources, fate and solutions. Mar. Pollut. Bull. 2018, 129, 262–265. [Google Scholar] [CrossRef]
- Murphy, F.; Ewins, C.; Carbonnier, F.; Quinn, B. Wastewater Treatment Works (WwTW) as a Source of Microplastics in the Aquatic Environment. Environ. Sci. Technol. 2016, 50, 5800–5808. [Google Scholar] [CrossRef] [Green Version]
- Xu, X.; Hou, Q.; Xue, Y.; Jian, Y.; Wang, L.P. Pollution characteristics and fate of microfibers in the wastewater from textile dyeing wastewater treatment plant. Water Sci. Technol. 2018, 78, 2046–2054. [Google Scholar] [CrossRef]
- Ziajahromi, S.; Neale, P.A.; Rintoul, L.; Leusch, F.D.L. Wastewater treatment plants as a pathway for microplastics: Development of a new approach to sample wastewater-based microplastics. Water Res. 2017, 112, 93–99. [Google Scholar] [CrossRef]
- Magnusson, K.; Norén, F. Screening of Microplastic Particles in and Down-Stream a Wastewater Treatment Plant. Available online: www.ivl.se (accessed on 25 June 2020).
- McCormick, A.; Hoellein, T.J.; Mason, S.A.; Schluep, J.; Kelly, J.J. Microplastic is an abundant and distinct microbial habitat in an urban river. Environ. Sci. Technol. 2014, 48, 11863–11871. [Google Scholar] [CrossRef]
- Hanvey, J.S.; Lewis, P.J.; Lavers, J.L.; Crosbie, N.D.; Pozo, K.; Clarke, B.O. A review of analytical techniques for quantifying microplastics in sediments. Anal. Methods 2017, 9, 1369–1383. [Google Scholar] [CrossRef]
- Okoffo, E.D.; O’Brien, S.; O’Brien, J.W.; Tscharke, B.J.; Thomas, K.V. Wastewater treatment plants as a source of plastics in the environment: A review of occurrence, methods for identification, quantification and fate. Environ. Sci. Water Res. Technol. 2019, 5, 1908–1931. [Google Scholar] [CrossRef]
- Li, C.; Busquets, R.; Campos, L.C. Assessment of microplastics in freshwater systems: A review. Sci. Total Environ. 2020, 707. [Google Scholar] [CrossRef]
- Bratovcic, A. Degradation of Micro- and Nano-Plastics by Photocatalytic Methods. J. Nanosci. Nanotechnol. Appl. 2017, 3, 1–9. [Google Scholar] [CrossRef]
- Brienza, M.; Katsoyiannis, I.A. Sulfate radical technologies as tertiary treatment for the removal of emerging contaminants from wastewater. Sustainability 2017, 9, 1604. [Google Scholar] [CrossRef] [Green Version]
- Tofa, T.S.; Kunjali, K.L.; Paul, S.; Dutta, J. Visible light photocatalytic degradation of microplastic residues with zinc oxide nanorods. Environ. Chem. Lett. 2019, 17, 1341–1346. [Google Scholar] [CrossRef] [Green Version]
- Liu, P.; Qian, L.; Wang, H.; Zhan, X.; Lu, K.; Gu, C.; Gao, S. New Insights into the Aging Behavior of Microplastics Accelerated by Advanced Oxidation Processes. Environ. Sci. Technol. 2019, 53, 3579–3588. [Google Scholar] [CrossRef]
- Thiruvenkatachari, R.; Vigneswaran, S.; Moon, I.S. A review on UV/TiO 2 photocatalytic oxidation process. Korean J. Chem. Eng. 2008, 25, 64–72. [Google Scholar] [CrossRef]
- Li, S.; Xu, S.; He, L.; Xu, F.; Wang, Y.; Zhang, L. Photocatalytic Degradation of Polyethylene Plastic with Polypyrrole/TiO 2 Nanocomposite as Photocatalyst. Polym. Plast. Technol. Eng. 2010, 49, 400–406. [Google Scholar] [CrossRef]
- Ariza-Tarazona, M.C.; Villarreal-Chiu, J.F.; Barbieri, V.; Siligardi, C.; Cedillo-González, E.I. New strategy for microplastic degradation: Green photocatalysis using a protein-based porous N-TiO 2 semiconductor. Ceram. Int. 2019, 45, 9618–9624. [Google Scholar] [CrossRef]
- Ali, S.S.; Qazi, I.A.; Arshad, M.; Khan, Z.; Voice, T.C.; Mehmood, C.T. Photocatalytic degradation of low density polyethylene (LDPE) films using titania nanotubes. Environ. Nanotechnol. Monit. Manag. 2016, 5, 44–53. [Google Scholar] [CrossRef] [Green Version]
- Tian, L.; Chen, Q.; Jiang, W.; Wang, L.; Xie, H.; Kalogerakis, N.; Ji, R. A carbon-14 radiotracer-based study on the phototransformation of polystyrene nanoplastics in water: Versus in air. Environ. Sci. Nano 2019, 6, 2907–2917. [Google Scholar] [CrossRef]
- Thomas, R.T.; Nair, V.; Sandhyarani, N. TiO2 nanoparticle assisted solid phase photocatalytic degradation of polythene film: A mechanistic investigation. Colloids Surf. A Physicochem. Eng. Asp. 2013, 422, 1–9. [Google Scholar] [CrossRef]
- Thomas, R.T.; Sandhyarani, N. Enhancement in the photocatalytic degradation of low density polyethylene-TiO2 nanocomposite films under solar irradiation. RSC Adv. 2013, 3, 14080–14087. [Google Scholar] [CrossRef]
- Liang, W.; Luo, Y.; Song, S.; Dong, X.; Yu, X. High photocatalytic degradation activity of polyethylene containing polyacrylamide grafted TiO2. Polym. Degrad. Stab. 2013, 98, 1754–1761. [Google Scholar] [CrossRef]
- Kumar, K.V.; Porkodi, K.; Selvaganapathi, A. Constrain in solving Langmuir-Hinshelwood kinetic expression for the photocatalytic degradation of Auramine O aqueous solutions by ZnO catalyst. Dye. Pigment. 2007, 75, 246–249. [Google Scholar] [CrossRef]
- Wenhua, L.; Hong, L.; Sao’an, C.; Jianqing, Z.; Chunan, C. Kinetics of photocatalytic degradation of aniline in water over TiO2 supported on porous nickel. J. Photochem. Photobiol. A Chem. 2000, 131, 125–132. [Google Scholar] [CrossRef]
- Rajamanickam, D.; Shanthi, M. Photocatalytic degradation of an organic pollutant by zinc oxide—Solar process. Arab. J. Chem. 2016, 9, S1858–S1868. [Google Scholar] [CrossRef] [Green Version]
- Khezrianjoo, S. Langmuir-Hinshelwood Kinetic Expression for the Photocatalytic Degradation of Metanil Yellow Aqueous Solutions by ZnO Catalyst. Chem. Sci. J. 2012, 2012. [Google Scholar] [CrossRef]
- Ariza-Tarazona, M.C.; Villareal-Chiu, J.F.; Hernández-López, J.M.; De la Rosa, J.R.; Barbieri, V.; Siligardi, C.; Cedillo-González, E.I. Microplastic pollution reduction by a carbon and nitrogen-doped TiO2: Effect of pH and temperature in the photocatalytic degradation process. J. Hazard. Mater. 2020, 395, 122632. [Google Scholar] [CrossRef]
- Ma, Y.; Huang, A.; Cao, S.; Sun, F.; Wang, L.; Guo, H.; Ji, R. Effects of nanoplastics and microplastics on toxicity, bioaccumulation, and environmental fate of phenanthrene in fresh water. Environ. Pollut. 2016, 219, 166–173. [Google Scholar] [CrossRef]
- Mylläri, V.; Ruoko, T.P.; Syrjälä, S. A comparison of rheology and FTIR in the study of polypropylene and polystyrene photodegradation. J. Appl. Polym. Sci. 2015, 132. [Google Scholar] [CrossRef]
- Ahlblad, G.; Forsström, D.; Stenberg, B.; Terselius, B.; Reitberger, T.; Svensson, L.G. Oxidation profiles of polyamide 6,6 studied by imaging chemiluminescence and FTIR. Polym. Degrad. Stab. 1997, 55, 287–293. [Google Scholar] [CrossRef]
- Krehula, L.K.; Katancǐć, Z.; Siročić, A.P.; Hrnjak-Murgić, Z. Weathering of high-density polyethylene-wood plastic composites. J. Wood Chem. Technol. 2014, 34, 39–54. [Google Scholar] [CrossRef]
- Anton, A. Determination of hydroperoxides in ultraviolet-irradiated nylon 66. J. Appl. Polym. Sci. 1965, 9, 1631–1639. [Google Scholar] [CrossRef]
- Shamey, R.; Sinha, K. A review of degradation of nylon 6.6 as a results of exposure to environmental conditions. Rev. Prog. Color. Relat. Top. 2003, 33, 93–107. [Google Scholar]
- Chavarria, F.; Paul, D.R. Comparison of nanocomposites based on nylon 6 and nylon 66. Polymer 2004, 45, 8501–8515. [Google Scholar] [CrossRef]
- Palmer, R.J. Polyamides, Plastics. In Encyclopedia of Polymer Science and Technology; John Wiley & Sons, Inc.: Hoboken, NJ, USA, 2001. [Google Scholar]
- Taylor, H.A.; Tincher, W.C.; Hamner, W.F. Photodegradation of nylon 66. I. Phototendering by TiO2. J. Appl. Polym. Sci. 1970, 14, 141–146. [Google Scholar] [CrossRef]
- Tang, L.; Lemaire, J.; Sallet, D. Photochemistry of Polyundecanamides. 1. Mechanisms of Photooxidation at Short and Long Wavelengths. Macromolecules 1982, 15, 1432–1437. [Google Scholar] [CrossRef]
- Puma, G.L.; Yue, P.L. Comparison of the effectiveness of photon-based oxidation processes in a pilot falling film photoreactor. Environ. Sci. Technol. 1999, 33, 3210–3216. [Google Scholar] [CrossRef]
- Do, C.H.; Pearce, E.M.; Bulkin, B.J. FT-IR Spectroscopic Study on the Photo- and Photooxidative Degradation of Nylons. J. Polym. Sci. Part A Polym. Chem. 1987, 25, 2301–2321. [Google Scholar] [CrossRef]
- Stephenson, C.V.; Moses, B.C.; Burks, R.E.; Coburn, W.C.; Wilcox, W.S. Ultraviolet irradiation of plastics. II. Crosslinking and scission. J. Polym. Sci. 1961, 55, 465–475. [Google Scholar] [CrossRef]
- Roger, A.; Sallet, D.; Lemaire, J. Photochemistry of Aliphatic Polyamides. 4. Mechanisms of Photooxidation of Polyamides 6, 11, and 12 at Long Wavelengths. Macromolecules 1986, 19, 579–584. [Google Scholar] [CrossRef]
- Liu, G.L.; Zhu, D.W.; Liao, S.J.; Ren, L.Y.; Cui, J.Z.; Zhou, W.B. Solid-phase photocatalytic degradation of polyethylene-goethite composite film under UV-light irradiation. J. Hazard. Mater. 2009, 172, 1424–1429. [Google Scholar] [CrossRef]
- Ghasemi, B.; Anvaripour, B.; Jorfi, S.; Jaafarzadeh, N. Enhanced Photocatalytic Degradation and Mineralization of Furfural Using UVC/TiO2/GAC Composite in Aqueous Solution. Int. J. Photoenergy 2016, 2016. [Google Scholar] [CrossRef]
- Herrmann, J.M. Heterogeneous photocatalysis: Fundamentals and applications to the removal of various types of aqueous pollutants. Catal. Today 1999, 53, 115–129. [Google Scholar] [CrossRef]
- Porcal, P.; Dillon, P.J.; Molot, L.A. Temperature dependence of photodegradation of dissolved organic matter to dissolved inorganic carbon and particulate organic carbon. PLoS ONE 2015, 10, 1–15. [Google Scholar] [CrossRef] [Green Version]
- Saquib, M.; Muneer, M. TiO2/mediated photocatalytic degradation of a triphenylmethane dye (gentian violet), in aqueous suspensions. Dye. Pigment. 2003, 56, 37–49. [Google Scholar] [CrossRef]
- Wiener, J.; Chládová, A.; Shahidi, S.; Peterová, L. Effect of UV irradiation on mechanical and morphological properties of natural and synthetic fabric before and after nano-TIO2 padding. Autex Res. J. 2017, 17, 370–378. [Google Scholar] [CrossRef] [Green Version]
- Yousif, E.; Haddad, R. Photodegradation and photostabilization of polymers, especially polystyrene: Review. Springerplus 2013, 2, 1–32. [Google Scholar] [CrossRef] [Green Version]
- Díaz-Alejo, L.A.; Menchaca-Campos, E.C.; Chavarín, J.U.; Sosa-Fonseca, R.; García-Sánchez, M.A. Effects of the addition of ortho-And para NH2 substituted tetraphenylporphyrins on the structure of nylon 66. Int. J. Polym. Sci. 2013, 2013. [Google Scholar] [CrossRef] [Green Version]
- Gashti, M.P.; Assefipour, R.; Kiumarsi, A.; Gashti, M.P. Enzymatic surface hydrolysis of polyamide 6,6 with mixtures of proteolytic and lipolytic enzymes. Prep. Biochem. Biotechnol. 2013, 43, 798–814. [Google Scholar] [CrossRef]
- Navarro-Pardo, F.; Martínez-Barrera, G.; Martínez-Hernández, A.L.; Castaño, V.M.; Rivera-Armenta, J.L.; Medellín-Rodríguez, F.; Velasco-Santos, C. Effects on the thermo-mechanical and crystallinity properties of nylon 6,6 electrospun fibres reinforced with one dimensional (1D) and two dimensional (2D) carbon. Materials 2013, 6, 3494–3513. [Google Scholar] [CrossRef] [Green Version]
- Krylova, V.; Dukštienė, N. The structure of PA-Se-S-Cd composite materials probed with FTIR spectroscopy. Appl. Surf. Sci. 2019, 470, 462–471. [Google Scholar] [CrossRef]
- Charles, J.; Ramkumaar, G.R.; Azhagiri, S.; Gunasekaran, S. FTIR and thermal studies on nylon-66 and 30% glass fibre reinforced nylon-66. E-J. Chem. 2009, 6, 23–33. [Google Scholar] [CrossRef] [Green Version]
- Moezzi, M.; Yekrang, J.; Ghane, M.; Hatami, M. The effects of UV degradation on the physical, thermal, and morphological properties of industrial nylon 66 conveyor belt fabrics. J. Ind. Text. 2019, 240–260. [Google Scholar] [CrossRef]
- El Mazry, C.; Hassine, M.B.; Correc, O.; Colin, X. Thermal oxidation kinetics of additive free polyamide 6-6. Polym. Degrad. Stab. 2014, 98, 22–36. [Google Scholar] [CrossRef] [Green Version]


| Chamber A | Chamber B | Chamber C | ||||
|---|---|---|---|---|---|---|
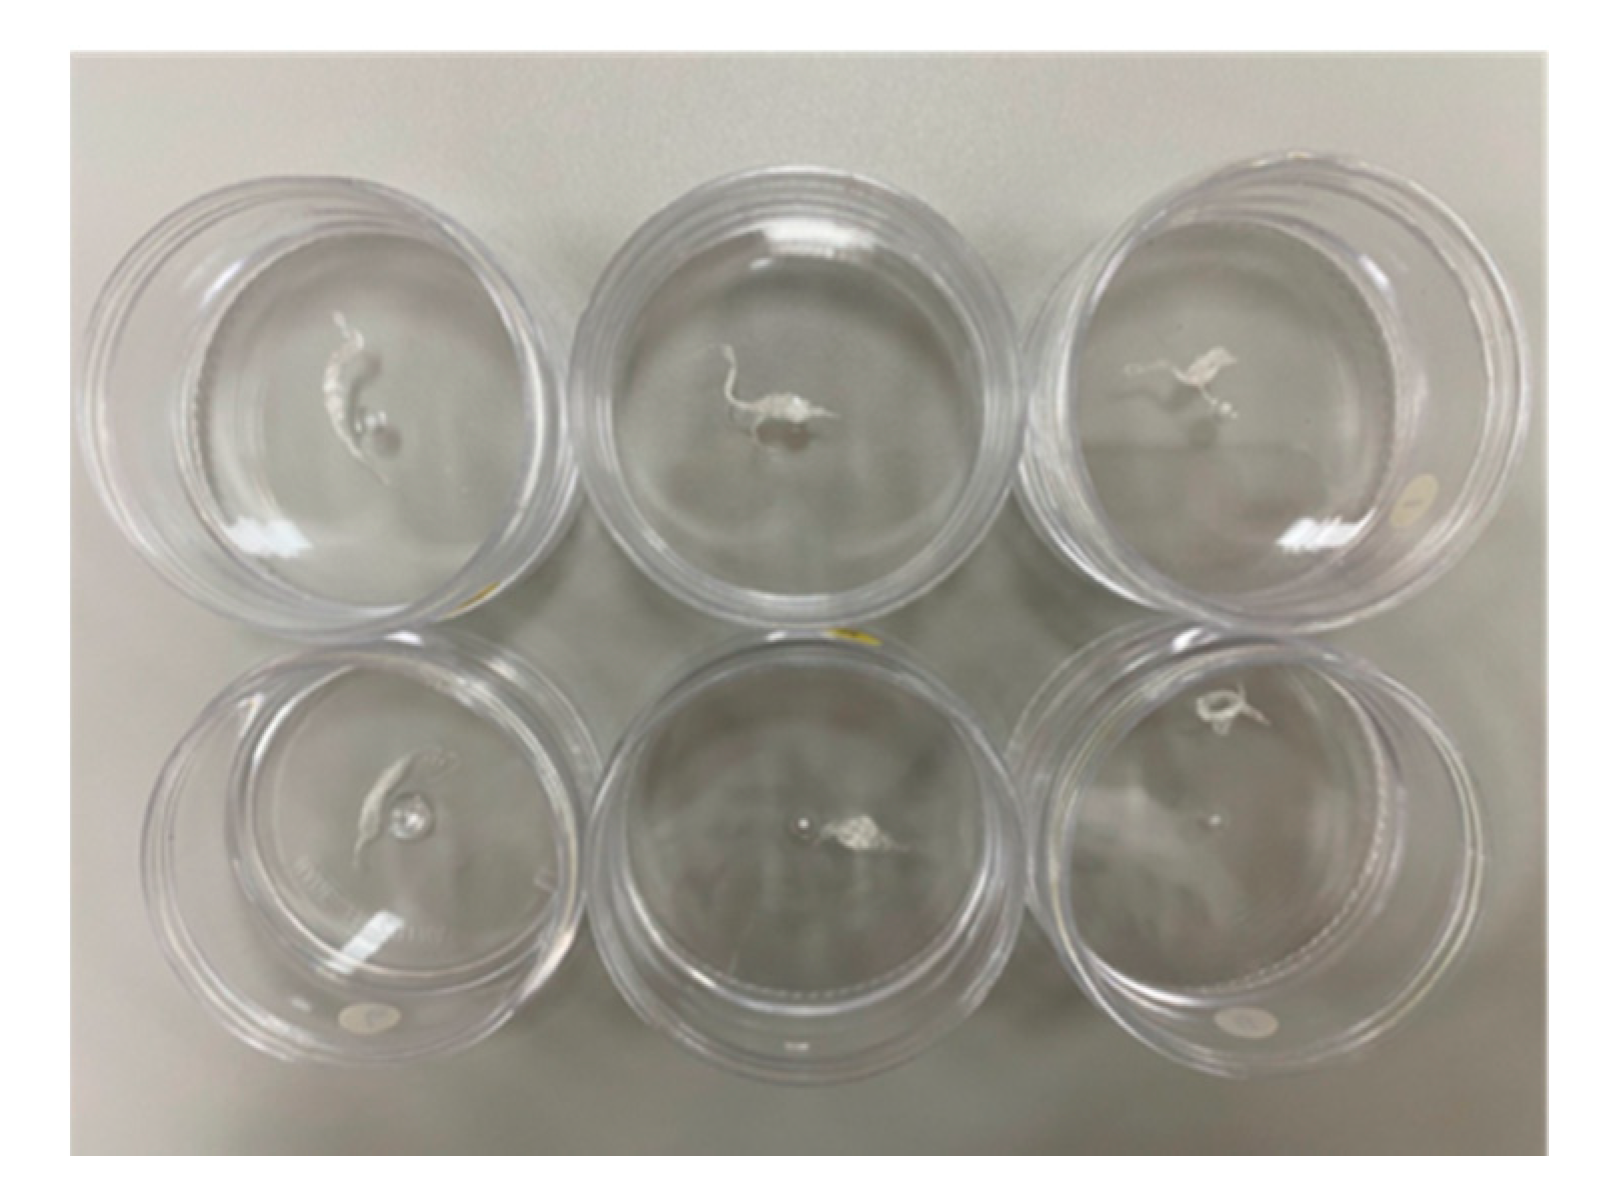
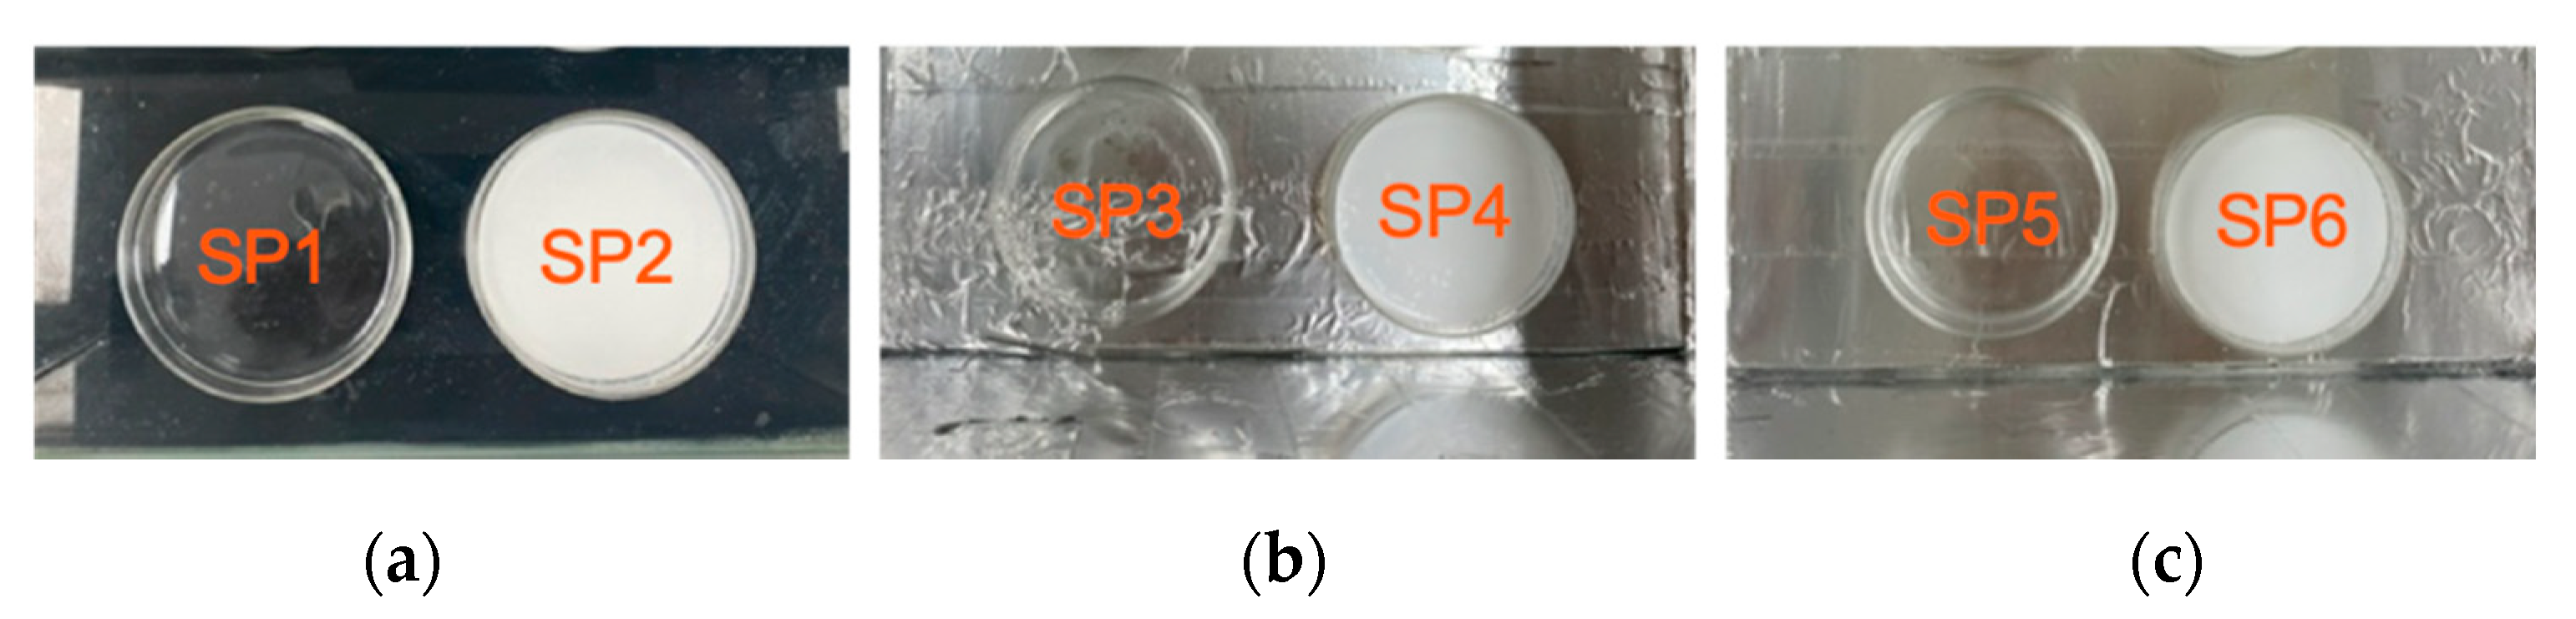
| Samples | SP1 | SP2 | SP3 | SP4 | SP5 | SP6 |
| Phenomenon | Hydration | Adsorption | Photo-oxidation | Photocatalysis | Photo-oxidation | Photocatalysis |
| Deionised water (mL) | 50 | 50 | 50 | 50 | 50 | 50 |
| Distance between the samples and UV lamps (cm) | N/A | N/A | 5 | 5 | 5 | 5 |
| TiO2 (g) | - | 1 | - | 1 | - | 1 |
| PA66 microfibre (mg) | 1.27 | 1.26 | 1.29 | 1.29 | 1.28 | 1.27 |
| UV irradiation | N/A | UVA (365 nm) | UVC (254 nm) | |||
| UV lamp power (W) | N/A | 40 | 40 | |||
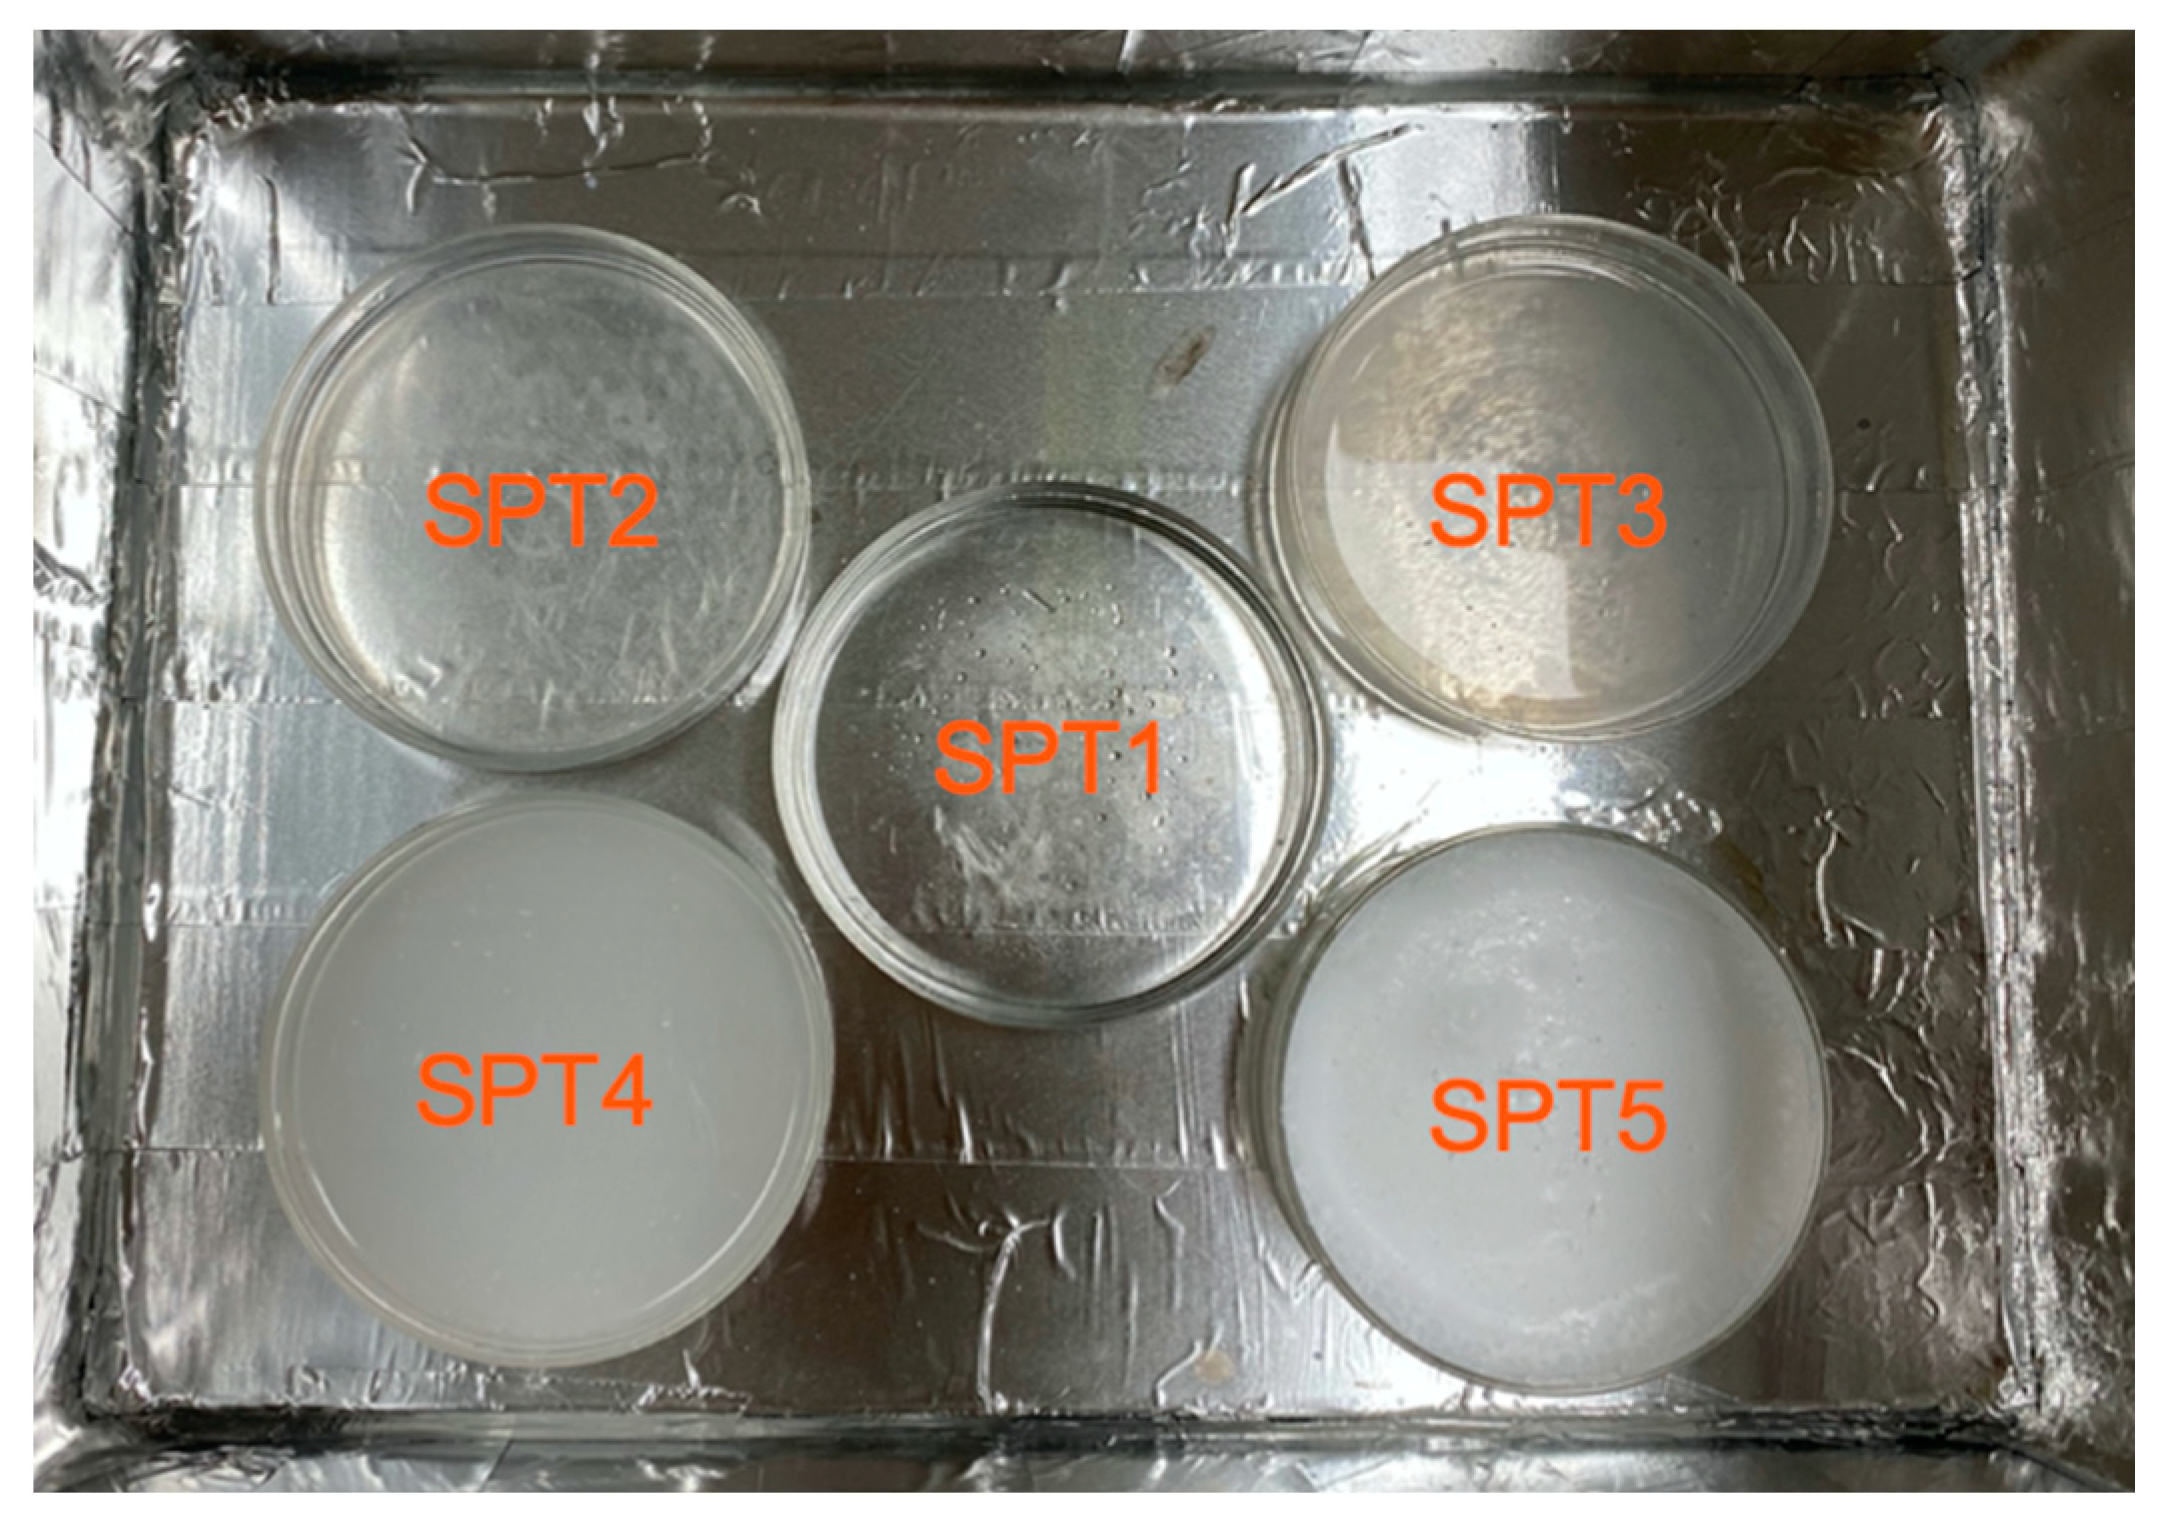
| SPT1 | SPT2 | SPT3 | SPT4 | SPT5 | |
|---|---|---|---|---|---|
| Degradation mechanism | Photocatalysis | ||||
| Volume of deionised water (mL) | 50 | 50 | 50 | 50 | 50 |
| TiO2 (mg) | 0 | 5 | 25 | 50 | 1000 |
| TiO2 concentration (mg/L) | 0 | 100 | 500 | 1000 | 20,000 |
| Microfibre (mg) | 1.21 | 1.25 | 1.27 | 1.25 | 1.21 |
| UV irradiation | UVC | UVC | UVC | UVC | UVC |
| UV lamp power (W) | 40 W (8 W × 5 lamps) | ||||
| Samples | Mass Loss (%) | Standard Deviation | t1/2 (h) | |
|---|---|---|---|---|
| SP1 | 2 | 0.6 | 0.3 | 2310 |
| SP2 | 0 | 1.2 | 0.1 | 6931 |
| SP3 | 6 | 27.8 | 0.5 | 1733 |
| SP4 | 26 | 0.1 | 2.3 | 301 |
| SP5 | 83 | 14.0 | 13.6 | 51 |
| SP6 | 24 | 0.2 | 2.6 | 267 |
| Samples | TiO2 (mg/L) | Mass Loss (%) | Standard Deviation (n = 3) | t1/2 (h) | |
|---|---|---|---|---|---|
| SPT1 | 0 | 18 | 1.3 | 0.4 | 173 |
| SPT2 | 100 | 97 | 2.0 | 7.0 | 10 |
| SPT3 | 500 | 78 | 3.0 | 3.2 | 22 |
| SPT4 | 1000 | 24 | 1.2 | 0.6 | 116 |
| SPT5 | 20,000 | 14 | 1.5 | 0.3 | 231 |
| Wavenumber (cm−1) | Intensity * | Assignment |
|---|---|---|
| 3295 | M | N-H stretching |
| 3076 | W | C-H stretching |
| 2918 | MS | CH2 stretching (asymmetrical) |
| 2851 | MS | CH2 stretching (symmetrical) |
| 1632 | VS | Amide I (C=O stretching) |
| 1535 | VS | Amide II (C-N stretching and N-H bending) |
| 1463 | S | N-H deformation/CH2 scissoring |
| 1271 | S | Amide III (C-N stretching) |
| 1141 | M | CCH symmetric bending/CH2 twisting |
| 933 | M | C-C stretching |
| 681 | VS | C-C bending |
| Degradation Conditions | Carbonyl Index [C=O:CH2] | Percentage Increase of C=O Compared to the Starting Fibre (%) |
|---|---|---|
| Starting fibre | 2.68 | 0 |
| SP1 | 3.05 | 14 |
| SP2 | 3.13 | 17 |
| SP3 | 3.17 | 18 |
| SP4 | 3.18 | 19 |
| SP5 | 3.40 | 27 |
| SP6 | 3.35 | 25 |
| Water Sample | Presence of Microfibres | Effect | Degradation Condition | COD (mg/L) ±SD, n = 3 | Mass Loss (%) |
|---|---|---|---|---|---|
| R-DW | No | Reference | Deionised water + No light | <LOD | - |
| R-TiO2 | No | Reference | Deionised water + TiO2 + No light | 40.0 ± 10.4 | - |
| SPW1 | Yes | Hydration | Deionised water + No light | 14.7 ± 9.0 | 2 |
| SPW2 | Yes | Adsorption | Deionised water + TiO2 + No light | 30.3 ± 8.5 | 0 |
| SPW3 | Yes | Photo-oxidation | Deionised water + UVA | 30.0 ± 1.0 | 6 |
| SPW4 | Yes | Photocatalysis | Deionised water + UVA + TiO2 | 7.7 ± 4.5 | 26 |
| SPW5 | Yes | Photo-oxidation | Deionised water + UVC | 30.7 ± 7.5 | 83 |
| SPW6 | Yes | Photocatalysis | Deionised water + UVC + TiO2 | 10.0 ± 4.0 | 24 |
Publisher’s Note: MDPI stays neutral with regard to jurisdictional claims in published maps and institutional affiliations. |
© 2020 by the authors. Licensee MDPI, Basel, Switzerland. This article is an open access article distributed under the terms and conditions of the Creative Commons Attribution (CC BY) license (http://creativecommons.org/licenses/by/4.0/).
Share and Cite
Lee, J.-M.; Busquets, R.; Choi, I.-C.; Lee, S.-H.; Kim, J.-K.; Campos, L.C. Photocatalytic Degradation of Polyamide 66; Evaluating the Feasibility of Photocatalysis as a Microfibre-Targeting Technology. Water 2020, 12, 3551. https://doi.org/10.3390/w12123551
Lee J-M, Busquets R, Choi I-C, Lee S-H, Kim J-K, Campos LC. Photocatalytic Degradation of Polyamide 66; Evaluating the Feasibility of Photocatalysis as a Microfibre-Targeting Technology. Water. 2020; 12(12):3551. https://doi.org/10.3390/w12123551
Chicago/Turabian StyleLee, Jae-Mee, Rosa Busquets, In-Cheol Choi, Sung-Ho Lee, Jong-Kyu Kim, and Luiza C. Campos. 2020. "Photocatalytic Degradation of Polyamide 66; Evaluating the Feasibility of Photocatalysis as a Microfibre-Targeting Technology" Water 12, no. 12: 3551. https://doi.org/10.3390/w12123551