Article

An Integrated Use of GIS, Geostatistical and Map Overlay Techniques for Spatio-Temporal Variability Analysis of Groundwater Quality and Level in the Punjab Province of Pakistan, South Asia

1
Department of Agricultural Engineering, Bahauddin Zakariya University, Multan 60800, Pakistan
2
Department of Land and Water Conservation Engineering, Faculty of Agricultural Engineering & Technology, PMAS Arid Agriculture University, Rawalpindi 46000, Pakistan
3
Centre of Excellence in Water Resources Engineering, University of Engineering &Technology, Lahore 54890, Pakistan
4
Research Center for Ecology and Environment of Central Asia, Xinjiang Institute of Ecology and Geography, Chinese Academy of Sciences, Urumqi 830011, China
5
Agricultural Engineering Department, (Field Wing) Rawalpindi 46000, Pakistan
6
Department of Environmental Sciences, COMSATS University Islamabad, Vehari Campus 61100, Pakistan
7
Department of Agricultural Engineering and Technology, Ghazi University, Dera Ghazi Khan 32200, Pakistan
8
State Key Laboratory of Desert and Oasis Ecology, Xinjiang Institute of Ecology and Geography, Chinese Academy of Sciences, Urumqi 830011, China
9
Institute of Water Problems, Hydropower and Ecology of the Academy of Sciences of the Republic of Tajikistan, Dushanbe 734042, Tajikistan
*
Author to whom correspondence should be addressed.
Water 2020, 12(12), 3555; https://doi.org/10.3390/w12123555
Submission received: 24 October 2020 / Revised: 14 December 2020 / Accepted: 14 December 2020 / Published: 17 December 2020
(This article belongs to the Special Issue Natural Background Levels in Groundwater)

Abstract

:
The rapidly changing climatic scenario is demanding periodic evaluation of groundwater quality at the temporal and spatial scale in any region for its effectual management. The statistical, geographic information system (GIS), geostatistical, and map overlay approaches were applied for investigating the spatio-temporal variation in groundwater quality and level data of 242 monitoring wells in Punjab, Pakistan during pre-monsoon and post-monsoon seasons of the years 2015 and 2016. The analysis indicated the higher variation in data for both the seasons (pre-monsoon and post-monsoon) as coefficient of variation (CV) values were found in the range of 84–175% for groundwater quality parameters. Based on the t-test values, the marginal improvement in groundwater electrical conductivity (EC), sodium absorption ratio (SAR) and residual sodium carbonate (RSC) and decrease in groundwater level (GWL) were observed in 2016 as compared to 2015 (p = 0.05). The spatial distribution analysis of groundwater EC, SAR and RSC indicated that the groundwater quality was unfit for irrigation in the lower south-east part of the study area. The groundwater level (GWL) was also higher in that part of the study area during the pre-monsoon and post-monsoon seasons in 2015 and 2016. The overlay analysis also indicated that the groundwater EC, RSC and GWL values were higher in south-east parts of the study area during pre-monsoon and post-monsoon seasons of 2015 and 2016. Hence, there is an instant need to apply groundwater management practices in the rest of the region (especially in the lower south-east part) to overcome the future degradation of groundwater quality.

1. Introduction

Groundwater is becoming a basic requirement for human utilization and crop production [1,2]. Approximately 2.5% of water worldwide is available as freshwater from all the global water resources. The amount of water accessible to humans is available in the form of rivers, lakes, reservoirs, and underground water [3]. Groundwater’s function is gaining more importance because a crisis is arising regarding surface water resources with time [4]. In Pakistan, about 50% of water is supplied for irrigation through groundwater sources [5]. Presently, the annual abstraction from groundwater is 60 billion cubic meters [6]. Consequently, the groundwater quality has deteriorated, while the water table has increased in many irrigated areas [7]. The groundwater quality is also rapidly declining worldwide, particularly in developing countries, due to larger dependency on groundwater resources for irrigation [2,8]. Additionally, the deterioration of groundwater quality due to annual and seasonal climate variation may impose pressure on hydrologic and hydrogeologic systems. These seasonal changes were attributed to groundwater quality as a result of monsoonal-driven surface–groundwater interaction [9]. The variation in groundwater quality parameters at a site was mostly related to local conditions and hazards. Similarly, the groundwater level also increased after the precipitation events and then decreased gradually with evaporation. The groundwater level varied within the period from wet to dry seasons and showed seasonal variations because of the seasonal distribution of precipitation and evaporation. Estimation of seasonal flooding impacts on groundwater quality and level due to substantial rainfall is critical to the management of this precious resource [10]. Therefore, it is essential to know the seasonal variation in groundwater quality [11].
Moreover, a key role is played by the various natural processes and anthropogenic activities in degrading groundwater quality [12,13,14]. To ensure the sustainable safe use of these resources, it is very important to access the groundwater quality as well as its other resources [3]. The groundwater quality is affected by various factors such as regional topography, characteristics of soil, discharge and flow, groundwater circulation through different types of rocks, groundwater recharge, saline water intrusion and hydro-meteorological surroundings of the area [8]. An understanding of the spatial and temporal variation in groundwater quality is essential for sustainable water supplies under changing climate and local environmental pressure [2,15]. For monitoring water quality, traditional approaches have been found to be unreliable due to errors in sampling. Various researchers have developed different graphical and statistical techniques to assess the trends in groundwater quality which vary from simple linear regression to more advanced parametric and non-parametric methods [16,17,18,19]. To address the potential groundwater quality problems, a geographic information system (GIS) and trend detection techniques would be useful for examining the long-term water quality variations [20]. The non-parametric methods such as Mann–Kendall (MK), Spearman’s rho (SR), Sen’s slope estimator (SSE), innovative trend analysis (ITA), the Theil Sen approach and sequential MK have extensively used to detect trends in time series environmental data [21,22]. Similarly, Agca [23] used the t-test for the temporal analysis of groundwater quality parameters in Amik plain (South Turkey), which indicated the increasing or decreasing trends of groundwater quality parameters. The management of natural resources can also be achieved using the geographic information system (GIS) at temporal and spatial scale [20,24]. Many authors investigated the GIS contribution in analyzing the spatial distribution of groundwater [25,26].
Therefore, assessment of groundwater spatial distribution is an easy way to analyze the groundwater quality in a matter of its suitability for irrigation [24,27]. The distribution of concentration over space and time that derives from the relation between sample points can be assessed by geostatistical techniques [28,29]. The weighted overlay approach in GIS has also been used to identify the groundwater potential zones in Killinochi, northern Sri Lanka [30]. However, such past studies did not report the integrated use of statistical, map overlay, and geostatistical techniques for the spatio-temporal variation of groundwater quality and level. The aims of the present research are to use the combine approaches (statistical, geostatistical, and map overlay analysis) for identifying and investigating the spatio-temporal variation in groundwater quality and level in the Haveli Canal Circle (HCC) Command area.

2. Materials and Methods

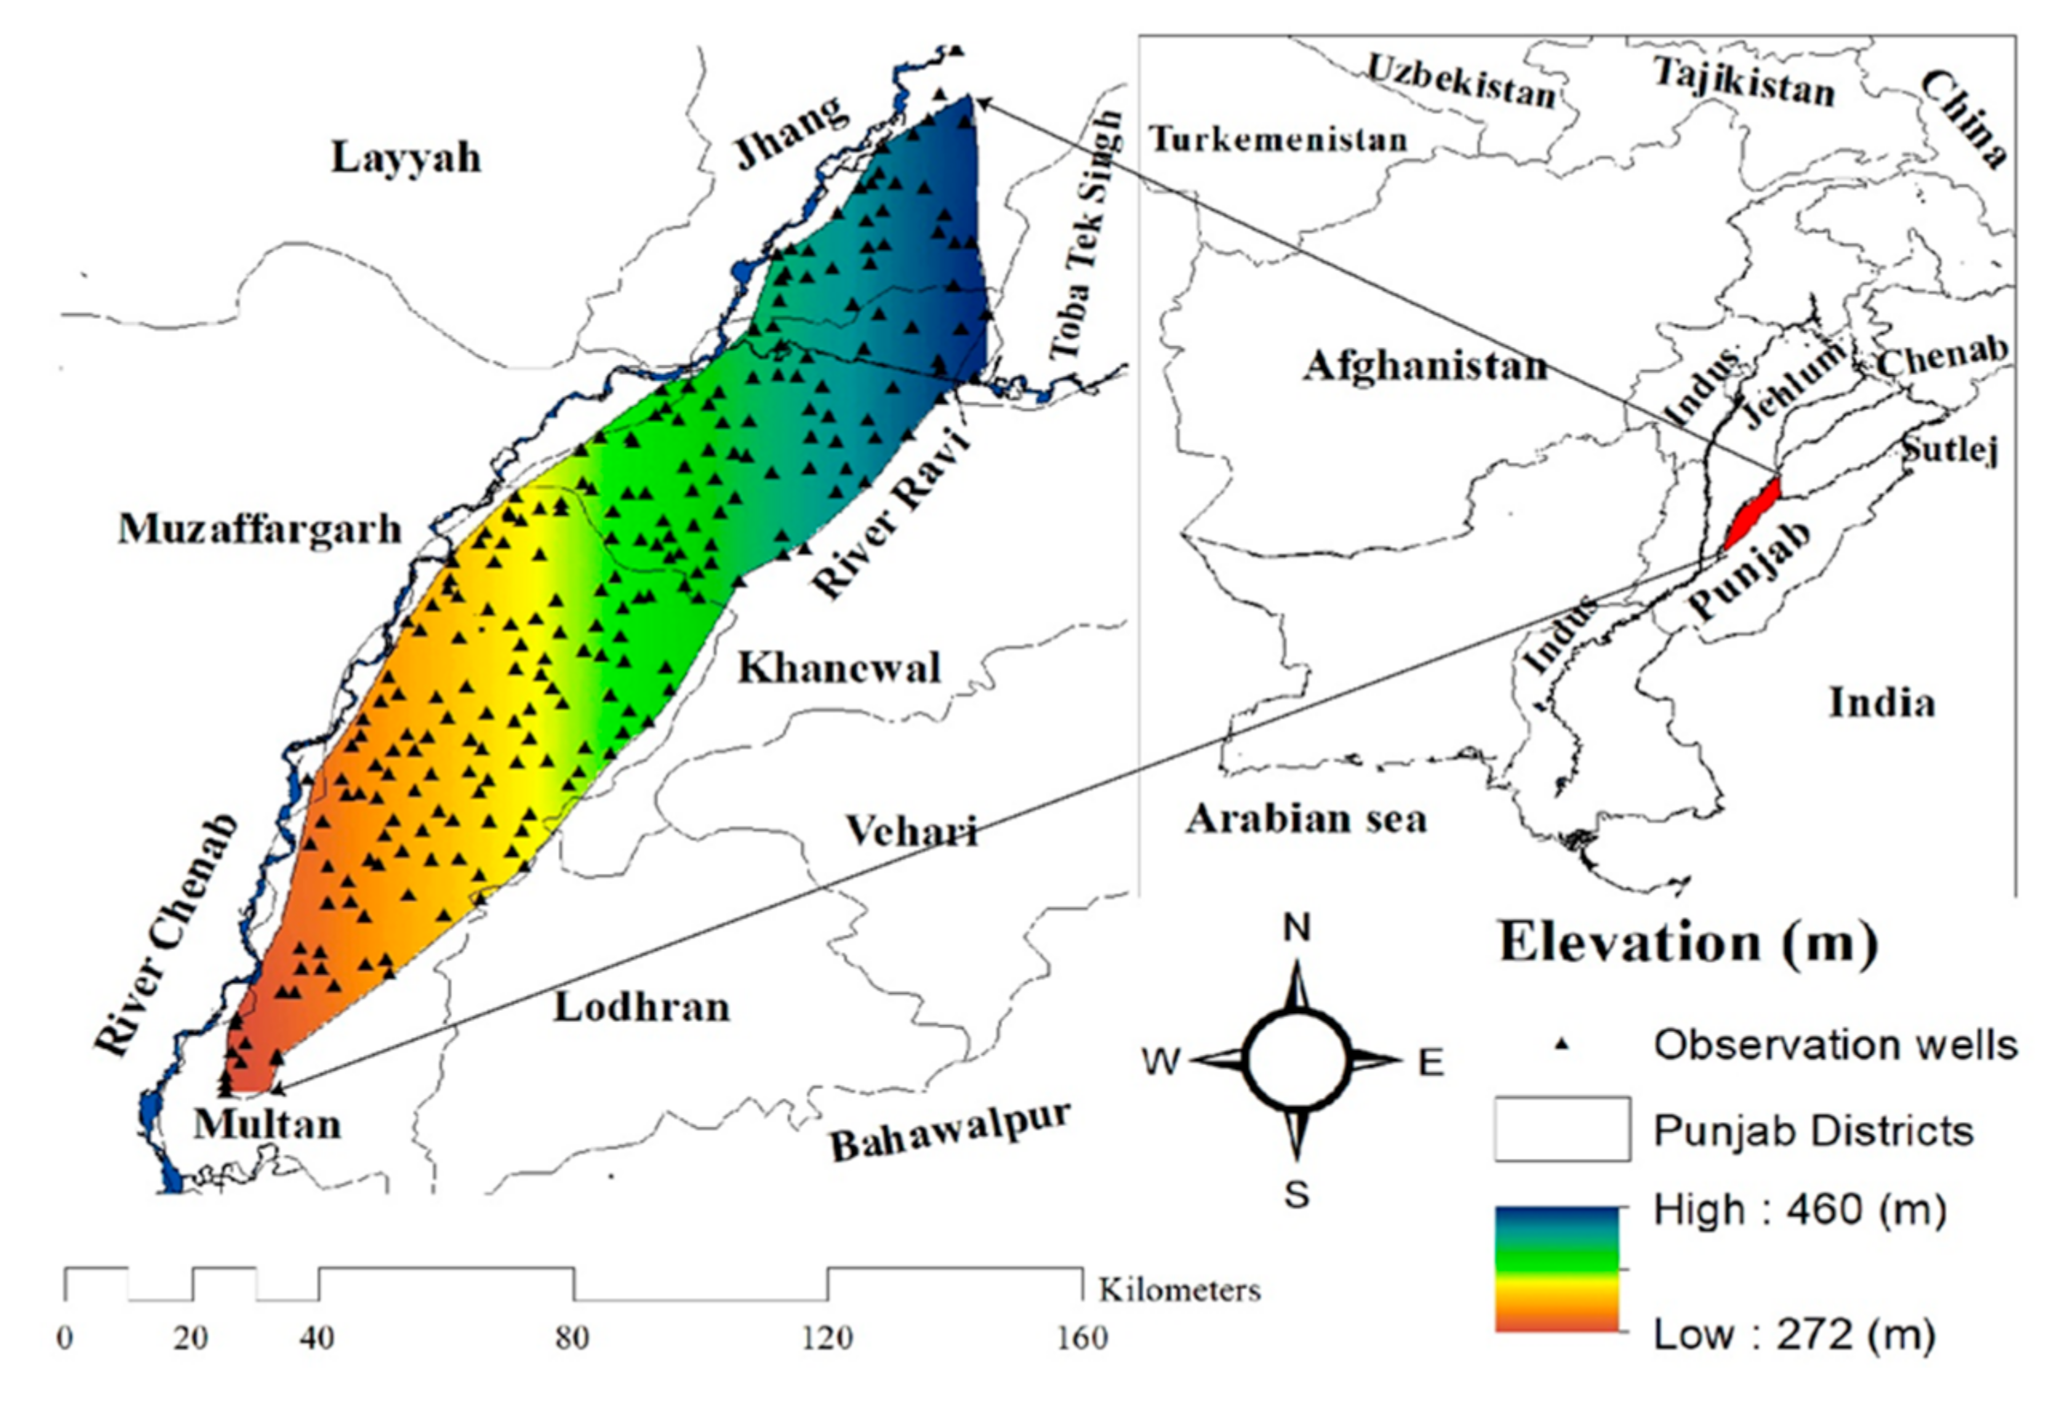
2.1. Appearances of Study Area

The present study was conducted in the region of Haveli Canal Circle, Multan irrigation zone (MIZ), Punjab, Pakistan. The region lies between the longitude of 71.12° and 72.19° and latitude of 29.51° and 31.65° (Figure 1). The MIZ is situated in an arid and semi-arid regions where the climate is hot in summer and cold in the winter [31]. The highest recorded temperature in the region was 54 °C and the lowest recorded temperature was approximately −1 °C [27]. It has a flat topography and is suitable for agriculture purposes but receives very little rainfall throughout the year. The average annual rainfall in the study region varies from 100 to 300 mm. The rainfall is unreliable and can be distributed in two seasons (pre-monsoon and post-monsoon). About 60% of the total annual rainfall occurs during the summer season (monsoon rain) and the remaining rainfall is received during the rest of the year [32].
Wheat, cotton, sugarcane, and corn are the dominant crops grown in MIZ. The availability of irrigation water from surface sources is a crucial factor for the growth of crops. As the availability of surface water is highly variable, groundwater is pumped to fulfil crop water needs during prolonged dry periods. However, the quality of groundwater is not suitable for irrigation use in many parts of the study area [27]. The aquifers of the study region mostly consist of alluvial deposits which were transported by rivers from the Himalayan mountainous ranges. The alluvium generally contains sands and gravels, or mixtures of sands and gravels. Groundwater in the area is recharged through infiltration from precipitation and seepage from the Chenab River and its associated canal network.

2.2. Data Collection and Analysis

Two years (2015–2016) of groundwater quality data for 242 monitoring sites (wells) of Haveli Canal Circle, Multan Irrigation Zone (MIZ), Punjab for the pre-monsoon and post-monsoon seasons were collected from the Land Reclamation Department of Multan, Govt. of Punjab, Pakistan. Groundwater samples from every well installed in the study area were collected for pre-monsoon (May–June) and post-monsoon (October-November) meeting the standard protocols. Each sample was examined chemically to identify the groundwater properties of electrical conductivity (EC), sodium adsorption ratio (SAR), and residual sodium carbonate (RSC). The groundwater EC, SAR, and RSC are commonly used to assess the suitability of groundwater for irrigation in Pakistan [33]. Furthermore, the Punjab Irrigation Department also collected data on groundwater EC, SAR, and RSC for groundwater quality monitoring in the study area. The groundwater EC was measured with a portable multi-meter which was calibrated before its use. The SAR and RSC were calculated using the standard laboratory protocol as reported in the literature [34,35]. Similarly, the groundwater level (GWL) data were also recorded using the water level recorder.
The Shapiro–Wilk normality test was conducted to check the data distribution in the Statistical Package for Social Sciences (SPSS) software package. To visualize the normality of the data, normal Q-Q plots were used. The p values were used to confirm the parameters that showed normal distribution. The normality test showed that the data of all groundwater parameters did not conform to a normal distribution (p = 0.05). For exploratory analysis of the data, statistical parameters, i.e., minimum, maximum, mean, median, coefficient of variation (CV) and skewness, were determined using the Statistix 10.0 (Analytical Software, Tallahassee, FL, USA). Spearman’s rank correlation analysis was determined in both the seasons for a better assessment of the relationship among groundwater parameters. The Spearman’s rank correlation method is a non-parametric test method which can express the level of association between two groundwater parameters [36]. For the temporal evaluation of the 242 datasets during the sampling periods, an independent sample t-test was also carried out [23].

2.3. Spatial Variability Analysis

Spatial variability analysis of groundwater parameters was carried out using the ordinary kriging interpolation technique. Ordinary Kriging is a one of the geostatistical methods that can be used to interpolate a random variable at an unknown location considering its value at the nearby location [37]. Before applying the ordinary kriging interpolation technique, the data were log-transformed to conform to the necessary assumptions for ordinary kriging. The histogram and normal Q-Q plot were drawn using the log-transformed data in the SPSS software package to assess the normality of data and to ensure that the data conformed to the normal distribution. Then, that central tool of geostatistical methods such as semi-variance was applied to quantify the spatial autocorrelation of groundwater parameters based on the log-transformed data [38,39]. All the geostatistical analyses were carried using the GS+ software (RockWare Inc., Golden, CO, USA). Using the binned values fitness method, the best fit model was selected before applying the ordinary kriging interpolations based on the coefficient of determination (R2) and, for scatter plots, each groundwater parameter. Moreover, the ratio of ((C0)/(C0 + C1)) was used to determine the spatial variation of groundwater EC, SAR, RSC, and GWL values. For the given parameters of groundwater, the ratio of ((C0)/(C0 + C1)), i.e., (<25%), (25–75%) and (>75%), indicates strong, moderate, and weak spatial dependence, respectively [40]. The leave one-out cross validation was performed by hiding the values of groundwater samples and estimating its values from the remaining data set. The same procedure was repeated for different semi-variogram models and found the statistics of cross validation error for selecting optimal model. After selecting the suitable model, the kriging method was found to be suitable for the interpolation and management of groundwater parameters using either GS+ software or ArcGIS software package. A study suggested that using the interpolation methods of GS+ software and ArcGIS is efficient in the prediction of unsampled data and gave almost the same result [41]. However, the ArcGIS 10.1 software package was used to interpolate groundwater EC, SAR, RSC, and GWL for both the pre-monsoon and post-monsoon seasons in each year based on the variogram parameters calculated using the GS+ software. A similar approach has also been used for geostatistical and interpolation of top soil properties by Zhang et al. [42]. All groundwater parameters were classified using the manual classification technique based on the groundwater quality standards for irrigation.

3. Results and Discussions

The minimum, maximum, mean, median, standard deviation (SD), coefficient of variance (CV) and skewness values of groundwater EC, SAR, RSC, GWL for pre-monsoon and post-monsoon seasons in 2015 and 2016 are shown in Table 1 and Table 2, respectively. The variability in data can be addressed by the value of CV. A value of CV less than 10% indicates low variability, moderate variability is indicated when 10% ≤ CV ≤ 100%, and high variability is indicated when CV > 100%, respectively [21]. The values of CV for EC during the pre-monsoon and post-monsoon seasons in 2015 were found to be 115.77% and 135.34%, respectively, which indicated the high variability in the data. Similarly, the values of CV for RSC during the pre-monsoon and post-monsoon seasons in 2015 were found as 170.43% and 175.22%, respectively, which also indicated the high variability in the RSC data. Moreover, the values of CV for SAR and GWL during the pre-monsoon and post-monsoon seasons were found to be 84.97%, 92.97%, 79.74%, and 98.29%, respectively, which indicated the moderate variability in the data for both the seasons in 2015 (Table 1). The values of CV for EC during the pre-monsoon and post-monsoon seasons in 2016 were found to be 115.75 and 110.71%, respectively, which also indicated the high variability in the data for groundwater EC. Similarly, the values of CV for RSC and GWL during pre-monsoon and post-monsoon seasons in 2016 were found to be 174.80, 224.19%, 103.35% and 112.47%, respectively, which indicated the high variability in the data for groundwater RSC and GWL (Table 2).
The paired t-test was performed to analyze the difference in mean values of groundwater parameters for pre-monsoon and post-monsoon seasons [43]. The mean EC of 1.49 dS/m during the pre-monsoon season was significantly lower than that of mean EC of 1.65 dS/m during the post-monsoon season in 2015 (p = 0.05). The mean values for SAR, RSC, and GWL during the pre-monsoon season were higher than those of post-monsoon season in 2015 (Table 3). Similarly, significant negative difference was determined for groundwater EC between the pre-monsoon and post-monsoon seasons in 2015, having a t-state of −0.887. On the other hand, significant positive difference was observed between the pre-monsoon and post-monsoon seasons for groundwater SAR, RSC, and GWL in 2015. However, the significant positive difference was observed for groundwater EC between the pre-monsoon and post-monsoon seasons, having a t-state value of 0.901 and the significant negative difference was observed for GWL between the pre-monsoon and post-monsoon seasons in 2016 (p = 0.05). The difference in results for both the years (2015 and 2016) for seasonal analysis may be due to the variation in rainfall.
The seasonal variation in groundwater level mainly depends on the annual cycle of rainfall and river water levels [9,10,11]. The GWL increases due to over-pumping in the pre-monsoon season, which tends to degrade groundwater quality [44]. Annual comparison of the mean value for all groundwater parameters was also observed for both the years (2015 and 2016), which indicated positive significant difference with t-values of 0.291, 1.324, and 0.504 for annual groundwater SAR, RSC and GWL, respectively, at 0.05 significant level (Table 3). The marginal improvement in groundwater SAR and RSC and decrease in GWL were also observed in 2016 as compared to 2015.

3.1. Spearman’s Rank Corelation Coefficient

The Spearman’s rank correlation coefficients (rs) among all groundwater parameters were calculated for correlation analysis in both the seasons. The values of (rs) for each groundwater parameter were shown in Table 4. Interpretation of correlation analysis indicates a quick quality monitoring for groundwater parameters [45]. A significant positive relationship was observed between boring depth and discharge and boring depth and screen length, with rs = 0.372 and 0.473, respectively, at 0.05 significant level. The analysis for groundwater EC in the pre-monsoon season of 2015 indicated the significant positive relationship with groundwater EC and SAR in the post-monsoon season with rs = 0.930 and 0.729, respectively. Similarly, the analysis of groundwater SAR in pre-monsoon season of 2015 indicated a significant positive relationship with groundwater EC, SAR, and RSC for the post-monsoon season, with rs = 0.744, 0.810, and 0.360, respectively. Moreover, groundwater RSC has a significant positive connection in pre-monsoon and post-monsoon seasons with rs = 0.842. The significant positive connection between groundwater EC and SAR was also found, with rs values varying from 0.297 to 0.783 for both the seasons (pre-monsoon and post-monsoon) in 2015 and 2016. These correlations may indicate some of the impacts of agricultural activities in the study area. This may also be related to the general process governing the groundwater formation [36,46].

3.2. Spatial Modelling of Groundwater Parameters

The spatial dependence of each groundwater parameter for pre-monsoon and the post-monsoon seasons was determined with the help of semi-variograms models for both the years [27]. The ratio of nugget variance (C0) to sill variance (C0 + C1) was used to determine the spatial variation of groundwater parameters i.e., EC, RSC, SAR and GWL.
The data are considered “strongly” spatially dependent if the ratio is less than or equal to 25%, “moderately” spatially dependent if the ratio ranges from 25 to 75%, and “weakly” spatially dependent if the ratio is greater than 75% [40]. The results indicate that the data of groundwater quality parameters were spatially autocorrelated over the years. From the analysis of the developed semi-variogram, the best fit model was selected based on the coefficient of determination (R2) before the kriging interpolations to analyze the spatial distribution of groundwater parameters (Table 5). The nugget to sill ratios for EC, SAR, RSC, and GWL during the post-monsoon season in 2015 were found to be 13.86%, 12.52%, 15.57%, 13.40% and 8.10%, respectively, which indicated the strong spatial dependence. The nugget to sill ratios during the post-monsoon season in 2016 for EC, SAR, RSC and GWL were found to be 0.03%, 21.60%, 6.84%, 6.33%, 6.33% and 6.38%, respectively, which also indicated the strong spatial dependence. The moderate spatial dependence was analyzed for EC during the pre-monsoon season with nugget to sill ratios of 49.98% (in 2015) and 43.09% (in 2016) for both years. The spatial variability of groundwater properties was affected due to the naturally occurring factors such as topography, regional climate, groundwater flow pattern, groundwater runoff and hydrological conditions. When these naturally occurring factors have greater influence on groundwater, then the chances of strong spatial dependence become maximum for a given area [47]. Similarly, the detailed outcomes about the fitness and selection of different models for the interpolation of groundwater quality parameters are given in Table 5.

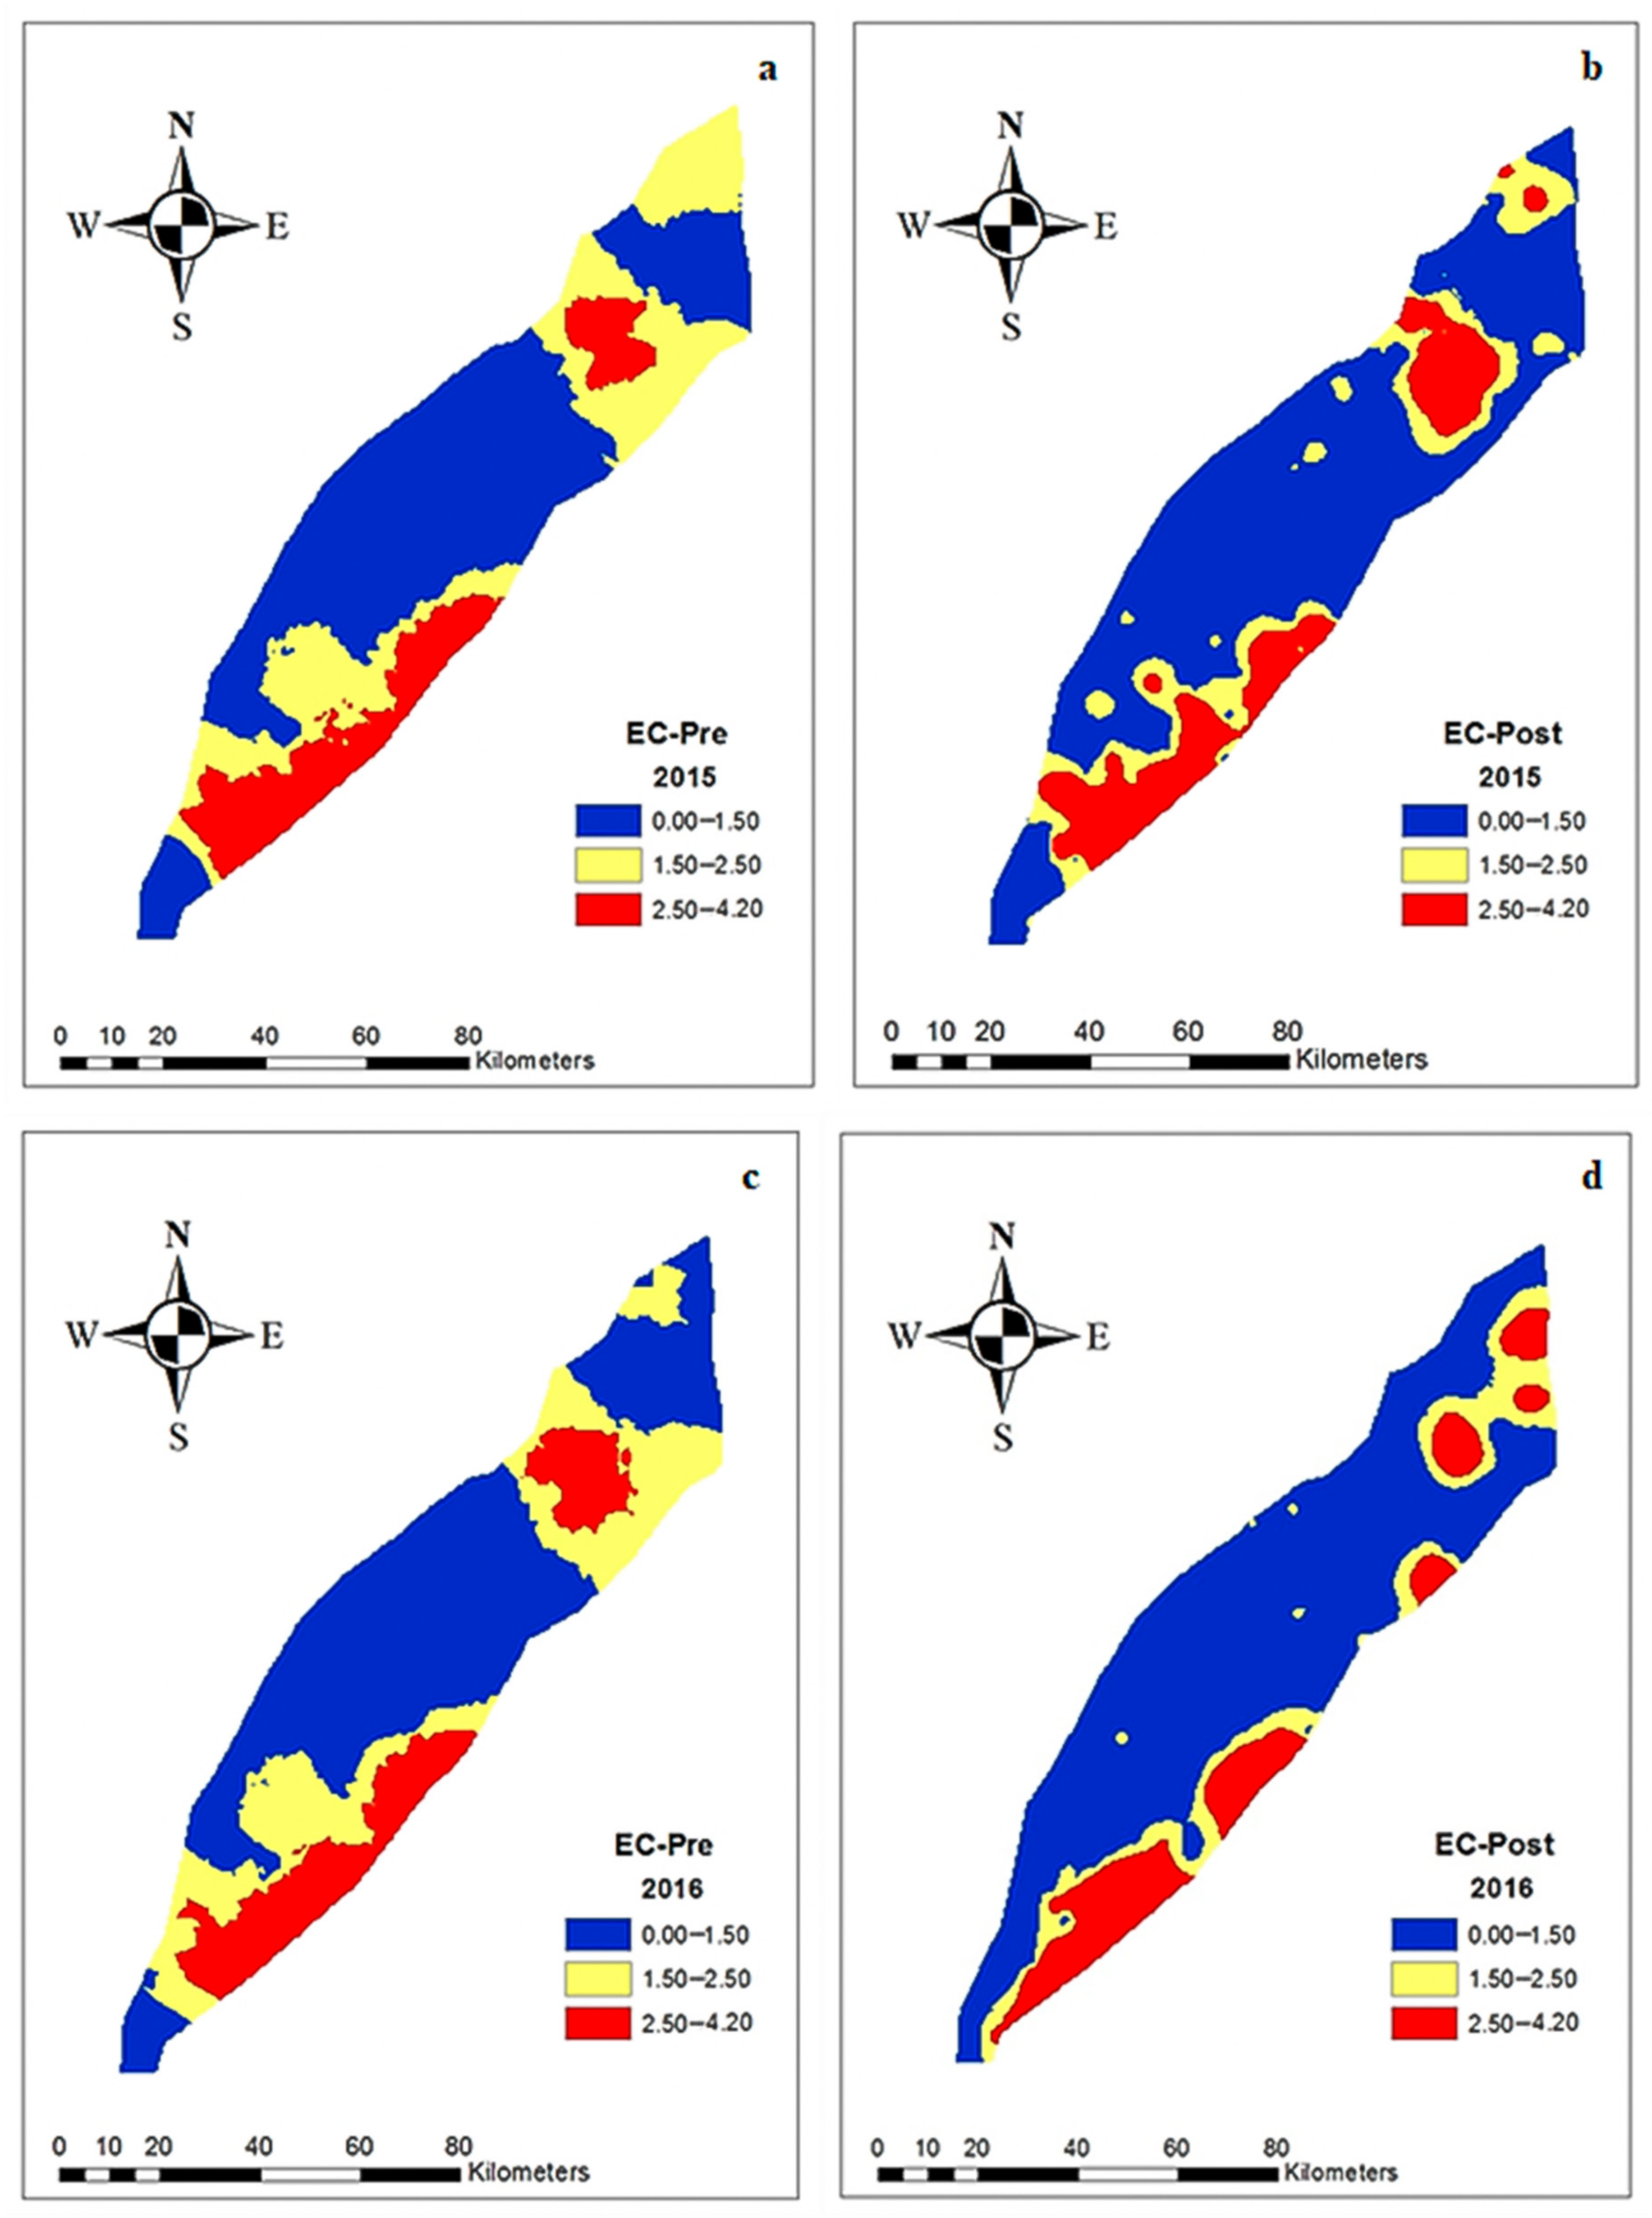
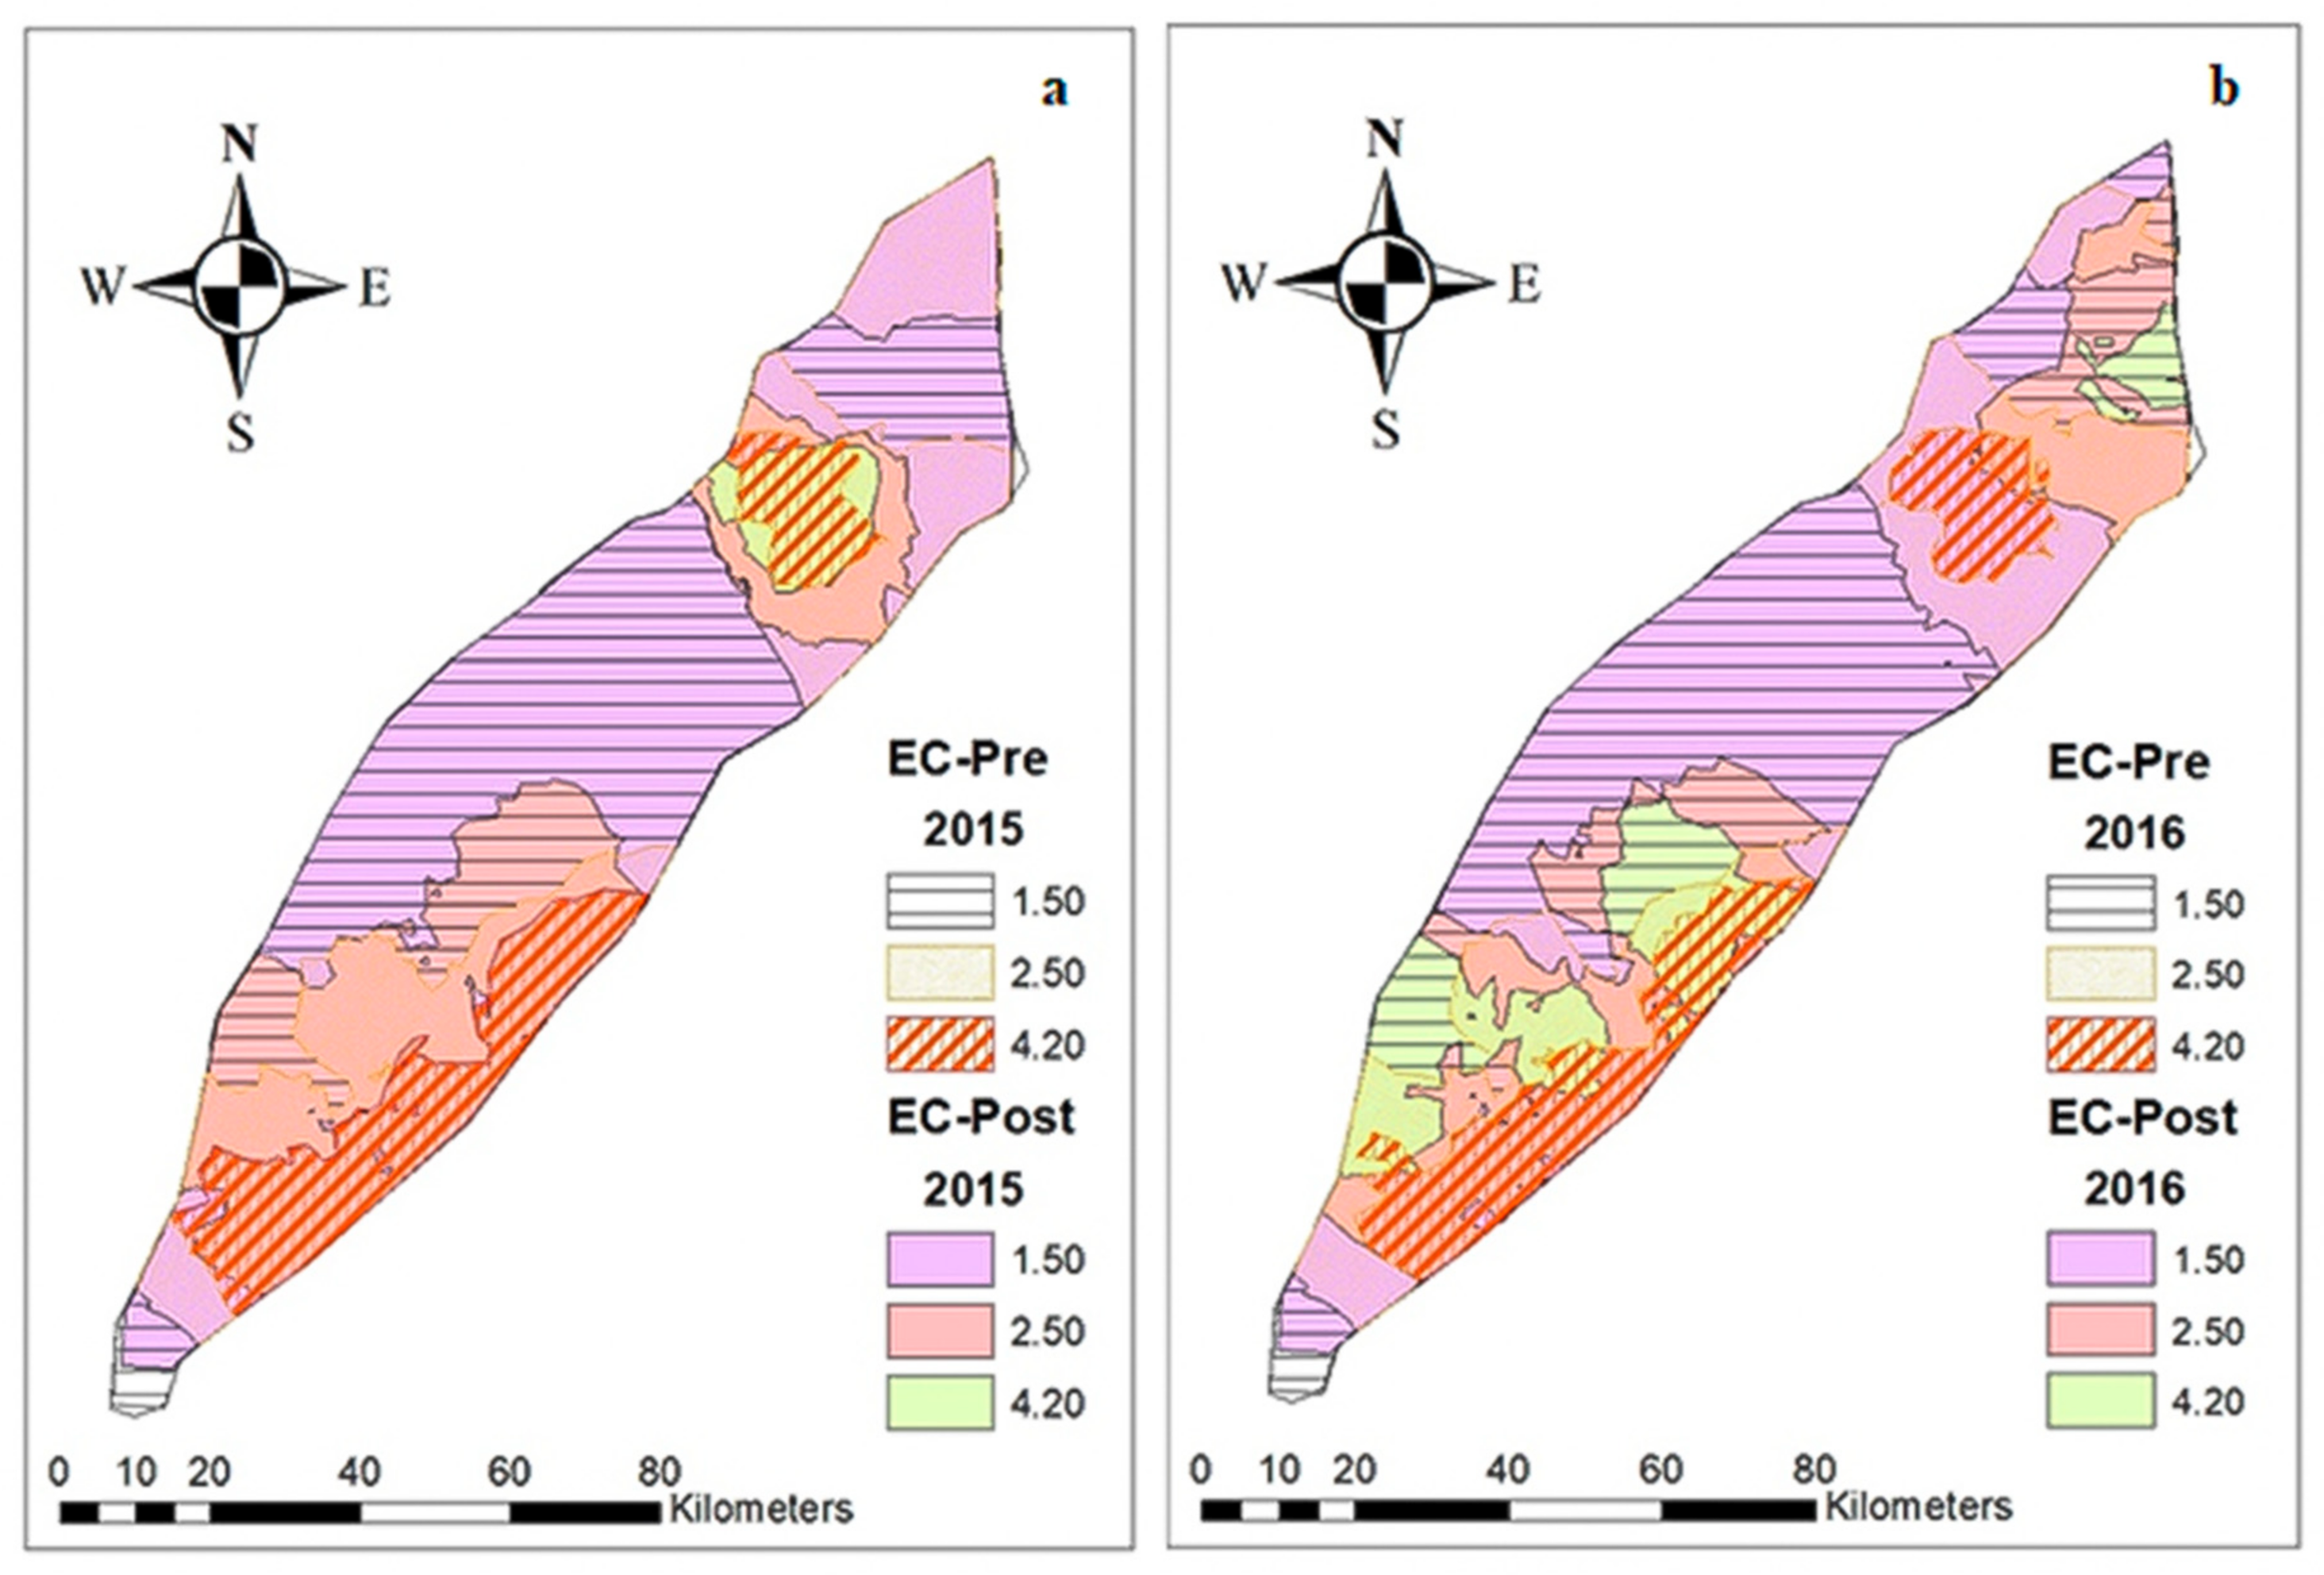
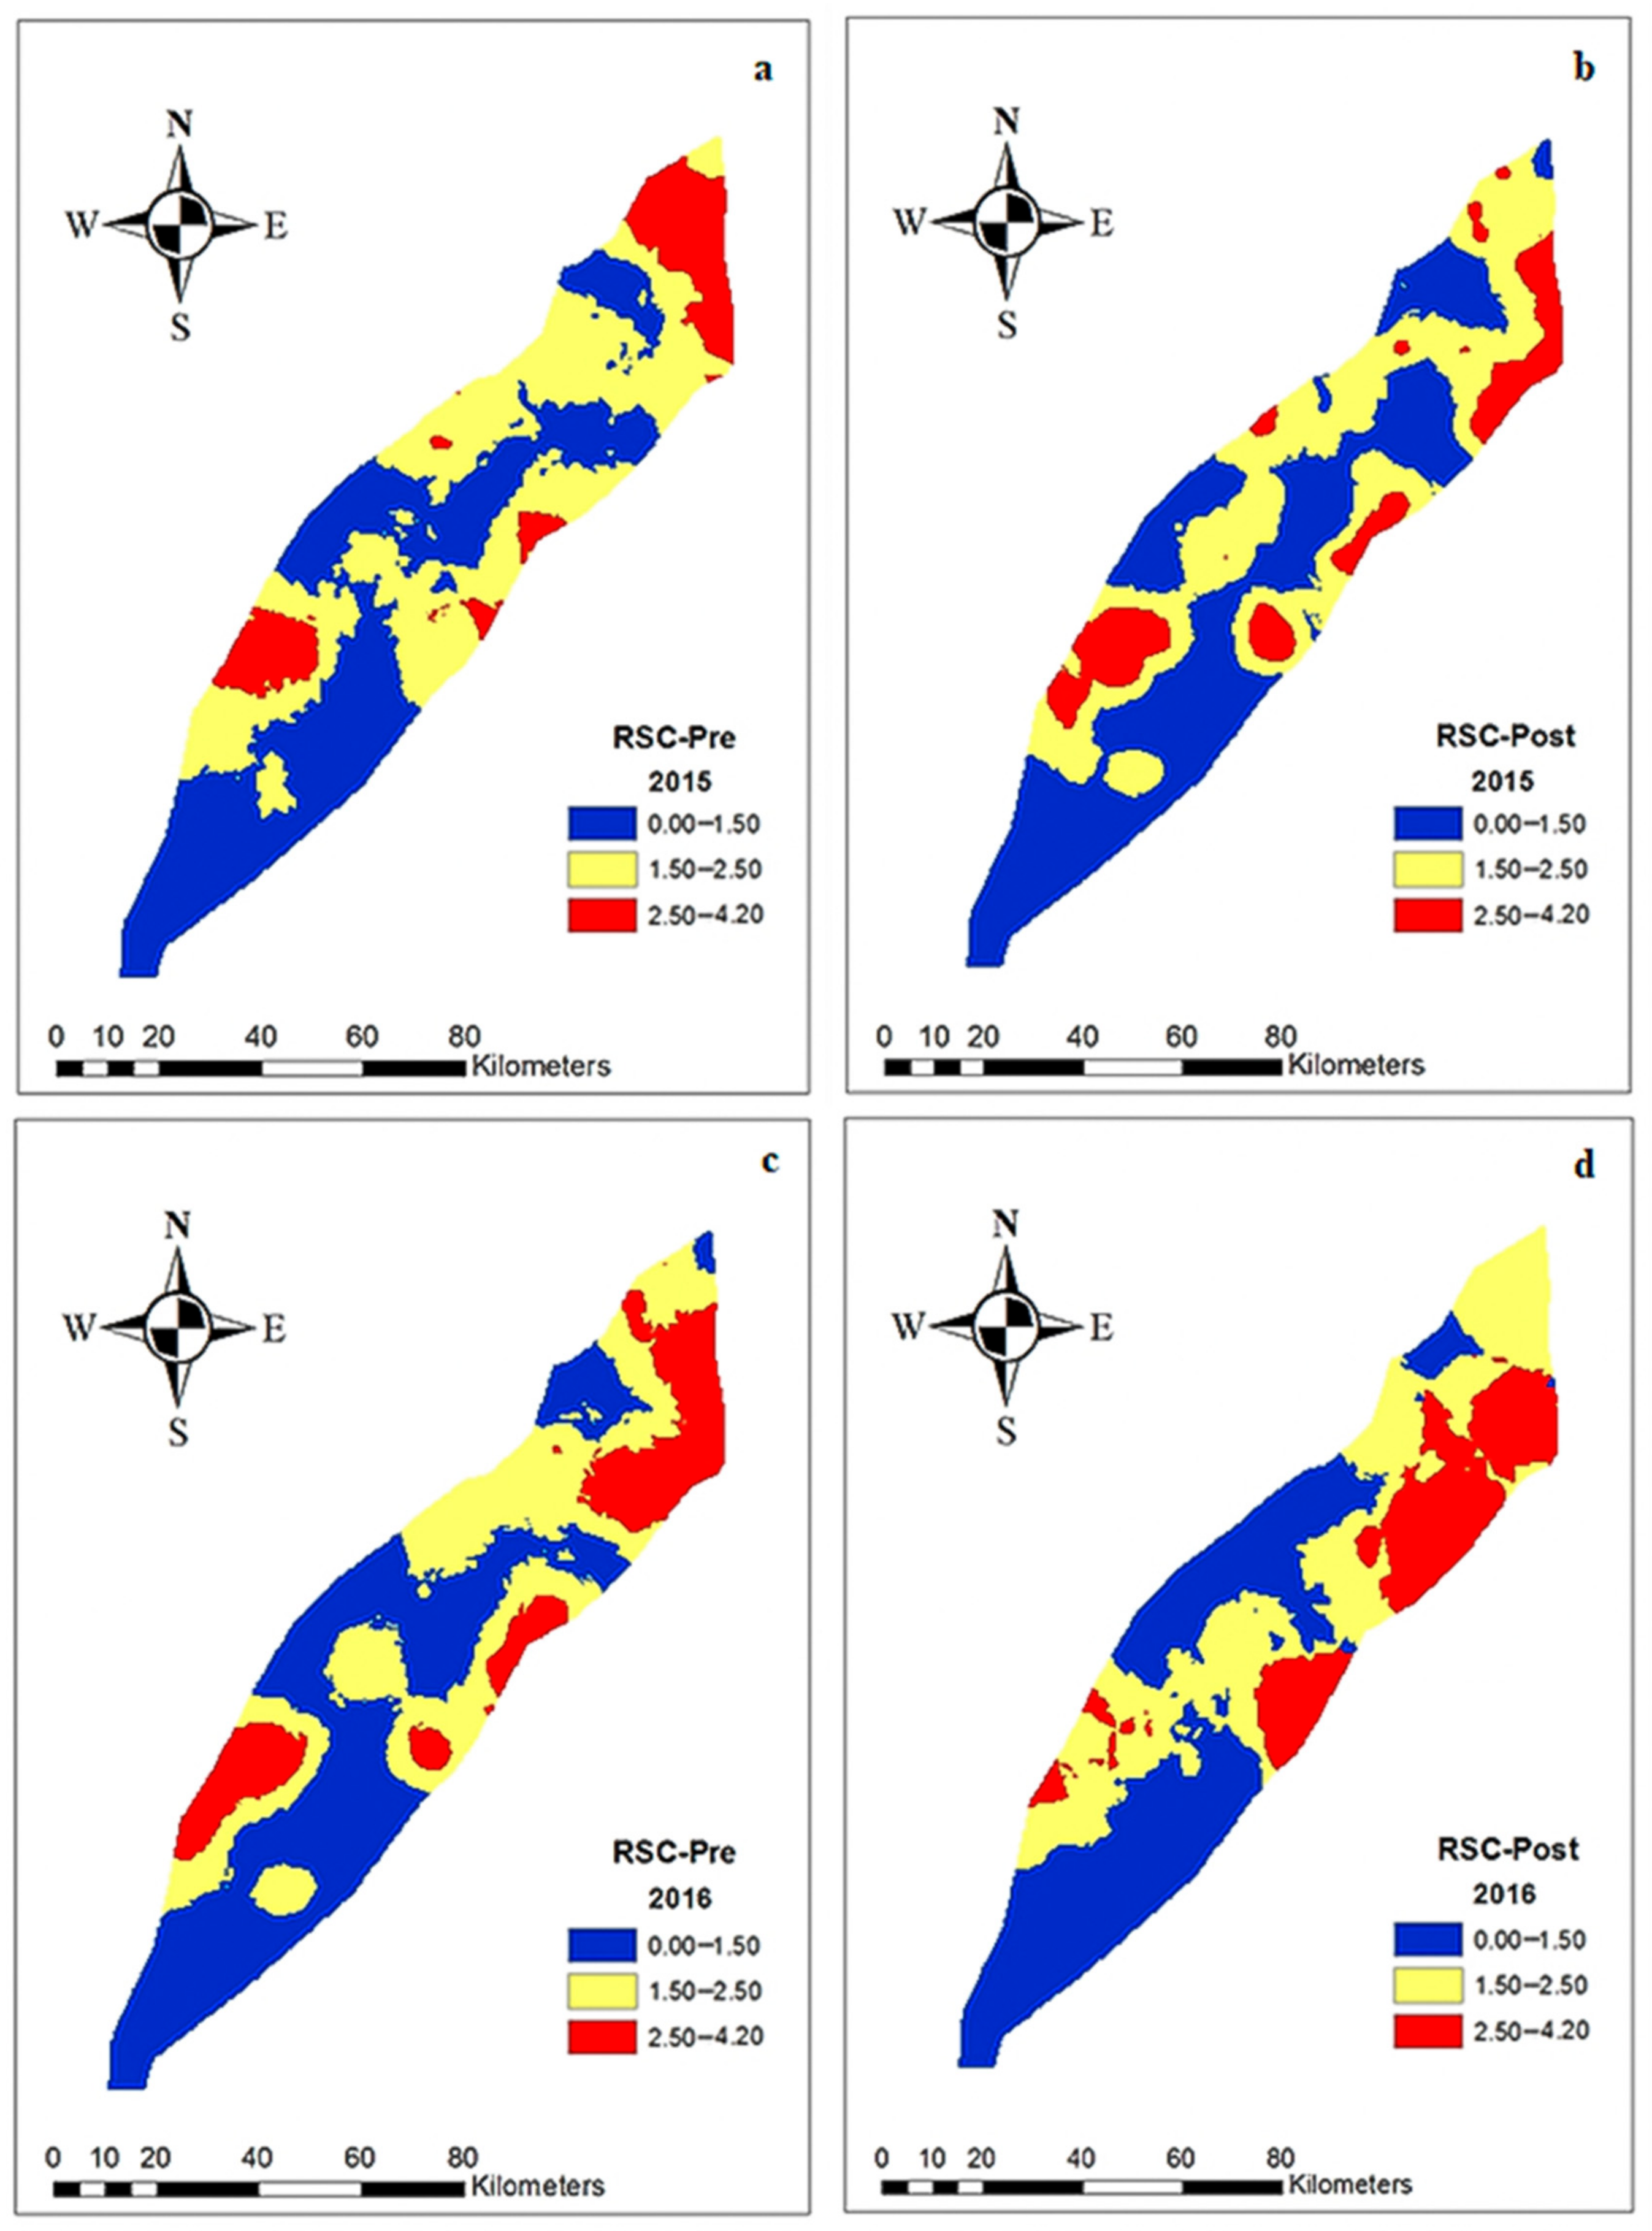
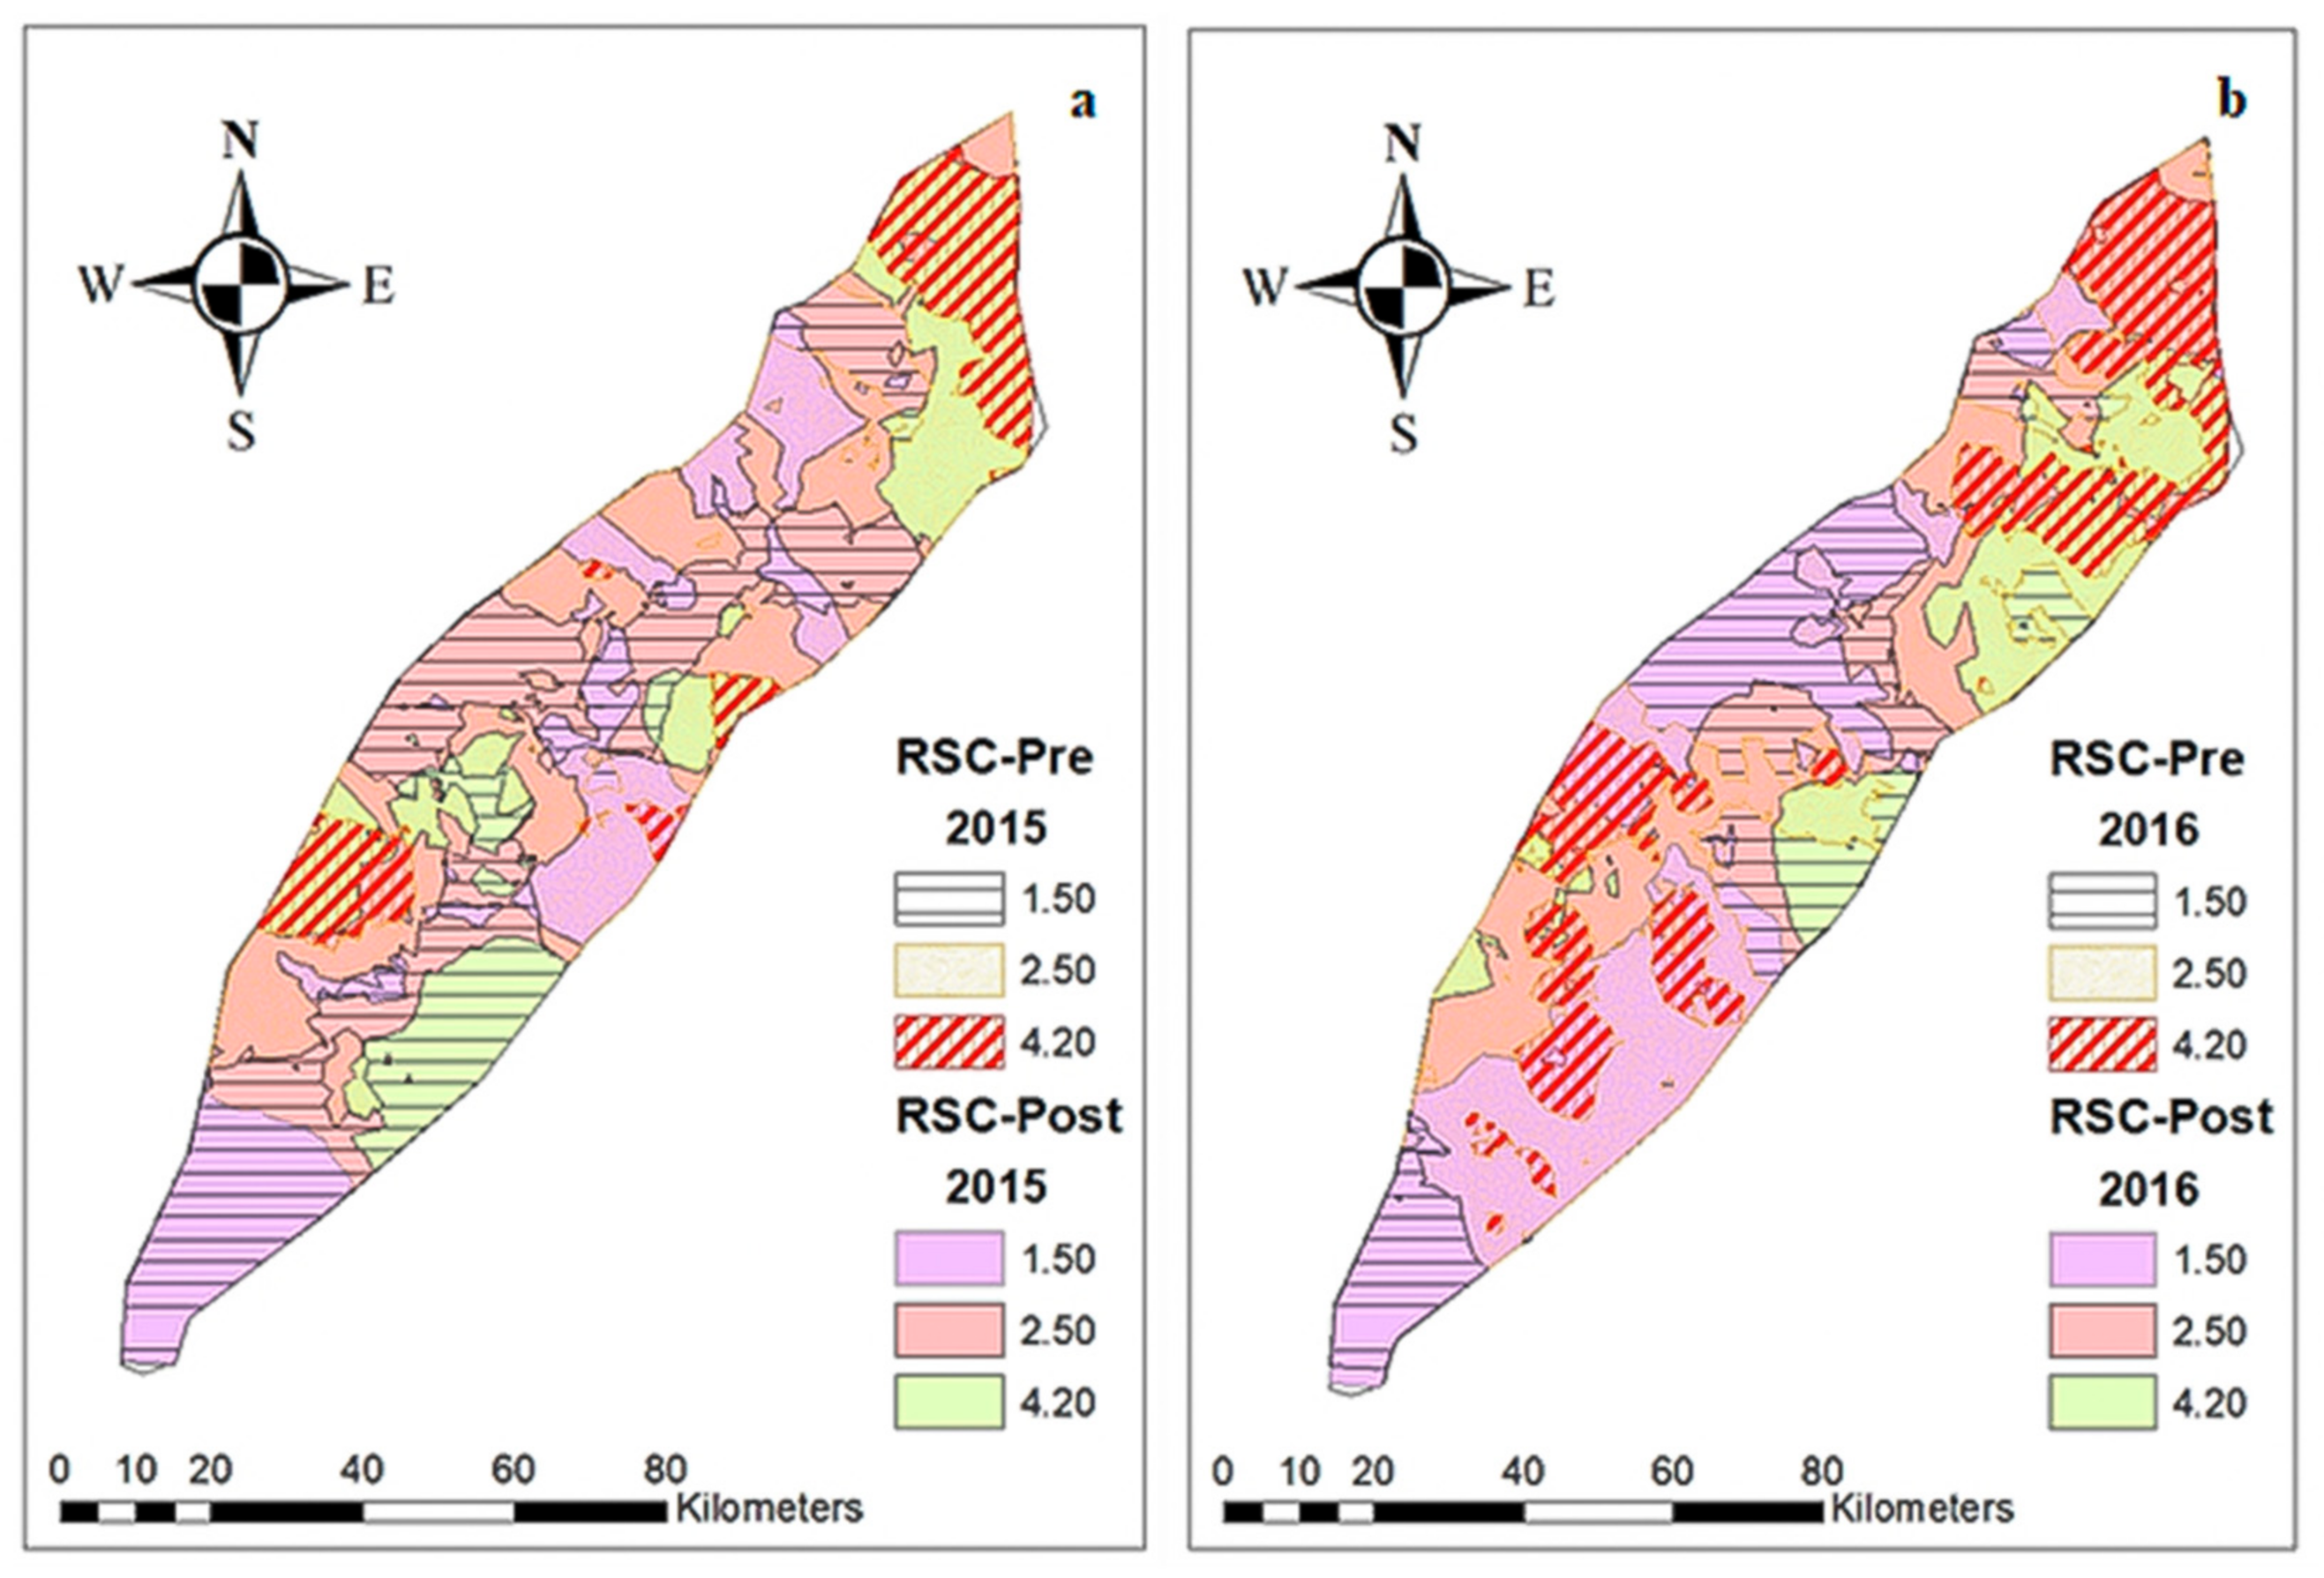
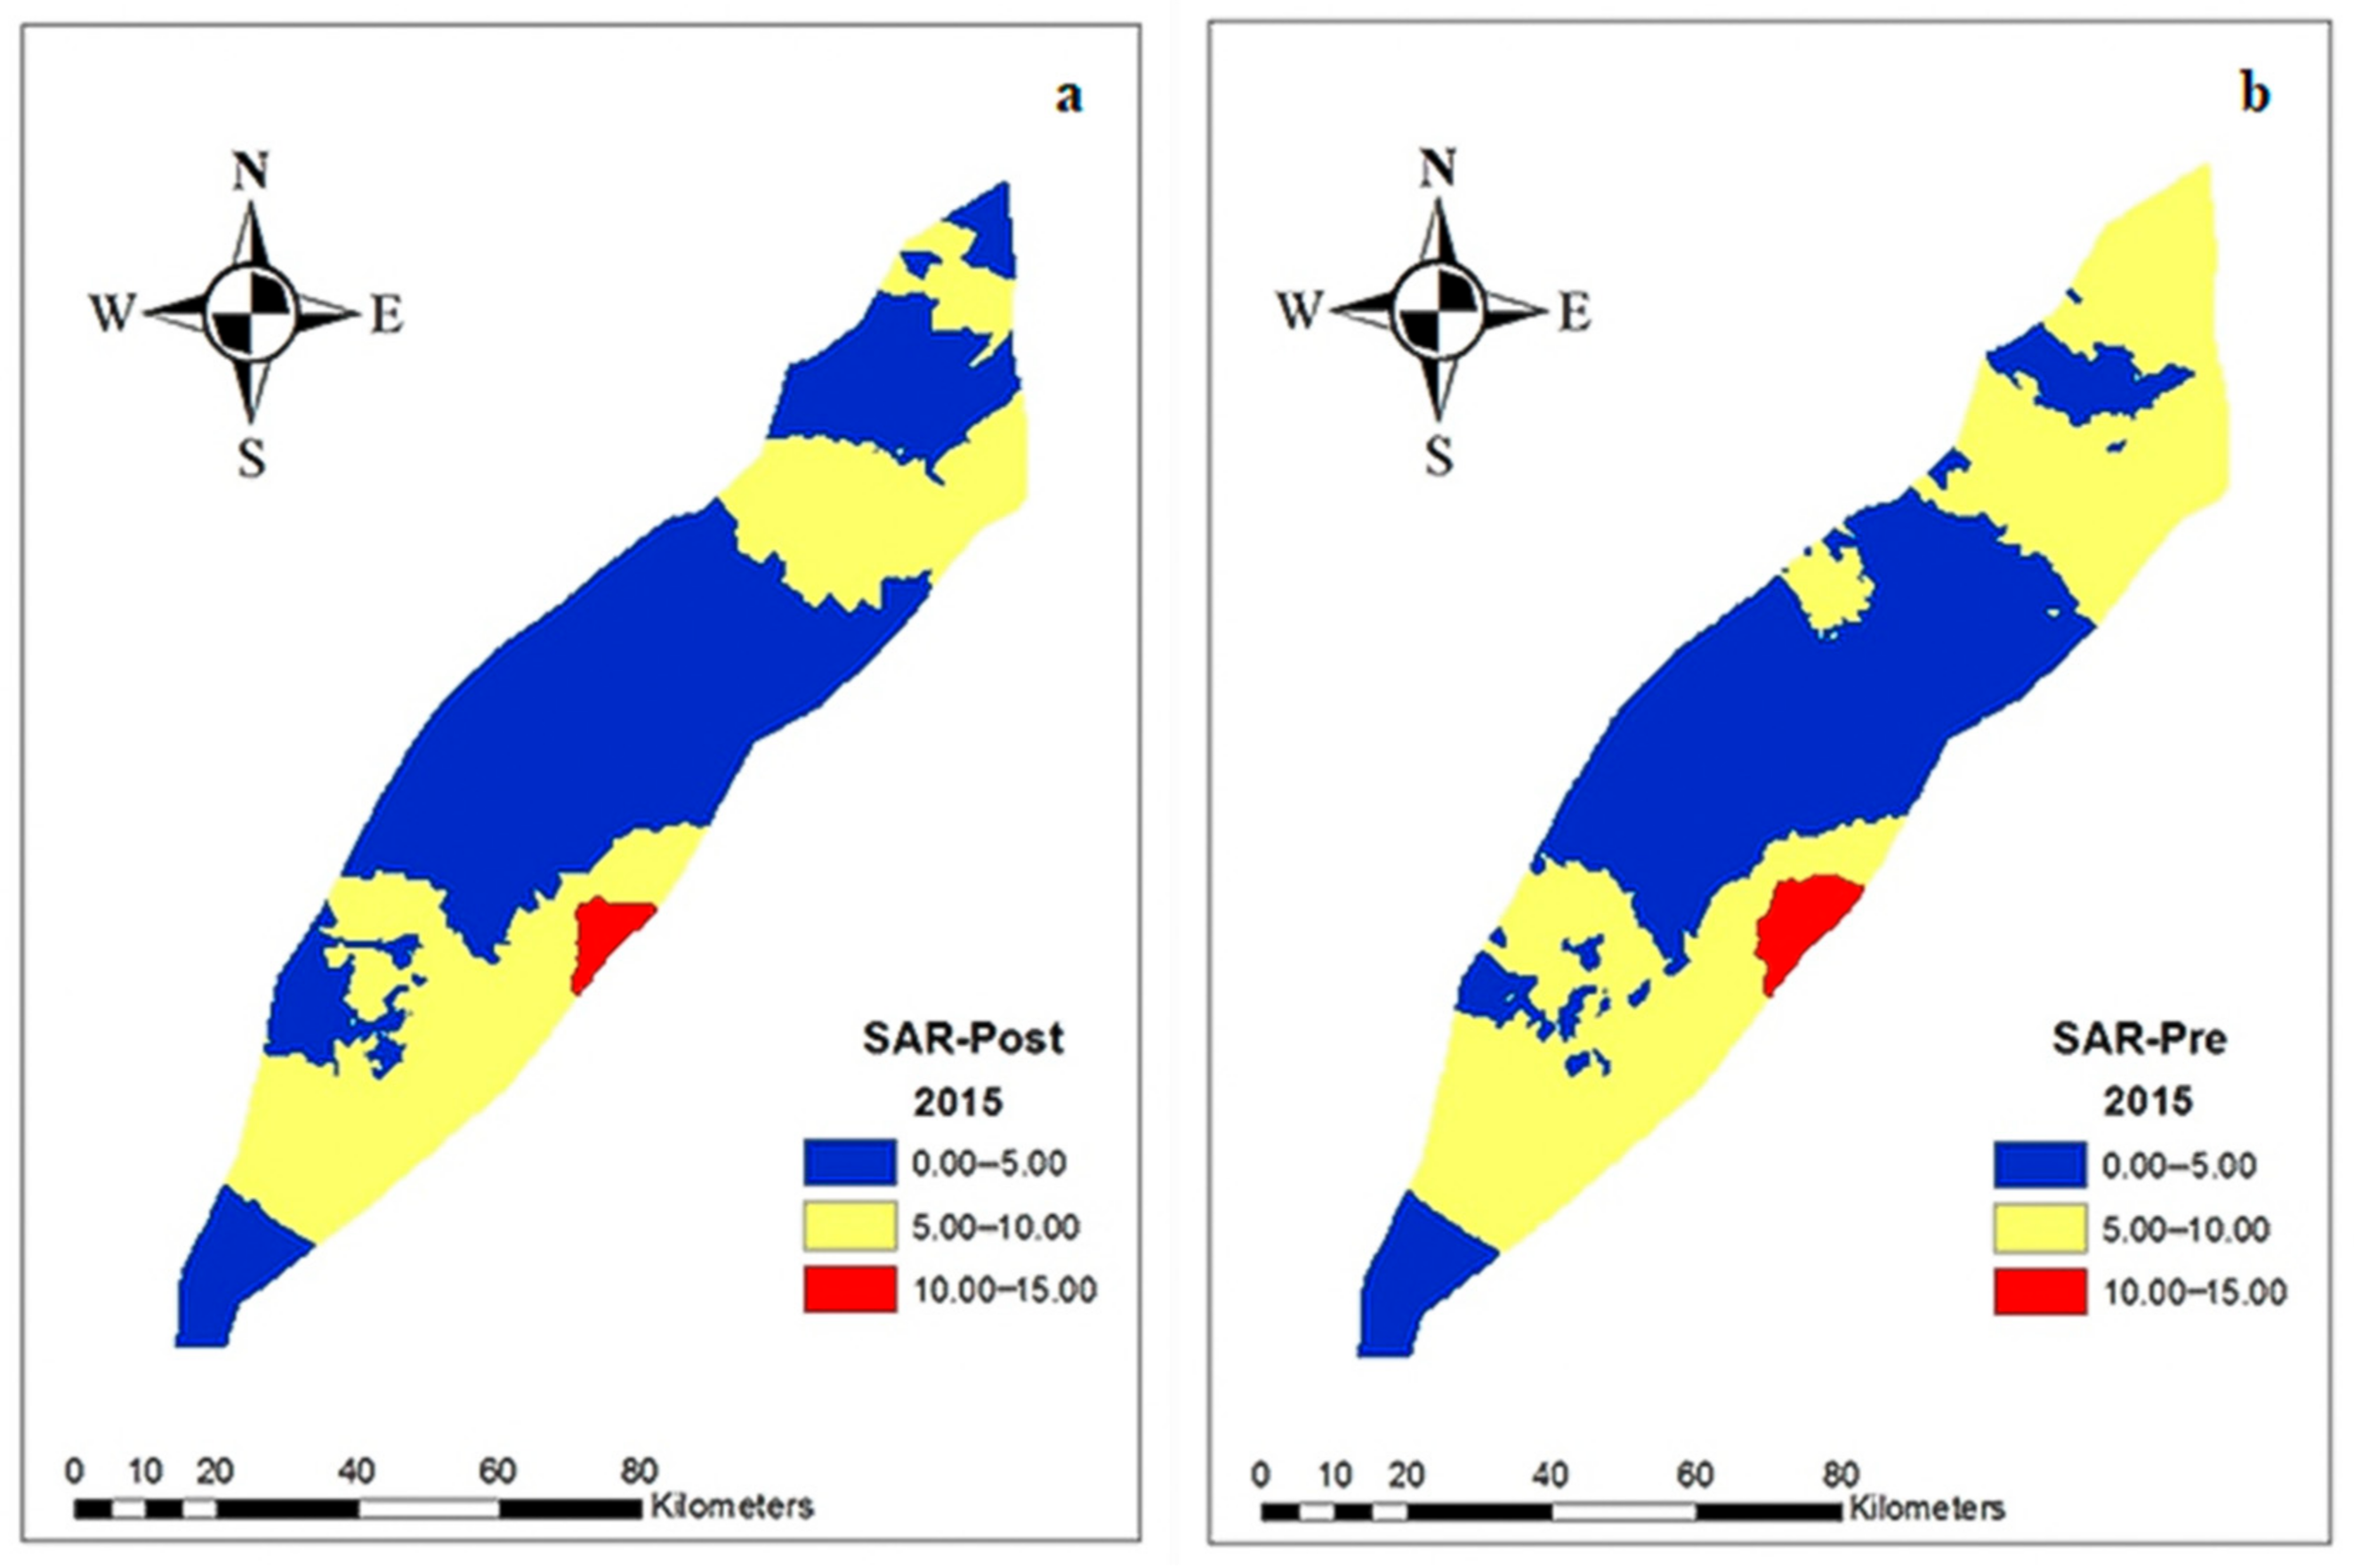
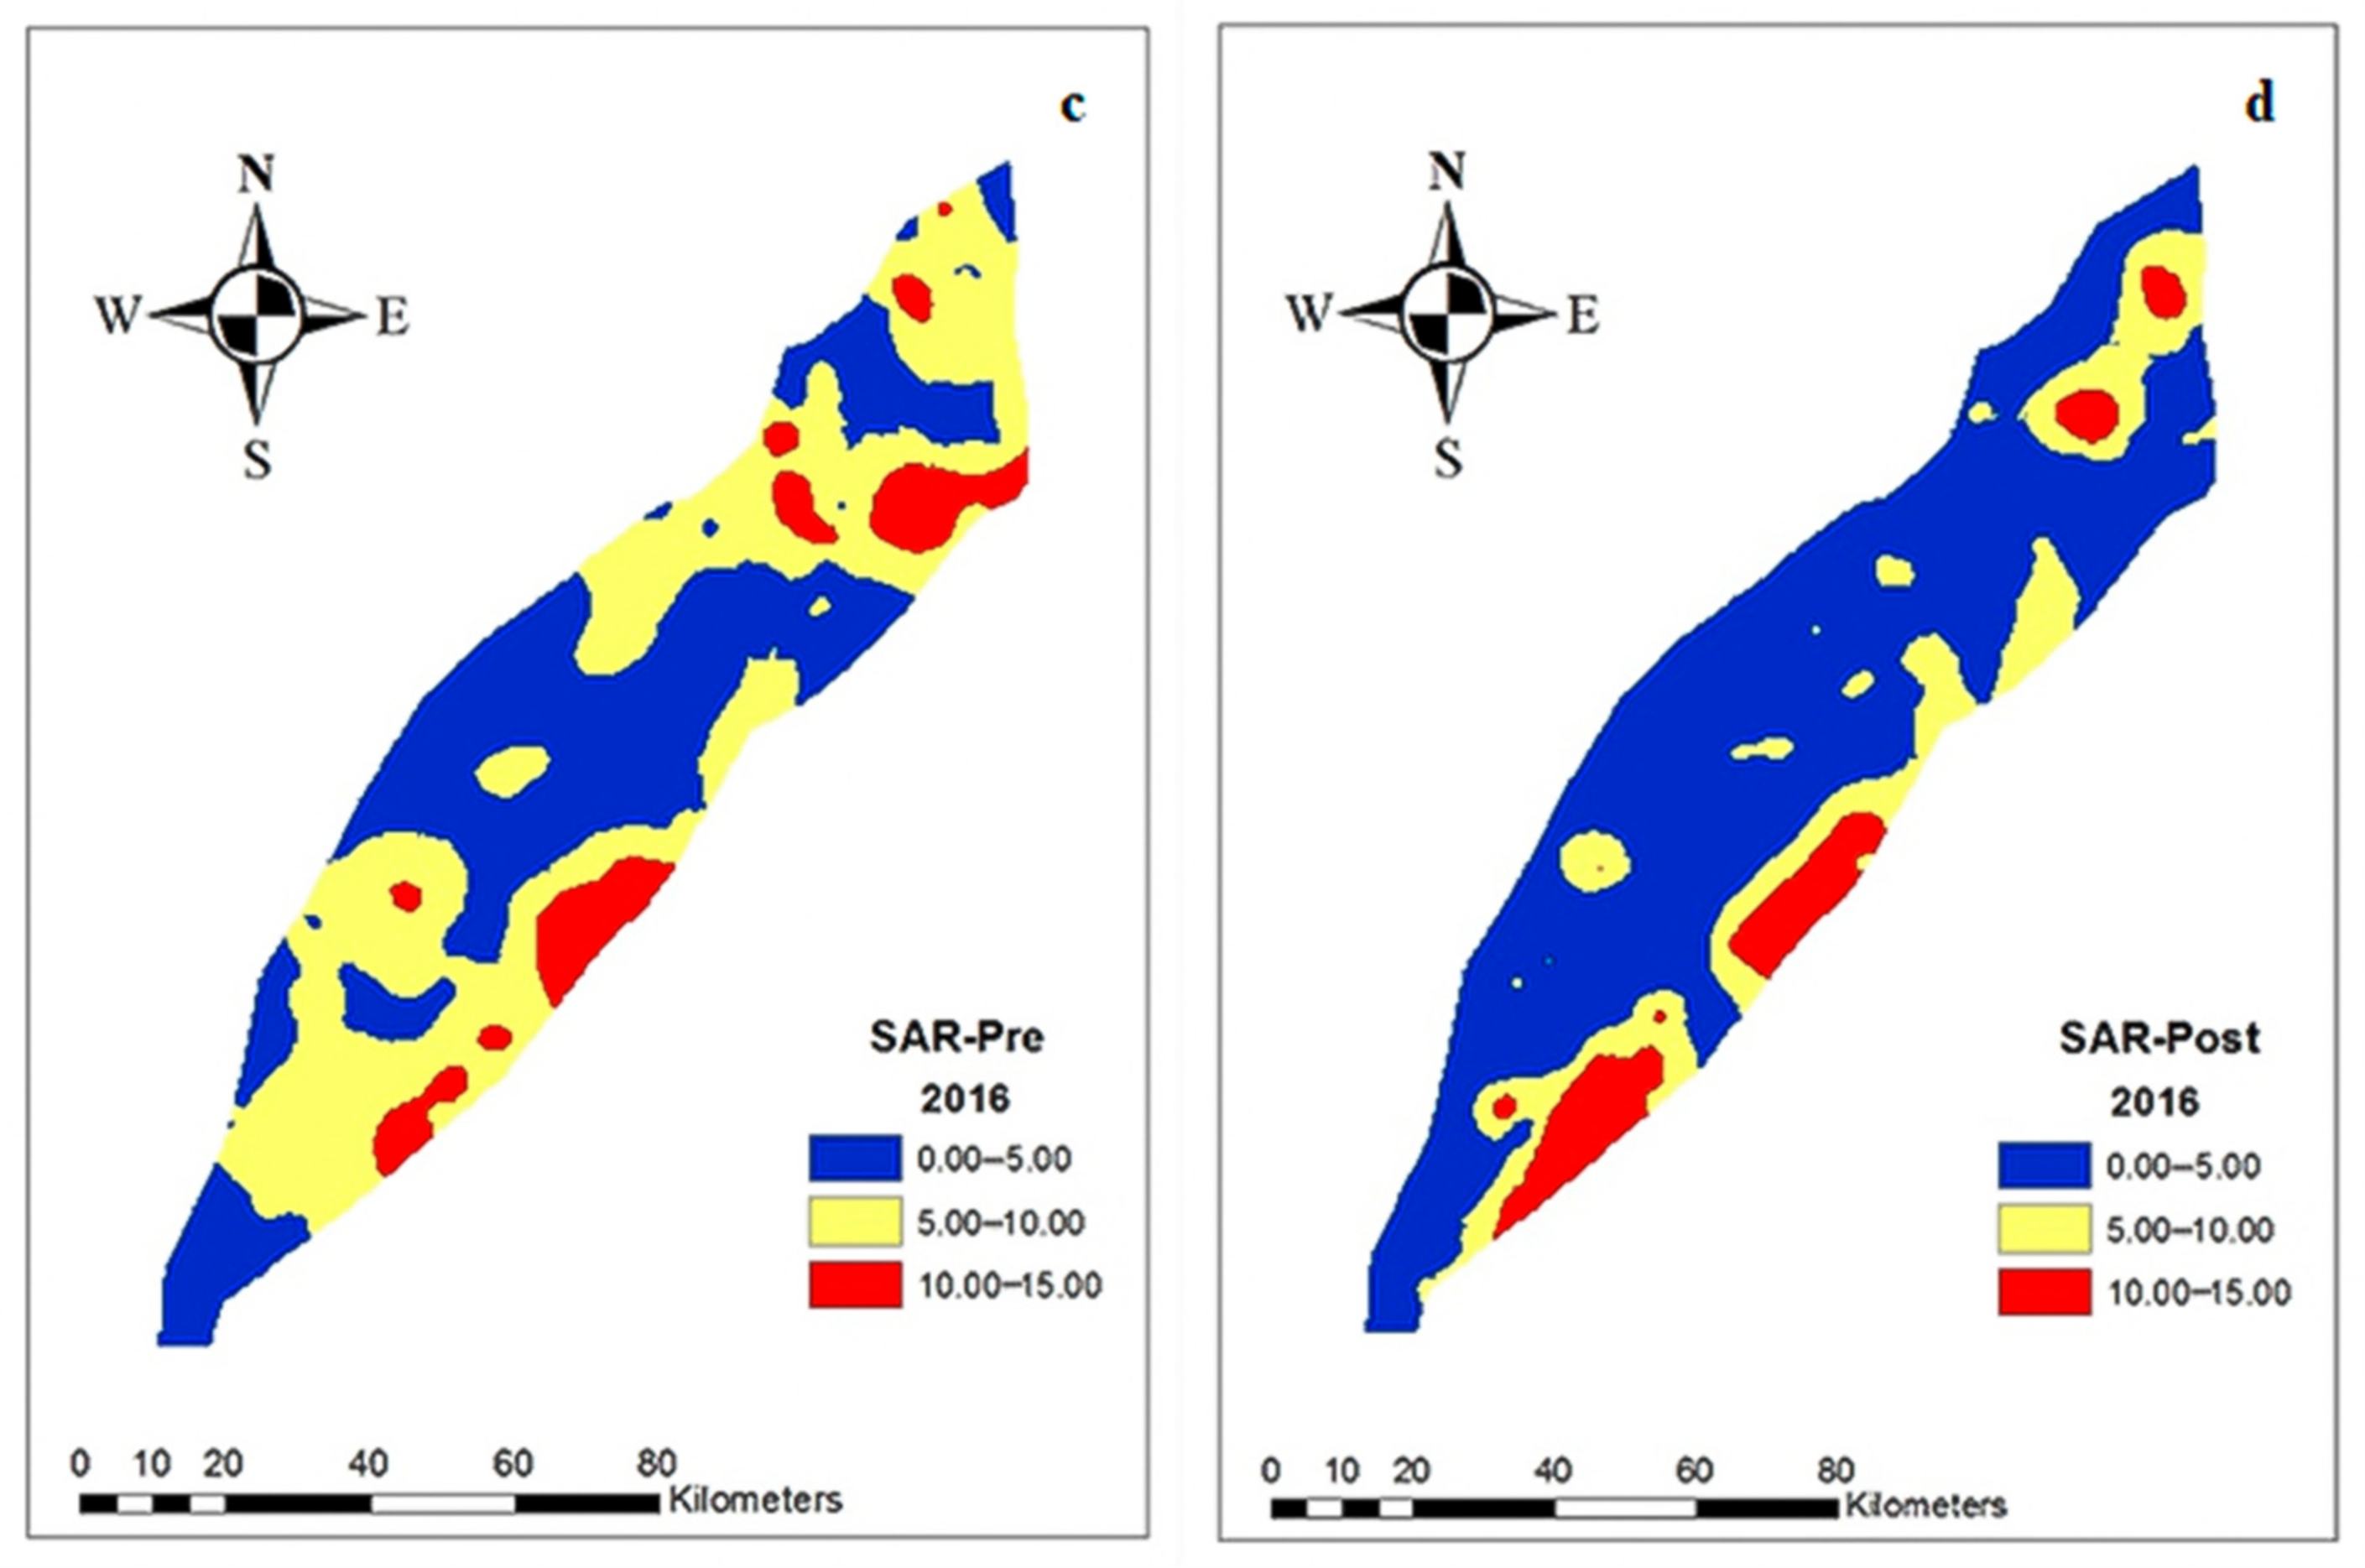
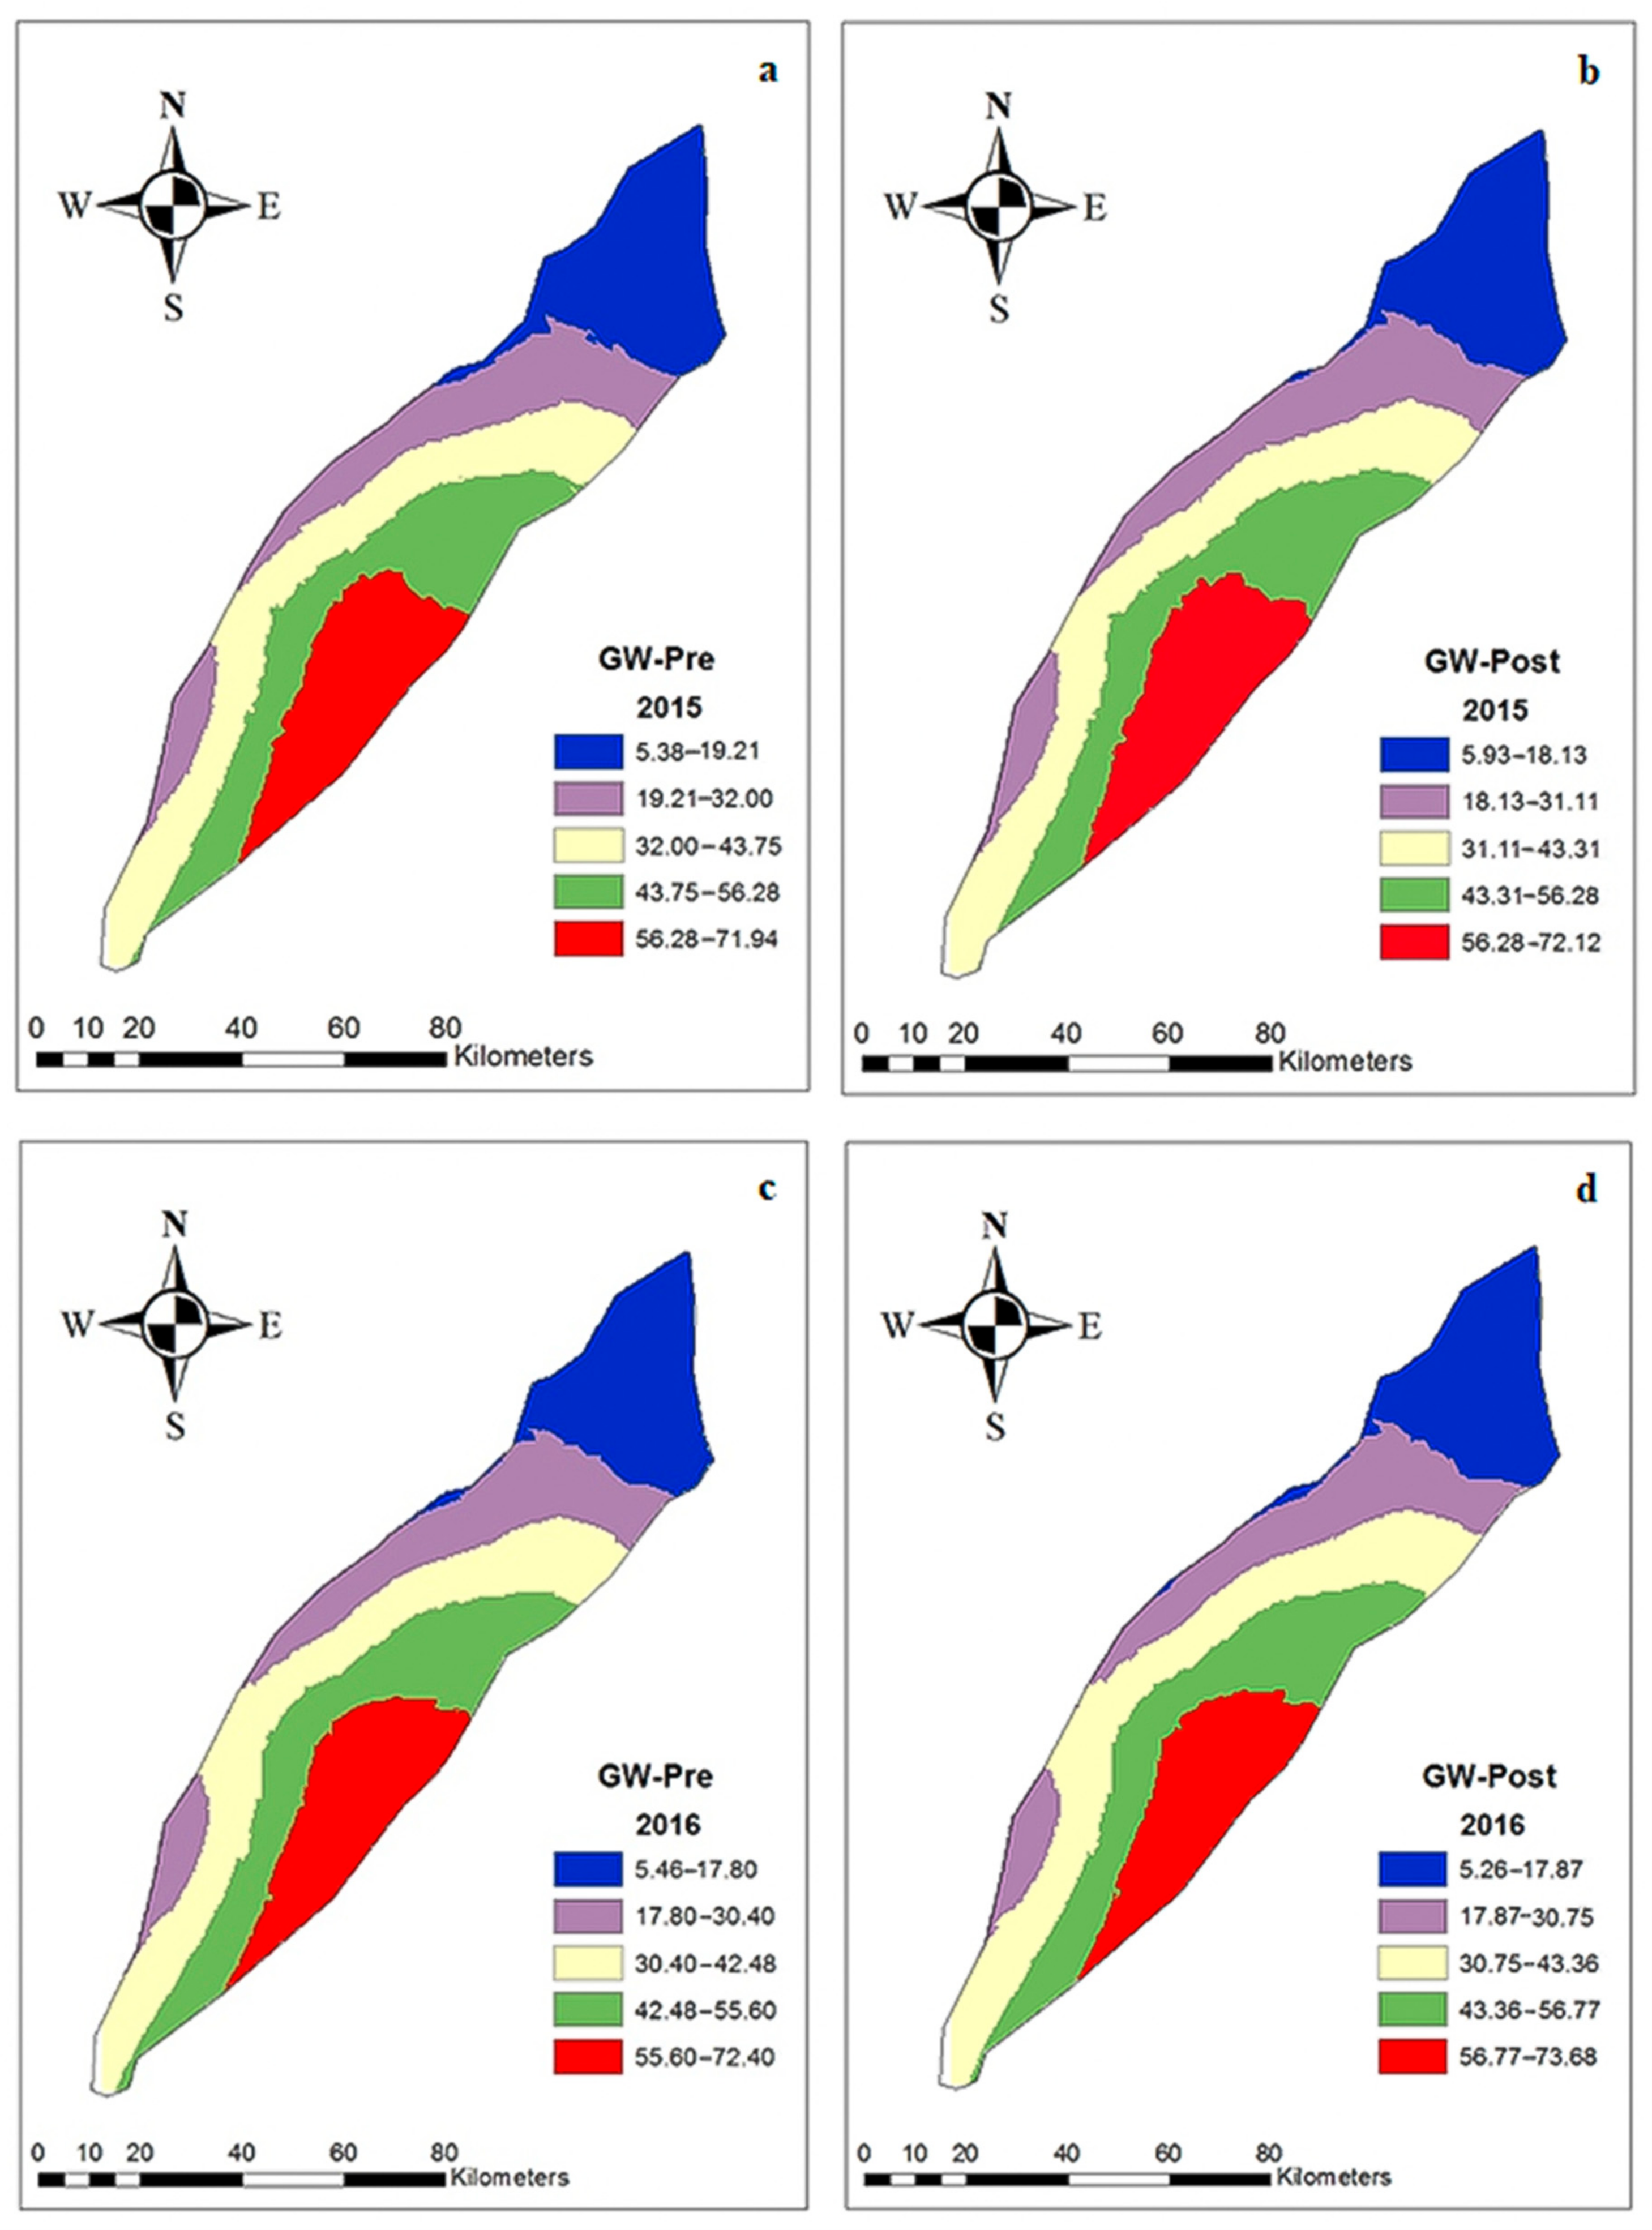
3.3. Spatial Distribution of Groundwater Quality Parameters

The spatial distribution of groundwater EC for pre-monsoon season in 2015 indicated that the concentration of EC was higher in the south-east zone of the study area (Figure 2a). The values of EC in this zone were ranged from 2.50 to 4.20 dS/m. A higher concentration of groundwater EC was also found in the northern side for pre-monsoon season in 2015. Similarly, the groundwater EC for the post-monsoon season in 2015 indicated that the concentration of EC was higher in the lower south-east and upper north-west zones of the study area. The lower concentration of EC was observed in the south-west, central south-east, north-west, and north-east parts of the study area and the values ranged from 0 to 1.50 dS/m, respectively (Figure 2b). The groundwater EC for the pre-monsoon season in 2016 also indicated that the concentration of EC was higher in the lower south-east zone and the northern part of the study area (Figure 2c). The groundwater EC concentration showed minor changes in the area, as a higher concentration of groundwater EC was observed in the lower south-east and upper north-east zones (Figure 2d). However, the lower south-east part of the study area continuously showed higher concentration of groundwater EC for both seasons and years. The higher concentration of groundwater EC in that part may be due to the over-abstraction of groundwater. As a result of excessive groundwater extraction, fractured rocks and shales dissolve in the water, which increases the salinity level [48]. Furthermore, the salts tend to accumulate due to strong evaporation in arid and semi-arid areas and consequently, high salinity groundwater forms so that the roots of plants cannot absorb enough water to meet their metabolic requirements [49,50,51].
Apart from the spatial distribution analysis, overlay analysis was also conducted to analyze the combined effect of the groundwater properties for both seasons. In 2015, the overlay analysis for EC indicated that the lower portion of the south-east zone had a higher concentration of EC in the pre-monsoon and post monsoon seasons. The growth of the high regulation spatial model, GIS, and remote sensing has increased the need for map comparison. The importance of map comparison methods has been recognized and has stimulated growing interest among different researchers [52,53,54].
The value of EC in this zone was greater than 4.20 dS/m for both the seasons of 2015. The lower concentration of groundwater EC was analyzed in the central south-east and south-west parts of the study area for both seasons of 2015 (Figure 3a). In 2016, the overlay analysis for EC indicated that the lower portion in the south-east and south-west sides had a higher concentration of EC in both seasons (Figure 3b). The area of lower concentration of EC slightly increased in the post-monsoon season as compared to the pre-monsoon season. This indicated that the recharge of freshwater increases in the post-monsoon season from the Chenab river flows and precipitation because more than 60% of the annual rainfall occurred during the post-monsoon season in this region [27,55].
The spatial distribution of groundwater RSC for pre-monsoon season in 2015 indicated that the concentration of RSC was higher in the upper north-east zone of the study area (Figure 4a). Similarly, the groundwater RSC for the post-monsoon season in 2015 indicated that concentration of RSC was higher in the upper north-east and central south-east and south-west parts of the study area (Figure 4b). The groundwater RSC for pre-monsoon season in 2016 also indicated that the concentration of RSC in groundwater was higher in the upper north-east and central south-east zones of the study area (Figure 4c). Similarly, the groundwater RSC for the post-monsoon season in 2016 indicated that the concentration of RSC was higher in the upper north-east and central south-east parts of the study area and the values of RSC in that zone ranged from 1.50 to 4.20 meq/l (Figure 4d). In 2015, the overlay analysis for RSC indicated that the upper part of the north-east zone had a higher concentration of RSC in the pre-monsoon and post-monsoon season. The value of RSC in this zone was greater than 4.20 meq/l for both seasons (Figure 5a). Similarly, in 2016, the overlay analysis for RSC indicated that the upper north-east zone had a higher concentration of RSC in both seasons (Figure 5b).
The SAR in groundwater evaluates the effect of the sodium hazard with calcium and magnesium concentrations [56]. The spatial distribution of groundwater SAR for the post-monsoon season in 2015 indicated that concentration of SAR, ranging from 5.0 to 10.0, was marginally higher in the upper north-east and lower south-east parts of the study area (Figure 6a). The spatial distribution of groundwater SAR for pre-monsoon season in 2015 indicated that concentration of SAR was lower in the central south-east and south-west parts of the study area and the values ranged from 0 to 5.00 (Figure 6b). It has been reported that seasonal variation affects the groundwater SAR, which can reduce the soil permeability and thus inhibit the absorption of water by crops [57].
The lower concentration of SAR was observed mainly in the central south-east and south-west parts of the study area (Figure 6a). The spatial distribution of groundwater SAR for the pre-monsoon season in 2016 also indicated that the concentration of SAR was higher in the upper north-east and lower south-east parts of the study area (Figure 6c). Higher SAR values in groundwater make soil unfit for plant growth due to a loss of soil permeability. Sodium reduces soil permeability and encourages hardening of the soil. On the other hand, the lower groundwater SAR concentration was observed for the post-monsoon season in 2016 in the upper north-west, north-west, and lower south-west parts of the study area (Figure 6d).
In 2015, the overlay analysis for SAR indicated that the upper part of the north-east and lower south-east and south-west zones had a higher concentration of SAR mainly in pre-monsoon season (Figure 7a). In 2016, the overlay analysis for SAR indicated that the upper north-east zone had a higher concentration of SAR in both the seasons, and the value of SAR in this zone was greater than 15 (Figure 7b). The spatial distribution of groundwater level (GWL) for the pre-monsoon season in 2015 indicated that GWL was high over the lower south-east part of the study area (Figure 8a,b).
It has been reported that with the increase in groundwater level, the osmotic and buoyancy pressure produced by the soil increases to a certain extent. This means that the soil bears a certain additional load within a certain range, resulting in the discharge of pore water from the soil, a reduction in pore water pressure, increase in effective stress, and consolidation and compaction of strata [58]. The GWL for pre-monsoon and post-monsoon seasons in 2016 also indicated that GWL was high in the lower south-east part of the study area. Moreover, the results for the upper north-east part of the study area also indicate that GWL was lower in this zone for both the seasons of 2016 (Figure 8c,d).
In 2015, the overlay analysis for GWL indicated that in the lower south-east part, the groundwater had greater depth in the pre-monsoon and post-monsoon seasons (Figure 9a). Similarly, the GWL results in 2016 indicated that in the lower south-east part, the groundwater had greater depth in pre-monsoon and post-monsoon seasons (Figure 9b). The overall analysis indicated that water quality in the lower south-east part of the study area is deteriorating and unfit for irrigation without possible treatment before its direct application to agricultural lands. The results indicate that potential management measures are needed to ameliorate these impacts, including decreasing groundwater pumping or implementing the activities of groundwater recharge in the region. In order to further reduce the deterioration of groundwater quality and to protect groundwater resources, urgent groundwater management practices are required in the rest of the region.

4. Conclusions

The present study described the integrated use of statistical, GIS, geostatistical, and map overlay approaches for investigating the spatio-temporal variation in groundwater quality and level using the data of 242 monitoring wells in Punjab, Pakistan during the pre-monsoon and post-monsoon seasons of the years 2015 and 2016. The results show that CV values for all the groundwater parameters were greater than 84% for both the seasons (pre-monsoon and post-monsoon) and over the years. The annual comparison for groundwater parameters indicated that the groundwater EC followed a decreasing trend over the years with a 0.05 level of significance. However, groundwater RSC, SAR, and GWL indicated increasing trends over the year, with t-state values of 1.324, 0.291 and 0.504, respectively. However, marginal improvements in groundwater electrical conductivity (EC), sodium absorption ratio (SAR), and residual sodium carbonate (RSC), and a decrease in groundwater level (GWL), were observed in 2016 as compared to 2015 (p = 0.05). The results also indicate that the data of groundwater parameters were spatially autocorrelated over the years. The nugget to sill ratios in 2015 for post EC, post-SAR, pre-RSC, post-RSC, pre-GWL, and post-GWL were 13.86%, 12.52%, 15.57%, 13.40%, 7.71% and 8.10%, respectively, which indicates strong spatial dependence. The nugget to sill ratios in 2016 for post-EC, pre-SAR, post-SAR, post-RSC, pre-GWL and post-GWL were 0.03%, 21.60%, 6.84%, 6.33%, 6.61% and 6.38%, respectively, which also indicates strong spatial dependence. The spatial distribution analysis of groundwater EC, SAR, and RSC indicated that the groundwater quality was unfit for irrigation in the lower south-east part of the study area. The groundwater level (GWL) was also higher in that part of the study area during the pre-monsoon and post-monsoon seasons in 2015 and 2016. The overlay analysis also indicated that the groundwater EC, RSC and GWL values were higher in the south-east parts of the study area during pre-monsoon and post-monsoon seasons of 2015 and 2016. The higher values of these parameters in groundwater seem to be due to the simultaneous contribution of natural mineralization, the use of unpurified irrigation water, and anthropogenic inputs. Hence, there is an instant need to apply groundwater management practices in the rest of the region (especially in the lower south-east part) to overcome the future degradation of groundwater quality. The research findings of the present research study provide guidelines for the potential management of groundwater resources in relation to seasonal variation in other regions.

Author Contributions

Conceptualization, H.U.F., M.N.A., I.A., and A.G.; methodology, H.S., and H.U.F.; software, H.S., H.U.F., and M.N.A.; formal analysis, H.S., H.U.F., and M.N.A.; data curation, I.A., M.A., and P.S. writing—original draft preparation, H.S., and H.U.F.; writing—review and editing, Z.M.K., M.N.A., I.A., X.C., M.M., M.A., and A.G.; funding acquisition, A.G., and X.C. All authors have read and agreed to the published version of the manuscript.

Funding

This study was financially supported by the Strategic Priority Research Program of the Chinese -Academy of Sciences, the Pan-Third Pole Environment Study for a Green Silk Road (Grant No. XDA20060303), the National Natural Science Foundation of China (Grant No. 41950410575), the International Cooperation Project of National Natural Science Foundation of China (Grant No. 41761144079), the Xinjiang Tianchi Hundred Talents Program (Grant No.Y848041), the project of the research Center of Ecology and Environment in Central Asia (Grant No. Y934031), and the CAS PIFI fellowship (Grant No. 2021PC0002).

Acknowledgments

The authors are grateful to the Department of Land and Reclamation, Multan, for providing groundwater quality data to accomplish this research.

Conflicts of Interest

The authors declare no conflict of interest.

References

  1. Vasanthavigar, M.; Srinivasamoorthy, K.; Vijayaragavan, K.; Rajiv Ganthi, R.; Chidambaram, S.; Anandhan, P.; Manivannan, R.; Vasudevan, S. Application of water quality index for groundwater quality assessment: Thirumanimuttar sub-basin, Tamilnadu, India. Environ. Monit. Assess. 2010, 171, 595–609. [Google Scholar] [CrossRef] [PubMed]
  2. Tlili-Zrelli, B.; Gueddari, M.; Bouhlila, R. Spatial and temporal variations of water quality of mateur aquifer (Northeastern Tunisia): Suitability for irrigation and drinking purposes. J. Chem. 2018. [Google Scholar] [CrossRef]
  3. Ebrahimi, K.; Feiznia, B.S.; Jannat Rostami, C.M.; Ausati, K. Assessing Temporal and Spatial Variations of Groundwater Quality (A Case Study: Kohpayeh-Segzi); IA University: Borujerd Branch, Iran, 2011; Volume 1. [Google Scholar]
  4. Tatawat, R.K.; Chandel, C.P.S. A hydrochemical profile for assessing the groundwater quality of Jaipur City. Environ. Monit. Assess. 2008, 143, 337–343. [Google Scholar] [CrossRef]
  5. Farid, H.U.; Mahmood-Khan, Z.; Ali, A.; Mubeen, M.; Anjum, M.N. Site-specific aquifer characterization and identification of potential groundwater areas in Pakistan. Pol. J. Environ. Stud. 2017, 26. [Google Scholar] [CrossRef]
  6. Sharif, M.; Jabbar, A.; Niazi, M.A.; Mahr, A.B. Managing water availability and requirements in Pakistan: Challenges and way forward. J. Agric. Res. 2016, 54, 117–131. [Google Scholar]
  7. Basharat, M. Spatial and temporal appraisal of groundwater depth and quality in LBDC command-issue. Pak. J. Eng. Appl. Sci. 2012, 11, 14–29. [Google Scholar]
  8. Zhou, Y.; Wang, Y.; Li, Y.; Zwahlen, F.; Boillat, J. Hydrogeochemical characteristics of central Jianghan Plain, China. Environ. Earth Sci. 2013, 68, 765–778. [Google Scholar] [CrossRef] [Green Version]
  9. Richards, L.A.; Magnone, D.; Sovann, C.; Kong, C.; Uhlemann, S.; Kuras, O.; van Dongen, B.E.; Ballentine, C.J.; Polya, D.A. High resolution profile of inorganic aqueous geochemistry and key redox zones in an arsenic bearing aquifer in Cambodia. Sci. Total Environ. 2017, 590–591, 540–553. [Google Scholar] [CrossRef] [Green Version]
  10. Yan, S.F.; Yu, S.E.; Wu, Y.B.; Pan, D.F.; She, D.L.; Ji, J. Seasonal Variations in Groundwater Level and Salinity in Coastal Plain of Eastern China Influenced by Climate. J. Chem. 2015, 2015. [Google Scholar] [CrossRef] [Green Version]
  11. Aladejana, J.A.; Kalin, R.M.; Sentenac, P.; Hassan, I. Assessing the impact of climate change on groundwater quality of the shallow coastal aquifer of eastern dahomey basin, southwestern Nigeria. Water 2020, 12, 224. [Google Scholar] [CrossRef] [Green Version]
  12. Sauer, T.; Havlík, P.; Schneider, U.A.; Schmid, E.; Kindermann, G.; Obersteiner, M. Agriculture and resource availability in a changing world: The role of irrigation. Water Resour. Res. 2010. [Google Scholar] [CrossRef] [Green Version]
  13. Khatri, N.; Tyagi, S. Influences of natural and anthropogenic factors on surface and groundwater quality in rural and urban areas. Front. Life Sci. 2015, 8, 23–39. [Google Scholar] [CrossRef]
  14. Nema, S.; Awasthi, M.K.; Nema, R.K. Spatial and temporal ground water responses to seasonal rainfall replenishment in an alluvial aquifer. Biosci. Biotechnol. Res. Commun. 2017, 10, 431–437. [Google Scholar] [CrossRef]
  15. Tlili Zrelli, B.; Gueddari, M. Groundwater hydro-geochemistry of Mateur alluvial aquifer (Northern Tunisia). J. Hydrogeol. Hydrol. Eng. 2016. [Google Scholar] [CrossRef]
  16. Belkhiri, L.; Boudoukha, A.; Mouni, L. Amultivariate statistical analysis of groundwater chemistry data. Int. J. Environ. Res. 2011, 5, 537–544. [Google Scholar] [CrossRef]
  17. Kim, J.H.; Kim, R.H.; Lee, J.; Cheong, T.J.; Yum, B.W.; Chang, H.W. Multivariate statistical analysis to identify the major factors governing groundwater quality in the coastal area of Kimje, South Korea. Hydrol. Process. 2005. [Google Scholar] [CrossRef]
  18. Mohammadi, Z. Assessing hydrochemical evolution of groundwater in limestone terrain via principal component analysis. Environ. Earth Sci. 2009. [Google Scholar] [CrossRef]
  19. Srivastava, P.K.; Han, D.; Gupta, M.; Mukherjee, S. Integrated framework for monitoring groundwater pollution using a geographical information system and multivariate analysis. Hydrol. Sci. J. 2012. [Google Scholar] [CrossRef]
  20. Liu, J.; Zhang, X.; Xia, J.; Wu, S.; She, D.; Zou, L. Characterizing and explaining spatio-temporal variation of water quality in a highly disturbed river by multi-statistical techniques. Springerplus 2016. [Google Scholar] [CrossRef] [Green Version]
  21. Zhou, Z.; Zhang, G.; Yan, M.; Wang, J. Spatial variability of the shallow groundwater level and its chemistry characteristics in the low plain around the Bohai sea, north China. Environ. Monit. Assess. 2012, 184, 3697–3710. [Google Scholar] [CrossRef]
  22. Zhang, Q.; Singh, V.P.; Peng, J.; Chen, Y.D.; Li, J. Spatial-temporal changes of precipitation structure across the Pearl River basin, China. J. Hydrol. 2012. [Google Scholar] [CrossRef]
  23. Ağca, N. Spatial variability of groundwater quality and its suitability for drinking and irrigation in the Amik Plain (South Turkey). Environ. Earth Sci. 2014. [Google Scholar] [CrossRef]
  24. Omran, E.S.E. A proposed model to assess and map irrigation water well suitability using geospatial analysis. Water 2012, 4, 545–567. [Google Scholar] [CrossRef] [Green Version]
  25. Srivastava, P.K.; Gupta, M.; Mukherjee, S. Mapping spatial distribution of pollutants in groundwater of a tropical area of India using remote sensing and GIS. Appl. Geomat. 2012. [Google Scholar] [CrossRef]
  26. Pacheco Castro, R.; Pacheco Ávila, J.; Ye, M.; Cabrera Sansores, A. Groundwater quality: Analysis of Its temporal and spatial variability in a karst aquifer. Groundwater 2018. [Google Scholar] [CrossRef]
  27. Farid, H.U.; Ahmad, I.; Anjum, M.N.; Khan, Z.M.; Iqbal, M.M.; Shakoor, A.; Mubeen, M. Assessing seasonal and long-term changes in groundwater quality due to over-abstraction using geostatistical techniques. Environ. Earth Sci. 2019, 78, 386. [Google Scholar] [CrossRef]
  28. Yeh, H.F.; Lee, C.H.; Hsu, K.C.; Chang, P.H. GIS for the assessment of the groundwater recharge potential zone. Environ. Geol. 2009. [Google Scholar] [CrossRef]
  29. Piccini, C.; Marchetti, A.; Farina, R. Francaviglia, R. Application of indicator kriging to evaluate the probability of exceeding nitrate contamination thresholds. Int. J. Environ. Res. 2012, 6, 853–862. [Google Scholar]
  30. Kumar, P.; Herath, S.; Avtar, R.; Takeuchi, K. Mapping of groundwater potential zones in Killinochi area, Sri Lanka, using GIS and remote sensing techniques. Sustain. Water Resour. Manag. 2016. [Google Scholar] [CrossRef] [Green Version]
  31. Iqbal, Z.; Abbas, F.; Ibrahim, M.; Ayyaz, M.M.; Ali, S.; Mahmood, A. Surveillance of heavy metals in maize grown with wastewater and their impacts on animal health in peri-urban areas of multan, Pakistan. Pak. J. Agric. Sci. 2019. [Google Scholar] [CrossRef]
  32. Abbas, F.; Ahmad, A.; Safeeq, M.; Ali, S.; Saleem, F.; Hammad, H.M.; Farhad, W. Changes in precipitation extremes over arid to semiarid and subhumid Punjab, Pakistan. Theor. Appl. Climatol. 2014. [Google Scholar] [CrossRef]
  33. Shakoor, A.; Arshad, M.; Bakhsh, A.; Ahmed, R. GIS based assessment and delineation of groundwater quality zones and its impact on agricultural productivity. Pak. J. Agric. Sci. 2015, 52, 837–843. [Google Scholar]
  34. Singh, K.K.; Tewari, G.; Kumar, S.; Mancini, P.M. Evaluation of groundwater quality for suitability of irrigation purposes: A case study in the Udham Singh Nagar, Uttarakhand. J. Chem. 2020. [Google Scholar] [CrossRef]
  35. Frank, M. Eaton Significance of Carbonates in Irrigation Waters: Soil Science. Available online: https://journals.lww.com/soilsci/Citation/1950/02000/Significance_of_Carbonates_in_Irrigation_Waters.4.aspx (accessed on 29 November 2020).
  36. Popugaeva, D.; Kreyman, K.; Ray, A.K. Assessment of Khibiny Alkaline Massif groundwater quality using statistical methods and water quality index. Can. J. Chem. Eng. 2020, 98, 205–212. [Google Scholar] [CrossRef] [Green Version]
  37. Rossi, R.E.; Dungan, J.L.; Beck, L.R. Kriging in the shadows: Geostatistical interpolation for remote sensing. Remote Sens. Environ. 1994. [Google Scholar] [CrossRef]
  38. Chabala, L.M.; Mulolwa, A.; Lungu, O. Application of ordinary kriging in mapping soil organic carbon in Zambia. Pedosphere 2017, 27, 338–343. [Google Scholar] [CrossRef]
  39. Gia Pham, T.; Kappas, M.; Van Huynh, C.; Hoang Khanh Nguyen, L. Application of ordinary kriging and regression kriging method for soil properties mapping in hilly region of central Vietnam. ISPRS Int. J. Geo-Inf. 2019, 8, 147. [Google Scholar] [CrossRef] [Green Version]
  40. Mehrjardi, R.T.; Jahromi, M.Z.; Heidari, A. Spatial distribution of groundwater quality with geostatistics (Case study: Yazd-ardakan plain). Appl. Sci. 2008, 4, 9–17. [Google Scholar]
  41. Al-Omran, A.M.; Aly, A.A.; Al-Wabel, M.I.; Al-Shayaa, M.S.; Sallam, A.S.; Nadeem, M.E. Geostatistical methods in evaluating spatial variability of groundwater quality in Al-Kharj Region, Saudi Arabia. Appl. Water Sci. 2017, 7, 4013–4023. [Google Scholar] [CrossRef] [Green Version]
  42. Zhang, H.; Zhuang, S.; Qian, H.; Wang, F.; Ji, H. Spatial Variability of the Topsoil Organic Carbon in the Moso Bamboo Forests of Southern China in Association with Soil Properties. PLoS ONE 2015, 10, e0119175. [Google Scholar] [CrossRef]
  43. Sharma, P.; Sood, S.; Duggirala, G. Seasonal Variation of Groundwater Quality in Rural Areas of Jaipur District, Rajasthan. Indian J. Sci. Technol. 2017. [Google Scholar] [CrossRef] [Green Version]
  44. Bui, D.D.; Kawamura, A.; Tong, T.N.; Amaguchi, H.; Nakagawa, N. Spatio-temporal analysis of recent groundwater-level trends in the Red River Delta, Vietnam. Hydrogeol. J. 2012. [Google Scholar] [CrossRef]
  45. Rehman, F.; Cheema, T.; Lisa, M.; Azeem, T.; Ali, N.A.; Khan, Z.; Rehman, F.; Rehman, S.U. Statistical analysis tools for the assessment of groundwater chemical variations in wadi bani malik area, Saudi Arabia. Glob. Nest J. 2018. [Google Scholar] [CrossRef] [Green Version]
  46. Srinivasamoorthy, K.; Vasanthavigar, M.; Vijayaraghavan, K.; Sarathidasan, R.; Gopinath, S. Hydrochemistry of groundwater in a coastal region of Cuddalore district, Tamilnadu, India: Implication for quality assessment. Arab. J. Geosci. 2013, 6, 441–454. [Google Scholar] [CrossRef]
  47. Ploum, S.; Laudon, H.; Peralta-Tapia, A.; Kuglerová, L. Are hydrological pathways and variability in groundwater chemistry linked in the riparian boreal forest? Hydrol. Earth Syst. Sci. Discuss. 2019. [Google Scholar] [CrossRef] [Green Version]
  48. Mabrouk, M.; Jonoski, A.; Essink, G.H.P.O.; Uhlenbrook, S. Assessing the fresh-saline groundwater distribution in the Nile delta aquifer using a 3D variable-density groundwater flow model. Water 2019, 11, 1946. [Google Scholar] [CrossRef] [Green Version]
  49. Chen, L.; Feng, Q. Geostatistical analysis of temporal and spatial variations in groundwater levels and quality in the Minqin oasis, Northwest China. Environ. Earth Sci. 2013. [Google Scholar] [CrossRef]
  50. Chen, J.; Huang, Q.; Lin, Y.; Fang, Y.; Qian, H.; Liu, R.; Ma, H. Hydrogeochemical characteristics and quality assessment of groundwater in an irrigated region, Northwest China. Water 2019, 11, 96. [Google Scholar] [CrossRef] [Green Version]
  51. Xu, P.; Feng, W.; Qian, H.; Zhang, Q. Hydrogeochemical characterization and irrigation quality assessment of shallow groundwater in the central-Western Guanzhong basin, China. Int. J. Environ. Res. Public Health 2019, 16, 1492. [Google Scholar] [CrossRef] [Green Version]
  52. Visser, H.; De Nijs, T. The map comparison kit. Environ. Model. Softw. 2006, 21, 346–358. [Google Scholar] [CrossRef]
  53. Pontius, R.G.; Huffaker, D.; Denman, K. Useful techniques of validation for spatially explicit land-change models. Ecol. Modell. 2004, 179, 445–461. [Google Scholar] [CrossRef]
  54. Levine, R.S.; Yorita, K.L.; Walsh, M.C.; Reynolds, M.G. A method for statistically comparing spatial distribution maps. Int. J. Health Geogr. 2009, 8, 7. [Google Scholar] [CrossRef] [Green Version]
  55. Faisal, N.; Jameel, A.; Cheema, S.B.; Ghuffar, A.; Mahmood, A.; Rasul, G. Third successive active monsoon over Pakistan—An analysis and diagnostic study of monsoon 2012. Pak. J. Meteorol. 2013, 9, 73–84. [Google Scholar]
  56. Li, H.; Lu, Y.; Zheng, C.; Zhang, X.; Zhou, B.; Wu, J. Seasonal and inter-annual variability of groundwater and their responses to climate change and human activities in arid and desert areas: A case study in Yaoba Oasis, Northwest China. Water 2020, 12, 303. [Google Scholar] [CrossRef] [Green Version]
  57. Tahmasebi, P.; Mahmudy-Gharaie, M.H.; Ghassemzadeh, F.; Karimi Karouyeh, A. Assessment of groundwater suitability for irrigation in a gold mine surrounding area, NE Iran. Environ. Earth Sci. 2018. [Google Scholar] [CrossRef]
  58. Yang, J.; Cao, G.; Han, D.; Yuan, H.; Hu, Y.; Shi, P.; Chen, Y. Deformation of the aquifer system under groundwater level fluctuations and its implication for land subsidence control in the Tianjin coastal region. Environ. Monit. Assess. 2019. [Google Scholar] [CrossRef]
Figure 1. Location of study area and sampling points.
Water 12 03555 g001
Figure 2. Spatial distribution of groundwater EC (dS/m) (a) for pre-monsoon season in 2015 (b) for post-monsoon season in 2015 (c) for pre-monsoon season in 2016 (d) for pre-monsoon season in 2016.
Water 12 03555 g002
Figure 3. Overlay analysis of groundwater EC in pre-monsoon and post-monsoon season. (a) EC for 2015 and (b) EC for 2016.
Water 12 03555 g003
Figure 4. Spatial distribution of groundwater RSC (meql/l) (a) for pre-monsoon season in 2015 (b) for post-monsoon season in 2015 (c) for pre-monsoon season in 2016 (d) for pre-monsoon season in 2016.
Water 12 03555 g004
Figure 5. Overlay analysis of groundwater RSC. (a) RSC for 2015, (b) RSC for 2016.
Water 12 03555 g005
Figure 6. Spatial distribution of groundwater SAR (a) for post-monsoon season in 2015 (b) for pre-monsoon season in 2015 (c) for pre-monsoon season in 2016 (d) for pre-monsoon season in 2016.
Water 12 03555 g006aWater 12 03555 g006b
Figure 7. Overlay analysis of groundwater SAR. (a) SAR for 2015, (b) SAR for 2016.
Water 12 03555 g007
Figure 8. Spatial distribution of groundwater level (GWL) (a,b) in 2015 and (c,d) in 2016 for pre monsoon and post monsoon.
Water 12 03555 g008
Figure 9. Overlay analysis of groundwater level. (a) GWL for 2015 (b) GWL for 2016.
Water 12 03555 g009
Table 1. The statistical summary of groundwater properties in 2015 (n = 242).
SeasonsParametersUnitsMinMaxMeanMedianCV (%)Skewness
Pre-monsoonEC PredS/m0.319.101.460.85115.773.19
SAR Pre-0.0224.114.913.8884.971.89
RSC Premeq/l0.007.800.760.00170.432.00
GWL Prem1.5877.0822.0629.9179.740.30
Post-monsoonEC PostdS/m0.3717.501.590.95135.344.46
SAR Post-0.1523.654.463.5192.972.11
RSC Postmeq/l0.004.600.680.00175.221.69
GWL Postm1.5878.0021.1430.7598.290.28
SD standard deviation, CV coefficient of variation.
Table 2. The statistical summary of groundwater properties in 2016 (n = 242).
SeasonsParametersUnitsMinMaxMeanMedianCV (%)Skewness
Pre-monsoonECdS/m0.3610.81.500.94115.753.19
SAR-0.1928.885.504.4286.981.98
RSCmeq/l0.007.000.700.00174.801.96
GWLm1.7575.7519.1228.25103.350.33
Post-monsoonECdS/m0.298.801.410.85110.712.73
SAR-0.0240.004.102.50118.363.52
RSCmeq/l0.007.300.480.00224.193.36
GWLm1.6676.5817.8226.79112.470.43
SD standard deviation, CV coefficient of variation.
Table 3. Inequality analysis of means for groundwater quality and level.
ParametersSeasonal Comparison
(2015)
Seasonal Comparison
(2016)
ParametersAnnual Comparison
Meant-StatMeant-StatMeant-Stat
Pre-EC1.49−0.887 *1.570.901 *2015-EC1.56−0.206 *
Post-EC1.651.432016-EC1.59
Pre-SAR5.011.032 *5.723.5772015-SAR4.800.291 *
Post-SAR4.624.142016-SAR4.69
Pre-RSC0.780.623 *0.732.3242015-RSC0.751.324 *
Post-RSC0.710.492016-RSC0.62
Pre-GWL22.600.165 *19.51−0.128 *2015-GWL22.100.504 *
Post-GWL21.0220.862016-GWL20.68
* Significant at p = 0.05; electrical conductivity (EC) (dS/m); residual sodium carbonate (RSC) (meq/L); groundwater level (GWL) (m); pre (pre-monsoon season); post (post-monsoon season).
Table 4. Spearman’s rank correlation matrix for groundwater quality parameters.
Boring DepthDischargeScreen LengthPre-ECPre-SARPre-RSCPost-ECPost-SARPost-RSC
Boring depth1.000
Discharge0.372 **1.000
Screen length0.473 **−0.0661.000
Pre-EC0.0720.0430.1141.000
Pre-SAR0.0900.0360.1050.783 **1.000
Pre-RSC−0.043−0.029−0.0310.1170.416 **1.000
Post-EC0.177 **0.1010.165 *0.930 **0.744 **0.0421.000
Post-SAR0.136 *0.0510.1080.729 **0.810 **0.395 **0.711 **1.000
Post-RSC−0.046−0.066−0.0150.0790.360 **0.842 **0.0520.451 **1.000
Boring depth1.000
Discharge0.372 **1.000
Screen length0.473 **−0.0661.000
Pre-EC0.140 *0.0820.1151.000
Pre-SAR0.0590.0520.0320.768 **1.000
Pre-RSC−0.081−0.078−0.0340.0820.457 **1.000
Post-EC0.235 **0.1170.195 **0.403 **0.297 **−0.0031.000
Post-SAR0.142 *0.0630.148 *0.363 **0.261 **−0.0620.783 **1.000
Post-RSC−0.0390.0580.0140.0290.0360.109−0.0690.242 **1.000
EC (dS/m); RSC (meq/L); GWL (m); ** Significant at = 0.05; * Significant at = 0.01; pre (pre-monsoon season); post (post-monsoon season).
Table 5. Fitted semi-variogram model of groundwater properties in 2015 and 2016.
YearsSeasonsParameterModelRangeC0C0 + CC0/(C0 + C) × 100R2
2015Pre-monsoonECSpherical0.3541.5273.05549.980.793
SARSpherical0.2678.16017.91045.560.441
RSCExponential0.1470.2651.70115.570.537
GWLGaussian1.18665.00842.507.710.971
Post-monsoonECExponential0.1770.6804.90313.860.592
SARExponential0.1832.22017.72012.520.422
RSCExponential0.1320.1901.41713.400.800
GWLGaussian1.17272.00888.608.100.973
2016Pre-monsoonECSpherical0.2891.3723.18443.090.771
SARExponential0.2225.18023.98021.600.689
RSCExponential0.5790.8441.68949.970.938
GWLGaussian1.08651.00771.006.610.954
Post-monsoonECExponential0.3390.0012.6900.030.858
SARExponential0.3541.76025.7006.840.782
RSCSpherical0.1140.0761.2006.330.571
GWLGaussian0.97848.00752.006.380.938
C0 Nugget Variance; C0 + C Sill Variance; EC (dS/m); RSC (meq/L); GWL (m).
Publisher’s Note: MDPI stays neutral with regard to jurisdictional claims in published maps and institutional affiliations.

