1. Introduction
Lakes are interfaces between the various layers of the earth’s surface system and an important component of the terrestrial hydrosphere [
1]. They play a vital role in human activities and ecosystem services such as fresh water supply and river runoff regulation [
2]. In terms of sustainable development goals, actions to achieve the sustainability of lakes (reservoirs) are positively linked to the sustainable development goals of the ecological environment [
3]. Lakes are sensitive to climate change and human activities, therefore they can be used as indicators of various factors in environmental change. Lakes distributed all over the world can be used as indicators of global climate change in many different geographic conditions and climate regions. Long-term monitoring and mapping of lakes (reservoirs) in different regions can provide reliable evidence for climate change and can also further deepen the understanding of changes in regional water resources and the impact on the ecological environment.
Lakes (reservoirs) are extremely sensitive to climatic fluctuations, important carriers of information that reveal global climate changes and regional responses, and recorders of the climatic environment [
4,
5]. Although the impact of climate change on inland water bodies is global, the impact is different in different regions. In recent years, domestic and foreign scholars have carried out various studies on the temporal and spatial changes that occur in lakes in different regions and the relationship between these changes and climate change. Because of warmer air temperatures, which allow higher evaporation, as the world’s largest surface freshwater system, the total area of the Great Lakes of North America experienced a continuous decrease from the 1980s to 2005 [
6]; China’s total lake area increased by 9% in the decades from 1960 to 2015, and climatic factors played a leading role in this increase [
7]. Statistical analysis showed that climate is the most important factor controlling lake changes in places such as the Qinghai-Tibet Plateau, Mongolian Plateau and the arid area of Northwest China [
8,
9]: we found extensive lake expansion on the Tibetan Plateau during 1970–2013, due to increased precipitation and cryo-spheric contributions to its water balance [
10]. In sharp contrast, the neighboring Mongolian plateau lakes have shrunk sharply because the two adjacent plateaus have responded in opposite directions to climate change [
11]. The environment is fragile in the arid areas of Northwest China. In mountainous areas with a small population, the number and area of lakes have increased due to melting glaciers and increased precipitation, but in densely populated areas lakes have decreased by 40% since 2000 [
12].
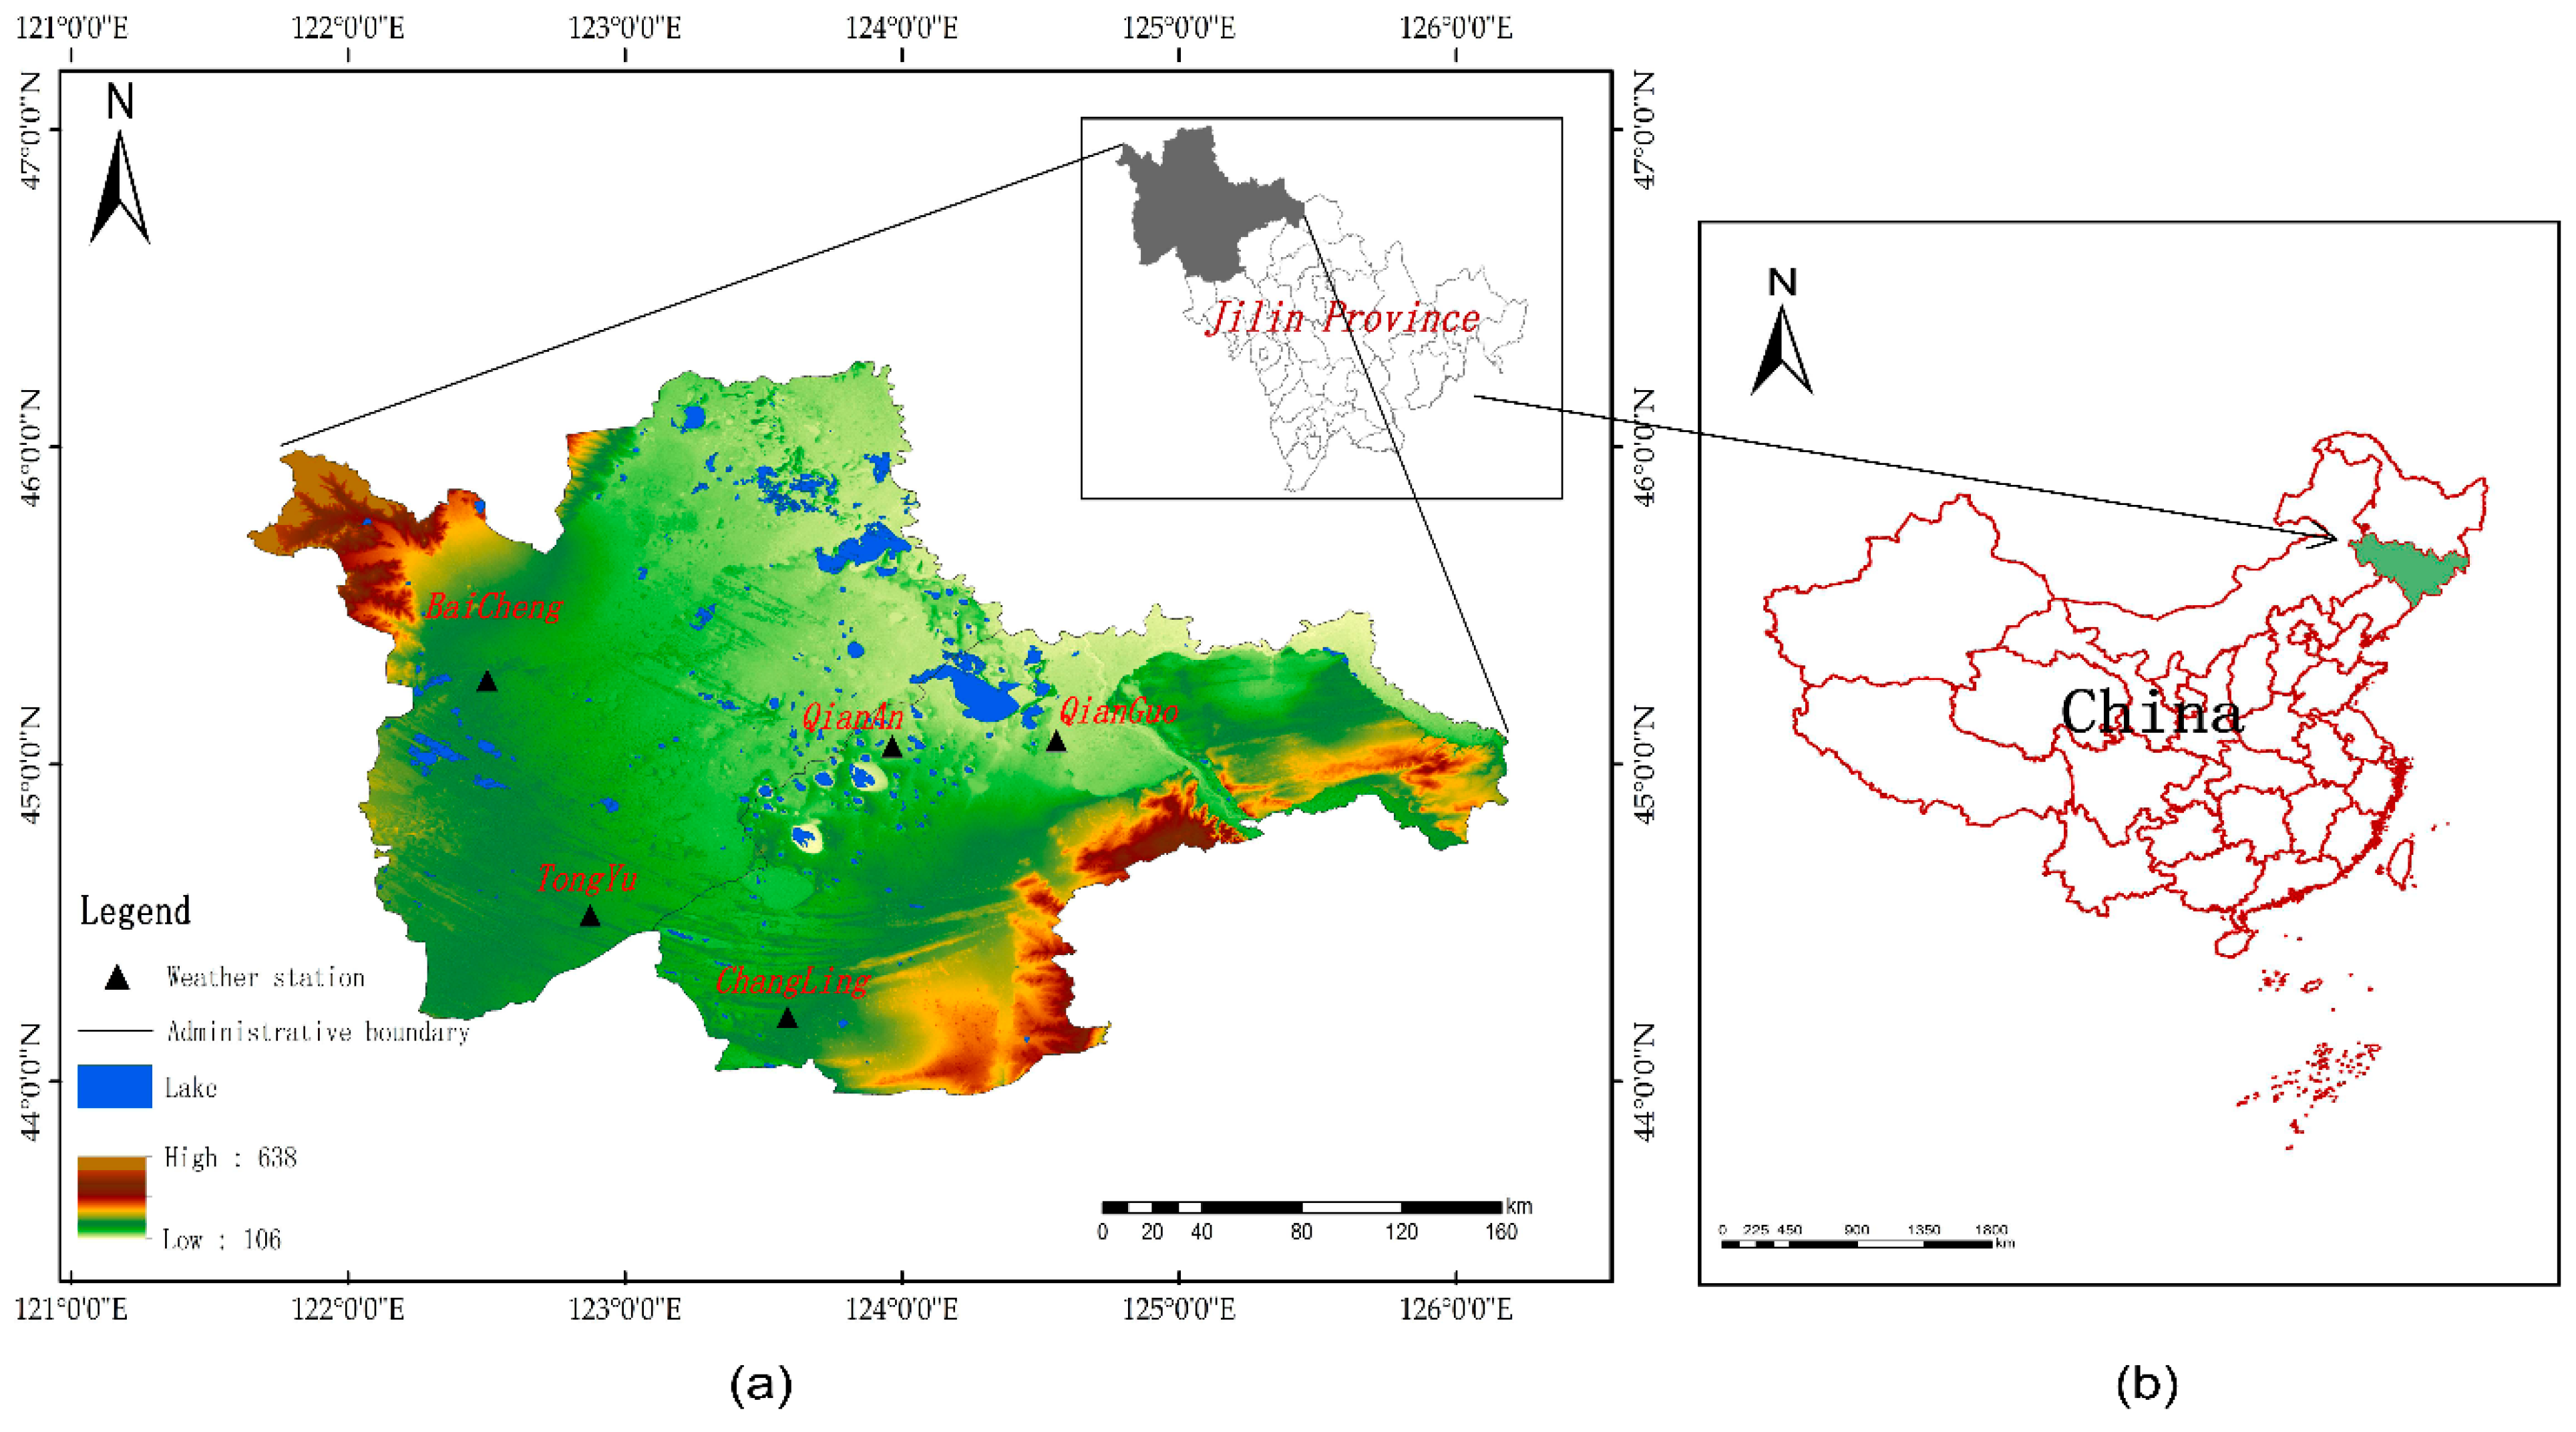
A concentrated distribution area of saline-alkali soil is a typical fragile ecological environment. Due to low precipitation and high evaporation in these areas, salt in water bodies tends to accumulate on the surface of the soil, which intensifies salinization. Saline-alkali soils are widely distributed; from cold zones to temperate and tropical zones, from America to Europe, Asia, and Australia, there are a large number of salty, dry, barren saline-alkali lands worldwide. Water resources play an important role in the balance of the local ecosystem. In recent decades, research on saline-alkali areas has mostly focused on the physical and chemical properties of soil in saline-alkali areas and the migration of chemical components in groundwater. Few studies have been conducted on changes in lakes (reservoirs) in saline areas. Studying the response relationship between lakes in saline-alkali areas and climate change can provide a more in-depth understanding of the impact mechanism of climate change on freshwater resources in ecologically fragile areas and enrich knowledge of the characteristics of the climate change response of lakes in different types of region around the world. China’s saline-alkali land area ranks third in the world, mainly distributed in 17 provinces, including Northwest, Northeast, and North China, as well as coastal regions. Among them, the Songnen Plain in Northeast China is one of the three major soda saline-alkali areas in the world. Studying the relationship between lakes and climate change in this area also provides scientific examples for international saline-alkali area and water resources management. This plain is a large continental sedimentary area of the Mesozoic and Cenozoic. As a result, many lakes of different sizes have developed. They are mainly distributed in areas where the terrain is relatively low and flat, and surface runoff and groundwater flow are relatively slow or easy to collect. They have the characteristics of small lake areas: a gentle lake basin slope, shallow lake water, and high salinity. This paper selected the most typical southwestern part of the Songnen Plain as the study area. There are more than 700 lakes in the area, and except for a few large lakes such as Chagan Lake and Moon Lake, most of them are small and medium-sized shallow lakes. They are widely distributed, complex in shape, and of many types, and they are prone to drastic changes and have even disappeared and reappeared repeatedly over the years. Therefore, analyzing the relationship between the temporal and spatial dynamic characteristics of lakes in this area and climate response is the basis for understanding the current status and changing trends of the ecological environment in saline-alkali areas, and also provides an important reference for the study of global climate change and global environmental changes.
The advantages of satellite remote sensing technology for earth observations include a large instantaneous coverage area and the ability to repeat observations periodically and update data rapidly [
13]. This technology is widely used in the monitoring of dynamic changes in lakes [
14,
15], the extraction of lake water information [
16,
17], etc. For example, Chen et al. [
18] used Landsat and moderate-resolution imaging spectroradiometer (MODIS) data with a spatiotemporal adaptive fusion model (STAFFN) to provide a 15-year spatiotemporal change monitoring map of the Poyang Lake wetland; Li et al. [
19] derived a time series of the surface area of major lakes in the Xinjiang Uygur Autonomous Region of China based on an 8-day MODIS time series with a resolution of 500 m from 2000 to 2014. Forsythe et al. [
20] studied lake area and water level changes in Lake Mead, at the junction of five states in the western United States, from 1972 to 2009 based on Landsat images and obtained high-precision results. With the increasing automation of lake information extraction, the analysis of lake temporal and spatial dynamics has gradually developed from qualitative to quantitative [
21]. Currently, widely used extraction methods include the visual interpretation method [
22], the multi-band spectrum relationship method [
23], the normalized difference water index (NDWI) method [
24], the object-oriented method [
25], and many others [
26,
27,
28,
29]. In view of the fact that each method has its own advantages, disadvantages and scope of application, in actual research it is necessary to select the best method based on the characteristics of the research object.
The present study uses remote sensing and geographic information technology to analyze dynamic changes in lakes in the study area over the past 30 years, extract lake area and quantity change parameters, and analyze the trends and distribution characteristics of lake increases and decreases. Based on the analysis of climate change characteristics, quantification reveals the response relationship between lake change and climate change. This research will help improve our understanding of regional responses to climate change, as it is essential to realize sustainable development of lakes (reservoirs) and environmental protection of resources.
3. Results and Discussion
3.1. Temporal and Spatial Changes in the Number and Area of Lakes
The study area is dominated by natural lakes that are characterized by their wide distribution, small areas, shallow basins, and complex shapes. During the 30 years from 1985 to 2015, the number of lakes in the area decreased from 278 to 207, and the total lake area decreased from 1542.89 km2 to 1276.04 km2. The overall regional lake (reservoir) resources showed a shrinking trend.
In order to reveal the change in lakes of different sizes, the lakes were divided into categories according to their areas: smaller than 1 km
2, 1–10 km
2, 10–50 km
2, and larger than 50 km
2, and the area and number of lakes of different sizes were statistically analyzed (
Figure 2). There were only two lakes with an area greater than 50 km
2: Chagan Lake and Moon Lake. These two lakes are located in the northeast of the study area, and their areas accounted for 25.04%–39.36% of the total lake area in the region. When the number of lakes in this area was shrinking, the number of lakes in the 1–10 km
2 category decreased the most, with a total decrease of 67; the distribution of these small lakes was relatively scattered. Meanwhile, the number of lakes less than 1 km
2 in area increased by 35 in 30 years, most of which were around Chagan Lake and far away from rivers. Through the comparative analysis of 30-year lake area data, it was not difficult to find that most of the increase in the number of lakes less than 1 km
2 was due to the shrinkage of lakes with an area of 1–10 km
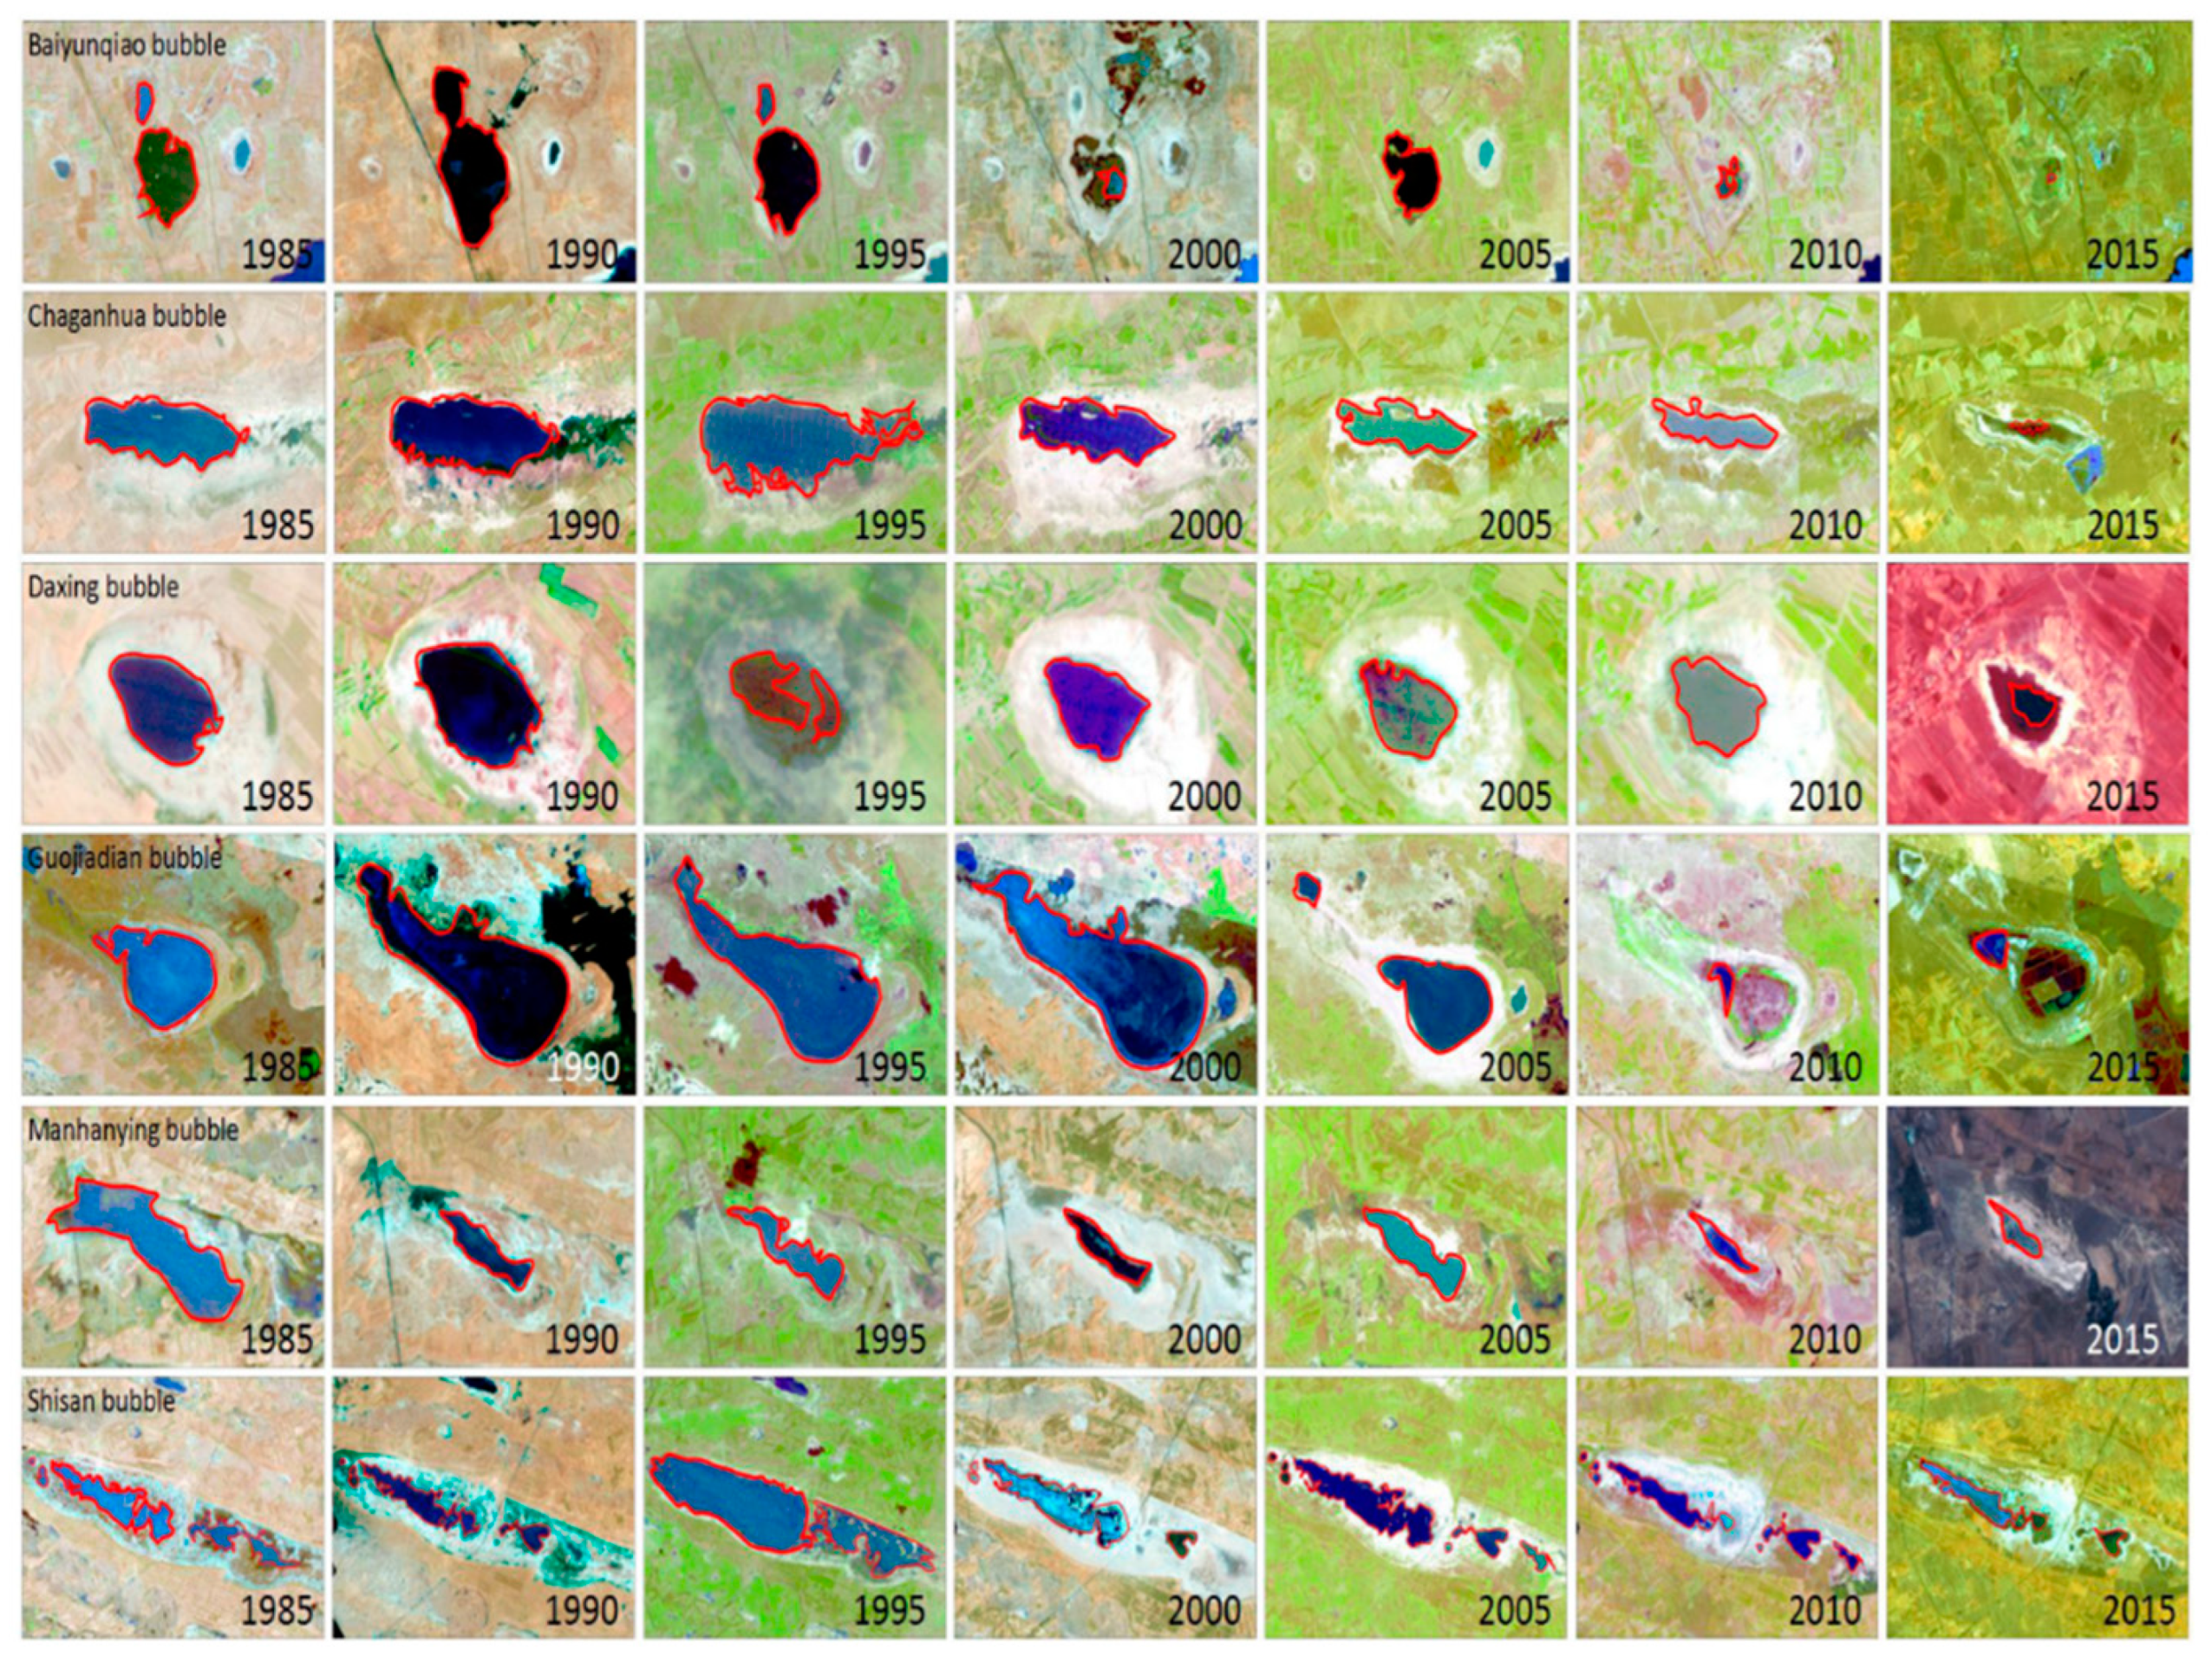
2. Most of these lakes are closed-flow due to poor drainage channels. At the same time, the soil and groundwater in this area were highly salinized, and there was widespread saline-alkali farmland and grassland. The strong evaporation often caused the salt in the lakes to be concentrated and the salinity is high, resulting in saline-alkali soil developed in a concentric ring on the edge of the lakes (
Figure 3). This indicated that many natural lakes in the area were soda-salt lakes, and due to poor connectivity and lack of replenishment the small lakes in the area were significantly degraded.
We spatially expressed the lakes that were added or disappeared in the study area from 1985 to 2015 (
Figure 4a). The results showed that almost all of the lakes that formed and disappeared in this area were small lakes with areas of ≤1 km
2 and 1–10 km
2. Between 2000–2015, medium-sized lakes with areas larger than 10 km
2 but smaller than 50 km
2 had formed or disappeared. Between 1985 and 1990, a particularly large number of lakes disappeared. In this period, 26 lakes of 1–10 km
2 disappeared, 9 lakes smaller than 1 km
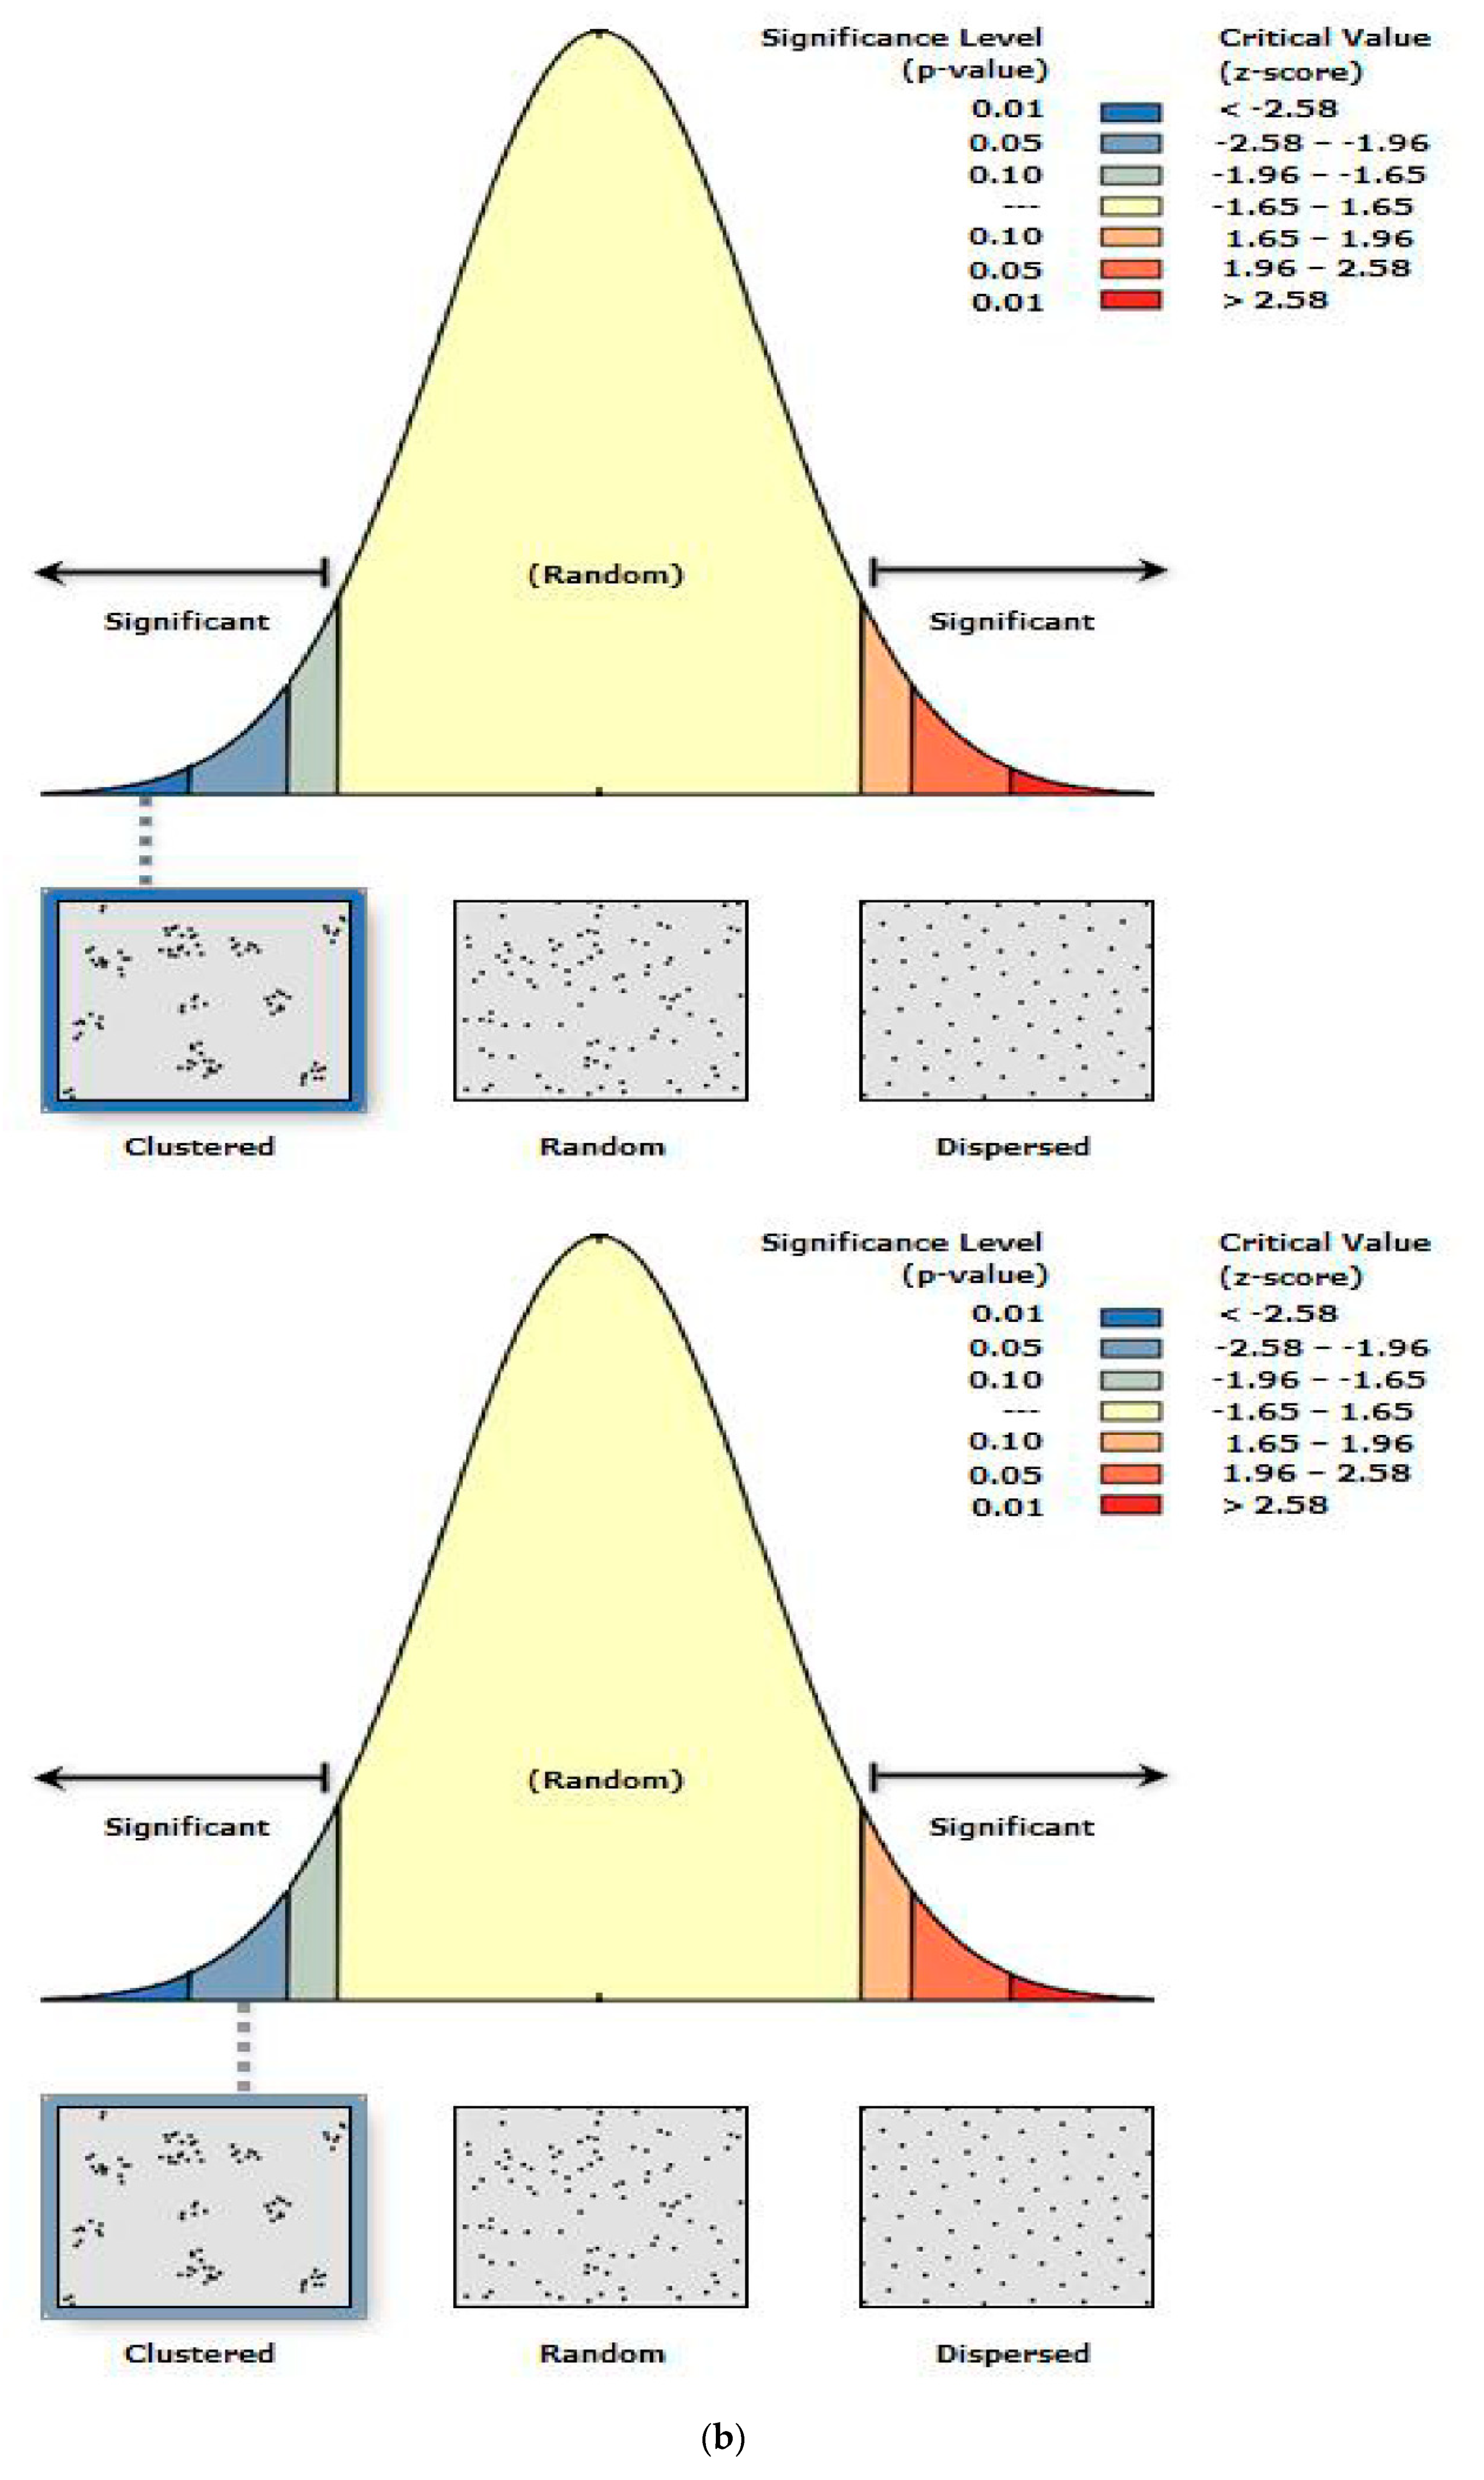
2 disappeared, and only four new lakes were formed. Lakes in the study shrunk severely during this period. Then, from 1990 to 1995, the lakes recovered; 37 new lakes were formed and only 11 disappeared, the smallest number in any period in the past 30 years. Throughout these two time periods (1985–1990 and 1990–1995), the number of lakes that formed and disappeared was very similar; most lake formation actually represented recovery of lakes that had previously disappeared. We used ArcGIS software to do a cluster analysis of the disappeared and newly formed lakes during these periods. The analysis showed that only the areas where lakes had increased and decreased from 1985 to 1995 showed a significant cluster distribution (
Figure 4b), and the cluster center was located in the northeastern plain area of the study area, surrounding two main lakes: Chagan Lake and Moon Lake. During this period, the degree of salinization of the land increased, which was the main cause of lake changes. After 1995, the increase and decrease of lakes showed a random pattern and no longer had regularity. This may be related to the intensification of human activities in the area resulting in the complexity of lake changes. From 1990 to 1995, the number of newly formed lakes of ≤1 km
2 accounted for the majority of lakes, indicating that the area of lakes that had disappeared and reappeared had reduced. From 1995 to 2000, lakes disappeared the most severely, reaching a 30-year peak in disappearance. In this period, a total of 73 lakes disappeared and only seven new ones formed. The lakes recovered somewhat from 2000 to 2005, but did not return to their previous state, and disappearance continued. Lakes again severely shrank in 2010, then recovered in 2015. In recent years, this area has been identified as the main area for increasing grain production and is an ecological economic planning area, and a series of key projects such as “river-lake connection” have been implemented, which has contributed to the ecological restoration of lakes.
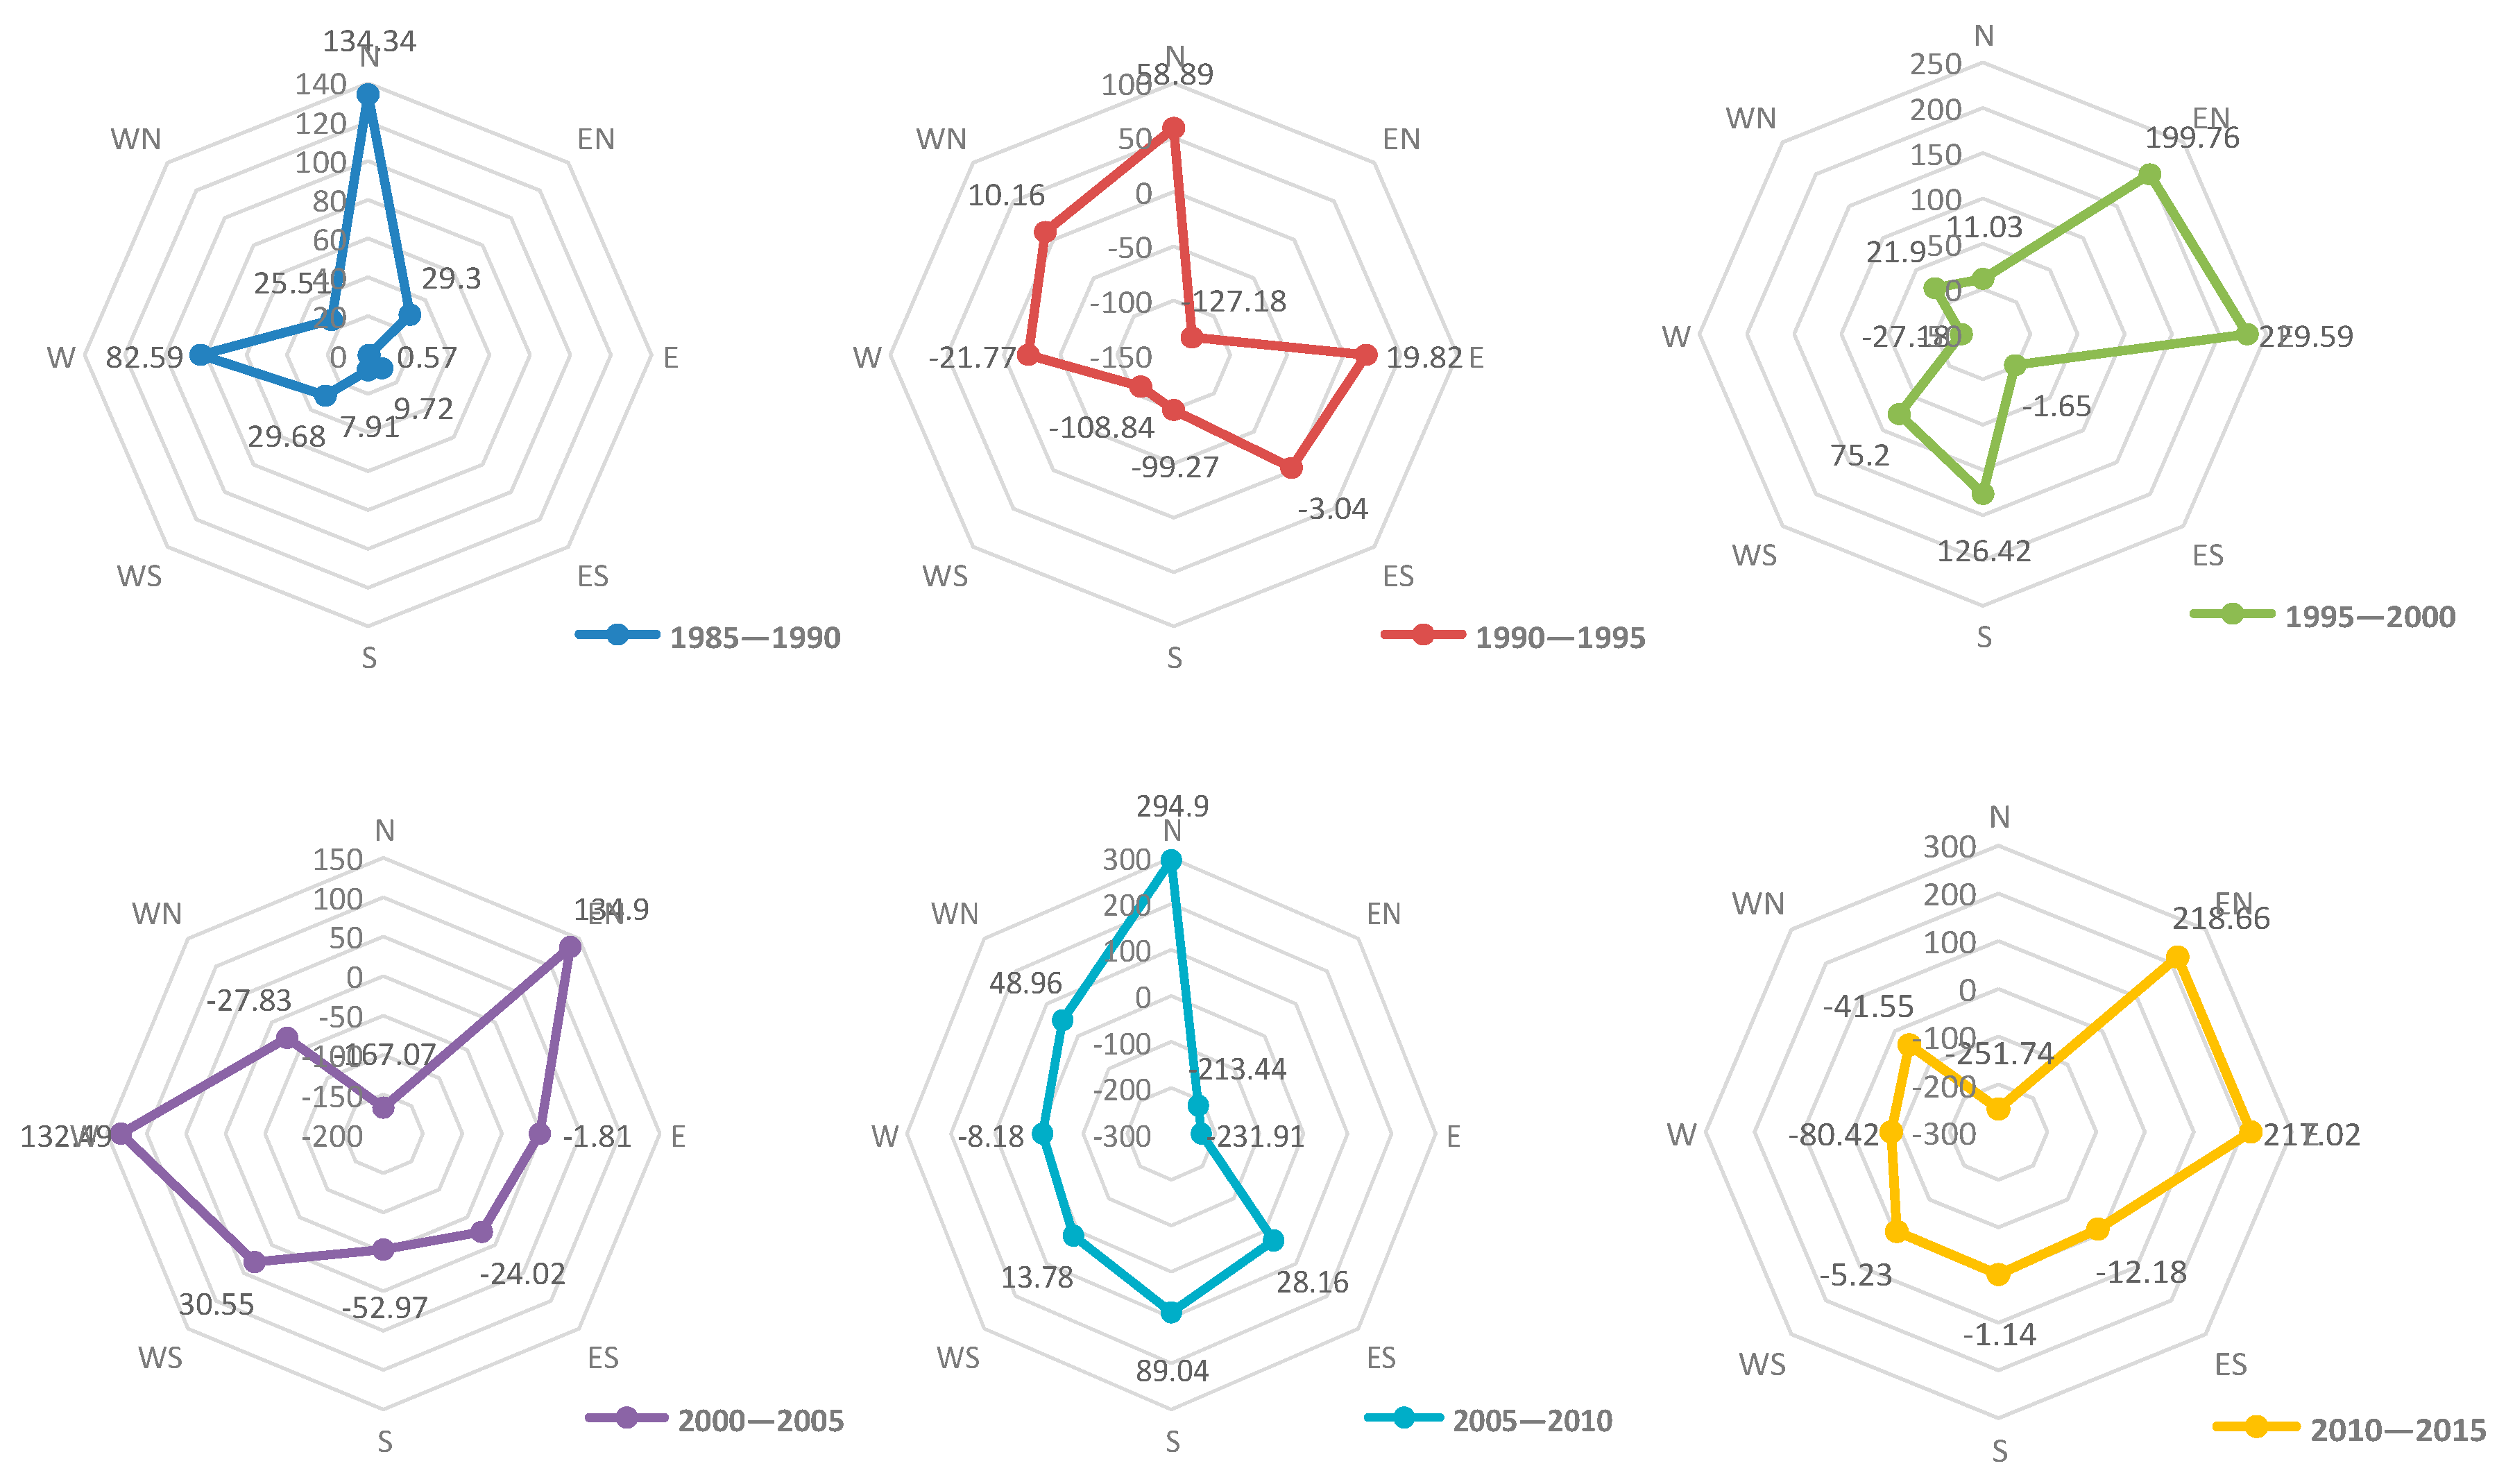
The next step is to study the spatial differentiation of shrinkage of lakes in the study area, and shrinkage in eight quadrants in the study area from 1985 to 2015 was obtained through statistical calculations (
Figure 5). In terms of the overall change trend over the past 30 years, the total area of lakes has reduced by 772.40 km
2 in the six periods. The reduction in lake area was most severe in the northeast, followed by the east, north, west, south, northwest, southwest, and southeast. The northeast and the east of the study area are plain areas with lower elevations; there are large areas of saline-alkali land around lakes and marshes, where the reduction in lake area was 242.00 km
2 and 233.27 km
2, respectively. Although the lake area in the southeast increased, the increase was not large, and lakes in this part of the study area are still at risk of shrinking.
3.2. Climate Change Trends
Assessing the impact of climate change on lake area is of great significance for water resource management and ecological protection [
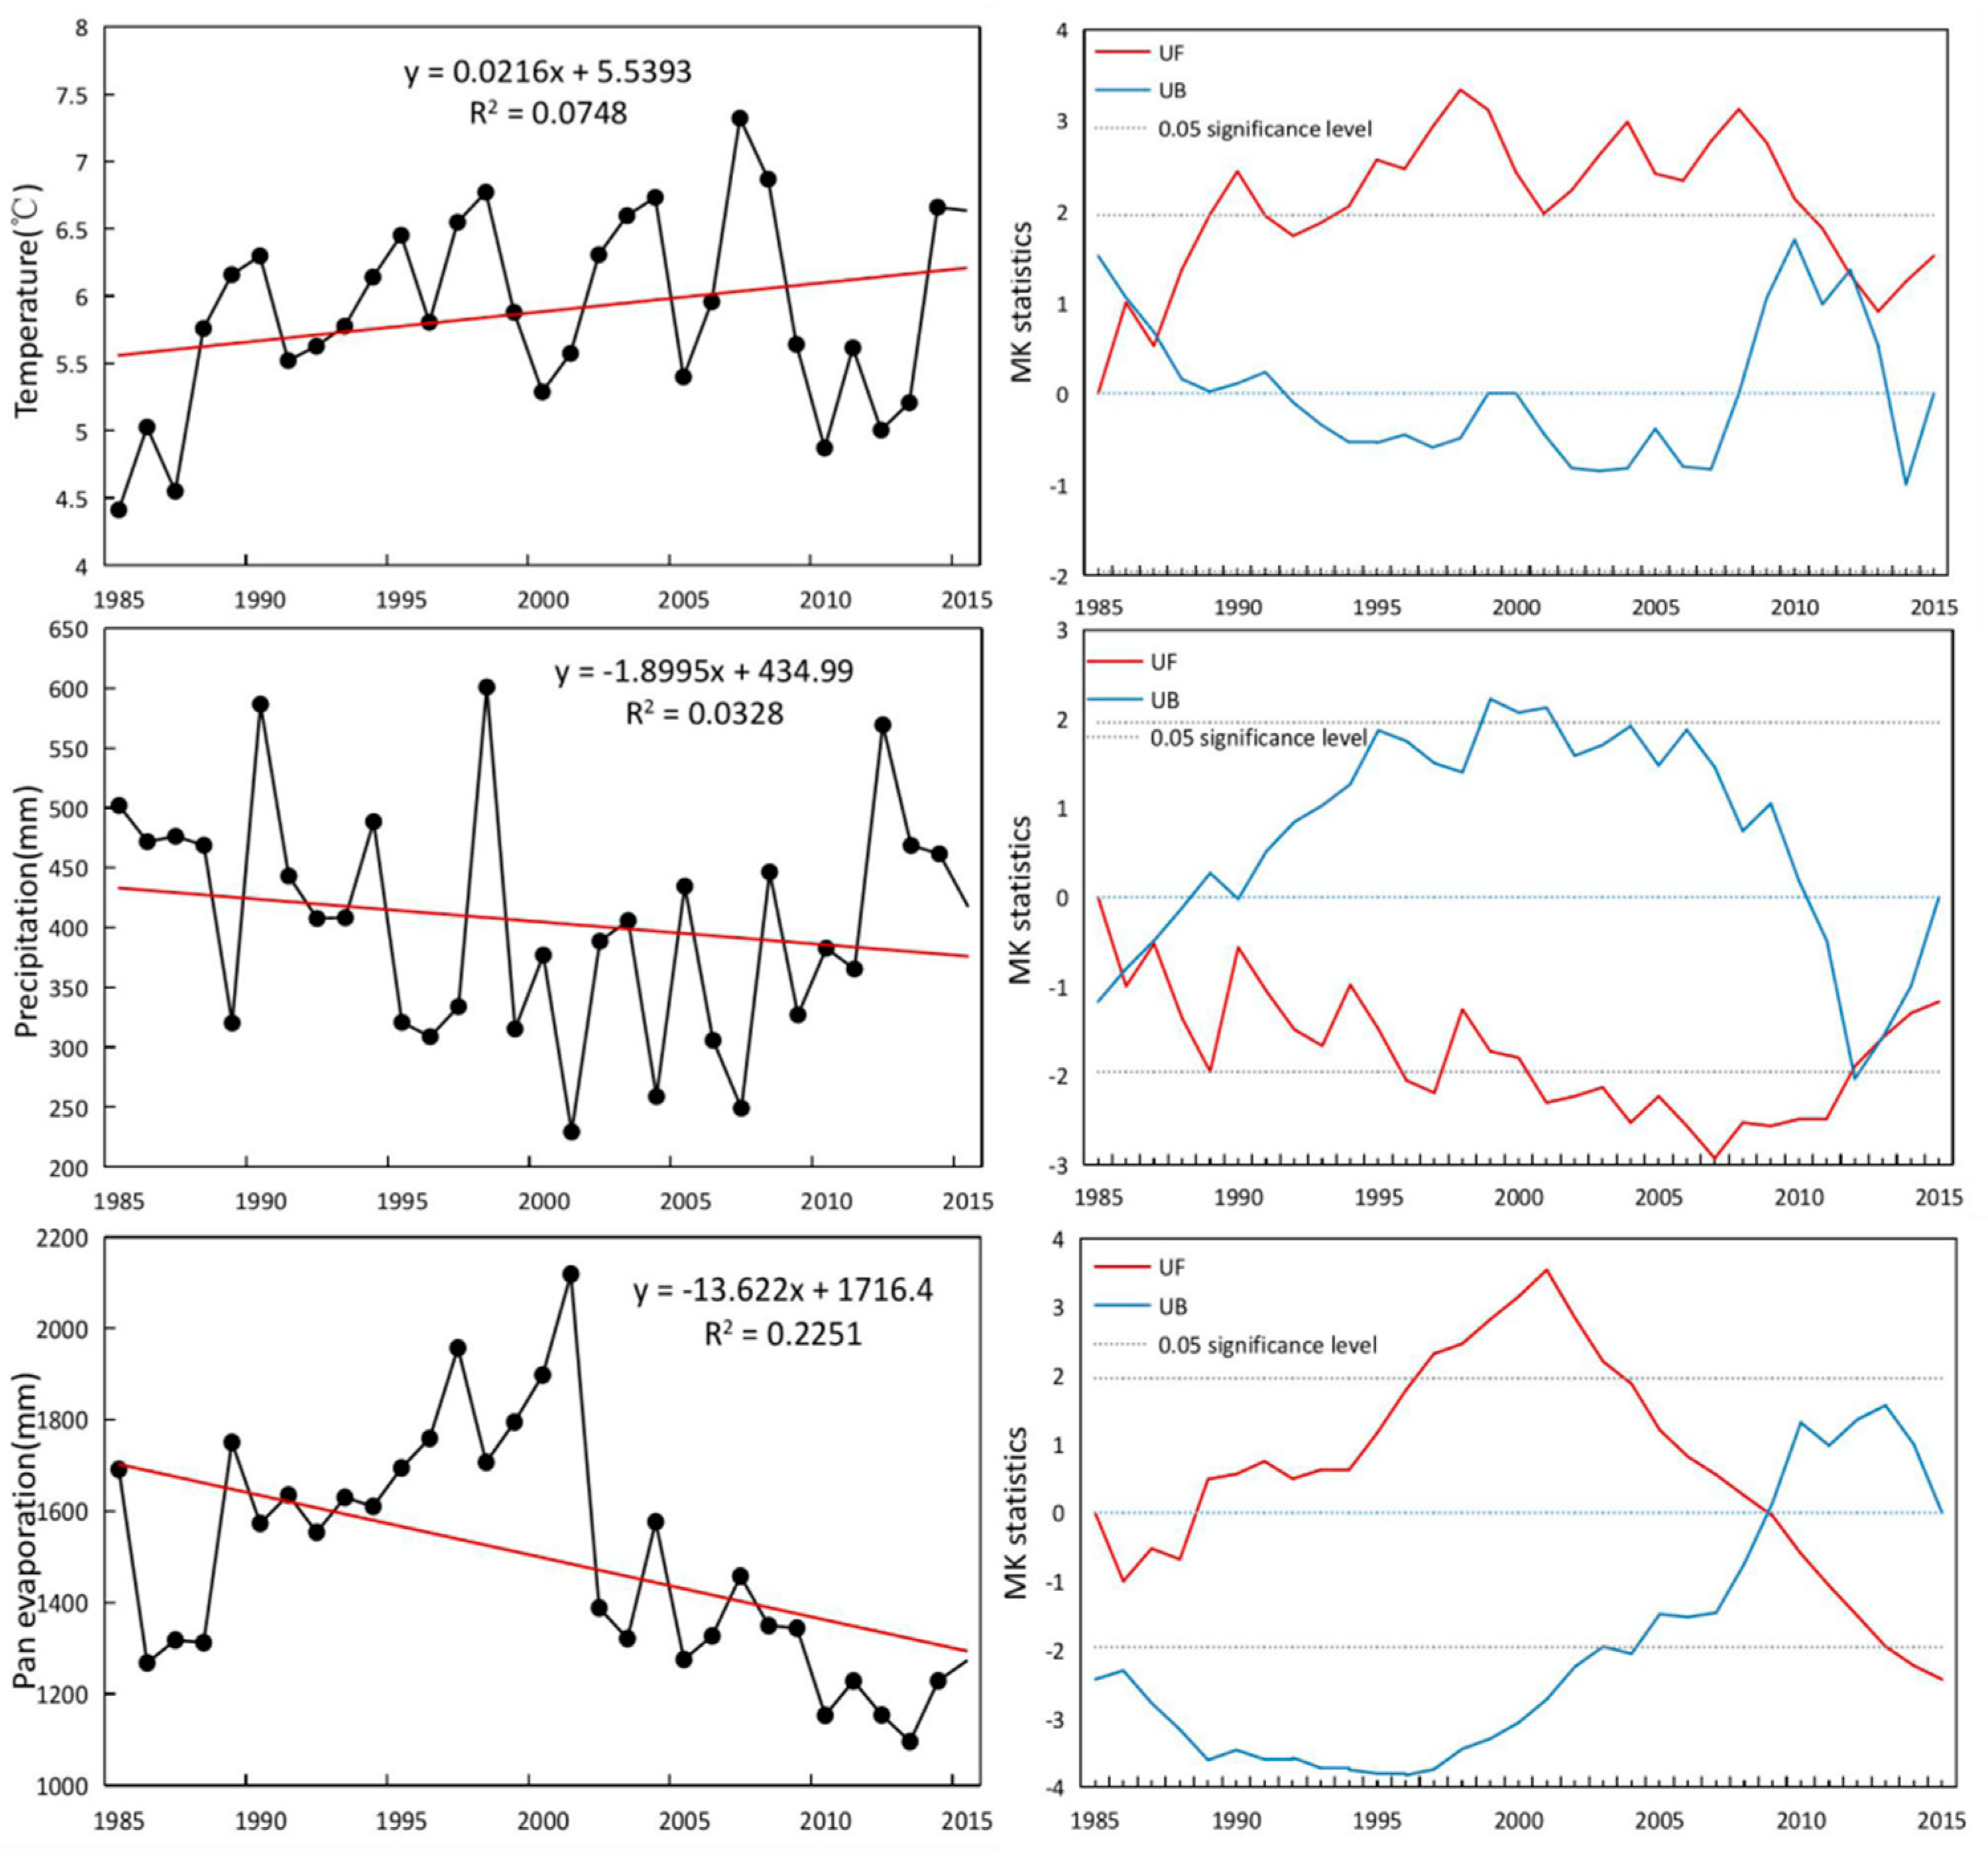
39]. Due to the fragile ecological environment in saline-alkali areas, lake area changes are highly sensitive to climate change. The annual average temperature of the study area over the past 30 years showed an upward trend, while annual rainfall and annual evaporation showed a downward trend (
Figure 6). The decrease in evaporation was particularly pronounced, but it was still about three times the amount of rainfall. The Mann–Kendall mutation test was performed on climate factors. It can be seen from a forward-trend
UF curve that, since 1985, the average temperature in the study area has increased significantly, and this warming trend from 1994 to 2010 greatly exceeded the 0.05 significance level with a Z value of 1.496. The annual rainfall did not decrease significantly before 1995 and did not exceed the 0.05 threshold. Rainfall decreased significantly during the ten years from 2001 to 2011, and mutation points occurred in 1987 and 2013. The annual evaporation did not always decrease. It showed an upward trend from 1989 to 2008, and the evaporation increased greatly around 2000, and suddenly declined in 2009.
The warming trend in the study area was consistent with the global warming trend in the past 60 years, indicating that the climate change in the study area during this period tended towards warm and dry. As the average temperature increases, it is generally expected that the air will become drier and the evaporation of land water bodies will increase. Paradoxically, the observations in the study area over the past 30 years have been opposite. The opposite phenomenon of expected values and observations is called the “evaporation paradox” [
40,
41]. The analysis believes that the evaporation cannot simply be regarded as decreasing with the increase of temperature, but is the result of the combined effect of multiple meteorological factors. This discovery had also been certified previously; for example, from 1956 to 2000, the main factors influencing the decline of pan evaporation in Northwest China were the daily temperature difference, wind speed, relative humidity and air temperature [
42]; the decrease in daily temperature difference and the increase in precipitation might be the reason for the decrease in evaporation of Qinghai Lake [
43]. The decrease in wind speed in the study area was the main reason for the decrease in evaporation [
44].
3.3. Analysis of Lake Response to Climate Change
Climate directly affects dynamic changes in lakes on a decades-long timescale. Climate factors such as temperature, rainfall, and evaporation have an important impact on the dynamic changes of lakes. Regional precipitation can directly affect the area and quantity of water in lake basins, and temperature will affect the evaporation of lake water bodies; high temperature causes water body evaporation and, consequently, lake shrinkage. We used correlation analysis and GLM regression analysis to quantitatively evaluate the impact of climatic factors, including average temperature, precipitation, and evaporation, on lake area at different levels in the study area. All data were standardized before analysis, and the model with the lowest AIC was selected. The results are shown in
Table 1.
The correlation results showed that the mean temperature in the past 30 years is not related to the changes in the total area of lakes in the study area but has a certain response relationship to lakes of various sizes. The temperature had a negative and weak correlation with lakes of 1–10 km2 with a correlation coefficient of −0.353, which is consistent with lake area decreasing with increasing temperature. However, temperature was positively correlated with lakes of ≤1 km2 with a correlation coefficient of 0.446, which can be explained as follows: when the temperature rises, lakes of 1–10 km2 shrink to ≤1 km2, and as a result the number of small lakes increases with increases in temperature. The response relationship between rainfall and lakes of different sizes was significantly different and had a strong impact on small lakes. Rainfall is positively correlated with an increase in lakes of 1–10 km2 with a correlation coefficient of 0.415, indicating that lakes of this size increase with an increase in rainfall. Rainfall negatively correlated with an increase in lakes of ≤1 km2 with a correlation coefficient of −0.531; as rainfall increases, the area of lakes ≤1 km2 will expand to 1–10 km2. There is almost no correlation between rainfall and large lakes (area >10 km2). However, annual evaporation had a positive correlation with lake shrinkage due to the overall downward trend. Compared with the lakes of various levels, the correlation of annual evaporation with the total area of lakes in the region is the largest.
The results of GLM analysis showed that average temperature and rainfall contribute the most to lakes with an area of ≤1 km2, of which average temperature accounts for 31.2% of lake changes, and annual rainfall accounts for 39.4%. Evaporation had the greatest impact on the change in the total area of regional lakes, accounting for 60.2% of the change. The impact of temperature on lakes of all levels was relatively stable, while rainfall had almost no contribution to changes in lakes above 10 km2. This could indicate that temperature and rainfall have a certain influence on the changes in small lakes in the study area, while evaporation would have a certain influence on a large scale and over a wide range.
Through the above analysis of the correlation and assessment of contribution of climate factors to lake changes, it was not difficult to find that the evolution of lakes and climate change in this area in the past 30 years did not show a particularly significant correlation as a whole. The significant correlation is mainly reflected in lakes 1–10 km2 and lakes ≤1 km2. This was different from the characteristics of lake evolution in the Qinghai-Tibet Plateau and the arid area of Northwest China. The analysis of residual values further showed that there were some other potentially important factors in the evolution of lakes in this area. The population is relatively concentrated, and economic and social development creates a large demand for water resources. Therefore, human factors are also an important driving force for the evolution of regional lakes. This makes the evolution of the lake system in this area present complexity, with the superposition of natural and artificial factors. Therefore, according to the geographical characteristics of the study area, combined with surrounding population activities, water intake from water sources, development of fishery and agriculture, etc. screening of influencing factors can further quantify the contribution of human factors to lake changes, which is the potential and challenge of this paper.
4. Conclusions
This study analyzed the spatial distribution, area, and reduction in number of saline-alkali lakes in the southwest of Songnen Plain from 1985 to 2015, as well as dynamic changes and climate trends. Through GLM regression, the contribution of climate factors to lake changes was quantitatively analyzed, and the response relationship between them was explored. The main conclusions are as follows.
(1) During the 30 years from 1985 to 2015, the number of lakes in the study area decreased from 278 to 207, and the total lake area decreased from 1542.89 km2 to 1276.04 km2, showing an overall pattern of shrinking lakes. The only lakes with an area of more than 50 km2 were Chagan Lake and Moon Lake, which increased in area by 56.95 km2 over 30 years. It can be seen that national protection of large natural lakes has played an important role. Lakes with an area of 10–50 km2 decreased in number by 4, and in area by 23.51 km2; lakes with an area of 1–10 km2 decreased in number by 67, and in area by 311.6 km2, these medium-sized lakes are scattered in location, are less managed and paid less attention to, and are seriously affected by regional salinization; however, lakes with an area of ≤1 km2 increased in number by 35, and in area by 11.3 km2, considered as the result of shrinking lakes of 1–10 km2.
(2) Statistics on the addition and disappearance of lakes in different time periods during the 30 year study period showed that the appearance and disappearance of lakes in the study area almost all involved small lakes (area ≤ 1 km2 and 1–10 km2). Most lakes disappeared and reappeared from 1985 to 1995, and there are obvious clustering phenomena in spatial locations, clustered in the northeast area with severe salinization. Lakes disappeared more severely after 1995. Although the lakes recovered during the period, they were not restored to their previous state. In terms of space, the shrinkage of lakes in study area was mainly in east and northeast directions. This direction belongs to the plain area with lower altitude. The lakes have higher salinity and are mostly saline lakes and brackish lakes. Therefore, after the lake area was reduced, the salt in the water and sediments was precipitated, resulting in a large increase in the saline-alkali land around the lake.
(3) During the 30 years from 1985 to 2015, the annual average temperature in the study area showed a rising trend. Meanwhile, the annual rainfall and evaporation decreased. Analysis showed that average temperature and annual rainfall had a weak influence on small lakes, with contribution rates of 31.2% and 39.4%; evaporation had a certain correlation to the total lake area in the study area, and its contribution to lake changes was 60.2%.
(4) The characteristics and driving factors of lake evolution revealed by this research have been studied. The degradation and disappearance of a large number of small lakes in this area is mainly due to the lack of replenishment sources, and the drying and warming of the climate also aggravates their degradation rate. Therefore, in recent years, the area’s ecological environmental protection and restoration work has received attention, and a series of supporting major plans and key projects has been implemented. Established national nature reserves exist for large lakes such as Chagan Lake and Xianghai Reservoir, and a major water diversion and replenishment project, the “River-Lake Connection” project, has been launched. The “River-Lake Connection” project involves the entire study area, and its main task is to make full use of the existing water supply engineering system, supply water to important lakes and wetlands in the study area and replenish groundwater, to achieve the goal of restoring and improving the regional ecological environment and promoting regional sustainable development. The implementation of these projects will definitely affect the major changes in the lake environment in the study area, and we must actively prepare for tracking the changing process. At this time, combined with response to climate change and the interference of human factors, we can make a clear judgment on the ecological environment of the lakes and reservoirs in the study area. This provides a scientific basis for the establishment of a long-term mechanism for ecological and environmental protection of lakes, which is of great significance to the sustainable management of lakes (reservoirs) and to regional economic development.


