Unravelling Climate and Anthropogenic Forcings on the Evolution of Surface Water Resources in Southern France
by
 , and
, and
Camille Labrousse
1,*, 
Wolfgang Ludwig
1,
Sébastien Pinel
1,
Mahrez Sadaoui
1 and
Guillaume Lacquement
2 1
Centre de Formation et de Recherche sur les Environnements Méditerranéens, Université de Perpignan Via Domitia, CNRS, UMR 5110, 52 Avenue Paul Alduy, F-66860 Perpignan CEDEX, France
2
Acteurs, Ressources, Territoires dans le Développement, Université de Perpignan Via Domitia, UMR 5281, 52 Avenue Paul Alduy, F-66860 Perpignan CEDEX, France
*
Author to whom correspondence should be addressed.
Water 2020, 12(12), 3581; https://doi.org/10.3390/w12123581
Submission received: 20 November 2020
/
Revised: 10 December 2020
/
Accepted: 16 December 2020
/
Published: 20 December 2020
(This article belongs to the Special Issue Impacts of Climate Change and Anthropogenic Activities on the Spatio-Temporal Variability of River Flow)
Abstract
:In the Mediterranean, climate change and human pressures are expected to significantly impact the availability of surface water resources. In order to quantify these impacts during the last 60 years (1959–2018), we examined the hydro-climatic and land use change evolution in six coastal river basins of the Gulf of Lion in southern France. By combining observed water discharge, gridded climate, mapped land use and agricultural censuses data, we propose a statistical regression model which successfully reproduces the variability of annual water discharge in all basins. Our results clearly demonstrate that, despite important anthropogenic water withdrawals for irrigation, climate change is the major driver for the detected reduction of water discharge. The model can explain 78–88% of the variability of annual water discharge in the study catchments. It requires only two climatic indices that are solely computed from monthly temperature (T) and precipitation (P) data, thus allowing the estimation of the respective contributions of both parameters in the detected changes. According to our results, the study region experienced on average a warming trend of 1.6 °C during the last 60 years which alone was responsible for a reduction of almost 25% of surface water resources.
1. Introduction
The Mediterranean region is warming faster than the world average and should experience drier conditions than today in the near future [1,2,3,4,5]. This region has already been submitted to large climate shifts in the past [6] and is now widely recognized as one of the most prominent hotspot regions in future projections [2]. Water acts here as a limiting factor for economic development and local societies have to reconcile decreasing water resources with increasing water needs for a growing population and for sustainable agricultural and touristic development [7]. It is hence crucial to identify ongoing hydro-climatic trends, their processes, drivers, and their impact in order to shape adaptation strategies for water resource management.
Many studies have analyzed hydro-climate trends in the Mediterranean Region over recent decades (see the reviews from [8,9]). Especially in Spain and France, a series of studies have reported seasonal and annual decreasing trends for water discharge of coastal rivers which are likely to be linked to recent climatic evolution [10,11,12,13,14]. However, streamflow trends can be attributed to several factors other than climate including land-use change, water use and water management [8]. It therefore remains complex to find out what proportion of the reduction is human-induced and what proportion is climate-induced.
Our study addresses these problems. We focus on the annual evolution of water discharge of six coastal rivers in Southern Mediterranean France during the last 60 years which were analysed together with the corresponding evolution of climate and land use patterns. Our goal is to statistically detect the dominant controls on water resources which can then be used for quantitative assessments of past and future evolution in the context of global change. We used for our purpose the climate parameters and associated model transformations that can be extracted in a gridded form from the Meteo-France Safran-Isba-Modcou database, which allow a continuous and spatially explicit reconstruction of climate evolution since 1959.
Previous studies have already detected a significant decline of water discharge in the rivers of our study region [12,15], making this region particularly suitable for testing the validity of empirical relationships under non-stationary conditions. There is increasing awareness that the ability of hydrological models to predict water discharge under future climate conditions not only depends on their performance in reproducing realistic seasonal or long term averages, but also on their capabilities in faithfully reproducing the observed trends in time series which depict non-stationary conditions [16].
Despite the fact that anthropogenic water use can strongly influence water discharge in the studied river basins, we clearly demonstrate that climate was the dominant driver for the evolution of surface water resources during the last 60 years. For all six river basins, highly significant empirical relationships between observed annual water discharge and two single climate indices could be established. They explain by far the largest part of the long-term variability of water resources in the study region. The performance of our models was tested both through the strength of correlation between the simulated and observed water discharge and through their ability to predict the detected trends. Temperature and precipitation are the only input parameters for the climate indices we used, and we also discuss the potential impact of each parameter on the evolution of water resources since the early 1960s.
2. Materials and Methods
2.1. Study Area
The study area consists of six coastal watersheds of the Gulf of Lion drainage basin which is located in the Northwestern Mediterranean Sea (Figure 1). They are, from North to South, the Herault, Orb, Aude, Agly, Tet and Tech river drainage basins, covering areas ranging from 729 to 4838 km2 (Table 1). Administratively, they belong to the French Herault (Herault and Orb catchments), Aude (Aude catchment) and Pyrenees-Orientales (PO) departments (Agly, Tet and Tech catchments) and form about 43% of the former Languedoc-Roussillon (LR) Region. In terms of climate, all watersheds are dominated by Mediterranean climate conditions, except the upper parts of the southern basins which drain the Pyrenees Mountains and which are characterized by a nival climate type [12]. Water discharges in the studied rivers depict clear decreasing trends in relation to recent climate change [12,15], which has continued and even been acerbated during the most recent years (see Section 3. Results, Trends, Hydro-climatic parameters). This allows the study of their hydro-climatic functioning under non-stationary conditions. Moreover, anthropogenic water use is important in some of the watersheds (see Section 3. Results, Trends, Water and land use), making these rivers interesting case studies for the deconvolution of anthropogenic and climate forcing on surface water resources. Pressures might still increase in the future since the French National Institute of Statistics and Economic Studies (INSEE) [17] reported that the study region has gained 1 inhabitant per km2 between 1982 and 2011, compared to about 0.5 inhabitant per km2 for the whole country, and anthropogenic pressures are expected to increase
2.2. Climate Data
The climatic data we used were extracted from the 8-km gridded dataset provided by the mesoscale atmospheric system Safran hosted at Météo-France (MF). Safran was initially designed to provide atmospheric forcing details in mountainous areas for avalanche hazard forecasting [18,19]. The system has been extended over the whole of France coupled with a land surface model (Isba) and a hydrological model (Modcou) in order to simulate the transfers between the atmosphere, the surface, and the subsurface. A detailed description of Safran and its applications over France is presented by Quintana-Seguí [20]. Mean daily temperature (T), precipitation (P), and potential evapotranspiration (PET) were extracted from Safran for the 60-year period for each grid falling into the respective watersheds, and then averaged for the entire watershed (Supplementary Materials Figure S1). Watershed contour shapefiles from the French Carthage Métropole database were used for this [21]. We also condensed these data to monthly and annual averages.
In Safran, T, p and PET data are processed from automatized spatial extrapolation of all available station data of MF and therefore represent a realistic estimate for the spatial and temporal evolution of these parameters in France. However, since not all stations cover exactly the same periods, the extrapolation procedure can include variable time slices which might impact the resulting trend analysis [22]. We therefore tested the consistency of the Safran data by comparing them to the values obtained by Lespinas [12] for the period of 1965–2004. These latter data were obtained by manual extrapolation of a fixed number of stations in this area. The results (Supplementary Materials Figure S2) demonstrate that both methods result in identical temperature trends (except for the Agly catchment for which the Safran trends are significantly lower). The average T values can however be somewhat different, in particular in the small Tech and Tet catchments with strong elevation gradients. This is because Lespinas [12] produced their spatial interpolations at a much finer spatial grid point scale.
We further produced, with the Safran climate data, a series of climate indices which were used for correlation statistics. Two of these express the seasonality of precipitation (the Fournier Index (F-Index) [23], Seasonality Index (SI) [24]) and three are drought indices (the Standardized Precipitation Index (SPI) [25], Standardized Evapotranspiration-Precipitation Index (SPEI) [26], Reconnaissance Drought Index (RDI) [27]). Among the latter, SPEI and RDI were revealed to be particularly powerful for the prediction of annual runoff. SPEI was calculated with the corresponding R-routines supplied by Vicente-Serrano et al. [26] whereas RDI was calculated using three expressions. The first uses a monthly time step and is computed over a complete hydrological or full year. It follows the equation:
where, Pij and PETij are precipitation and potential evapotranspiration of the jth month and of the ith year and n is the number of years in the data. The second expression is the normalized RDI expressed as:
where, is the arithmetic mean of values, calculated for the n years of data. Finally, the third expression is the standardization of RDI, following the equation:
where is the natural logarithm of , the arithmetic mean of and the standard derivation of . Finally, apositive/negative renders dry/wet conditions
In Safran, PET is determined according to the Food and Agriculture Organization of the United Nations (FAO) Penman-Monteith equation [28] which requires, beside temperature, data on wind speed, air humidity, radiation and albedo. The availability of all these parameters is often limited and many approaches often refer to estimates of PET which is derived from temperature data alone [29,30]. In our study, we therefore also tested whether T-derived PET estimates (PETt) can be used for the prediction of annual runoff. We retained for this the approach of Folton and Lavabre [31] which has been demonstrated to successfully produce PET estimates in the South of France and which was therefore used for the modelling of water discharge in the studied river basins [15].
2.3. Hydrological Data
Observed water discharge data (Qobs) were taken as daily values from the HYDRO database hosted by the French Ministry of the Ecology, Sustainable development and Energy [32]. For each river, we selected the most downstream gauging station (Figure 1). Certain short time periods could be missing. We filled these gaps by interpolating them with records from previous and next days of the same station (see Supplementary Materials Table S1). Nevertheless, length of series differs from one river to another. The Herault is the river with the longest time series of 59 years (1959–2018 except 1986), whereas the Tech River presents the shortest time series with 43 years (1976 to 2018).
The Safran-Isba-Modcou database also provides data which are derived from modelling alone. Among the hydrological parameters, basin runoff can be estimated as the sum of surface runoff and soil drainage [33,34] and we also included this parameter (Qs) in our study for comparison with modelling (Table 1). It should however be noticed that Qs has been calibrated with observed discharge values from station data in the study region and Qs is therefore not completely independent from Qobs [34]. We finally also included a simple climatic index which can be used as an estimator of water runoff. This parameter (Qpike) is calculated on the basis of annual P and PET data alone and has been successfully applied to predict average water runoff in Mediterranean rivers [35,36]. The parameter is given following the equation:
where P is the annual rainfall and PET the annual potential evapotranspiration.
2.4. Land Use Data and Anthropogenic Water Extractions
Data on the evolution of anthropogenic land use and water extractions are more difficult to assemble than climate and water discharge data. They are normally collected at coarse temporal time scales, do not go as far back in time as climate data and often need the combination of different sources, including reports and web-sites from non-scientific publications and organisations. A very general evolution of land use can be obtained from the CORINE Land Cover data base [37] which allows quantification of the major agricultural land use types for the years 1990, 2006, 2012, and 2018 at a spatial grid point resolution of about 100 m. Average land use characteristics in the study catchments are summarized in Table 2.
Recent data on quantitative surface water withdrawals were retrieved from the French online database Banque Nationale des Prélèvements quantitatifs en Eau (BNPE) [38]. They are available per administrative area, and we used the basin outline shapefiles to filter only the areas that fall within the basin limits. The data exist at annual time scales from 2012 to 2018, and average values are summarized in Table 1 for comparison with surface water runoff in the basins. For longer time scales, one can only refer to agricultural census data which are based on queries and centralized at the French Agricultural Ministry. Reconstruction of the evolution of irrigated areas in the former LR area between 1970 and 2010 can be obtained from the statistical service of the French Ministry of Agricultural Ministry (AGRESTE) for the years 1970, 1979, 1988, 2000 and 2010 [39]. Data on agricultural land use changes were also obtained at the department scale from AGRESTE for the years 1988, 2000 and 2010.
We further also considered remote sensing data which allow more continuous reconstruction of the evolution of land surface patterns and which are therefore more suitable for statistical analyses together with climate data. We considered in particular the so-called Normalized Difference Vegetation Index (NDVI) which is an index ranging between 0 and 1 of the absorptive and reflective characteristics of vegetation in the red and near-infrared of the electromagnetic spectrum. It is hence an indicator of the productivity, density, and/or health of the vegetation cover. The data we used exist at a resolution of 8 km and were extracted from the National Centre for Atmospheric Research [40] for the years 1982 to 2015.
2.5. Statistics and Data Treatment
We used the freely available R software for the extraction and arrangement of data as well as for the computation of statistical tests. For trend analysis in hydro-climatic time series, we performed a Mann-Kendall test [41,42] together with the calculation of the Sen slope [43] to detect and to quantify linear trends (see Supplementary Materials Table S2). We chose this test for its robustness with regard to outliers and skewed data. The Mann-Kendall test is an efficient tool in hydro-climatic studies [44] and still widely used for trend detection (e.g., [45,46]). Single and multiple regression analysis were performed on the basis of the squared Pearson correlation coefficient [47] which allows quantification of the strength of linear relationships. In multiple regression analyses, only parameter combinations were allowed which significantly increased correlation in all of the study catchments. The accuracy of each hydrological model was tested both by calculating the strength of the relationship between the simulated variable and the observed water discharge, and by comparing the linear trends obtained over the observed period of each river. Combination of climatic, land use change and water management parameters in the multiple correlation analyses suffered from the different spatial and temporal resolutions in which these parameters exist. The land use change and water management parameters often only exist at regional scales (irrigation) and/or represent average long term trends over decades (land use changes). We therefore also created subsets of data over shorter time periods for which all parameters exist and linearly interpolated decadal trends to finer annual time steps in order to test the potential impact of these latter parameters on the evolution of water discharge in the study rivers.
3. Results
3.1. Average Basin Characteristics
3.1.1. Hydro-Climatic Parameters
Table 1 summarizes the average hydro-climatic characteristics of the studied river catchments. Observed water discharge (Qobs) varies between 191 mm (Agly) and 615 mm (Orb) and represents respectively 24% and 61% of mean annual precipitation (P) in these basins. Such large variability is only partly related to the prevailing climate conditions. For example, the relatively high Qobs value for the Orb catchment is related to water importation from a neighboring catchment [15] whereas the relative low values for the Tet and Agly catchment can be explained by water withdrawal by irrigation channels (Tet River) and/or water losses through karstic geological formations (Agly River). In the case of the Tet, the water loss represents approximately one third of the natural water discharge close to the river mouth [48].
Modelled water discharge (Qs) extracted from the Safran-Isba database fits within a range of +50% and −20% of the observed water discharge values. It overestimates the observed values, except for the Orb catchment. However, as the model is purely driven by climatic parameters, other factors such as anthropogenic water extractions (see above) cannot be taken into account, and discrepancies between the modelled and the observed average values should not necessarily be interpreted as failure of the model performance.
Average annual precipitation totals in the catchments vary between 802 mm (Tet and Agly) and 1103 mm (Herault). They are generally more elevated in the northern compared to the southern catchments, but slightly increase again in the Tech catchment towards the Spanish border. Average temperatures are naturally lowest in the catchments with the greatest average elevation, which are the Tet and Tech catchments. The climate values we found generally fit well with the ones produced by Lespinas [12,15], but small differences can appear especially in the smaller southern catchments because of the relative coarse grid point resolution of the Safran data of differences in the consideration of snowfall and of differences in the spatial interpolation techniques at the border with Spain.
3.1.2. Water and Land Use
Table 1 also allows an overview of the potential impact of anthropogenic water use on the water discharge of the investigated rivers. Superficial water extraction for drinking water are almost negligible and clearly less important than water extraction for irrigation. The latter, however, can represent a considerable fraction of average water discharge. It is more important for the southern catchments compared to the northern ones. Water withdrawal for irrigation is particularly elevated for the Tet River (>80% of Qobs), underlining its outstanding role in terms of water use. Because of the steep elevation gradient and an important share of snowfall in total precipitation (Table 1), supporting water discharge during the snowmelt period in spring, a dense network of irrigation channels has been developed here since the Middle Ages [49]. It still supports gravitational irrigation techniques, which are highly water consuming. However, most of the extracted water naturally returns to the river and bulk water extractions should not be considered as net water losses in the annual river discharge.
Average vegetation and land use characteristics in the studied catchments are summarized in Table 2a. Natural vegetation dominates in all catchments and is particularly abundant in the Tech and Tet catchments. Forests dominate in the Tech and Orb catchments, whereas scrubs and herbaceous vegetation also significantly contribute to natural vegetation in the Tet, Agly and Herault catchments. The Aude River has the catchment with the greatest share of cultivated areas. Agricultural land use in all catchments (Table 2b) is generally controlled by vineyards, except in the Tet catchment where fruit tree cultures occupy about the same area. This is directly related to the outstanding irrigation activity in this catchment (see above). Other land use types are mixtures of agriculture and natural vegetation and pasture. Arable land (corn and legumes) is only important in the Aude catchment.
3.1.3. Parameter Relationships and Models
Relationships between individual parameters can be illustrated in the form of correlation matrices. We present this in Figure 2 only for the Herault catchment as an example, but for the other catchments the results are similar (see Supplementary Materials Figure S3). Only relationships between mean annual hydro-climatic parameters were included in Figure 2, since the evolution of land use patterns cannot be reconstructed in the same temporal resolution historically (see below). Correlation with observed annual water discharge (Qobs) is highest with the Safran-based modelled water discharge (Qs), with r2 = 0.85 for n = 59 data points. The Safran-Isba model is hence a powerful tool to predict the long-term evolution of water discharge in this catchment. Qpike also depicts close correlation with Qobs (r2 = 0.79), followed by P, RDI, SPEI and SPI (r2 = 0.70, 0.61, 0.57, and 0.51, respectively). Negative correlation is observed for PET (r2 = 0.29), PETt (r2 = 0.21) and T (r2 = 0.19). All parameters expressing drought indices are highly intercorrelated (RDI, SPEI, SPI), as this is also the case for PET and PETt. Indices which were selected to characterize seasonality of p (WI, SI and Fournier) only depict weak correlations with Qobs.
3.1.4. Multiple Parameter Relationships
Combination of the above-discussed parameters significantly improve the prediction performance of empirical models for Qobs. Multi-regression statistics reveal that in particular the combination of Qpike and RDI yields the most powerful regression models in all study catchments (in the following Qmod). Figure 3 shows that r2 continuously increase when using P, p combined with T, Qpike and Qpike combined with RDI as input parameters in the regressions. In the case of the p—T models, T is however only significant (p < 0.1) in the Herault, Orb, Agly and Tech catchments. In the case of the Qpike—RDI models, both input parameters are highly significant (p < 0.01) and the resulting r2 values (Table 3a) are comparable to the r2 values which are obtained when correlating Qobs with Qs (r2 = 0.77, 0.88, 0.89, 0.87, 0.87, 0.85 for the Tech, Tet, Agly, Aude, Orb and Herault catchments, respectively). Adding RDI to Qpike always provokes a significant increase of r2 compared to Qpike alone and the model hence explains between 78% (Tech) and 88% (Agly) of the variability of observed annual water discharge during the documented study years (n = 43–59).
All the tests we performed in order to combine our climate data and indices with data on land use changes and water management practices in time sub-series for which all parameters could be combined did not result in significant improvement of the prediction performance of our empirical models.
Table 3a also depicts the corresponding regression coefficients for Qpike and RDI for the studied river basins, as well as the associated intercept values (which are all also significant at the p < 0.01 level). Between catchments, the variability of the Qpike coefficients is lowest (about +/− 20% around the average) and slightly more elevated for the RDI coefficients (about +/− 33% around the average). For the corresponding intercept values, variability is greatest (about +/− 100% around the average). The intercept is greatest for the Orb which imports water from outside the catchment, and lowest for the Agly catchment which loses water to the karst groundwaters (see above). Interestingly, Table 3b also demonstrates that replacement of PET by PETt in our regressions does not significantly impact the predictive performance of the models. In four of the six catchments, r2 even increases slightly. This means that between 78% and 88% of the variability of observed annual water discharge in the study catchments can be explained by two single climatic parameters, which are monthly T and monthly P.
3.2. Trends
3.2.1. Hydro-Climatic Parameters
All hydro-climatic parameters were submitted to trend analysis in order to catch their long-term evolution. Mean annual temperature increased on average between 1.2 °C (Agly) and 2.1 °C (Herault) during the study period (Figure 4a), which corresponds to a warming trend of 0.23–0.35 °C/decade. This is less than reported by Lespinas [12], who found an average warming of about 0.38 °C/decade for the entire study region. Discrepancies are related to the longer time period we considered, as well as to a slight flattening of the warming trend during recent years (Supplementary Materials Figure S1). This illustrates the strong dependency of trend analyses on the time slices which are selected to run these analyses. The detected trends were nevertheless highly significant in all catchments (p < 0.01), confirming that global warming affected the study region. Trends for the evolution of PETt (Figure 4b) closely match the evolution of T, illustrating the strong relationships between both parameters. PET, however, depicts a stronger increase in the Orb and Herault catchments compared to the other catchments further south.
The evolution of annual precipitation was highly variable (Supplementary Materials Figure S1) and trends can only be detected at weak significance levels (Figure 4c). All have negative signs. The strongest trend (p < 0.1) appears for the Tet catchment, where p decreased by about 18% In the Tech, Agly and Aude catchments also, slightly negative trends of about 13–15% are indicated (p < 0.2). Such an evolution towards lower p values is in agreement with future climate predictions [50], although the study region is situated on the limit between predicted p increases further North and predicted p decreases further South.
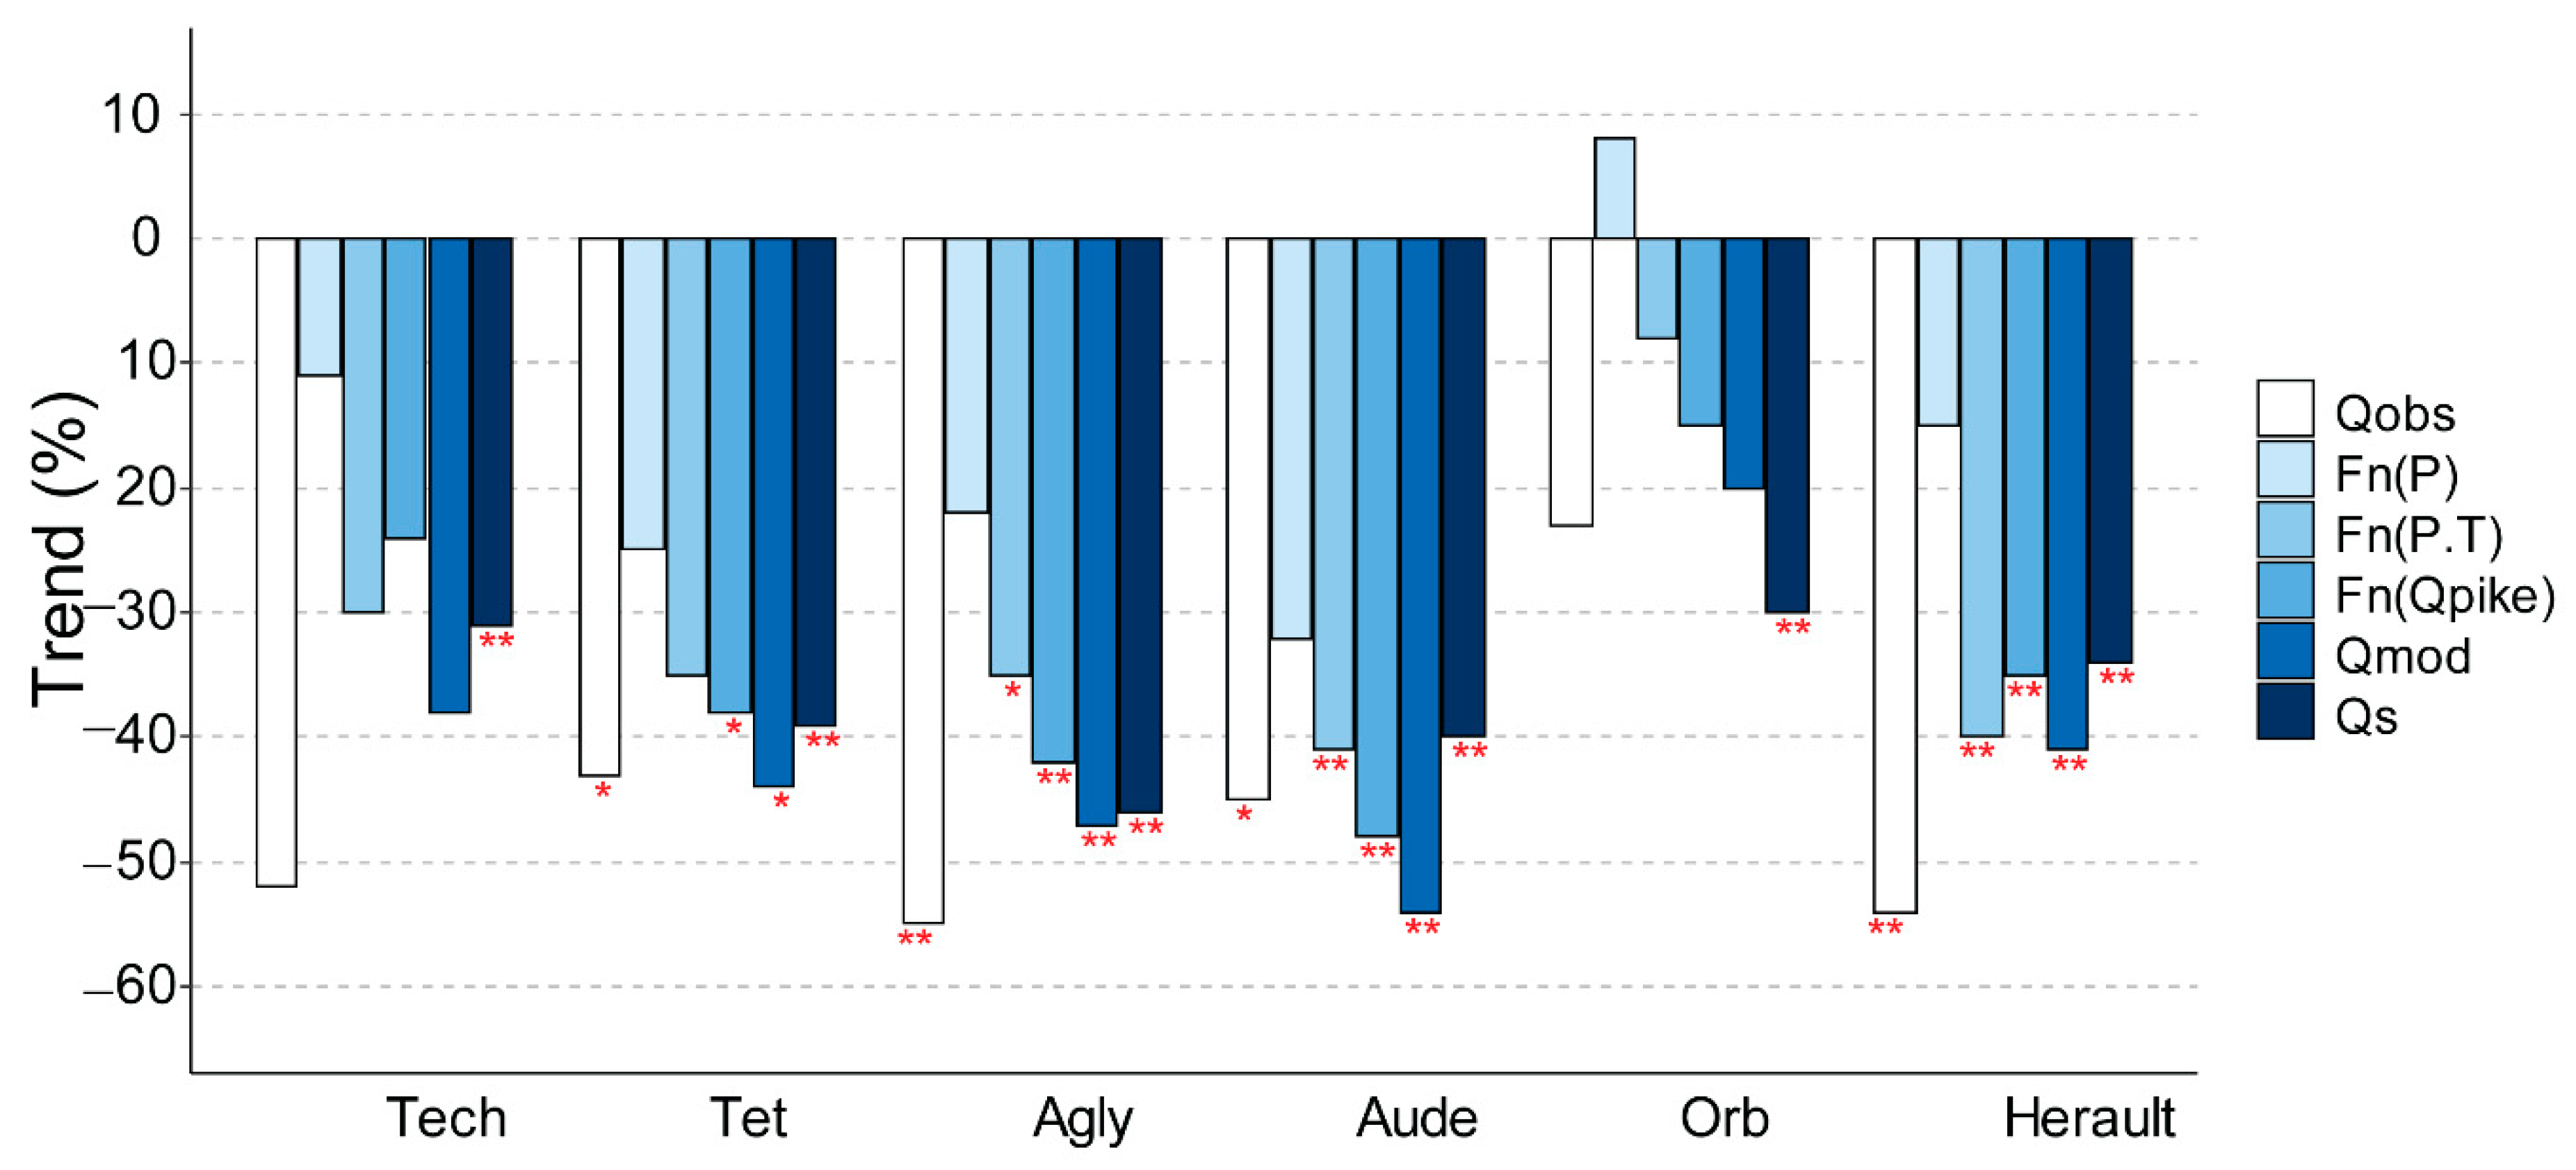
Quantification of the associated discharge trends is more complicated since the time series for Qobs in the study catchments does not exactly cover the same periods, and trend analyses are impacted by differences in the years when the trends start and end. However, both the annual evolutions of Qmod and Qs closely match the evolution of Qobs (Figure 5), which suggests that trend analyses can be performed on the basis of these parameters. Comparison of trends which are restricted to the years for which Qobs exist reveal that both Qmod and Qs reasonably fit with Qobs (Figure 6). Extrapolating the trends to the entire study period (Figure 4d) on the basis of Qmod and Qs therefore suggest that water discharge might have significantly decreased by about 30% (Orb)–45% (Agly) on average. Figure 6 also demonstrates that precipitation alone, although this parameter explains the largest part of the variability of Qobs in the study catchments, is not suitable for the prediction of trends.
3.2.2. Water and Land Use
The discontinuous information on land and water use we could assemble does not allow running trend analyses of these parameters. Exploitation of the periodical assessments of the major land use patterns done by CORINE nevertheless allows a general view of major changes during the last 30 years (Supplementary Materials Figure S4). According to CORINE, total agricultural area in all catchments decreased between 1990 and 2018, but only by less than −2% (from −0.8% to −1.6% in the Orb and Tech catchments, respectively). Forests significantly increased especially in the Tech (+3.4%), Orb (+2.0%) and Herault (+4.8%) catchments in which scrub and herbaceous vegetation significantly decreased (−3.3%, −4.1% and −5.2%, respectively). Artificial areas also increased in all catchments (from +0.4 to +1.2% in the Agly and Orb catchments, respectively). Within agricultural land use types (all types = 100%), the strongest decreases are documented for vineyards (from −2.7% to −6.8% in the Herault and Orb catchments, respectively). Heterogeneous crops are the agricultural land use type which increased most (from +1.3% to +12.2% in the Herault and Tech catchments, respectively).
The CORINE data therefore suggest that agricultural land use was only moderately impacted by recent change. This contrasts with information that can be obtained from queries. Based on agricultural census data in France (AGRESTE [39] and on the website of the decentralized service of the French Agricultural Ministry called Direction régionale de l’Alimentation, de l’Agriculture et de la Forêt (DRAAF) [51]), the utilized agricultural area (UAA) has reduced by −13.3% between 1988 and 2018 in the entire studied area, with greatest reductions (−24.3%) in the Pyrenees-Orientales (PO) department, moderate reductions (−13.5%) in the Herault department, and lowest reductions (−8.4%) in the Aude department. This is about 3–3.5 times more than data obtained from CORINE on the basis of the respective catchment data. This indicates that mapping of land use types as done by CORINE is not necessarily a precise indicator of agricultural land use changes. Abandoned land may not be recognized as such when integrated in mixed land use types such as heterogeneous crops. Qualitatively the CORINE data are nevertheless in agreement with the census data in the sense that they confirm that permanent crops (mainly vineyards) are the agricultural land use type which decreased most in the study region. According to AGRESTE, this land use type decreased within UAA in the PO department by −46% and in the Herault and Aude departments by −33% within UAA. Increasing land use types where, on the other hand, pastures (+36% and +20% in the PO and Aude departments) and arable land (+42% in the Herault department).
The agricultural census data also allow the evaluation of the evolution of irrigation over the study area. According to AGRESTE, UUA decreased continuously between 1970 and 2010 with −21% in the LR region. Irrigated areas decreased in parallel but by −28%. This decrease was hence stronger than the decrease in UAA in general. Between 2000 and 2010, the AGRESTE data also allow a breakdown of the evolution of irrigated areas at the department scale and reveal a −23% decrease in the PO department. It is here where surface water extraction for irrigation is greatest on average (Table 1). In the Aude and Herault departments, however, irrigated areas increased again (by +19% and +18%, respectively), and irrigated areas in the entire study region (PO, Aude and Herault departments) remained almost stationary (+1.8%) between 2000 and 2010 (−5.3% for the LR region). All these data nevertheless indicate a general trend of reduced agricultural water use in relation with the general decline of agricultural land use since 1970.
One might finally look at the evolution of NDVI in the study catchments (Supplementary Materials Figure S5). This index is often used to track the changes of forest cover [52,53], a land use type with relatively high NDVI values, and reforestation or deforestation trends in drainage basins can impact the hydrology of rivers [53,54,55]. Average annual NDVI values follow a weak trend towards increasing values. However, changes are minimal and mainly restricted to the beginning of the study period. This is consistent with the forest cover changes documented in CORINE (see above). Significant reforestation trends have been detected in the study region (see [12]), but they mainly occurred before 1990 and should have considerably flattened since then.
We further included the NDVI data in our multi-regression statistics in order to test whether this parameter could improve the accuracy of our models since the 1980s. However, no significant improvements could be detected.
4. Discussion
4.1. Hydro-Climatic Trends
During the last 60 years, the hydro-climatic conditions in the study region have clearly evolved towards warmer and dryer conditions. Based on trend analyses, it can be estimated that average annual temperature increased by about 1.6 °C in the entire study region (discharge-weighted average over all catchments), with maximum increases in the northern catchments (1.7 °C and 2.1 °C in the Orb and Herault catchments, respectively). The onset of this increase started in the early 1980s, in agreement with the onset of global warming in general [56]. Precipitation followed less marked trends, but generally decreased with weak to moderate significance in the middle and southern part of the study region (13–18%). The most striking trends were, however, encountered for surface water discharge, which throughout decreased by about 30–45% in the study catchments. Similar trends were also reported from other Mediterranean areas. For example, Piervitali et al. [57] already reported in 1998 a 20% decrease in precipitation during the period 1951–1995 in the Central-Western Mediterranean. More recently, Valdes-Abellan [58] indicated a decrease of 15% in the annual rainfall in the south-east of Spain over 30 years. The reduction of water discharge has also been documented across various Mediterranean sites and time scales. Romano et al. [59] reported a decrease in the Tiber discharge between 1952 and 2008, associated with a reduction of rainfall and an increase inv temperature. In the Iberian peninsula, several studies identified reductions of river discharge for the periods 1950–1999, 1945–2005, and 1966–2005 [60,61,62]. The evolution we document therefore fits well in the general picture of the Mediterranean as one of the hot spot regions for the decrease of future water resources in relation to climate change.
However, in agreement with the conclusions of many of the studies cited above, two major questions arise from these findings. On the one hand, it is not clear whether the water discharge trends are purely climate driven or whether anthropogenic land use and water use changes may also have contributed. In our study region, the strong decline of surface water resources in combination with only weak negative precipitation trends may be surprising and point to additional drivers such as water extraction for agriculture. On the other hand, it is not clear whether the detected hydro-climatic trends are representative of long term evolution, or whether they are also impacted by other factors such as the cyclicity of atmospheric circulation patterns [63]. Results of trend analyses strongly depend on whether they start (end) with relatively humid (dry) conditions and projecting them beyond the documented time series should naturally be performed with caution.
4.2. Drivers of Water Discharge
Both questions can be addressed with our data. Anthropogenic water extraction is indeed significant in the studied catchments, especially in the southern part of the study region, with an irrigation hot spot in the Tet catchment. Agricultural land use is however declining, and this decline is particularly important in the PO department where agricultural water use is greatest on average. Moreover, the decrease in irrigated areas is generally stronger than the decrease in agricultural areas in general, which supports the idea of an antagonistic impact of land use changes on surface water resources.
Another candidate for land use changes as driver for the detected water discharge trends is forest cover. Forests can intercept rainfall and hence decrease surface runoff through enhanced evapotranspiration [64]. Forest cover did indeed significantly increase in the study region [12], but this mainly happened during 1950–1970. The more recent evolution during the last 30 years is rather characterized by stationary evolutions, along with some slight increases in the Tech, Orb and Herault catchments. This is also contrary to the idea of water discharge trends being driven by anthropogenic factors.
Finally, the strongest argument for a dominant climate control of the evolution of surface water resources is that, in all catchments, climate parameters alone can statistically explain between 78% and 88% of the observed variability of annual water discharge. These parameters are, on the one hand, the hydrological index Qpike and, on the other hand, the drought index RDI. The former has been shown to represent a realistic estimator of specific average water discharge in Mediterranean rivers in general [35,65], whereas the latter takes into account the climatic conditions prior to the study year and therefore may represent the conditioning of the basin’s internal water resources, such as groundwaters in the catchments. Among the different drought indexes we tested, which were also used in other studies for hydrological modelling purposes [66,67], RDI produced the best model performance, although the SPEI index performed almost as well as RDI. Combined in a simple multi-parameter regression model (Qmod), both indexes do not only well reproduce the average water discharges in all study catchments, but also the associated trends. Interestingly, correlation and trend analysis with Qobs yield similar performances as Qs, which is based on the modelling algorithms for water discharge integrated in Safran-Isba. Compared to Qobs, Qs nevertheless tends to overestimate average discharge (except in the Orb catchments), as it ignores general water use in the catchments.
4.3. Model Applications
The simple statistical model we propose can also be easily adjusted to other catchments to reconstruct long-term evolution of average water discharge during the recent past, or to produce projections for the near future in combination with climate scenarios based on models. It should therefore be considered as a valuable decision making tool for water management purposes. Sophisticated hydrological models generally require many parameters and are often subject to large uncertainties [68], reducing both their usability and reliability for decision makers. When relating PET exclusively to temperature, as is often done in hydrological modelling studies [30,69], our statistical models require only two single input parameters, i.e., monthly P and monthly T. The model therefore easily allows quantification of the role of each parameter in long-term trends in order to address the question of the representativeness of our discharge trends in the context of climate change. We consequently performed sensitivity tests by running our models with modified P and T time series during the study period. In these tests, T and P changes were uniformly applied to all months and therefore do not take into account possible changes of seasonality in the time series. RDI was calculated by normalization with the means and standard deviations of the non-modified time series, hence allowing RDI to evolve towards generally more humid or dryer conditions compared to the reference period.
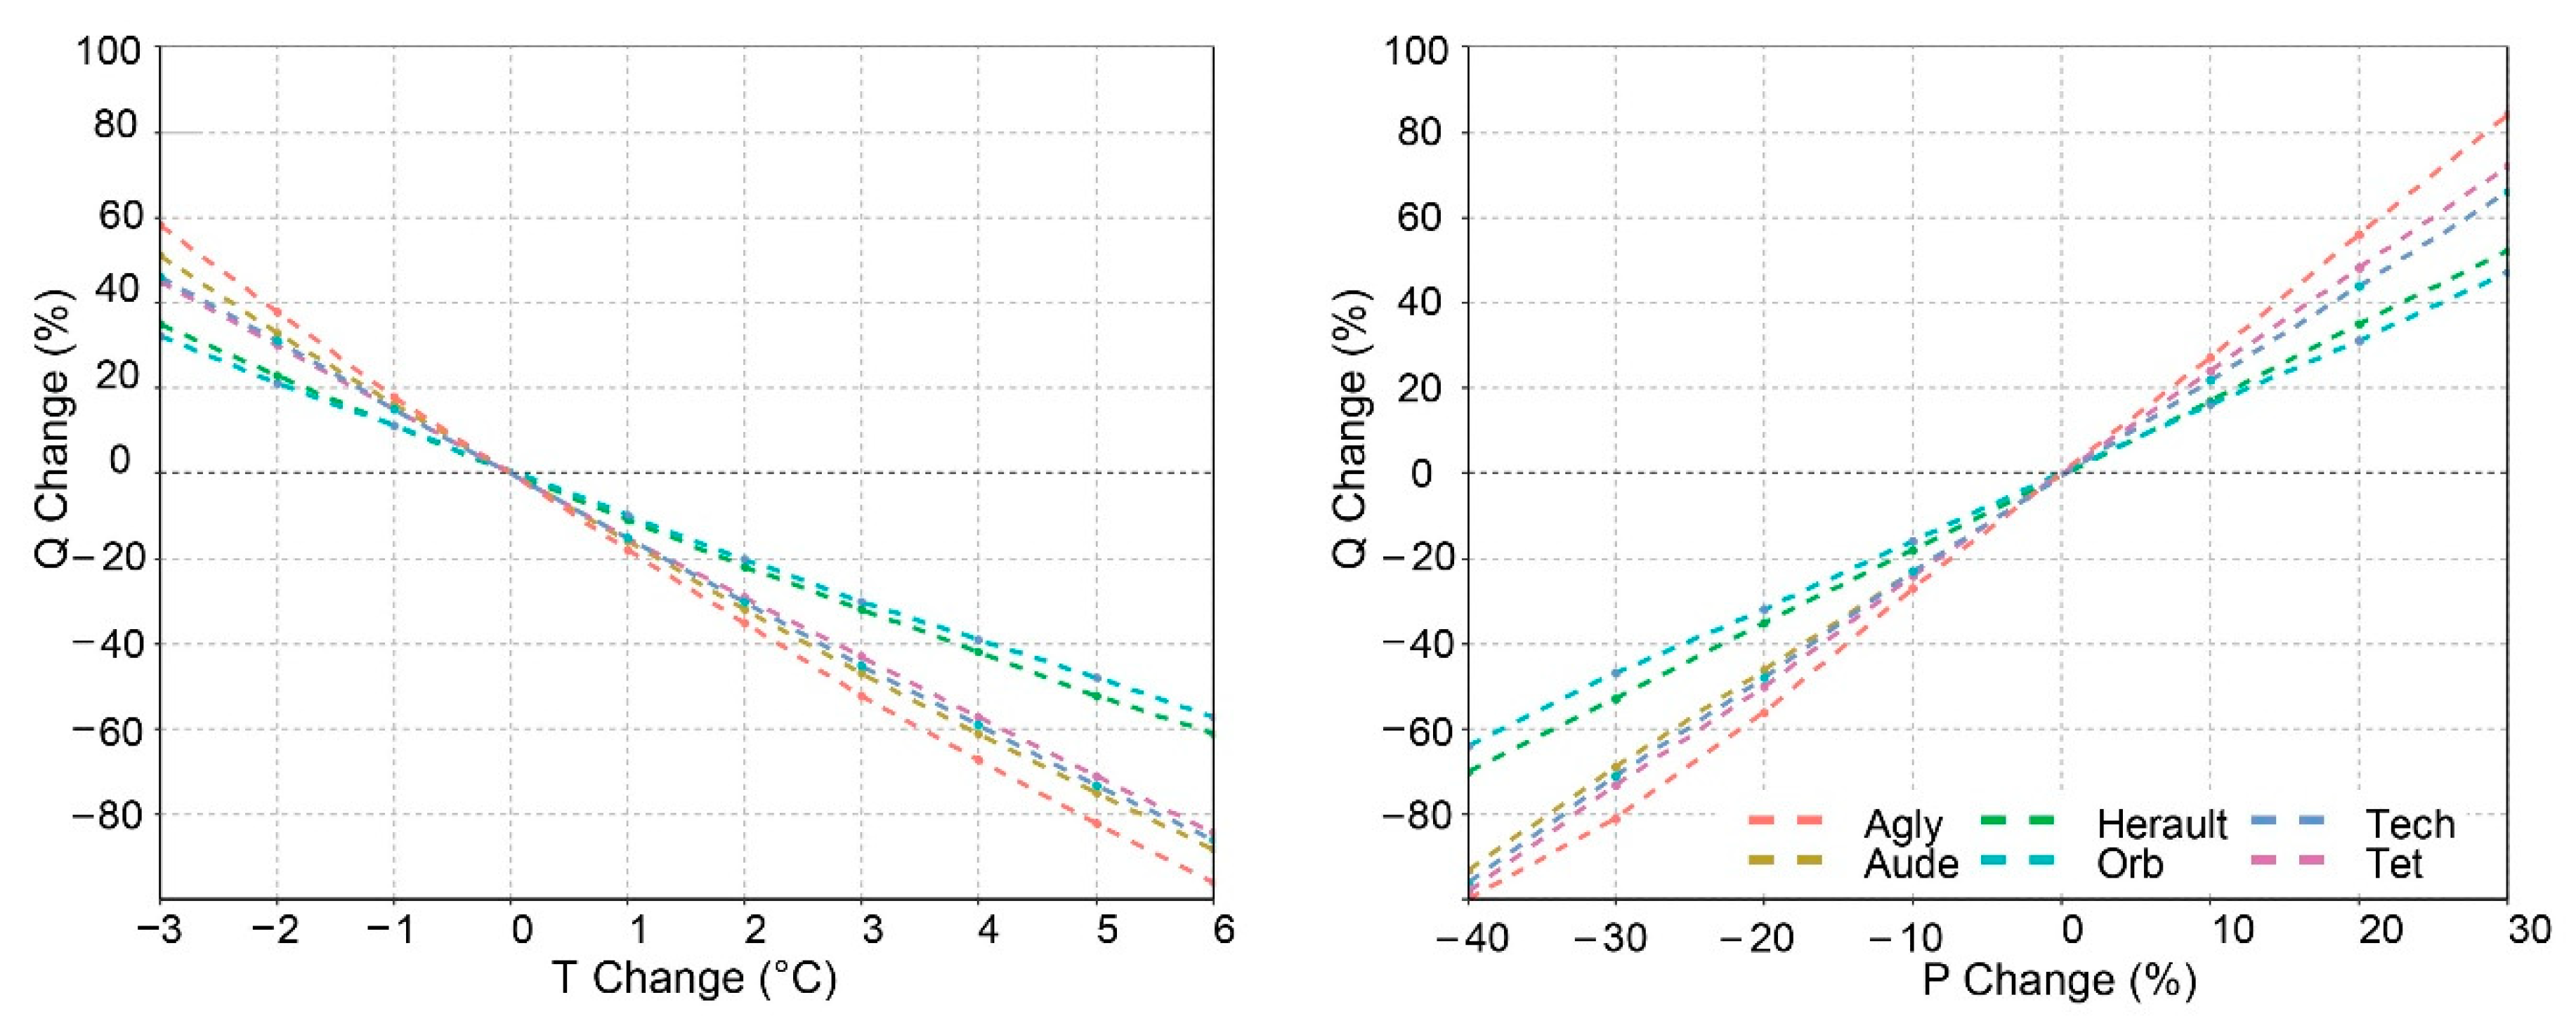
These tests indicate that average water discharge in the study catchments is significantly reacting to temperature changes (Figure 7). According to our results, the temperature trends we detected during the study period (Figure 4a) could account for a −18% (Orb) to −27% (Tech) decrease of annual water discharge. This is in the same order as a generalized precipitation decrease by −10% (which would provoke a −17% (Orb) to −29% (Agly) decrease in water discharge). When averaged over all study catchments, the detected temperature increases could account for a water discharge decrease of almost 25%. Figure 7 also illustrates that both the larger Orb and Herault catchments in the North are obviously less reactive to P and T changes, whereas reactivity is greatest in the catchment of the Agly River. This river can have intermittent water flow in relation to water filtration to the karst groundwaters [70]. When averaged over all catchments, and weighted by the respective average discharge volumes, temperature alone could consequently be responsible for a decrease in surface water resources in the study region of −23%.
The sensitivity tests we performed could also be used in order to project the evolution of surface water resources under future climate conditions. When combining a hydrological model (GR2M) with climatic simulations for the end of the 21st century from a series of Regional Climate Models, Lespinas et al. [15] concluded that in a worst case scenario (a 4.3–4.5 °C warming together with a 10–16% precipitation decrease), average water discharge in the Tet, Orb and Herault rivers could decrease by about 85%, 83% and 71%, respectively. According to our sensitivity tests, the corresponding values are 83%, 63% and 71%. In agreement with our findings, the authors also concluded that temperature increase should have an important impact on water discharge, a fact that might have been overlooked in the parametrizations of hydrological models and earlier climate change impact studies.
4.4. Model Limitations
Empirical models depend on the quality of the input data used to fit the models. Based on the correlations between water discharge and climate indices, our results clearly suggest that climate is the major driver of the long term evolution of water discharge in the study region. Land use and water management patterns are characterized by abandonment of agricultural activities and, rather, show antagonistic trends in terms of anthropogenic water withdrawal. However, these latter data only exist in coarser spatial and shorter temporal resolutions compared to climate data, which reduces their usability in statistical analyses. Further collection of more detailed data as well as continuous acquisition of appropriate remote sensing data are therefore still necessary in order to investigate anthropogenic impacts on water resources.
Another major outcome of our analysis is the significant influence of temperature on the evolution of surface water resources in the study catchments. Statistical fits of the evolution of a few key parameters to the evolution of annual water discharge have the advantage that they easily allows testing of the relative importance of each of these parameters in the detected changes. This is difficult with sophisticated hydrological models for which the deconvolution of the respective impacts of each of the input parameters is often complicated. However, also here it has to be kept in mind that the sensitivity tests we performed are based on simplifications which ignore parameter interactions that can exist in reality. Connection of potential evaporation to temperature data alone may be considered as one of these simplifications. Another inconvenience of our sensitivity tests is that they do not take into account seasonal modifications in the evolution of climate, which are expected to occur in the future and which were already observed in the past. Moreover, projecting these changes to extreme values such as temperature increases of several degrees may also ignore profound modifications in terms of vegetation cover and/or other land use patterns which may accompany future climate change and which may also alter the general hydrological functioning of drainage basins.
5. Conclusions
Analysis of trends in hydrological time series during recent decades indicates a strong decrease in water discharge of about 30–45% in the studied river catchments. In the context of climate change, which is expected to severely impact surface water resources in the Mediterranean area, such large numbers naturally raise the question of whether these trends are representative also for future evolution, and whether they are dominated by climate change and/or by anthropogenic activities in the drainage basins. Statistical analyses of hydrological, climate, land use and water management data allowed us to respond to both questions. Although the natural and anthropogenic drainage basin characteristics of the six coastal rivers we studied can be significantly different, all rivers have in common that their annual water discharge values can be predicted with high confidence by only two climate indices, exclusively calculated from monthly precipitation and temperature data. This is a strong argument that climate is clearly the dominant driver of water discharge trends in the study region. It is also corroborated by the fact that land use changes are dominated by a general evolution towards less irrigation and the abandonment of agricultural activities, which decrease anthropogenic water withdrawal.
However, simple projection of the detected water discharge trends to future climate conditions should naturally be done with caution. Trends are influenced by natural and man-induced variability of climate and, without unravelling the influence of both, it is difficult to project the expected changes in future warming scenarios. Our simple statistical models also have an advantage over more sophisticated hydrological models, since they easily allow individual testing of the potential role of T and P in the detected changes. With respect to future changes of P, there still exists considerable uncertainty in future climate modelling scenarios. Our hindcasting analysis of P also revealed that the evolution of P is generally characterized by large variability, and trends which are only weakly significant. However, there is little doubt that the warming trend we detected in the study region is related to ongoing climate change, characterized by a marked onset in the temperature evolution since the early 1980s, in agreement with what has also occurred in many other places in the world. Probably for the first time, we have clearly demonstrated that this warming trend alone should have reduced the surface water resources in the study region by almost 25%.
It therefore becomes evident that the ongoing warming trends might rapidly conflict with sustainable water use in the study catchments. Although during the last 30 years agricultural water use decreased, it is likely that sustainable agricultural land use in the future is not possible without further access to surface water resources. This is particularly true for vineyards, the land use type which actually shows the strongest decline. This might only be stopped by irrigation. On the other hand, surface water extractions for drinking water could also increase in response to an increasing demand and the over-exploitation of groundwater reservoirs.
Supplementary Materials
The following are available online at https://www.mdpi.com/2073-4441/12/12/3581/s1, Table S1: Hydrological station data considered in this study. Table S2: Results of Sen’s slope and Mann-Kendall test p-value for each hydro-climatic parameter whenever they are non-significant (normal format) or significant (underlined: p-value < 0.1, and bold: p-value < 0.05). Figure S1. Evolution of annual temperatures (a), potential evapotranspiration (b), and annual precipitations (c). Figure S2. Comparison between the Safran climate data considered in this study and the climate station data processed by Lespinas et al., 2009: (a) evolution of precipitation, (b) evolution of temperatures, (c) linear temperature trends for the period 1965–2004. Figure S3. Correlation matrixes of hydro-climatic parameters for the six study catchments. Figure S4. (a) Evolution of major land use types between 1990 and 2018; (b) evolution of agricultural land use types between 1990 and 2018. Figure S5. Evolution of average NDVI values in each basin from 1982 to 2015.
Author Contributions
Conceptualization, methodology, and writing, C.L., W.L., S.P., M.S., G.L.; analyses, C.L., W.L., S.P., M.S.; funding acquisition, W.L., G.L. All authors have read and agreed to the published version of the manuscript.
Funding
This study was supported by the doctoral school ED 305 at UPVD through the attribution of a PhD grant to CL. Funding was also provided by the Interreg V-A POCTEFA HAMELIN EFA335/19 project. The project has been 65% co-financed by the European Regional Development Fund (ERDF) through the Interreg V-A Spain France Andorra programme (POCTEFA 2014-2020). POCTEFA aims to reinforce the economic and social integration of the French–Spanish–Andorran border. Its support is focused on developing economic, social and environmental cross-border activities through joint strategies favouring sustainable territorial development.
Acknowledgments
We are especially grateful to Météo-France for supply of the Safran-Isba climate data in the framework of the Publithèque agreement between MF and UPVD.
Conflicts of Interest
The authors declare no conflict of interest.
References
- Giorgi, F.; Lionello, P. Climate change projections for the Mediterranean region. Glob. Planet. Chang. 2008, 63, 90–104. [Google Scholar] [CrossRef]
- Giorgi, F. Climate change hot-spots. Geophys. Res. Lett. 2006, 33. [Google Scholar] [CrossRef]
- Lionello, P.; Malanotte-Rizzoli, P.; Boscolo, R. Mediterranean Climate Variability; Elsevier: Amsterdam, The Netherlands, 2006. [Google Scholar]
- Lionello, P. The Climate of the Mediterranean Region: From the Past to the Future; Elsevier: Amsterdam, The Netherlands, 2012. [Google Scholar]
- Lionello, P.; Scarascia, L. The relation between climate change in the Mediterranean region and global warming. Reg. Environ. Chang. 2018, 18, 1481–1493. [Google Scholar] [CrossRef]
- Luterbacher, J.; Xoplaki, E.; Casty, C.; Wanner, H.; Pauling, A.; Küttel, M.; Rutishauser, T.; Brönnimann, S.; Fischer, E.; Fleitmann, D.; et al. Chapter 1 Mediterranean climate variability over the last centuries: A review. Dev. Earth Environ. Sci. 2006, 4, 27–148. [Google Scholar] [CrossRef]
- Cudennec, C.; LeDuc, C.; Koutsoyiannis, D. Dryland hydrology in Mediterranean regions—A review. Hydrol. Sci. J. 2007, 52, 1077–1087. [Google Scholar] [CrossRef]
- García-Ruiz, J.M.; López-Moreno, J.I.; Vicente-Serrano, S.M.; Lasanta–Martínez, T.; Beguería, S. Mediterranean water resources in a global change scenario. Earth Sci. Rev. 2011, 105, 121–139. [Google Scholar] [CrossRef] [Green Version]
- Merheb, M.; Moussa, R.; Abdallah, C.; Colin, F.; Perrin, C.; Baghdadi, N. Hydrological response characteristics of Mediterranean catchments at different time scales: A meta-analysis. Hydrol. Sci. J. 2016, 61, 2520–2539. [Google Scholar] [CrossRef] [Green Version]
- Masseroni, D.; Camici, S.; Cislaghi, A.; Vacchiano, G.; Massari, C.; Brocca, L. 65-year changes of annual streamflow volumes across Europe with a focus on the Mediterranean basin. Hydrol. Earth Syst. Sci. 2020, 1–16. [Google Scholar] [CrossRef] [Green Version]
- Ludwig, W.; Serrat, P.; Cesmat, L.; Garcia-Esteves, J. Evaluating the impact of the recent temperature increase on the hydrology of the Têt River (Southern France). J. Hydrol. 2004, 289, 204–221. [Google Scholar] [CrossRef]
- Lespinas, F.; Ludwig, W.; Heussner, S. Impact of recent climate change on the hydrology of coastal Mediterranean rivers in Southern France. Clim. Chang. 2010, 99, 425–456. [Google Scholar] [CrossRef]
- Morán-Tejeda, E.; López-Moreno, J.I.; Barbancho, A.C.; Vicente-Serrano, S.M. River regimes and recent hydrological changes in the Duero basin (Spain). J. Hydrol. 2011, 404, 241–258. [Google Scholar] [CrossRef]
- Blöschl, G.; Hall, J.; Viglione, A.; Perdigão, R.A.P.; Parajka, J.; Merz, B.; Lun, D.; Arheimer, B.; Aronica, G.T.; Bilibashi, A.; et al. Changing climate both increases and decreases European river floods. Nat. Cell Biol. 2019, 573, 108–111. [Google Scholar] [CrossRef] [PubMed]
- Lespinas, F.; Ludwig, W.; Heussner, S. Hydrological and climatic uncertainties associated with modeling the impact of climate change on water resources of small Mediterranean coastal rivers. J. Hydrol. 2014, 511, 403–422. [Google Scholar] [CrossRef]
- Thirel, G.; Andréassian, V.; Perrin, C. On the need to test hydrological models under changing conditions. Hydrol. Sci. J. 2015, 60, 1165–1173. [Google Scholar] [CrossRef]
- Insee—Statistiques Locales—Indicateurs: Cartes, Données et Graphiques. Available online: https://statistiques-locales.insee.fr/#c=indicator&i=pop_legales.popmun_&s=2017&view=map2 (accessed on 30 September 2020).
- Durand, Y.; Giraud, G.; Brun, E.; Mérindol, L.; Martin, E. A computer-based system simulating snowpack structures as a tool for regional avalanche forecasting. J. Glaciol. 1999, 45, 469–484. [Google Scholar] [CrossRef] [Green Version]
- Durand, Y.; Brun, E.; Merindol, L.; Guyomarc’h, G.; Lesaffre, B.; Martin, E. A meteorological estimation of relevant parameters for snow models. Ann. Glaciol. 1993, 18, 65–71. [Google Scholar] [CrossRef] [Green Version]
- Quintana-Seguí, P.; Le Moigne, P.; Durand, Y.; Martin, E.; Habets, F.; Baillon, M.; Canellas, C.; Franchistéguy, L.; Morel, S. Analysis of Near-Surface Atmospheric Variables: Validation of the SAFRAN Analysis over France. J. Appl. Meteorol. Clim. 2008, 47, 92–107. [Google Scholar] [CrossRef]
- Cartridge Database. Vinyl Engine. Available online: https://www.vinylengine.com/cartridge_database.php (accessed on 30 September 2020).
- Vidal, J.; Martin, E.; Franchistéguy, L.; Baillon, M.; Soubeyroux, J.M. A 50-year high-resolution atmospheric reanalysis over France with the Safran system. Int. J. Clim. 2010, 30, 1627–1644. [Google Scholar] [CrossRef] [Green Version]
- Fournier, F. Climat et Érosion; Presses Universitaires de France: Paris, France, 1960; p. 201. [Google Scholar]
- Walsh, R.P.D.; Lawler, D.M. Rainfall seasonality: Description, spatial patterns and change through time. Weather 1981, 36, 201–208. [Google Scholar] [CrossRef]
- McKee, T.B. The relationship of drought frequency and duration to time scales. In Proceedings of the Eighth Conference on Applied Climatology, Anaheim, CA, USA, 17–22 January 1993. [Google Scholar]
- Vicente-Serrano, S.M.; Beguería, S.; López-Moreno, J.I. A Multiscalar Drought Index Sensitive to Global Warming: The Standardized Precipitation Evapotranspiration Index. J. Clim. 2010, 23, 1696–1718. [Google Scholar] [CrossRef] [Green Version]
- Tsakiris, G.; Pangalou, D.; Vangelis, H. Regional Drought Assessment Based on the Reconnaissance Drought Index (RDI). Water Resour. Manag. 2007, 21, 821–833. [Google Scholar] [CrossRef]
- Chapter 2—FAO Penman-Monteith Equation. Available online: http://www.fao.org/3/X0490E/x0490e06.htm (accessed on 30 July 2020).
- Venkataraman, K.; Nelson, M.; Frandsen, C. Comparison of Two Temperature-Based Methods of Estimating Potential Evapotranspiration (PET) in Texas. World Environ. Water Resour. Congr. 2016 2016, 699–708. [Google Scholar] [CrossRef]
- Oudin, L.; Hervieu, F.; Michel, C.; Perrin, C.; Andréassian, V.; Anctil, F.; Loumagne, C. Which potential evapotranspiration input for a lumped rainfall–runoff model?: Part 2—Towards a simple and efficient potential evapotranspiration model for rainfall–runoff modelling. J. Hydrol. 2005, 303, 290–306. [Google Scholar] [CrossRef]
- Folton, N.; Lavabre, J. Approche par modélisation PLUIE-DEBIT pour la connaissance régionale de la ressource en eau: Application à la moitié du territoire français. Houille Blanche 2007, 3, 64–70. [Google Scholar] [CrossRef]
- Hydroweb. Available online: http://www.hydro.eaufrance.fr/ (accessed on 30 September 2020).
- Quintana-Seguí, P.; Ribes, A.; Martin, E.; Habets, F.; Boé, J. Comparison of three downscaling methods in simulating the impact of climate change on the hydrology of Mediterranean basins. J. Hydrol. 2010, 383, 111–124. [Google Scholar] [CrossRef] [Green Version]
- Quintana Seguí, P.; Martin, E.; Habets, F.; Noilhan, J. Improvement, calibration and validation of a distributed hydrological model over France. Hydrol. Earth Syst. Sci. 2009, 13, 163–181. [Google Scholar] [CrossRef]
- Sadaoui, M.; Ludwig, W.; Bourrin, F.; Romero, E. The impact of reservoir construction on riverine sediment and carbon fluxes to the Mediterranean Sea. Prog. Oceanogr. 2018, 163, 94–111. [Google Scholar] [CrossRef]
- Ludwig, W.; Dumont, E.; Meybeck, M.; Heussner, S. River discharges of water and nutrients to the Mediterranean and Black Sea: Major drivers for ecosystem changes during past and future decades? Prog. Oceanogr. 2009, 80, 199–217. [Google Scholar] [CrossRef]
- Copernicus Land Monitoring Service. Corine Land Cover (CLC). Available online: https://land.copernicus.eu/pan-european/corine-land-cover (accessed on 31 July 2020).
- Acces-Donnees|BNPE. Available online: https://bnpe.eaufrance.fr/acces-donnees (accessed on 21 October 2020).
- Chiffres et Analyses|Agreste, la Statistique Agricole. Available online: https://agreste.agriculture.gouv.fr/agreste-web/disaron/irrigation/5b74baf2-991c-41ae-a920-02217b25d182/search/ (accessed on 9 July 2020).
- The Climate Data Guide. NDVI: Normalized Difference Vegetation Index-3rd Generation: NASA/GFSC GIMMS; National Center for Atmospheric Research Staff, 2018; Available online: https://climatedataguide.ucar.edu/climate-data/ndvi-normalized-difference-vegetation-index-3rd-generation-nasagfsc-gimms (accessed on 20 December 2020).
- Mann, H.B. Nonparametric tests against trend. Econometrica 1945, 13, 245–259. [Google Scholar] [CrossRef]
- Kendall, M.G. Rank correlation methods. Econometrica 1948, 25, 181–183. [Google Scholar] [CrossRef]
- Sen, P.K. Estimates of the regression coefficient based on Kendall’s Tau. J. Am. Stat. Assoc. 1968, 63, 1379–1389. [Google Scholar] [CrossRef]
- Kundzewicz, Z. Detecting Trend and Other Changes in Hydrological Data; World Meteorological Organization: Geneva, Switzerland, 2000. [Google Scholar]
- Fathian, F.; Dehghan, Z.; Bazrkar, M.H.; Eslamian, S. Trends in hydrological and climatic variables affected by four variations of the Mann-Kendall approach in Urmia Lake basin, Iran. Hydrol. Sci. J. 2016, 61, 892–904. [Google Scholar] [CrossRef] [Green Version]
- Ali, R.; Kuriqi, A.; Abubaker, S.; Kisi, O. Long-Term Trends and Seasonality Detection of the Observed Flow in Yangtze River Using Mann-Kendall and Sen’s Innovative Trend Method. Water 2019, 11, 1855. [Google Scholar] [CrossRef] [Green Version]
- Pearson, E.S. The Test of Significance for the Correlation Coefficient. J. Am. Stat. Assoc. 1931, 26, 128–134. [Google Scholar] [CrossRef]
- Garcia-Esteves, J.; Ludwig, W.; Kerhervé, P.; Probst, J.-L.; Lespinas, F. Predicting the impact of land use on the major element and nutrient fluxes in coastal Mediterranean rivers: The case of the Têt River (Southern France). Appl. Geochem. 2007, 22, 230–248. [Google Scholar] [CrossRef] [Green Version]
- Ruf, T. Droits d’eau et institutions communautaires dans les Pyrénées-Orientales. Hist. Soc. Rural. 2001, 16, 11–44. [Google Scholar] [CrossRef]
- AR5 Synthesis Report: Climate Change 2014—IPCC. Available online: https://www.ipcc.ch/report/ar5/syr/ (accessed on 12 October 2020).
- Occitanie, D. DONNÉES. Available online: https://draaf.occitanie.agriculture.gouv.fr/DONNEES (accessed on 15 October 2020).
- Spadoni, G.L.; Cavalli, A.; Congedo, L.; Munafò, M. Analysis of Normalized Difference Vegetation Index (NDVI) multi-temporal series for the production of forest cartography. Remote Sens. Appl. Soc. Environ. 2020, 20, 100419. [Google Scholar] [CrossRef]
- Townshend, J.R.G.; Justice, C. Analysis of the dynamics of African vegetation using the normalized difference vegetation index. Int. J. Remote Sens. 1986, 7, 1435–1445. [Google Scholar] [CrossRef]
- Khorchani, M.; Nadal-Romero, E.; Tague, C.; Lasanta, T.; Zabalza, J.; Lana-Renault, N.; Domínguez-Castro, F.; Choate, J. Effects of active and passive land use management after cropland abandonment on water and vegetation dynamics in the Central Spanish Pyrenees. Sci. Total Environ. 2020, 717, 137160. [Google Scholar] [CrossRef]
- Juez, C.; Peña-Angulo, D.; Khorchani, M.; Regüés, D.; Nadal-Romero, E. 20-years of hindsight into hydrological dynamics of a mountain forest catchment in the Central Spanish Pyrenees. Sci. Total Environ. 2020, 142610. [Google Scholar] [CrossRef]
- Susskind, J.; Schmidt, G.A.; Lee, J.N.; Iredell, L. Recent global warming as confirmed by AIRS. Environ. Res. Lett. 2019, 14, 044030. [Google Scholar] [CrossRef]
- Piervitali, E.; Colacino, M.; Conte, M. Rainfall over the Central-Western Mediterranean basin in the period 1951-1995. Part I: Precipitation trends. Nuovo Cim. 1998, 21, 331–344. Available online: http://www.sif.it/riviste/ncc/econtents/1998/021/03/article/1 (accessed on 18 October 2020).
- Valdes-Abellan, J.; Pardo, M.; Tenza-Abril, A.J. Observed precipitation trend changes in the western Mediterranean region. Int. J. Clim. 2017, 37, 1285–1296. [Google Scholar] [CrossRef]
- Romano, E.; Petrangeli, A.B.; Preziosi, E. Spatial and Time Analysis of Rainfall in the Tiber River Basin (Central Italy) in relation to Discharge Measurements (1920–2010). Procedia Environ. Sci. 2011, 7, 258–263. [Google Scholar] [CrossRef] [Green Version]
- Lorenzo-Lacruz, J.; Serrano, S.M.V.; López-Moreno, J.I.; Morán-Tejeda, E.; Zabalza, J. Recent trends in Iberian streamflows (1945–2005). J. Hydrol. 2012, 463–475. [Google Scholar] [CrossRef]
- López-Moreno, J.I.; Vicente-Serrano, S.M. Atmospheric circulation influence on the interannual variability of snow pack in the Spanish Pyrenees during the second half of the 20th century. Hydrol. Res. 2007, 38, 33–44. [Google Scholar] [CrossRef] [Green Version]
- Martínez-Fernández, J.; Sánchez, N.; Herrero-Jiménez, C.M. Recent trends in rivers with near-natural flow regime. Prog. Phys. Geogr. Earth Environ. 2013, 37, 685–700. [Google Scholar] [CrossRef]
- Lespinas, F. Impacts du Changement Climatique sur L’hydrologie des Fleuves Côtiers en Region Languedoc-Roussillon. Ph.D. Thesis, University of Perpignan, Perpignan, France, 2008. Available online: https://www.theses.fr/2008PERP1261 (accessed on 2 November 2020).
- Creed, I.F.; Hwang, T.; Lutz, B.; Way, D. Climate warming causes intensification of the hydrological cycle, resulting in changes to the vernal and autumnal windows in a northern temperate forest. Hydrol. Process. 2015, 29, 3519–3534. [Google Scholar] [CrossRef]
- Ludwig, W.; Bouwman, A.F.; Dumont, E.; Lespinas, F. Water and nutrient fluxes from major Mediterranean and Black Sea rivers: Past and future trends and their implications for the basin-scale budgets. Glob. Biogeochem. Cycles 2010, 24. [Google Scholar] [CrossRef]
- Afzal, M.; Ragab, R. Assessment of the potential impacts of climate change on the hydrology at catchment scale: Modelling approach including prediction of future drought events using drought indices. Appl. Water Sci. 2020, 10, 1–19. [Google Scholar] [CrossRef]
- Schulz, S.; Darehshouri, S.; Hassanzadeh, E.; Tajrishy, M.; Schüth, C. Climate change or irrigated agriculture—What drives the water level decline of Lake Urmia. Sci. Rep. 2020, 10, 816–821. [Google Scholar] [CrossRef] [PubMed] [Green Version]
- Gudmundsson, L.; Tallaksen, L.M.; Stahl, K.; Clark, D.B.; Dumont, E.; Hagemann, S.; Bertrand, N.; Gerten, D.; Heinke, J.; Hanasaki, N.; et al. Comparing Large-Scale Hydrological Model Simulations to Observed Runoff Percentiles in Europe. J. Hydrometeorol. 2012, 13, 604–620. [Google Scholar] [CrossRef]
- Thompson, J.R.; Gavin, H.; Refsgaard, A.; Sørenson, H.R.; Gowing, D.J.G. Modelling the hydrological impacts of climate change on UK lowland wet grassland. Wetl. Ecol. Manag. 2009, 17, 503–523. [Google Scholar] [CrossRef] [Green Version]
- Petelet-Giraud, E.; Luck, J.-M.; Ben Othman, D.; Negrel, P. Dynamic scheme of water circulation in karstic aquifers as constrained by Sr and Pb isotopes. Application to the Hérault watershed, Southern France. Hydrogeol. J. 2003, 11, 560–573. [Google Scholar] [CrossRef]
Figure 1.
Location of the six study catchments with corresponding gauging stations.

Figure 2.
Pearson squared correlation matrix of basic climatic parameters in the Herault watershed.

Figure 3.
Performance of regression models for observed annual water discharge (Qobs) and (a) precipitation, (b) precipitation and temperature, (c) Qpike and (d) Qpike and Reconnaissance Drought Index (RDI) for the six study catchments.
Figure 3.
Performance of regression models for observed annual water discharge (Qobs) and (a) precipitation, (b) precipitation and temperature, (c) Qpike and (d) Qpike and Reconnaissance Drought Index (RDI) for the six study catchments.

Figure 4.
Linear trends during the period 1959–2018 of (a) annual temperatures T, (b) annual potential evapotranspiration PET (in brackets PETt), (c) annual precipitation totals P, (d) Water discharge based on Qmod (in brackets Qs).
Figure 4.
Linear trends during the period 1959–2018 of (a) annual temperatures T, (b) annual potential evapotranspiration PET (in brackets PETt), (c) annual precipitation totals P, (d) Water discharge based on Qmod (in brackets Qs).

Figure 5.
Annual evolution of observed water discharge (Qobs, black line), of modeled water discharge according to Safran (Qs, red line) and modeled water discharge according to our study (Qmod, blue line).
Figure 5.
Annual evolution of observed water discharge (Qobs, black line), of modeled water discharge according to Safran (Qs, red line) and modeled water discharge according to our study (Qmod, blue line).

Figure 6.
Linear trends for modeled water discharge (all empirical models of Figure 3, Qs) in comparison of linear trends of observed water discharge (Qobs). The analyzed time periods are variable and correspond to the periods covered by Qobs (max. number of 59 years for the Herault River and min. number of 43 years for the Tet River).

Figure 7.
Sensitivity of water discharge for each river to p and T changes.


Table 1.
Average hydro-climatic characteristics of each watershed.
| Basin | Number of Years | Area Basin (km2) | Mean Elevation (m) | Annual Temperature (°C) | Annual Rainfall (mm) | Snowfall (%) | PET (mm) | Qobs (mm) | Qs (mm) | Qpike (mm) | Agriculture (mm) * | Drinking Water (mm) * |
|---|---|---|---|---|---|---|---|---|---|---|---|---|
| Herault | 59 | 2550 | 367 | 12.6 | 1103 | 2.4 | 1023 | 518 | 537 | 381 | 23 | 0 |
| Orb | 53 | 1330 | 444 | 12.6 | 1013 | 2.4 | 1003 | 615 | 462 | 324 | 29 | 9 |
| Aude | 50 | 4838 | 462 | 12.2 | 838 | 7.2 | 978 | 263 | 296 | 215 | 29 | 2 |
| Agly | 52 | 903 | 508 | 12.6 | 802 | 5.5 | 1045 | 191 | 277 | 183 | 60 | 1 |
| Tet | 49 | 1300 | 1061 | 10.1 | 802 | 20.7 | 1017 | 228 | 293 | 187 | 186 | 11 |
| Tech | 43 | 729 | 778 | 11.7 | 998 | 9.4 | 1046 | 370 | 386 | 295 | 76 | 2 |
PET = potential evapotranspiration; Qobs = observed water discharge data. * average water withdrawal between the years 2012 and 2018.
Table 2.
(a) Percentage (1990–2018 average) of major land use categories for each watershed. Note that “Other” refers to the open spaces, wetlands and water bodies, which correspond to the CORINE subclasses 3.3, 4.1, 4.2, 5.1, and 5.2 (b) Percentage of agricultural land use types for each watershed.
| Basin | Artificial Area | Forest | Agricultural Lands | Herbaceous Vegetation | Other |
| Tech | 3.25 | 60 | 18.5 | 15.8 | 2.5 |
| Tet | 3.05 | 37 | 20 | 33.7 | 6.3 |
| Agly | 1.7 | 34.35 | 27 | 35.4 | 1.6 |
| Aude | 2.75 | 32.5 | 48.5 | 15.4 | 0.9 |
| Orb | 4 | 48.8 | 30.5 | 14.85 | 1.85 |
| Herault | 2.8 | 30.8 | 31.5 | 33.4 | 1.5 |
| (a) | |||||
| Basin | Arable Land | Vineyards | Fruit and Olive Trees | Pastures | Heterogeneous Areas |
| Tech | 1.1 | 37.3 | 8.3 | 6.5 | 46.9 |
| Tet | 0.4 | 31.8 | 24.5 | 6.1 | 37.3 |
| Agly | 0 | 71.2 | 0.1 | 3.9 | 24.8 |
| Aude | 16.2 | 53.4 | 0.2 | 6.2 | 23.5 |
| Orb | 1.2 | 58.9 | 0.4 | 4.4 | 35.1 |
| Herault | 2.5 | 64.8 | 0.3 | 6.3 | 26.2 |
| (b) | |||||
Table 3.
Correlation and regression coefficients for the multiple regression models of Qobs as a function of Qpike and of RDI for the six study catchments: (a) potential evapotranspiration taken from Safran (PET) and (b) potential evapotranspiration derived from temperature (PETt).
Table 3.
Correlation and regression coefficients for the multiple regression models of Qobs as a function of Qpike and of RDI for the six study catchments: (a) potential evapotranspiration taken from Safran (PET) and (b) potential evapotranspiration derived from temperature (PETt).
| Basin | Qpike | RDI | Intercept | r2 | n |
| Herault | 0.7183 | 96.9 | 244 | 0.85 | 59 |
| Orb | 0.8531 | 95.5 | 346 | 0.84 | 53 |
| Aude | 0.6041 | 55.1 | 135 | 0.81 | 50 |
| Agly | 0.7829 | 50.4 | 51 | 0.88 | 52 |
| Tet | 0.6930 | 66.1 | 104 | 0.85 | 49 |
| Tech | 0.6847 | 104.0 | 179 | 0.76 | 43 |
| (a) | |||||
| Basin | Qpike | RDI | Intercept | r2 | n |
| Herault | 0.7173 | 95.6 | 243 | 0.84 | 59 |
| Orb | 0.8184 | 109.9 | 356 | 0.85 | 53 |
| Aude | 0.5613 | 63.6 | 143 | 0.83 | 50 |
| Agly | 0.7723 | 54.0 | 53 | 0.88 | 52 |
| Tet | 0.6644 | 72.1 | 111 | 0.86 | 49 |
| Tech | 0.6354 | 121.4 | 198 | 0.78 | 43 |
| (b) | |||||
Publisher’s Note: MDPI stays neutral with regard to jurisdictional claims in published maps and institutional affiliations. |
© 2020 by the authors. Licensee MDPI, Basel, Switzerland. This article is an open access article distributed under the terms and conditions of the Creative Commons Attribution (CC BY) license (http://creativecommons.org/licenses/by/4.0/).
Share and Cite
MDPI and ACS Style
Labrousse, C.; Ludwig, W.; Pinel, S.; Sadaoui, M.; Lacquement, G. Unravelling Climate and Anthropogenic Forcings on the Evolution of Surface Water Resources in Southern France. Water 2020, 12, 3581. https://doi.org/10.3390/w12123581
AMA Style
Labrousse C, Ludwig W, Pinel S, Sadaoui M, Lacquement G. Unravelling Climate and Anthropogenic Forcings on the Evolution of Surface Water Resources in Southern France. Water. 2020; 12(12):3581. https://doi.org/10.3390/w12123581
Chicago/Turabian StyleLabrousse, Camille, Wolfgang Ludwig, Sébastien Pinel, Mahrez Sadaoui, and Guillaume Lacquement. 2020. "Unravelling Climate and Anthropogenic Forcings on the Evolution of Surface Water Resources in Southern France" Water 12, no. 12: 3581. https://doi.org/10.3390/w12123581
Note that from the first issue of 2016, this journal uses article numbers instead of page numbers. See further details here.