Assessment of Landscape Retention Water Capacity and Hydrological Balance in Traditional Agricultural Landscape (Model Area Liptovská Teplička Settlements, Slovakia)

 , ,
, ,
Abstract
:1. Introduction
- We expect that the study area will have a medium-to-high LWRC, as calculated on the basis of mapped and measured attributes of abiotic conditions and detailed mapping of the current use of the agrarian part of the cadastral area Liptovská Teplička; we shall verify the LWRC calculations by selected methodological procedures;
- We intend to use hydrological balance methods (empirically based procedures for estimating the amount of surface runoff) to determine the real volumes of water retained in the country, the amount of runoff from the territory, and the amount of evapotranspiration.
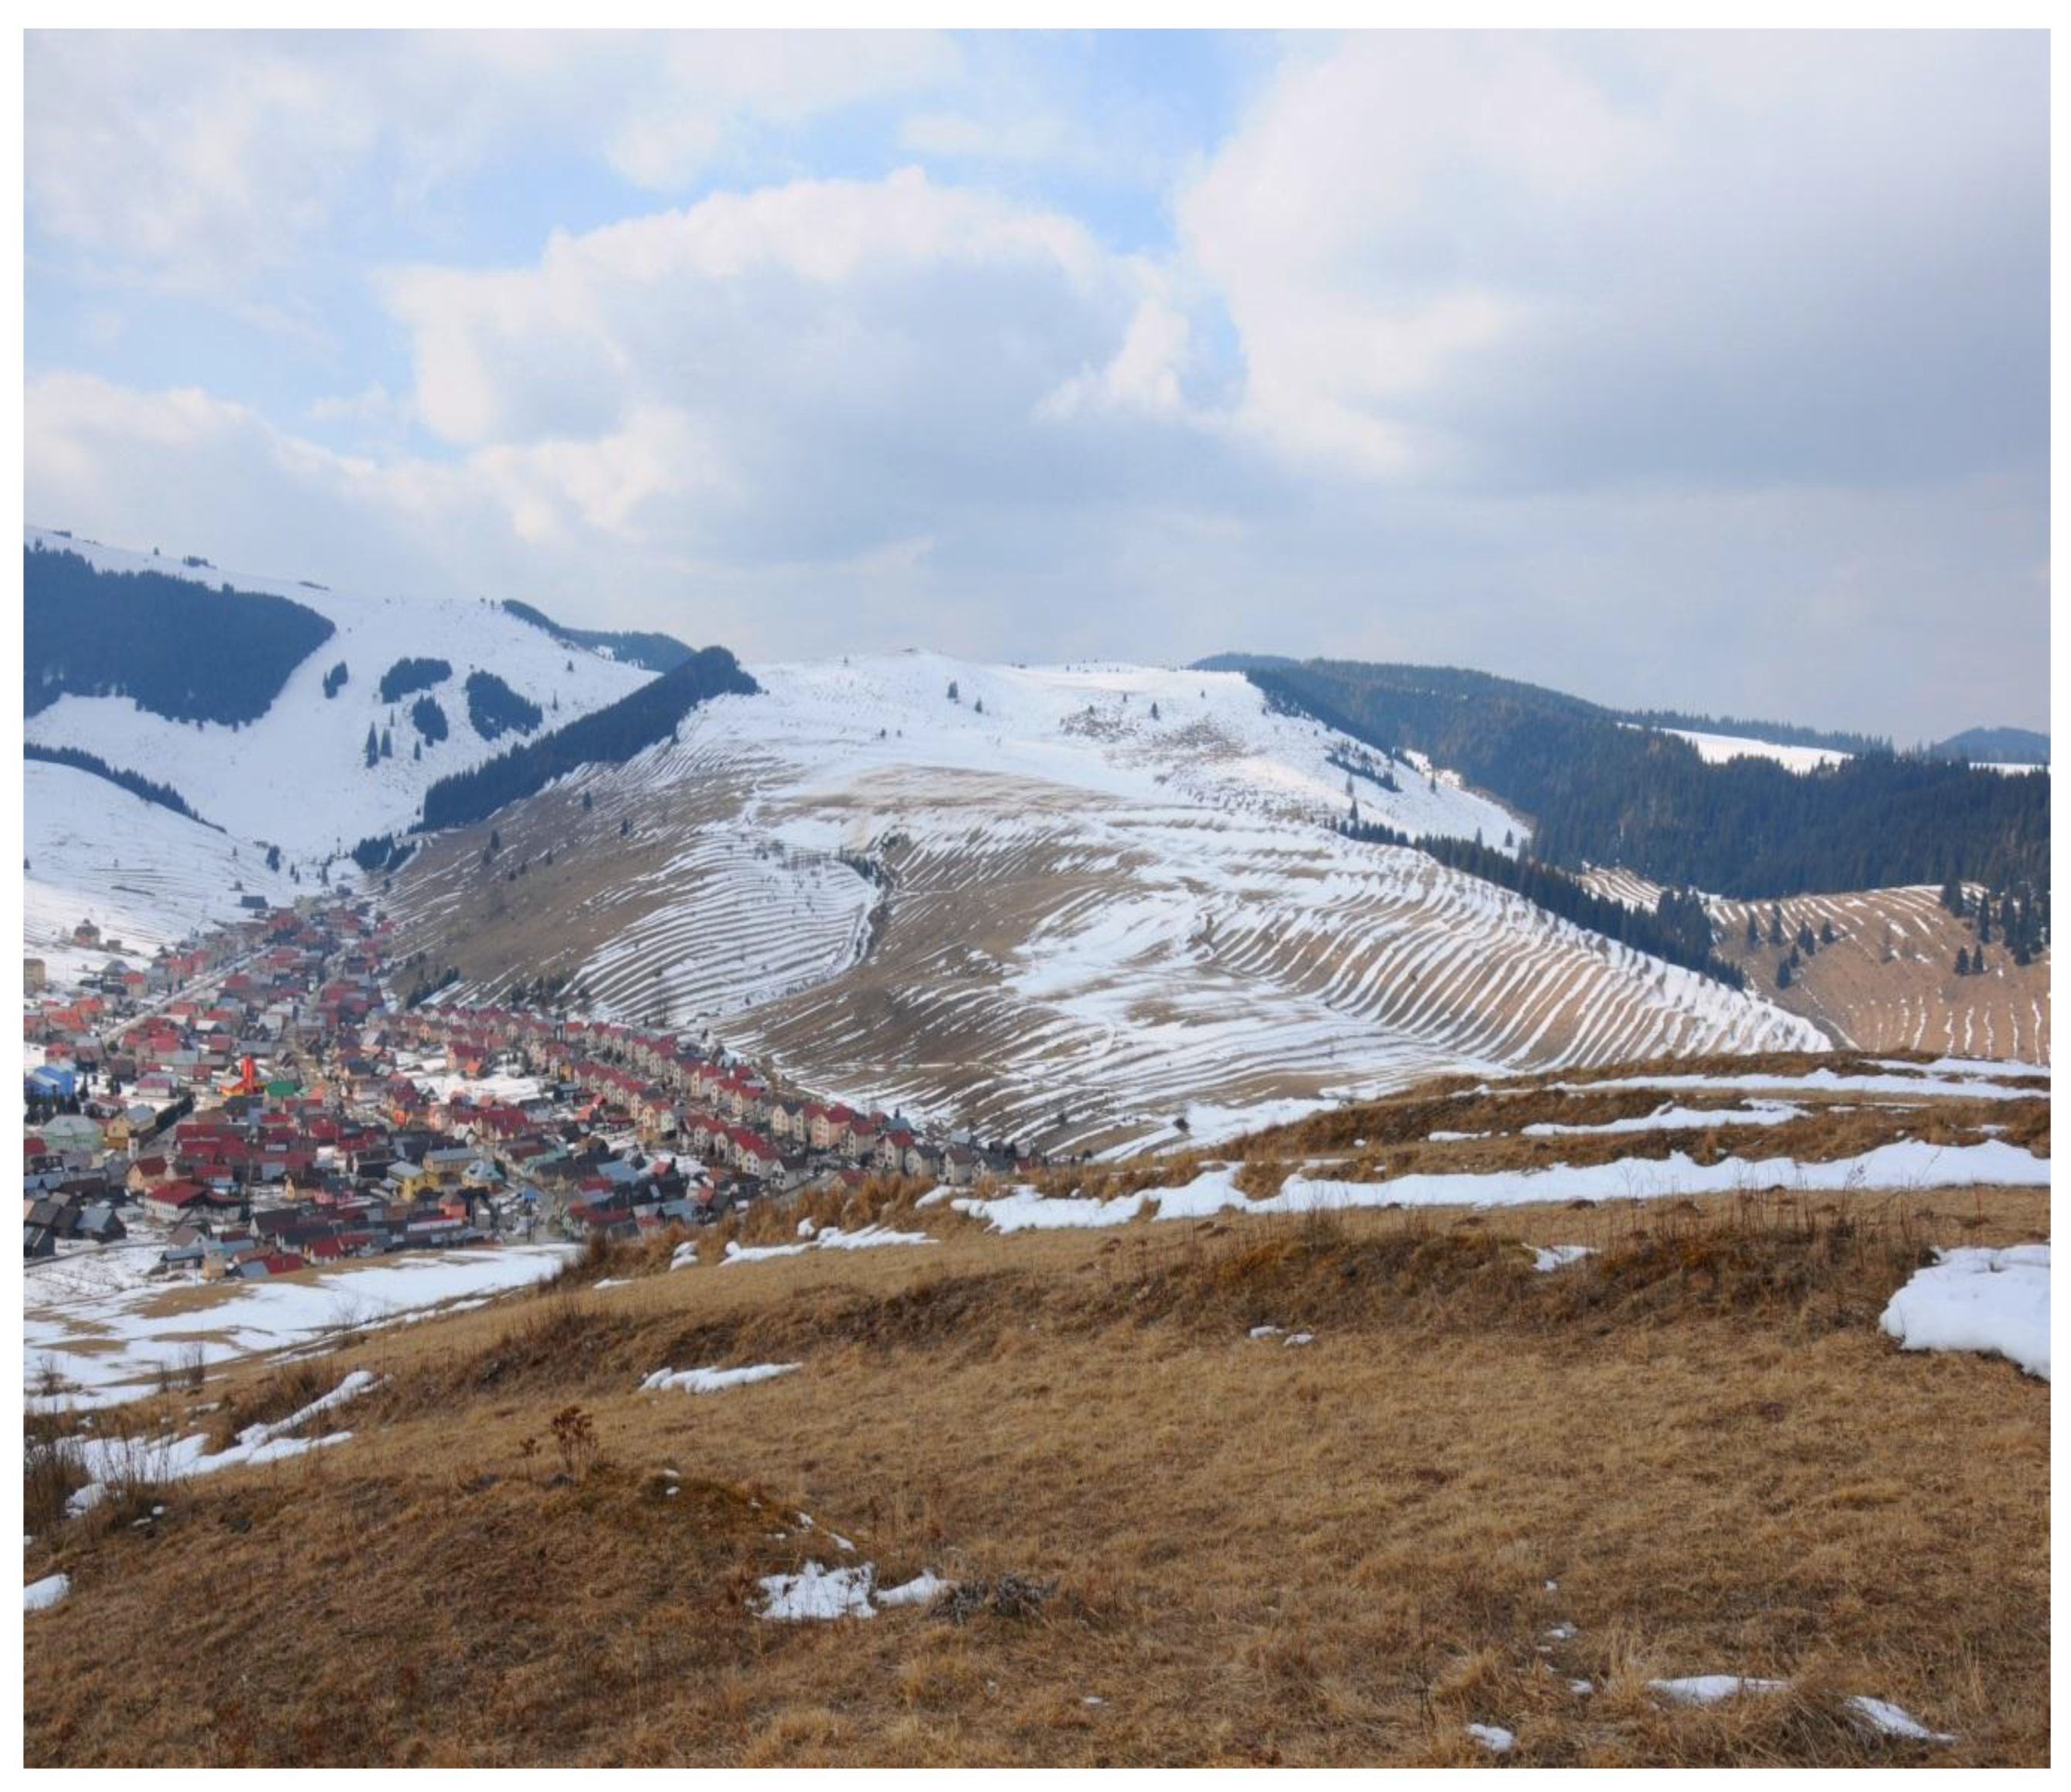
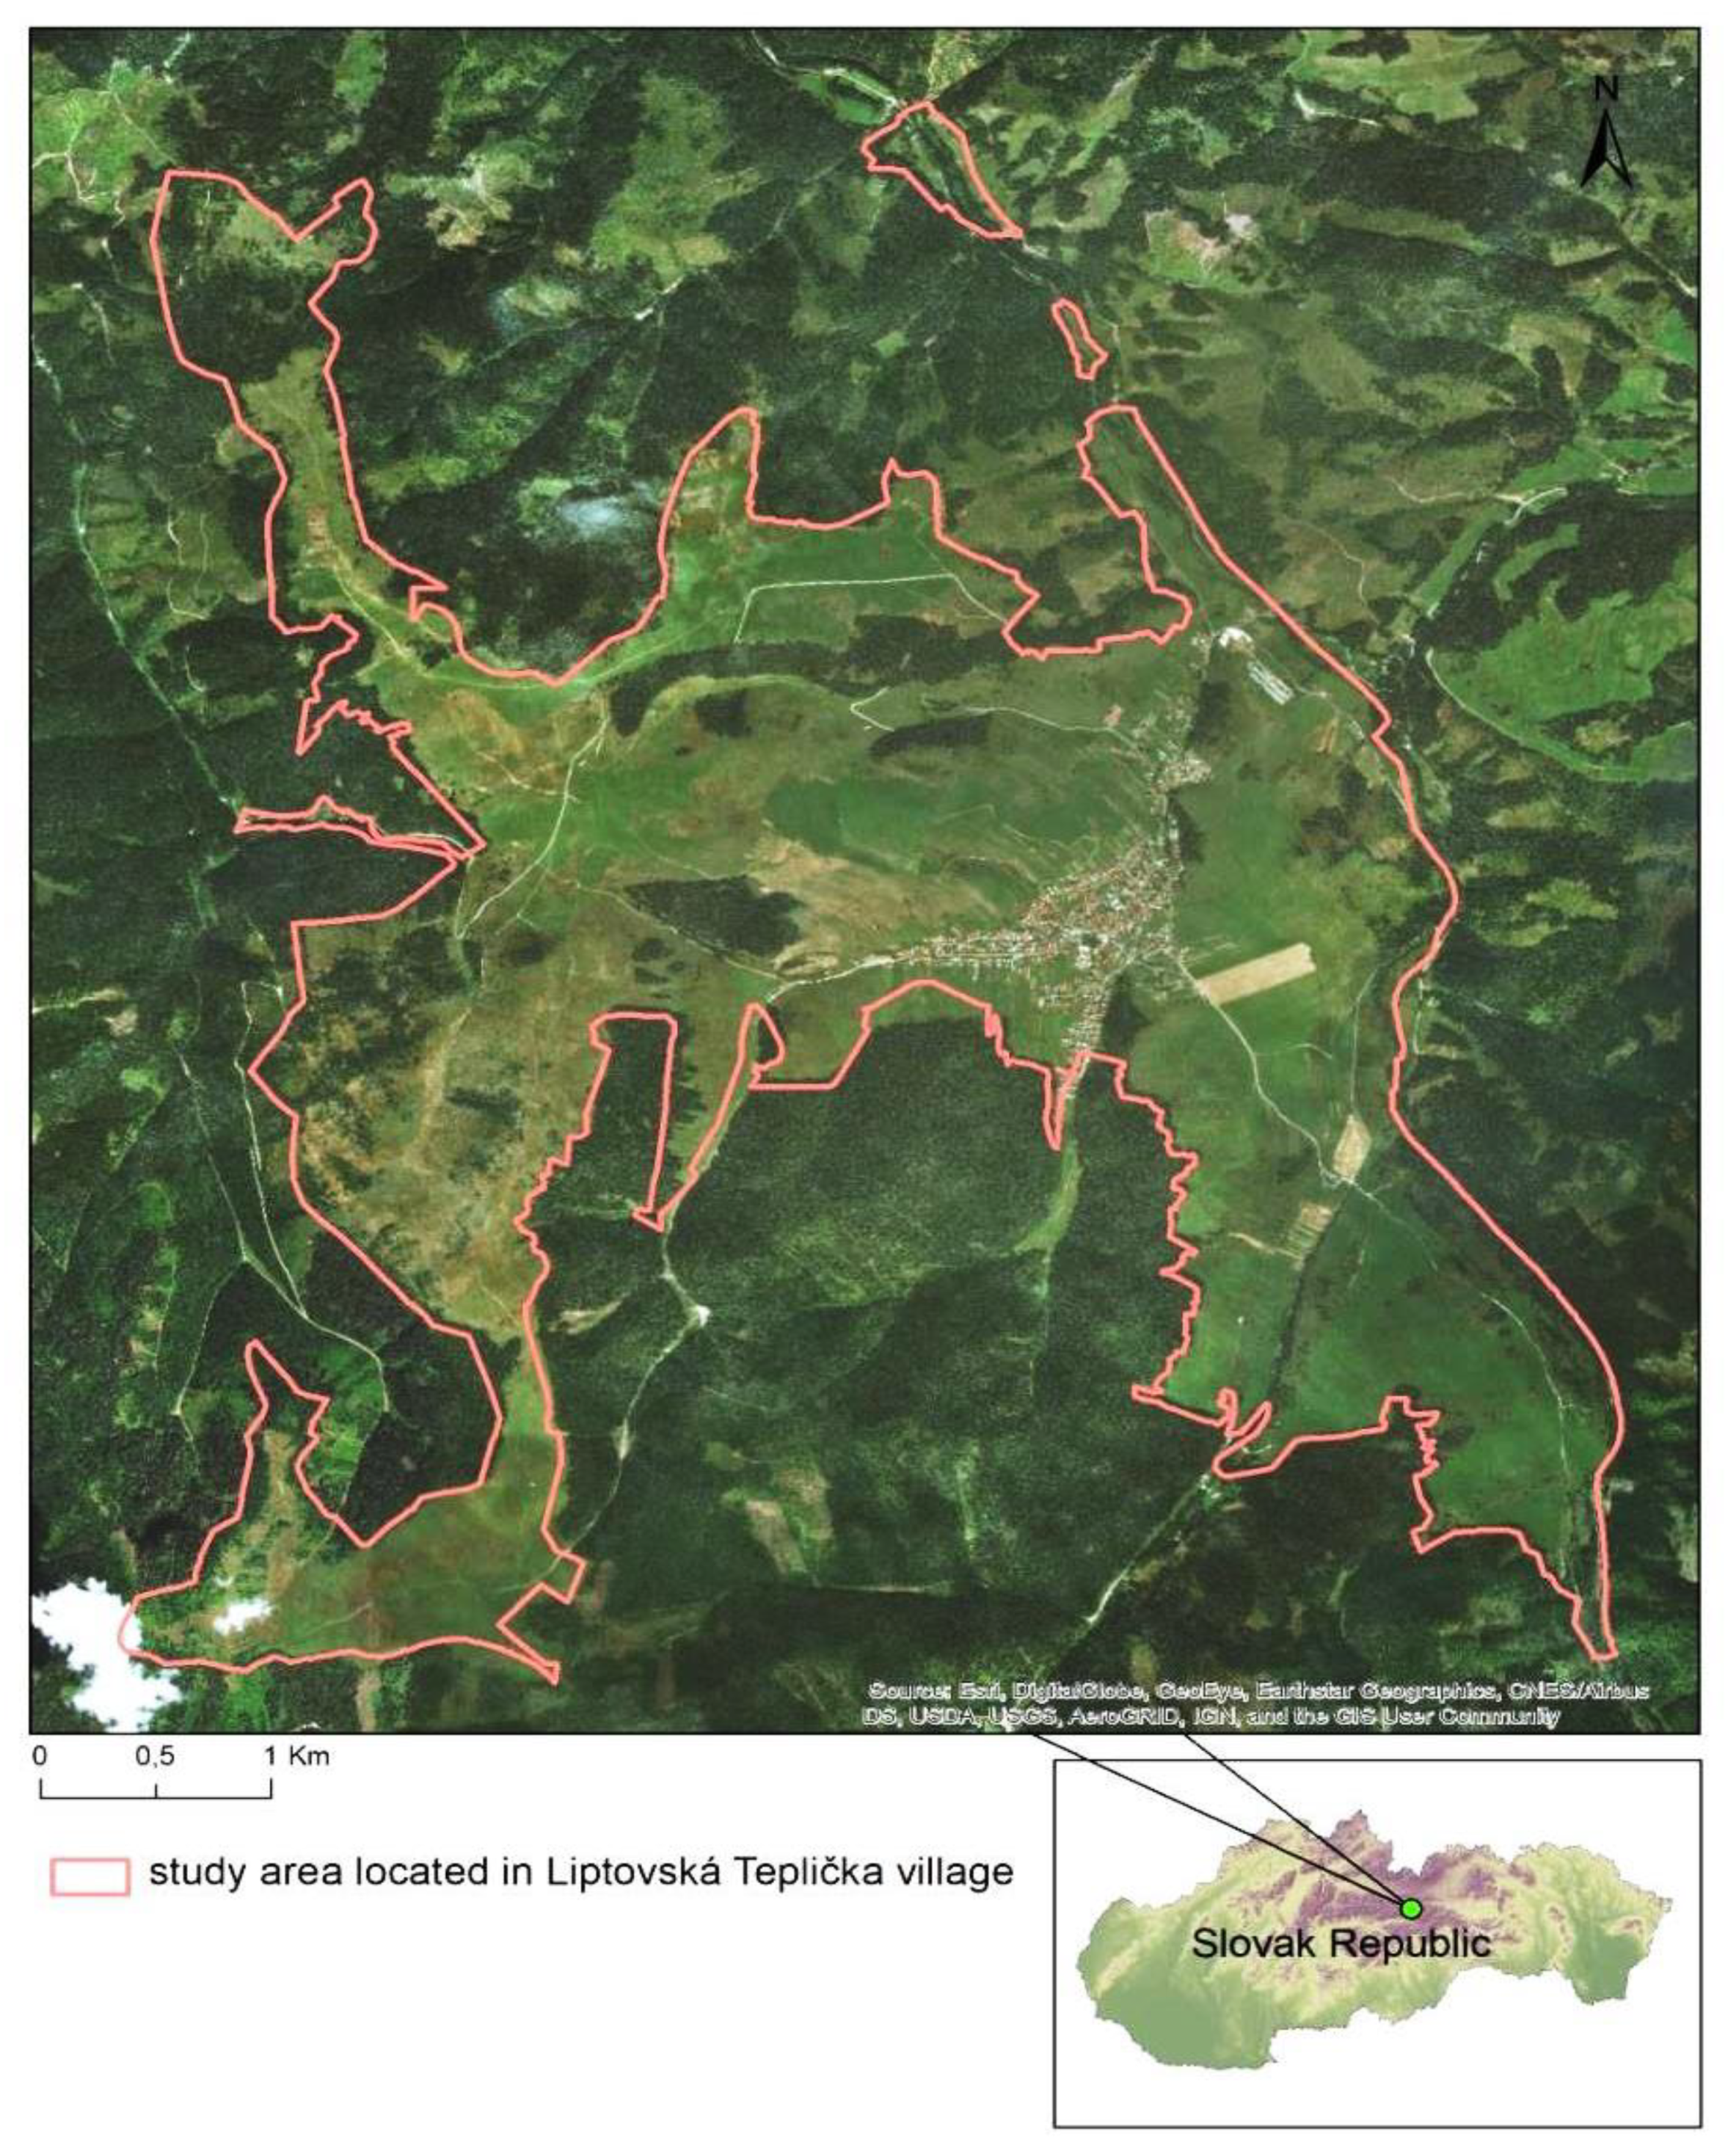
2. Study Area
3. Methodological Approach
3.1. Soil Water Retention Capacity (SWRC)
Input Analytical Data for SWRC Determination
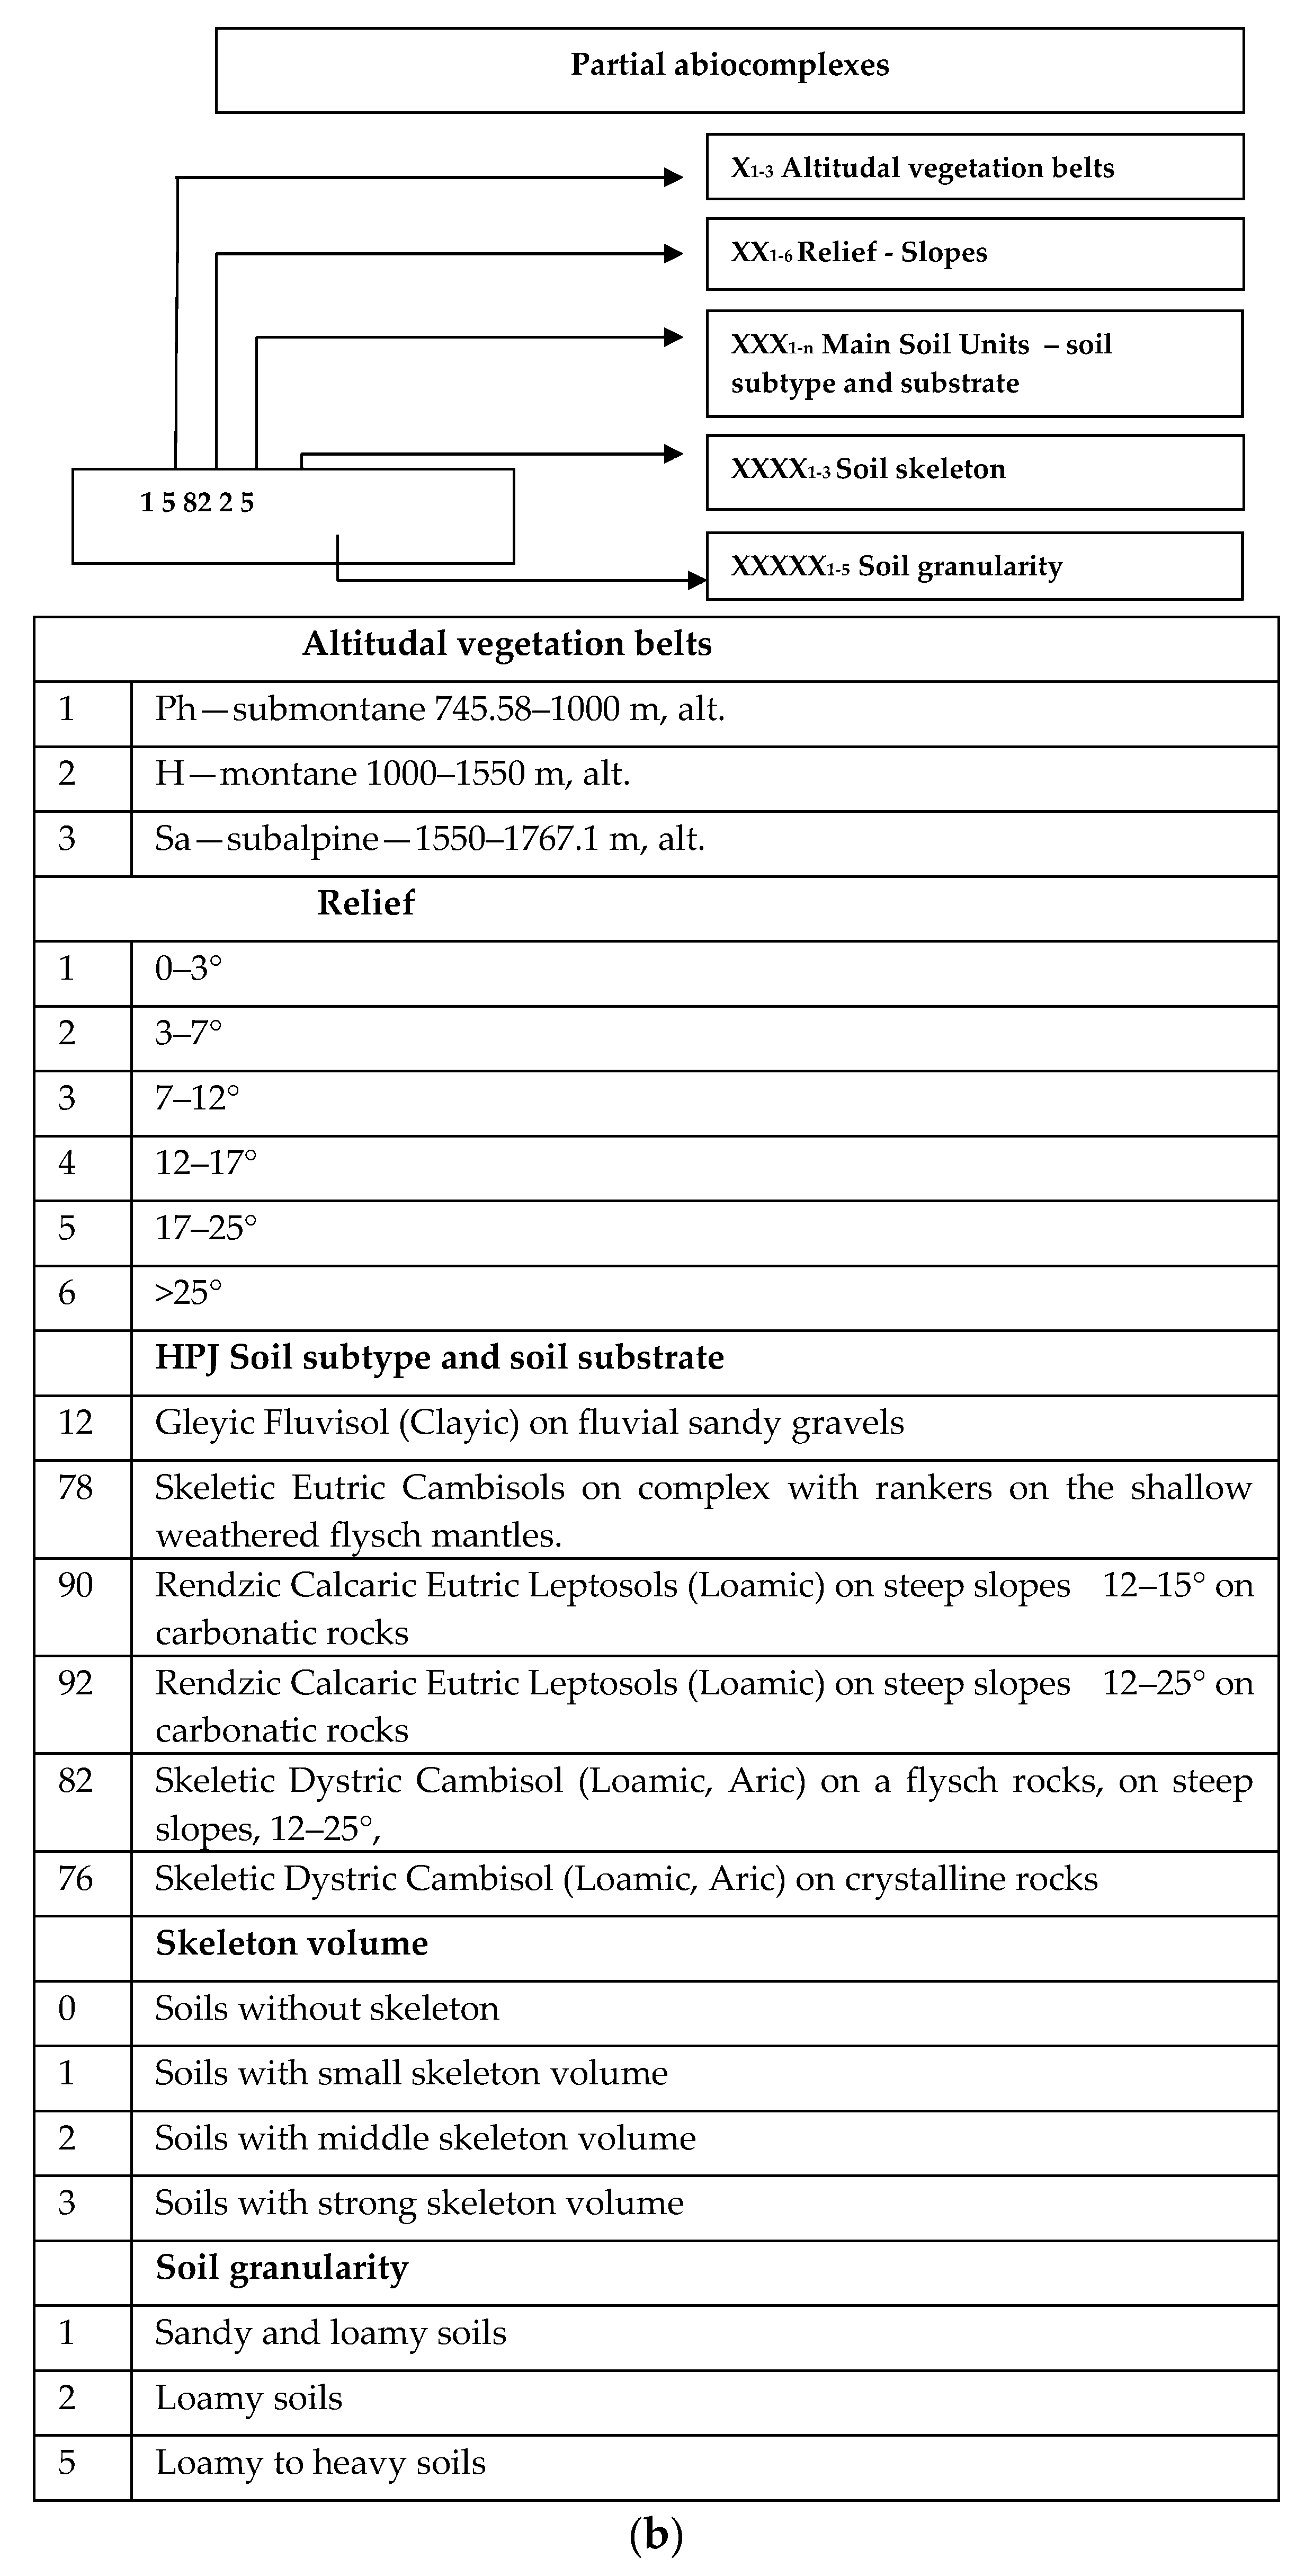
- Database of vector layers of geological conditions according to the Regional Geological Map (at a scale of 1: 50,000) of the Low Tatras and Slovak [34].
- Slope parameter: inclination, from digitálny model reliéfu (DMR) data, with a resolution of 10 × 10 m.
- Database of vector layers of grain size and soil rock content [36] (S: 1:10,000).
3.2. Landscape Water Retention Capacity (LWRC) Assessment
Input Analytical Data for LWRC Calculation
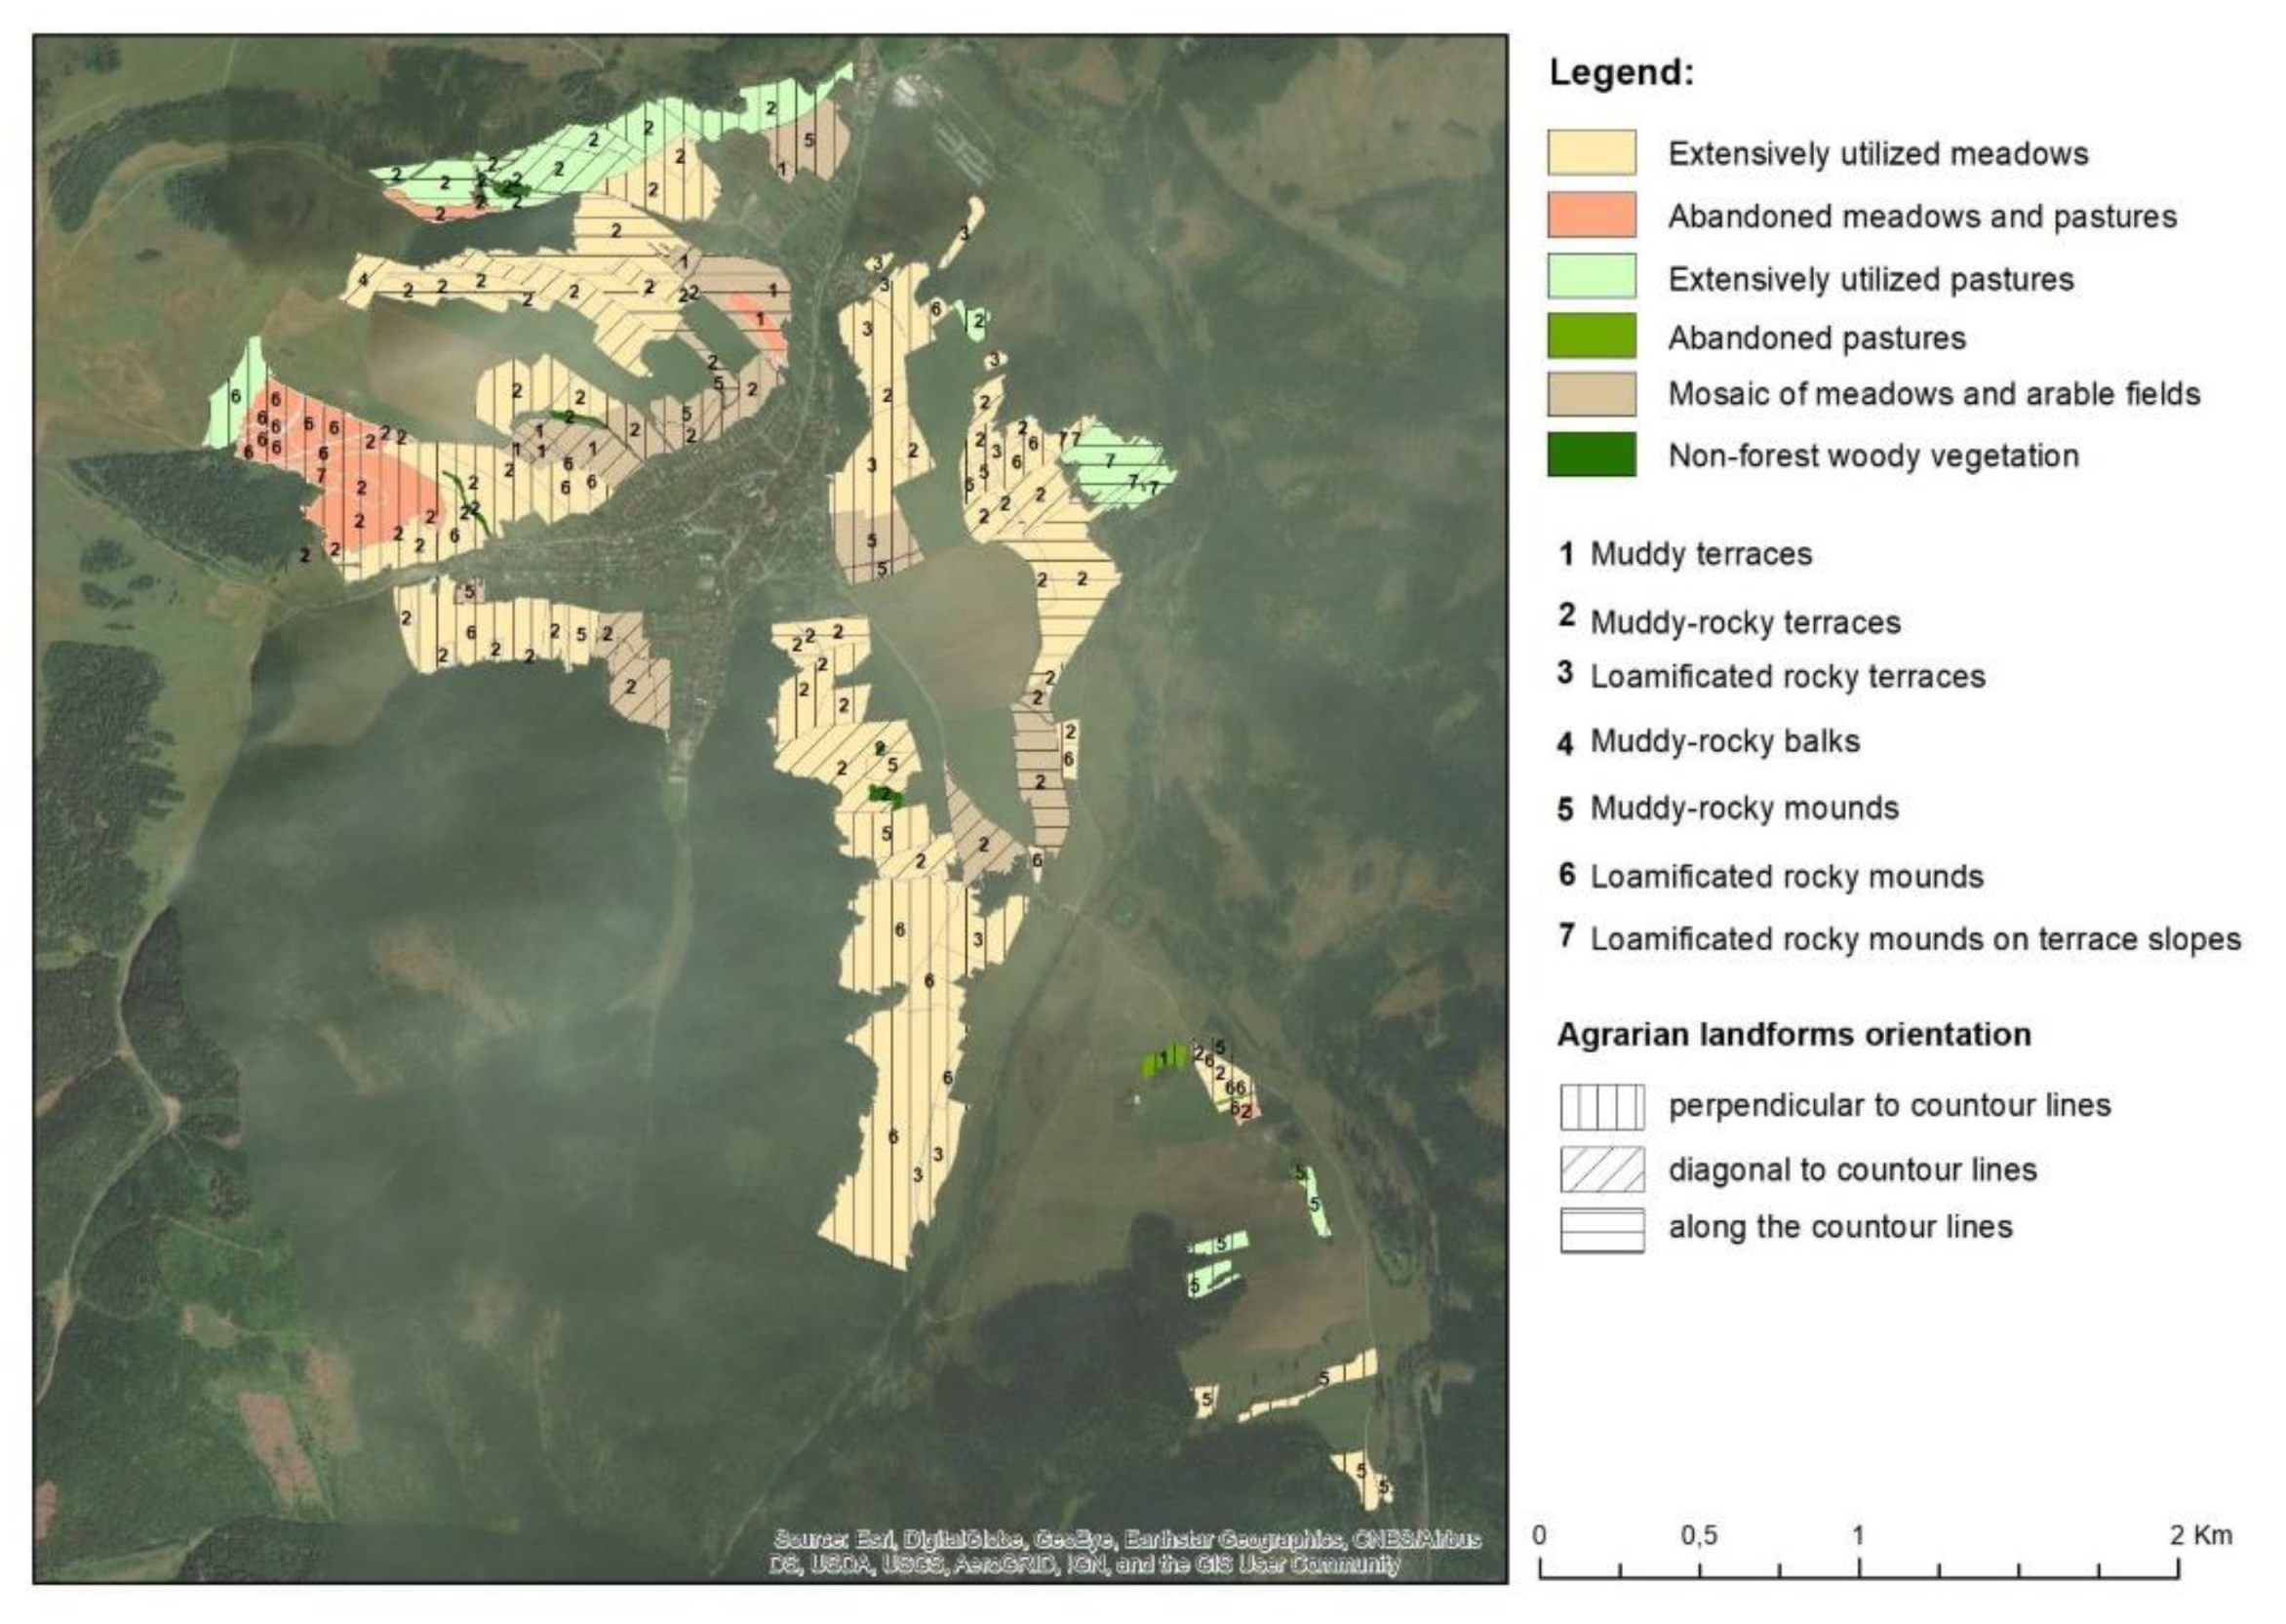
- Analysis of the current land use from 2010, which was interpreted using data from basic maps of the Slovak Republic at a scale of 1:10,000 (from 1992–1993) and orthophotomaps at a scale of 1:5000 from 2002–2003 (Orthophotomap © Geodis Slovakia, s.r.o., 2003; Aerial photography and digital orthophotomap © Eurosense, sr o, 2003). These were verified by a field survey in the years 2015–2017. The secondary landscape structure was classified using the Corine Land Cover legend [37],
- Database of historical structures of the agrarian landscape (HSAL) [36]
3.3. Hydrological Balance Assessment in the Tested Area
3.3.1. Input Analytical Data for the Calculation of the Hydrological Balance
- Value of the raster of potential evapotranspiration in mm, with respect to the use of land (all months during 2018, in GIS openable raster.) (Slovak Environmental Agency, MICROCOMP—computer system s.r.o.);
- Raster representation: DMR with a resolution of 10 × 10 m;
- Vector database of types of soil–substrate units (NPPC, 2014), converted into hydrological groups;
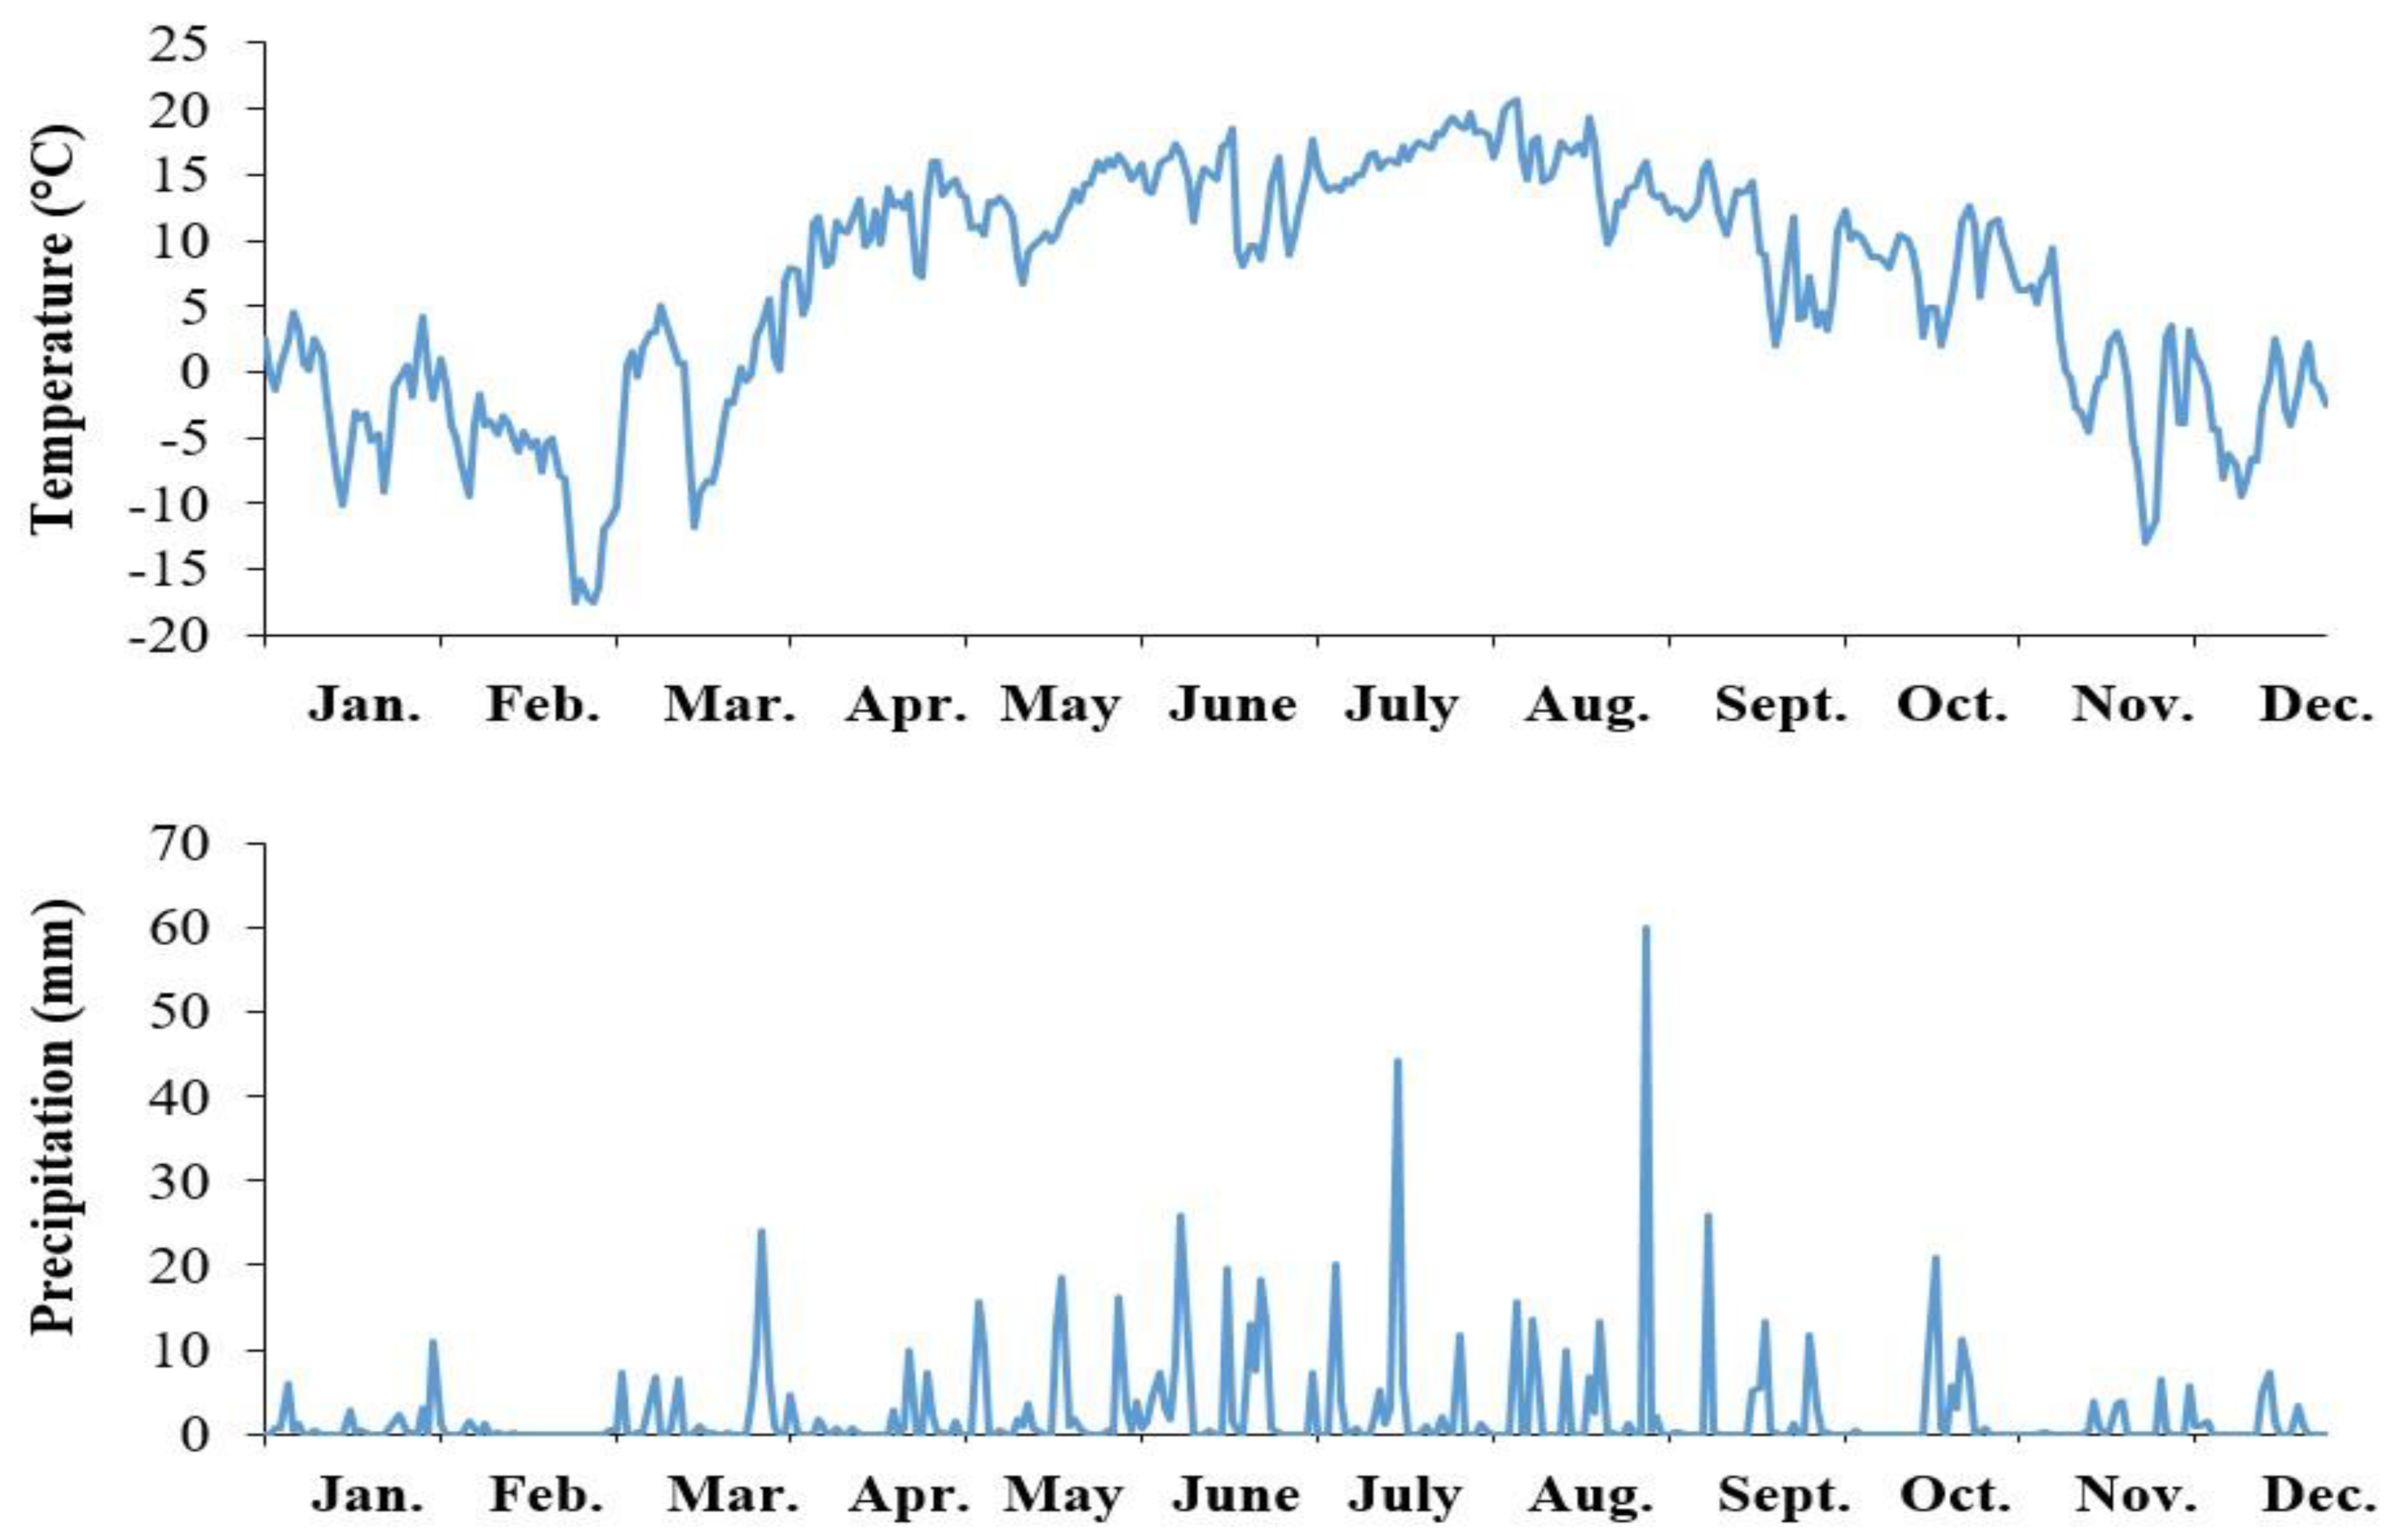
- Climate-data-monitoring database on precipitation and air temperatures (local hydrometeorological station, 2018 data by month);
- Software used to create the data layer: ArcGIS Desktop, version 10.6.1.
3.3.2. Calculation of Runoff by the CN Curve Method
4. Results
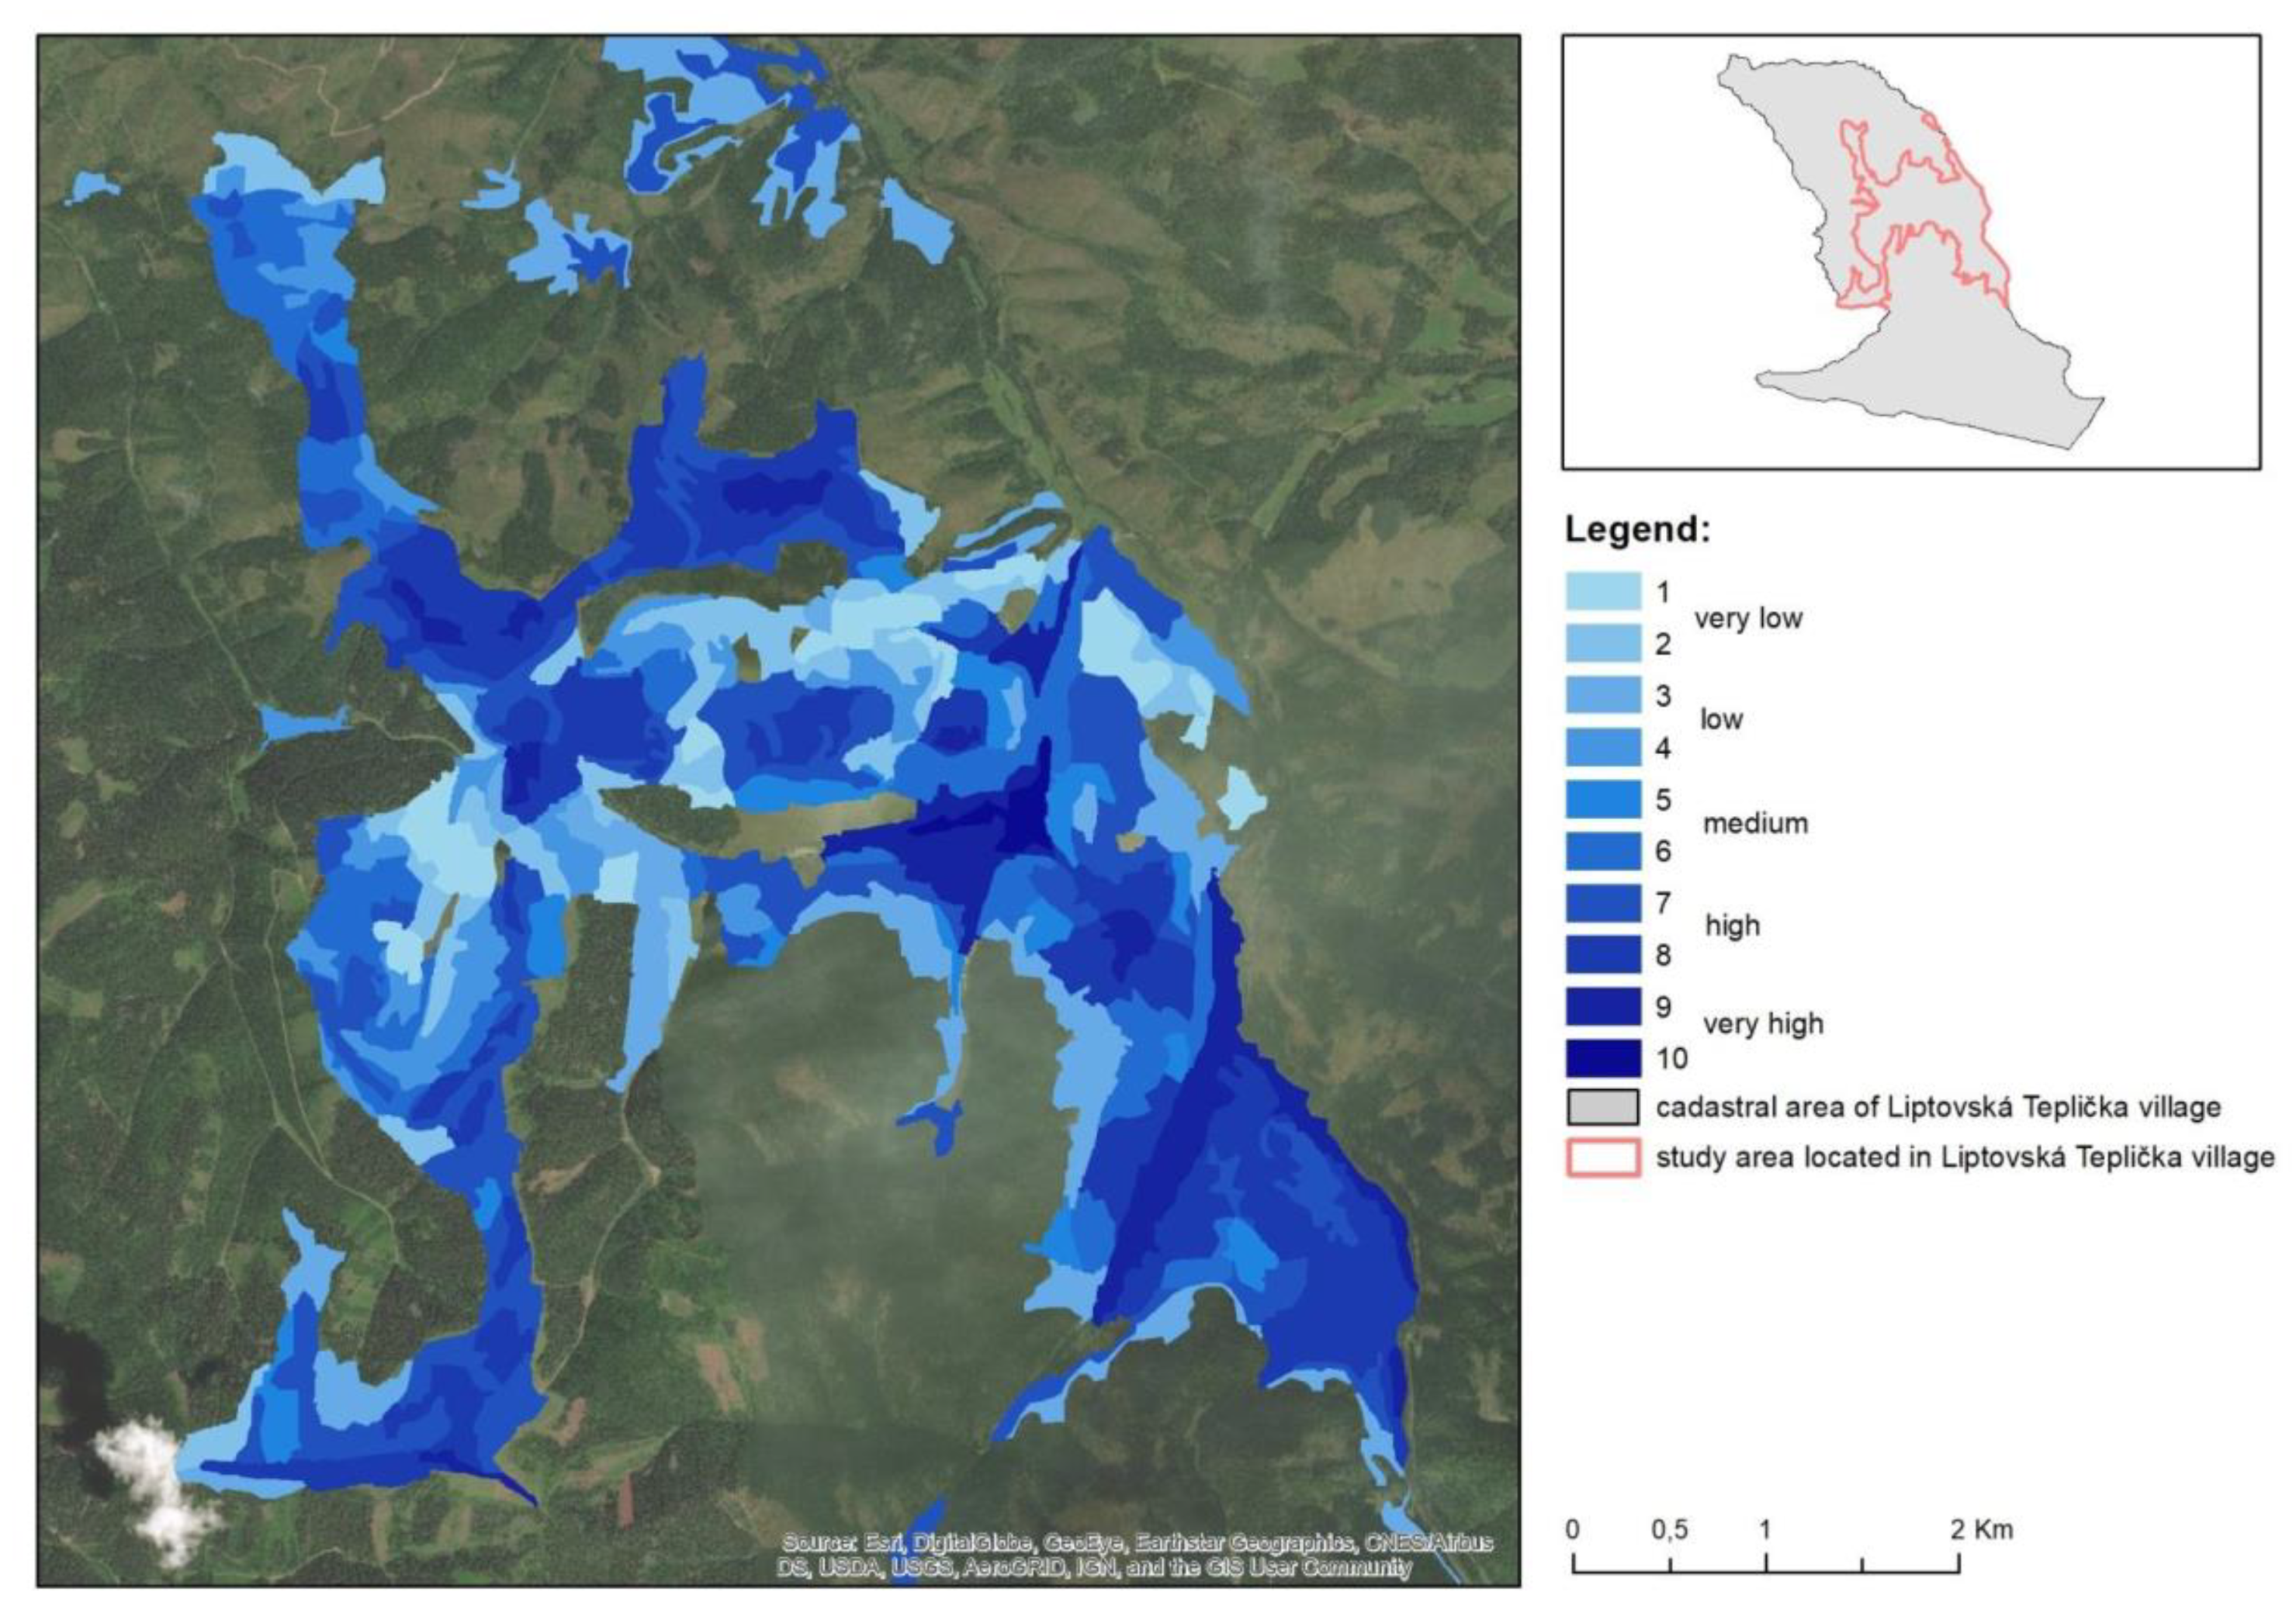
4.1. Determination of Water Retention of the Soils (SWRC)
4.2. Determining the Weighting Coefficient and Calculating the Retention Potential for Types of LSL and Historical Structures of the Agrarian Landscape (HSAL)
4.3. Determination of Retention Coefficient for Parcels with Respect to Orientation of Valleys with Respect to the Slope Line (Sloping)
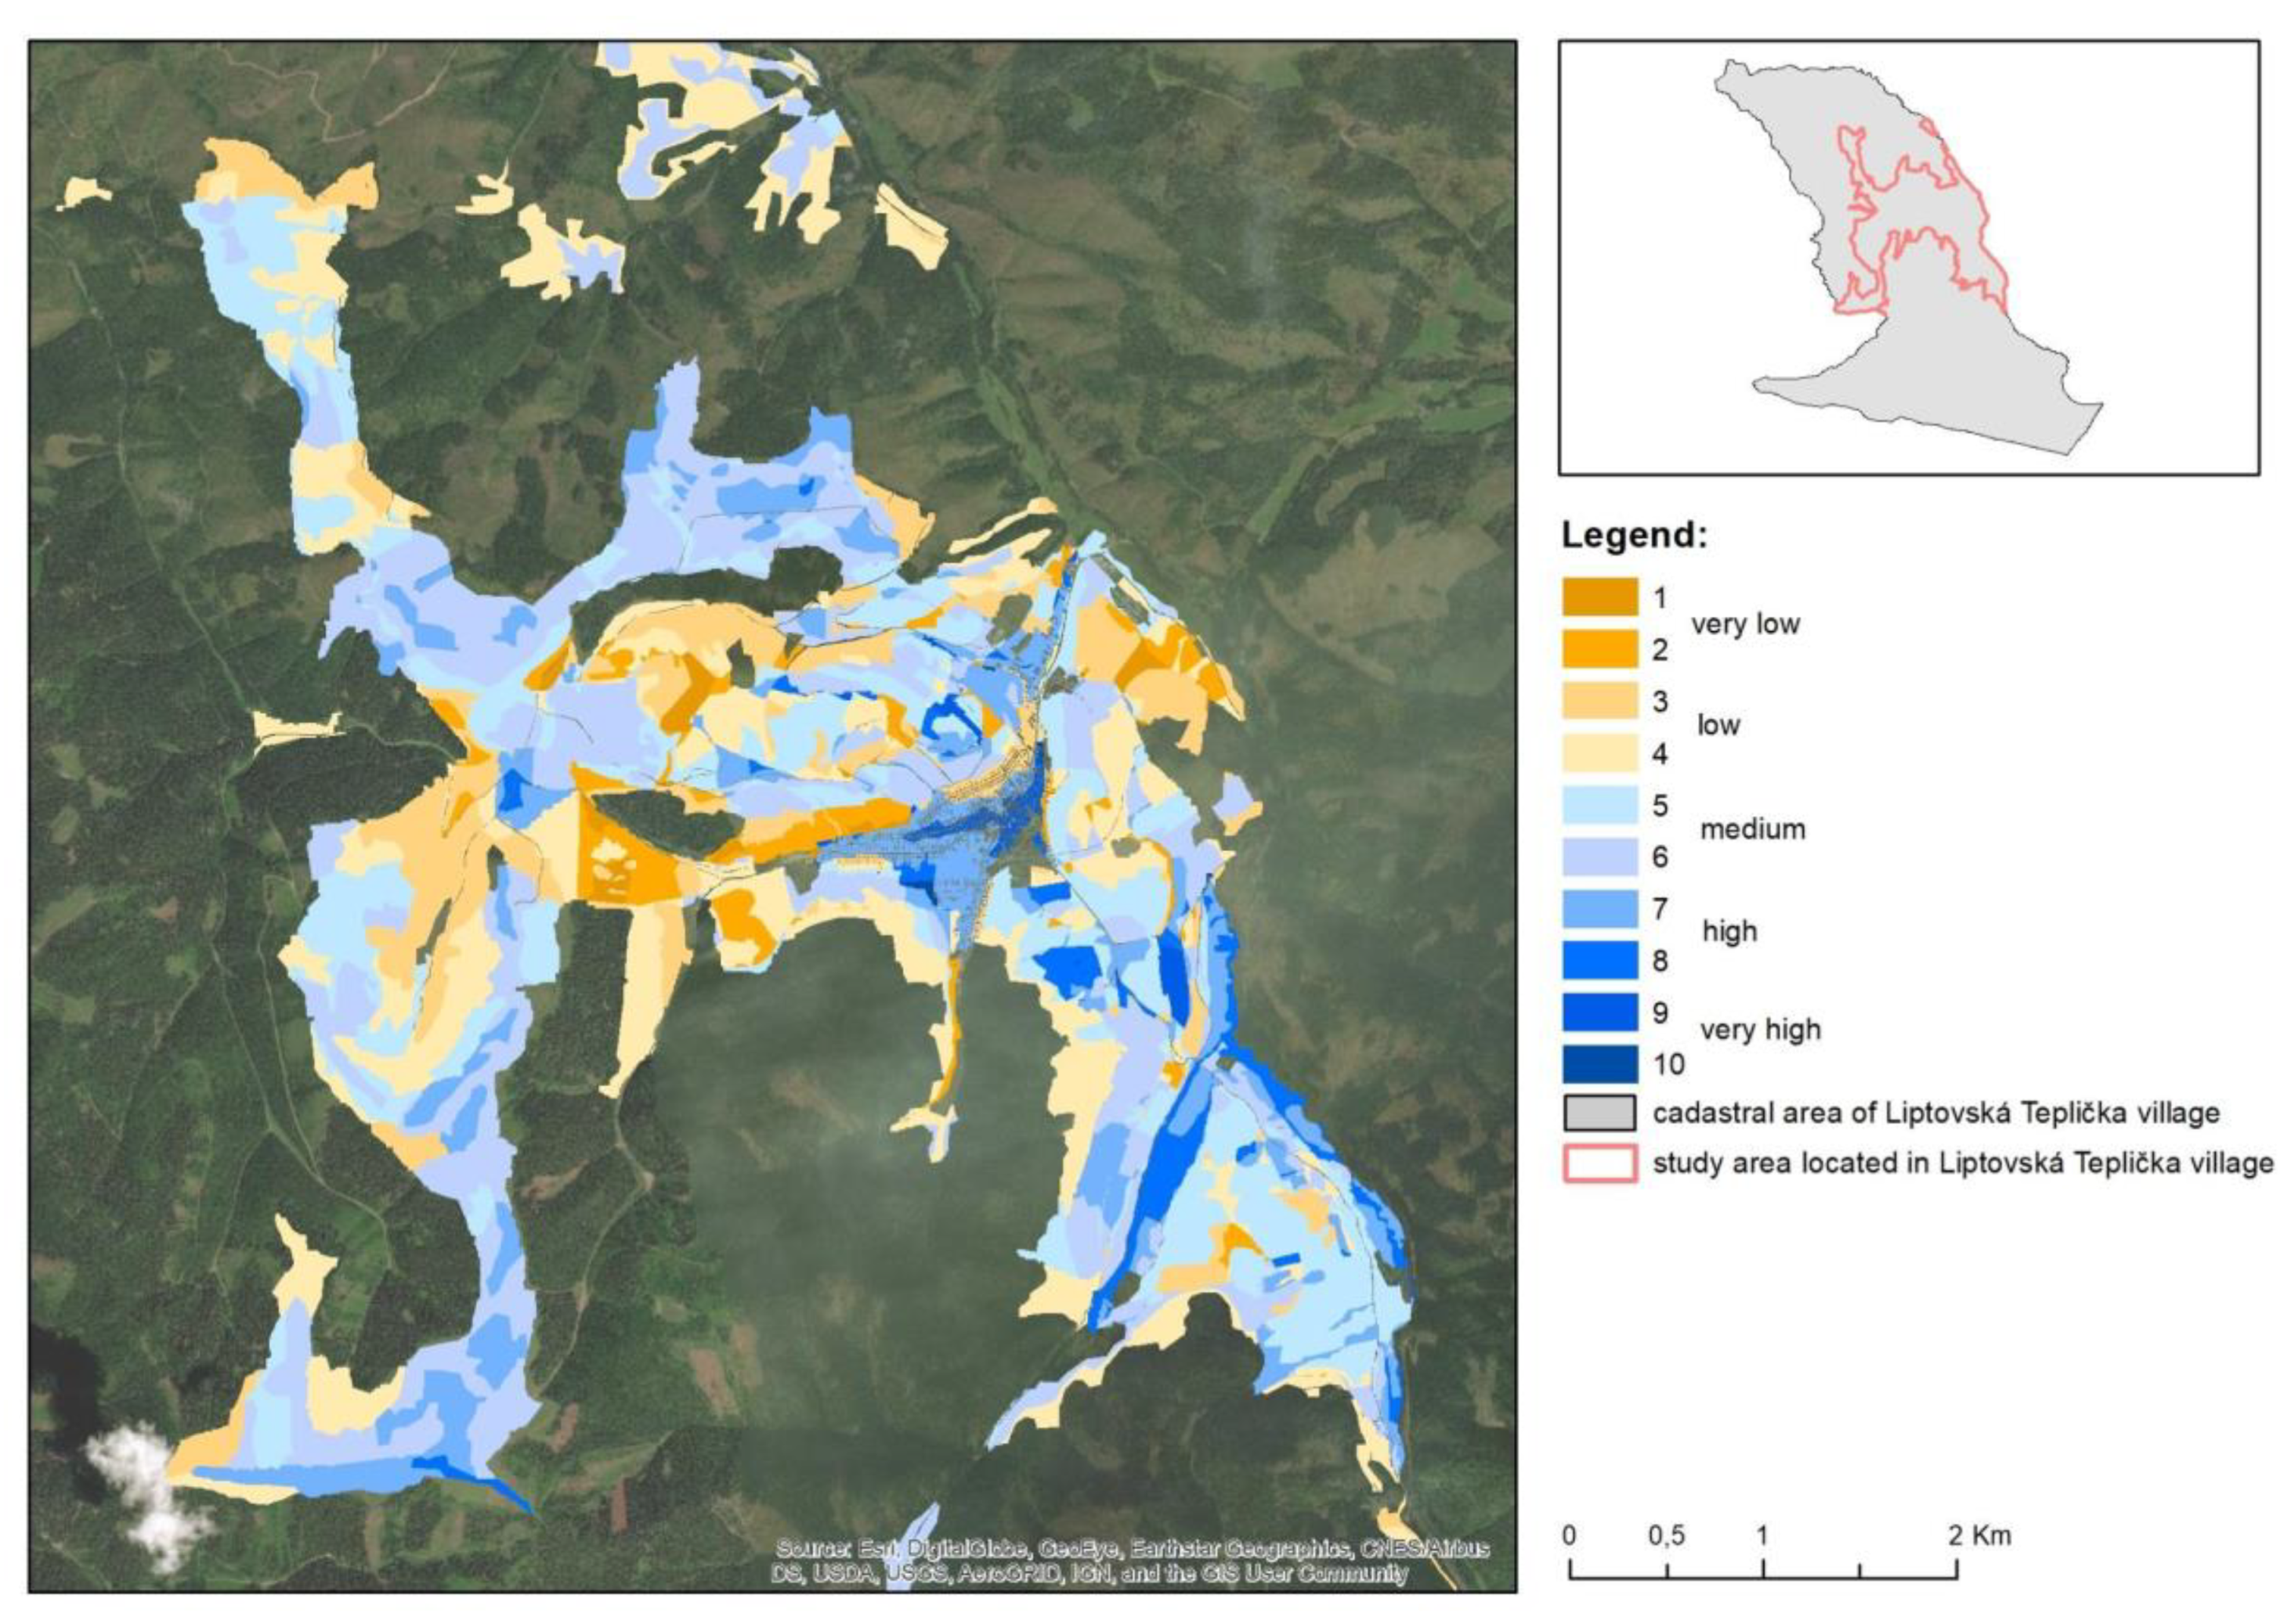
5. Analysis of LWRC Categories with Identification of Landscape Use and Management—(1812.48 ha—Agrarian Area)
5.1. Very Low to Low Landscape Retention (LWRC 1.5–6) (39.91%)
5.2. Mean Landscape Retention (LWRC 6.1–8.2) (43.01%)
5.3. High to Very High Retention (LWRC 8.3–13.2) (17.61%)
6. Calculation of Hydrological Balance in the Area of Interest, Liptovská Teplička
7. Discussion
8. Conclusions
Author Contributions
Funding
Acknowledgments
Conflicts of Interest
References
- Hresko, J.; Petrovič, F.; Misovicova, R. Mountain landscape archetypes of the Western Carpathians (Slovakia). Biodivers. Conserv. 2015, 24, 3269–3283. [Google Scholar] [CrossRef]
- Tužinský, L. Soil moisture in mountain spruce stand. J. For. Sci. 2019, 48, 27–37. [Google Scholar] [CrossRef]
- Christoph, U. Tamera Water Retention Landscape to Restore the Water Cycle and Reduce Vulnerability to Droughts. Monte de Cerro, Portugal. 2015. Available online: http:/www.tamera.org/project-groups/autonomy-ecology (accessed on 15 December 2020).
- DIRECTIVE 2000/60/EC of the European Parliament and of the Council of 23 October 2000 Official Journal of the European Communities L 327. Available online: http://eur-lex.europa.eu/LexUriServ/LexUriServ.douri=CELEX:32000L0060:EN:NOT (accessed on 15 December 2020).
- Falkenmark, M.; Rockström, J. Building water resilience in the face of global change: From a blue-only to a green-blue waterapproach to land-water management. J. Water Resour. Plan. Manag. 2010, 136, 606–610. [Google Scholar] [CrossRef]
- Kravčík, M.; Pokorný, J.; Kohutiar, J.; Kováč, M.; Tóth, E. Water for Climate Recovery—A New Water Paradigm; Krupa Print: Žilina, Slovakia, 2007; 96p. [Google Scholar]
- Hlaváč, L.M.; Hlaváčová, I.; Gembalová, L.; Kaličinský, J.; Fabian, S.; Měšťánek, J.; Kmec, J.; Mádr, V. Experimental method for the investigation of the abrasive water jet cutting quality. J. Mater. Process. Technol. 2009, 209, 6190–6195. [Google Scholar] [CrossRef]
- van Beek, J.L. Planning for Intergrated Management of the Atchafalaya River Basin Natural System Wability and Policy Constraints. In Unified River Basin Management; North, R.M., Dworsky, L.B., Alee, D.J., Eds.; American Water Research Association: Middleburg, VA, USA, 1981; pp. 328–337. [Google Scholar]
- Ernst, S.T. An Analysis of Transboundary Resource Governance Structures in Relation to the Christina River Basin. 2005. Available online: http://www.wr.udel.edu/publications/ChristinaBasin/TransboundaryResourceGovernanceStructuresCRB.Pdf (accessed on 15 December 2020).
- Holko, L. Influence of landscape structures on precipitation-runoff conditions. In Lesy Slovenska a Voda; Minďáš, J., Škvarenina, J., Eds.; Technická Univerzita vo Zvolene: Zvolen, Slovakia, 2011; p. 129. [Google Scholar]
- Ben-Hur, M.; Fernández, C.; Sarkkola, S.; Cerezal, J.C.S.; Santamarta, J.C. Overland flow, soil erosion and stream water quality in forest under different perturbations and climate conditions. In Forest Management and Water Cycle, An Ecosystem Based Approach; Bredemeier, M., Cohen, S., Goldbold, D.L., Lode, E., Pichler, V., Schleppi, P., Eds.; Ecological Studies 212; Springer Science + Bussines Media, B.V.: Berlin, Germany, 2011; pp. 263–289. [Google Scholar]
- Ružička, M.; Miklós, L. Landscape-ecological planning (LANDEP) in the process of territorial planning. Ecology 1982, 1, 297–312. [Google Scholar]
- Kozová, M.; Pauditšová, E.; Finka, M. (Eds.) Krajinné Plánovanie (Lanscape Planning); STU Bratislava: Bratislava, Slovak Republic, 2010; ISBN 2010978-80-227-3354-0. [Google Scholar]
- Antal, J.; Špánik, F. 2004: Hydrology of Agricultural Landscape. 2. Vyd; Nitra SPU: Nitra, Slovakia, 2004; p. 250. ISBN 80-8069-428-1. [Google Scholar]
- Schäfer, K.V.R.; Oren, R.; Lai, C.H.T. Hydrological balance in ant intact temperate forest ecosystem under ambient and elevated atmospheric CO2 concentration. Glob. Chang. Biol. 2002, 8, 895–911. [Google Scholar] [CrossRef]
- Gahala, A.M.; Seal, R.R.; Piatak, N.M. Hydrologic Balance, Water Quality, Chemical-Mass Balance, and Geochemical Modeling of Hyperalkaline Ponds at Big Marsh, Chicago, Illinois, 2016–2017; Geological Survey Scientific Investigations Report; U.S. Environmental Protection Agency: Washington, DC, USA, 2019; pp. 2019–5078. [CrossRef] [Green Version]
- Rožnovský, J.; Chuchma, F.; Fiala, R.; Kohut, M. Základní vlahové bilance na území ČR v suchých letech. In Vlpyv Antropogénnej Činnosti na Vodný Režim Nížinného Územia: Zborník Recenzovaných Príspevkov—Proceedings of Peer-Reviewed Contributions [Elektronický Zdroj].—Bratislava; Ústav hydrológie SAV, Výskumná hydrologická základňa: Michalovce, Slovakia, 2018; pp. 223–232. ISBN 978-80-89139-41-5. [Google Scholar]
- Šoltész, A.; Baroková, D. Impact of landscape and water management in Slovak part of the Medzibodrožie region on groundwater level regime. J. Landsc. Manag. 2011, 2, 41–45. [Google Scholar]
- Caims, J., Jr.; Crawford, T.V.; Salwasser, H. (Eds.) Implementing Integrated Environmental Management; Virginia Polytechnic Institute and State University: Blacksburg, Montgomery, 1994. [Google Scholar]
- Hrnčiarová, T. A KOL.: Metodický Postup Ekologicky Optimálneho Využívania Územia v Rámci Prieskumov a Rozborov Pre Územný Plán Obce; Združenie KRAJINA 21; MŽP SR: Bratislava, Slovakia, 2000; p. 136. [Google Scholar]
- Lehotský, M. Riečna krajina a jej udržateľný rozvoj—nová oblasť aplikácie integrovaného prístupu. In Integrovaný Manažment Krajiny—Základný Nástroj Implementácie Trvalo Udržateľného Rozvoja; Izakovičová, Z., Ed.; ÚKE SAV, MŽP SR, SVS: Bratislava, Slovakia, 2006; pp. 155–159. [Google Scholar]
- Dourojanni, A.; Jouravlev, A. Integrated River Basin Management in Latin America. In Integrated Water Resources Planning for the 21st Century; Domenica, M.F., Ed.; American Society of Civil Engineers: New York, NY, USA, 1995; pp. 953–956. [Google Scholar]
- Kundrát, T.; Prosba, J.; Kuníková, E.; Bödi, L.; Dobrotka, S.; Kavečanský, Š.; Novosad, M.; Seszták, J.; Ondrejčová, H.; Vágašiová, M.; et al. Integrovaný Vodohospodársky Plán Povodia Hornádu. Pilotná Štúdia. Implementácia Rámcovej Smernice EÚ pre Vodu SR; SVP-PBaH, VÚVH, VVaK, SHMÚ: Bratislava, Slovakia, 2002; p. 125. [Google Scholar]
- Ministry of the Environment of the Slovak Republic. Land Atlas, Slovak Agency for the Environment. ESPRIT, spol. s.r.o., Banská Štiavnica; map works 428; Ministry of the Environment of the Slovak Republic: Bratislava, Slovakia, 2000.
- Igaz, D.; Bárek, V.; Halaj, P.; Takáč, J.; Čimo, J. A comparison of measured soil moisture with simulatedresults obtained by selected models for Danubian lowland. Cereal Res. Commun. 2008, 36, 1619–1622. [Google Scholar]
- Tietje, O.; Tapkenhinrichs, M. Evaluation of Pedo-Transfer Functions. Soil Sci. Soc. Am. J. 1993, 57, 1088–1095. [Google Scholar] [CrossRef]
- Gupta, S.C.; Larson, W.E. Estimating soil water retention charactertstics from particle size distribution, organic mater percent and bulk density. In Water Resources Research; University of Minnesota: Minneapolis, MN, USA, 1979; Volume 15, pp. 1633–1635. [Google Scholar]
- Droogers, P.; Bouma, J. Simulation modelling for water governance in basins. Int. J. Water Resour. Dev. 2014, 30, 475–494. [Google Scholar] [CrossRef]
- Pachepsky, Y.A.; Timlin, D.J.; Varallyay, G. Artificial neural networks to estimate soil water retention from easily measurable data. Soil Sci. Soc. Am. J. 1996, 60, 727–733. [Google Scholar] [CrossRef]
- Lamorski, K.; Pastusyka, J.; Krzyszczak, J.; Slawinski, C. Soil Water Dynamic Modelling Using 631 the Physical and Support Vector Machine Methods. Soil Sci. Soc. Am. 2013, 12, 632. [Google Scholar] [CrossRef]
- Bujnovsky, D.; Maly, T.; Zahalka, F.; Mala, L. Analysis of physical load among professional soccer players during matches with respect to field position. J. Phys. Educ. Sport 2014, 14, 569–575. [Google Scholar]
- Houšková, B. Retenčná Kapacita Poľnohospodárskych Pôd SLOVENSKA. Vedecké Práce. In Proceedings Soil Science and Conservation Research Institute, 2000; pp. 72–78. Bratislava, VÚPOP (PDF) An Evaluation of Soil Retention Potential as an Important Factor of Water Balance in the Landscape. Available online: https://www.researchgate.net/publication/309026291_An_evaluation_of_soil_retention_potential_as_an_important_factor_of_water_balance_in_the_landscape (accessed on 7 October 2020).
- Krnáčová, Z.; Hreško, J.; Vlachovičová, M. An evaluation of soil retention potential as an important factor of water balance in the landscape. Morav. Geograph. Rep. 2016, 24, 44–54. [Google Scholar] [CrossRef] [Green Version]
- Bezák, V.; Hraško, Ľ.; Kováčik, M.; Madarás, J.; Siman, P.; Pristaš, J.; Dublan, L.; Konečný, V.; Plašienka, D.; Vozárová, A.; et al. Geological Map and Explanations to the Geological Map of the Slovak Ore Mountains-Western Part 1: 50,000; Bezák, V., Ed.; GSSR: Bratislava, Slovakia, 1999; 178p. [Google Scholar]
- Balkovič, J.; Bedrna, Z.; Bublinec, E.; Čurlík, J.; Dlapa, P.; Fulajtár, E.; Gömöryová, E.; Gregor, J.; Hanes, J.; Houšková, B.; et al. Morphogenetic Classification System of Soils in Slovakia. Basal Reference Taxonomy, 2nd revised ed.; SPS, NPPC VÚPOP: Bratislava, Slovakia, 2014; p. 96. ISBN 978-80-8163-005-7. [Google Scholar]
- Špulerová, J.; Dobrovodská, M.; Izakovičová, Z.; Kenderessy, P.; Petrovič, F.; Štefunková, D. Developing a strategy for the protection of traditional agricultural landscapes based on a complex landscape-ecological evaluation (The case study of a mountain landscape in Slovakia). Morav. Geogr. Rep. 2013, 21, 15–26. [Google Scholar]
- Bossard, M.; Feranec, J.; Oťahel, J. CORINE Land Cover Technical Quide—Addendum; European Environment Agency, EEA: Copenhagen, Denmark, 2000; 105p. [Google Scholar]
- Antal, J.; Michal, M.; Turbek, J. Hydrology—The Lexicographical Dictionary Hydrology—The Lexicographic Dictionary, Bratislava; Documents—Annex to the Bulletin of the Ministry of the Environment of the Slovak Republic; Ministry of the Environment of the Slovak Republic: Bratislava, Slovakia, 2002; p. 157. [Google Scholar]
- Tomlain, J. Rozloženie Evapotranspirácie Na Území Slovenska za Obdobie 1961–1990; Podzemná voda: Bratislava, Slovakia, 1997; Volume III, pp. 5–23. [Google Scholar]
- Turc, L. Water requirements assessment of irrigation, potential evapotranspiration: Simplified and updated climatic formula. Ann. Agron. 1961, 12, 13–49. [Google Scholar]
- Soomro, A.G.; Babar, M.M.; Memon, A.; Zaidi, A.Z.; Ashraf, A.; Lund, J. Sensitivity of Direct Runoff to Curve Number Using the SCS–CN Method. Civ. Eng. J. 2019, 5. [Google Scholar] [CrossRef]
- Satheeshkumar, S.; Venkateswaran, S.; Kannan, R. Rainfall–runoff estimation using SCS–CN and GIS approach in the Pappiredipatti watershed of the Vaniyar sub basin, South India. Model. Earth Syst. Environ. 2017, 3, 24. [Google Scholar] [CrossRef]
- Singh, M.; Satapathy, D. Rainfall-Runoff Estimation Using SCS-CN and GIS Approach in the Kuakhai Watershed of the Mahanadi Basin of Bhubaneswar Odisha. Int. J. Emerg. Res. Manag. Technol. 2018, 6, 9–25. [Google Scholar] [CrossRef]
- Bezák, P.; Dobrovodská, M. Role of rural identity in traditional agricultural landscape maintenance: The story of a post-communist country. Agroecol. Sustain. Food Syst. 2018, 43, 3–20. [Google Scholar] [CrossRef]
- Ministry of Environment. Water Plan of Slovakia; Ministry of the Environment of the Slovak Republic: Bratislava, Slovakia, 2009; p. 131.
- Glenn, E.; Squires, V.; Olsen, M.; Frye, R. Potential for carbon sequestration in the drylands. In Terrestrial Biospheric Carbon Fluxes Quantification of Sinks and Sources of CO2; Wisniewski, J., Sampson, R.N., Eds.; Springer: Dordrecht, The Netherlands, 1993; pp. 341–355. [Google Scholar]
- Gutry-Korycka, M.; Sadurski, A.; Kundzewicz, Z.W.; Pociask-Karteczka, J.; Skrzypczyk, L. Water supplies and their use. Science 2014, 1, 77–89. [Google Scholar]
- Mioduszewski, W. Small (natural) water retention in rural areas/Mała (naturalna) retencja wodna na obszarach wiejskich. J. Water Land Dev. 2014, 20, 19–29. [Google Scholar] [CrossRef] [Green Version]


| SWRC Category | Numerical Designation of Categories | The Range of Cumulative SWRC Index Values |
|---|---|---|
| Very low | 1 | 0.10–0.19 |
| 2 | 0.20–2.28 | |
| Low | 3 | 2.29–3.37 |
| 4 | 3.38–4.56 | |
| Medium | 5 | 4.57–5.55 |
| 6 | 5.56–6.64 | |
| High | 7 | 56.65–7.73 |
| 8 | 7.74–8.82 | |
| Very high | 9 | 8.83–9.91 |
| 10 | 9.92–11.00 |
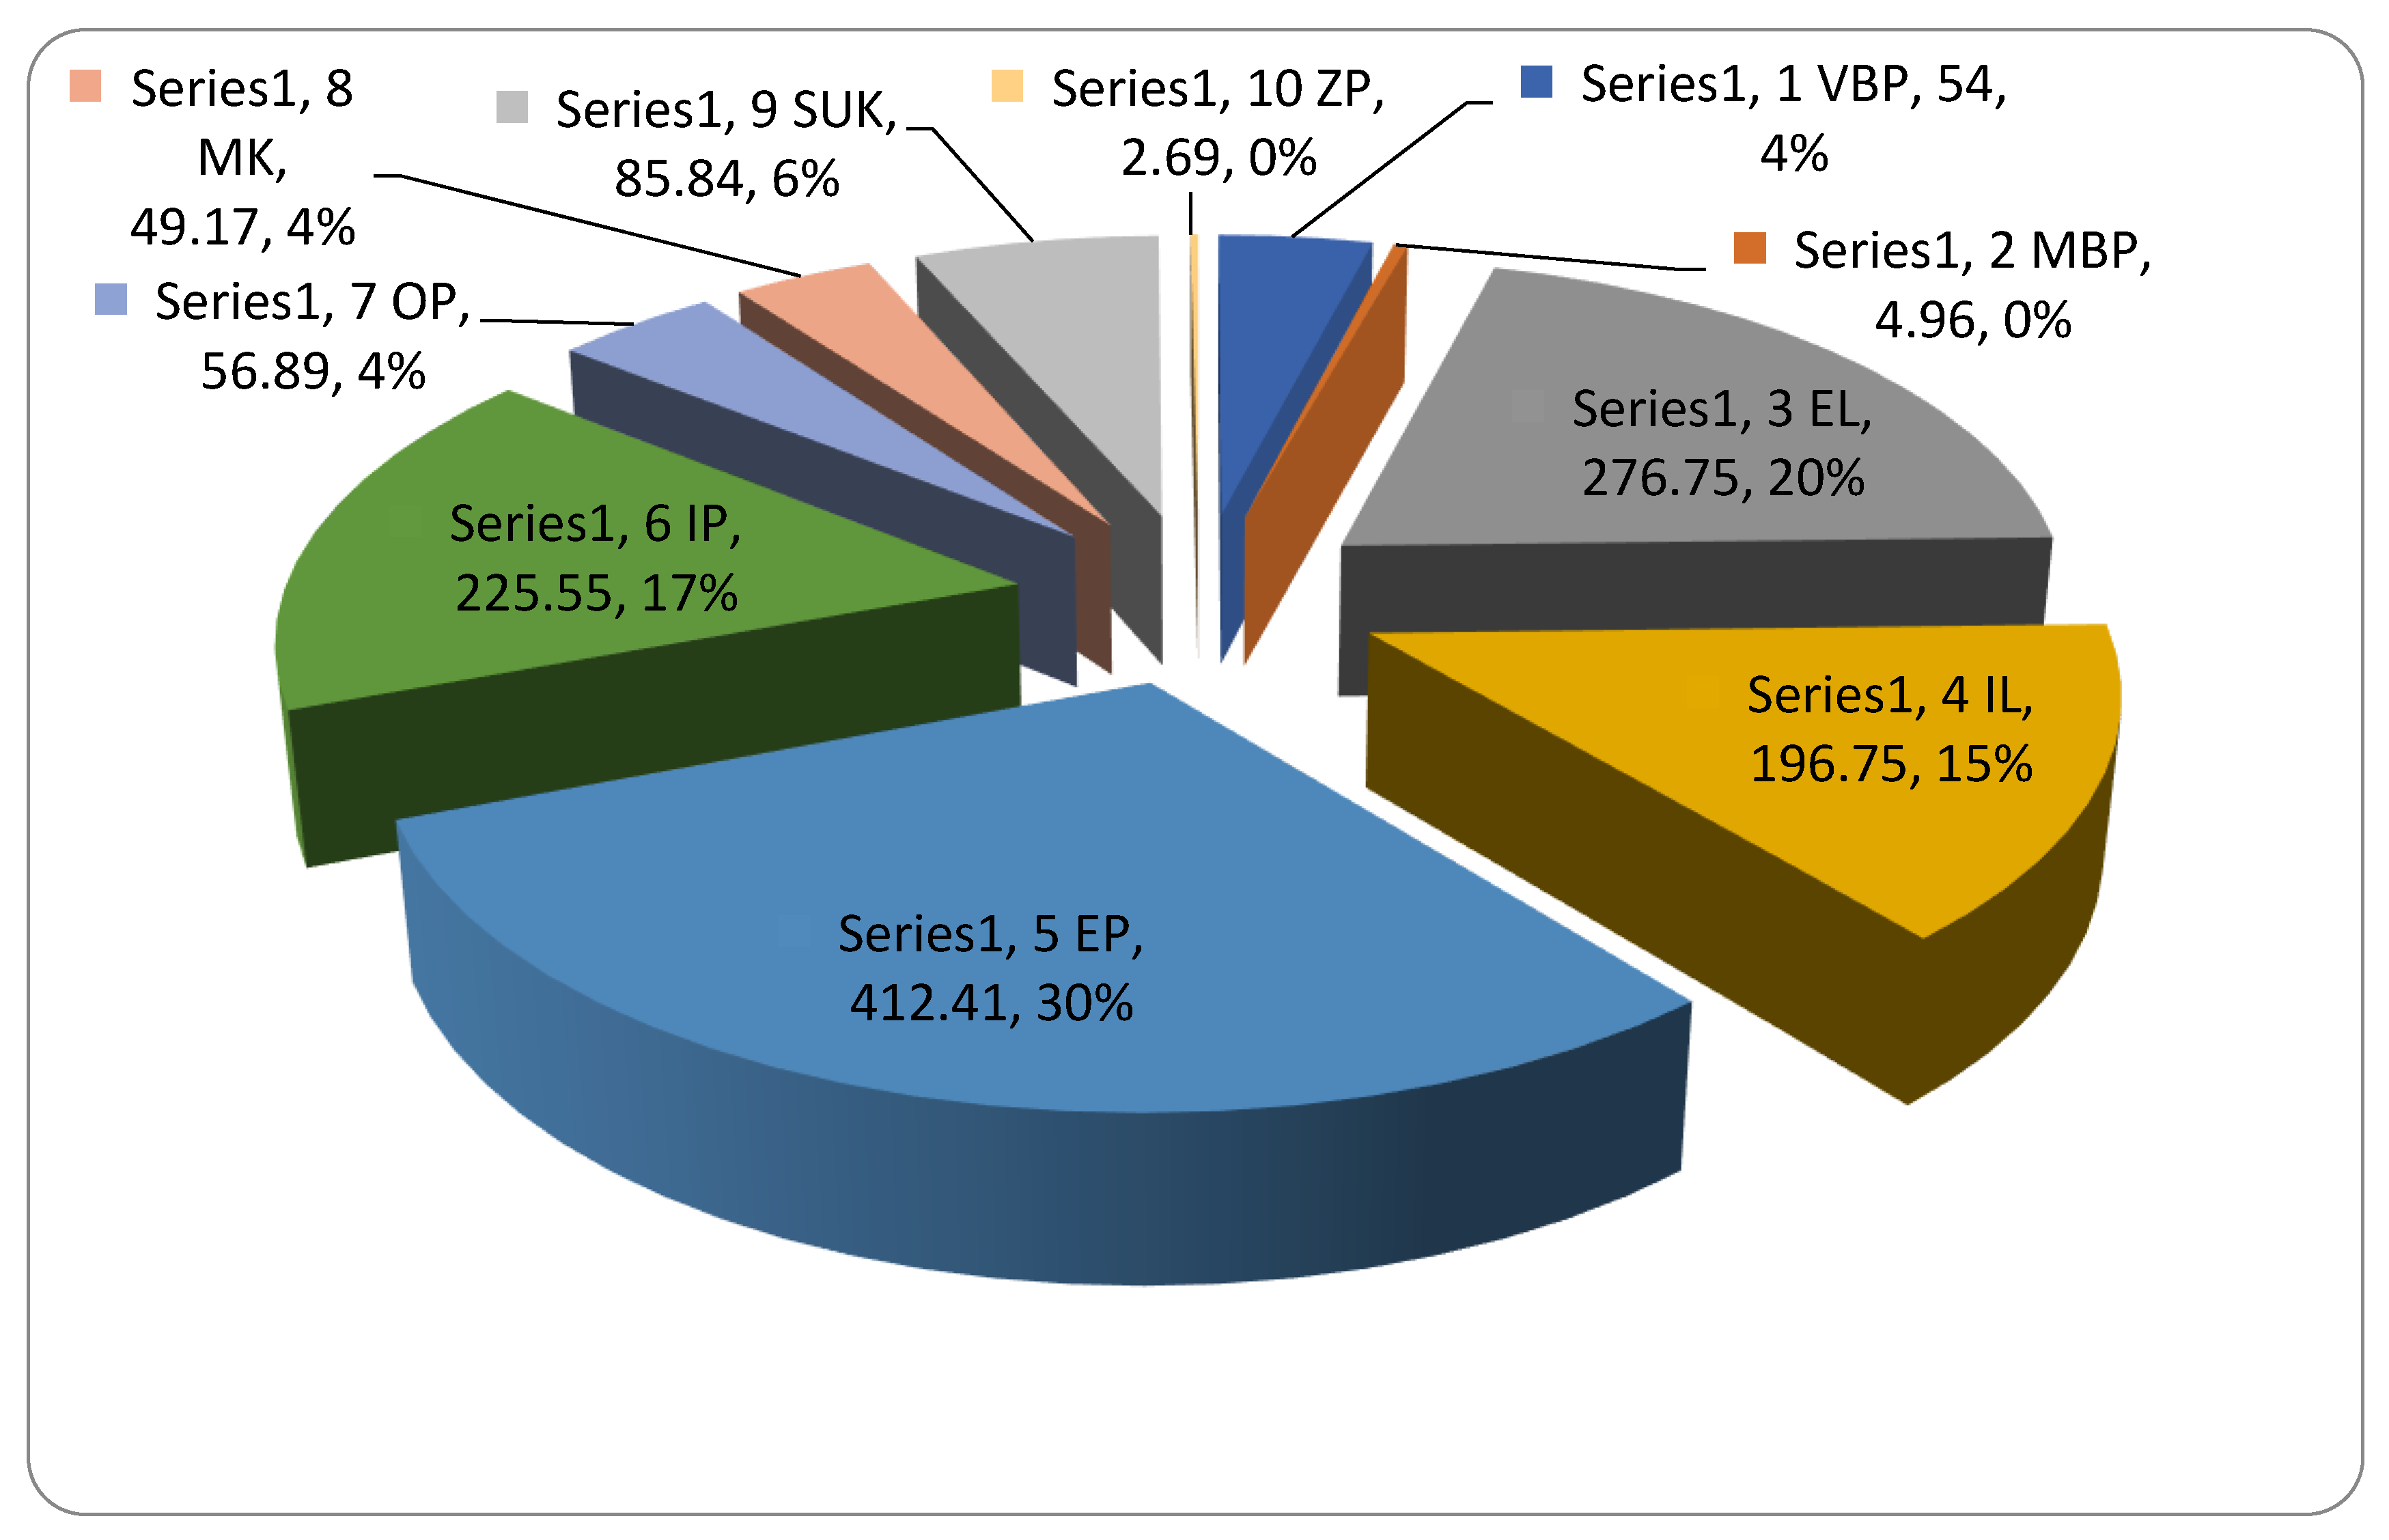
| Element of Secondary Landscape Structure (SLS) CLC (Classification Code) | Retention Coefficient | SLS Area (ha) | SLS Area (%) |
|---|---|---|---|
| Built-up land area (1111) | - | 10.4 | 0.105 |
| Infrastructure (1221) | - | 32.18 | 0.33 |
| Landscaped areas up to 0.5 ha (14,113) | 2 | 1.49 | 0.02 |
| Cemeteries (14,121) | - | 1.30 | 0.01 |
| Home Gardens (1414) | 1.5 | 43.94 | 0.45 |
| Areas with predominantly grass sports areas (14,211) | 1.5 | 27.24 | 0.28 |
| Cottage settlements (14,221) | 1.5 | 0.31 | 0.00 |
| Other Recreation Areas (14,227) | - | 0.73 | 0.01 |
| Large-block fields with NWV up to 10% (2111) | - | 54.00 | 0.55 |
| Small-block fields (2112) | 1.5 | 4.96 | 0.05 |
| Intensively used meadows (23,111) | 3.0 | 196.75 | 2.00 |
| Extensively used meadows (23,112) | 4.0 | 276.75 | 2.81 |
| Abandoned meadows (degree of overgrowth of NWV up to 40%) (23,113) | 4.0 | 36.48 | 0.37 |
| Intensively used pastures (23,121) | 2.0 | 225.55 | 2.29 |
| Extensively used pastures (23,122) | 3.0 | 412.41 | 4.19 |
| Abandoned meadows (degree of overgrowth of NWV up to 40%) (23,123) | 4.0 | 56.89 | 0.58 |
| Mosaics of arable land and PGL (2415) | 3.0 | 49.17 | 0.50 |
| Crossings (3141) | 4.0 | 18.78 | 0.19 |
| Forest Nurseries (31,144) | 4.0 | ||
| Moorlands (322) | 4.0 | 3.30 | 0.03 |
| Groves (3241) | 4.0 | 11.19 | 0.11 |
| Groups of trees, shrubs (3242) | 4.0 | 5.92 | 0.06 |
| Woody riparian vegetation (3243) | 4.0 | 43.80 | 0.44 |
| Woodland line vegetation (3244) | 4.0 | 1.67 | 0.02 |
| Succession stages of woody plants (40 to 80% area coverage) on abandoned areas (3245) | 4.0 | 85.84 | 0.87 |
| Reed vegetation (3246) | 4.0 | 1.15 | 0.01 |
| Synanthropic vegetation with a share of woody plants of up to 40% (3251) | 3.0 | 1.84 | 0.02 |
| Total | 1812.48 | 100.00 |
| LWRC Categories | Retention Class | MSU | MSU/m2 | MSU/% | SLS /m2 | SLS /% | Plot Orientation HSAL | Plot Orientation/m2 | Plot Orientation /% |
|---|---|---|---|---|---|---|---|---|---|
| Very Low Retention (LWRC) (≤30 mm) per year | 1 (1.5–3.1) | 82 (RNa) 92 (RAa) | 141,910.77 25,229.93 | 0.92 | 167,140 | 0.92 | 1 | 6861.04 | 0.04 |
| 2 (3.2–4.4) | 76 (KMa) 78 (KMa) 82 (RNa) 90 (RAa) 92 (RAa) | 969.0 8294.0 308,849.0 136,447.0 194,156.0 | 3.57 | 648,712 | 3.57 | 1 | 97,123.08 | 0.54 | |
| Low retention (LWRC) (30–70 mm) per year | 3 (4.5–5.1) | 76 (KMa) 78 (KMa) 82 (RNa) 90 (RAa) 92 (KMv) | 227,032.73 196,999.56 1,241,504.36 190,898.36 177,833.70 | 11.21 | 2034268 | 11.21 | 1 | 96,445.93 | 0.53 |
| 4 (5.2–6.0) | 78 (KMa) 82 (RNa) 90 (RAa) 92 (KMv) | 461,596.52 777,899.37 737,463.11 2403084.39 | 24.13 | 4,380,043 | 24.13 | 1 2 | 328,326.61 8076.10 | 1.81 0.04 | |
| Medium retention (LWRC) (70–110 mm) per year | 5 (6.1–7.0) | 78 (KMa) 82 (RNa) 90 (RAa) 92 (RAa) 84 (KMg) | 1298578.64 659407.44 1068059.66 26963.91 88452.65 | 18.65 | 3,384,131 | 18.65 | 1 2 3 | 266,635.71 233,905.67 30323.16 | 1.47 1.29 0.17 |
| 6 (7.1–8.2) | 78 (KMa) 82 (KMa) 90 (RAa) 92 (RAa) 84 (KMg) | 1,793,815.64 358,105.05 2,018,434.20 124,535.52 126,224.01 | 24.36 | 4,421,114 | 24.36 | 1 2 3 | 526,225.11 112,168.83 234,057.81 | 2.90 0.62 1.29 | |
| High retention (LWRC) (110–150 mm) per year | 7 (8.3–9.4) | 78 (KMa) 12 (FMG) 90 (RAa) 92 (RAa) 84 (KMg) | 588,546.26 266,251.71 793,256.22 77,149.10 155,163.47 | 10.91 | 1,980,066 | 10.91 | 1 2 3 | 229780.55 4219.81 125,721.83 | 1.27 0.23 0.69 |
| 8 (9.5–10.4) | 78 (KMa) 90 (RAa) 84 (KMg) | 5612.33 140,050.63 270,956.21 | 2.3 | 440,226 | 2.3 | 1 2 3 | 20624.68 81,255.49 40,983.87 | 0.11 0.45 0.23 | |
| Very high retention (LWRC) (≥150 mm) per year | 9 (10.5–11.4) | 12 (FMG) 90 (RAa) | 68,580.00 122,428.86 | 1.5 | 191,008 | 1.5 | 1 2 3 | 6582.19 289,296 68,059.78 | 0.79 0.04 0.38 |
| 10 (11.5–13.2) | 12 (FMG) 90 (RAa) | 68,580.00 122,428.86 | 0.08 | 1065 | 0.08 | 2 3 | 9422.39 2426.01 | 0.05 0.01 | |
| Paved surfaces and isolated forests | 487,669 | 2.69 | 487,669 | 2.69 | 0 | 0 | 0 | ||
| Total | 18,124,843 | 18,124,843 | 2,298,492 |
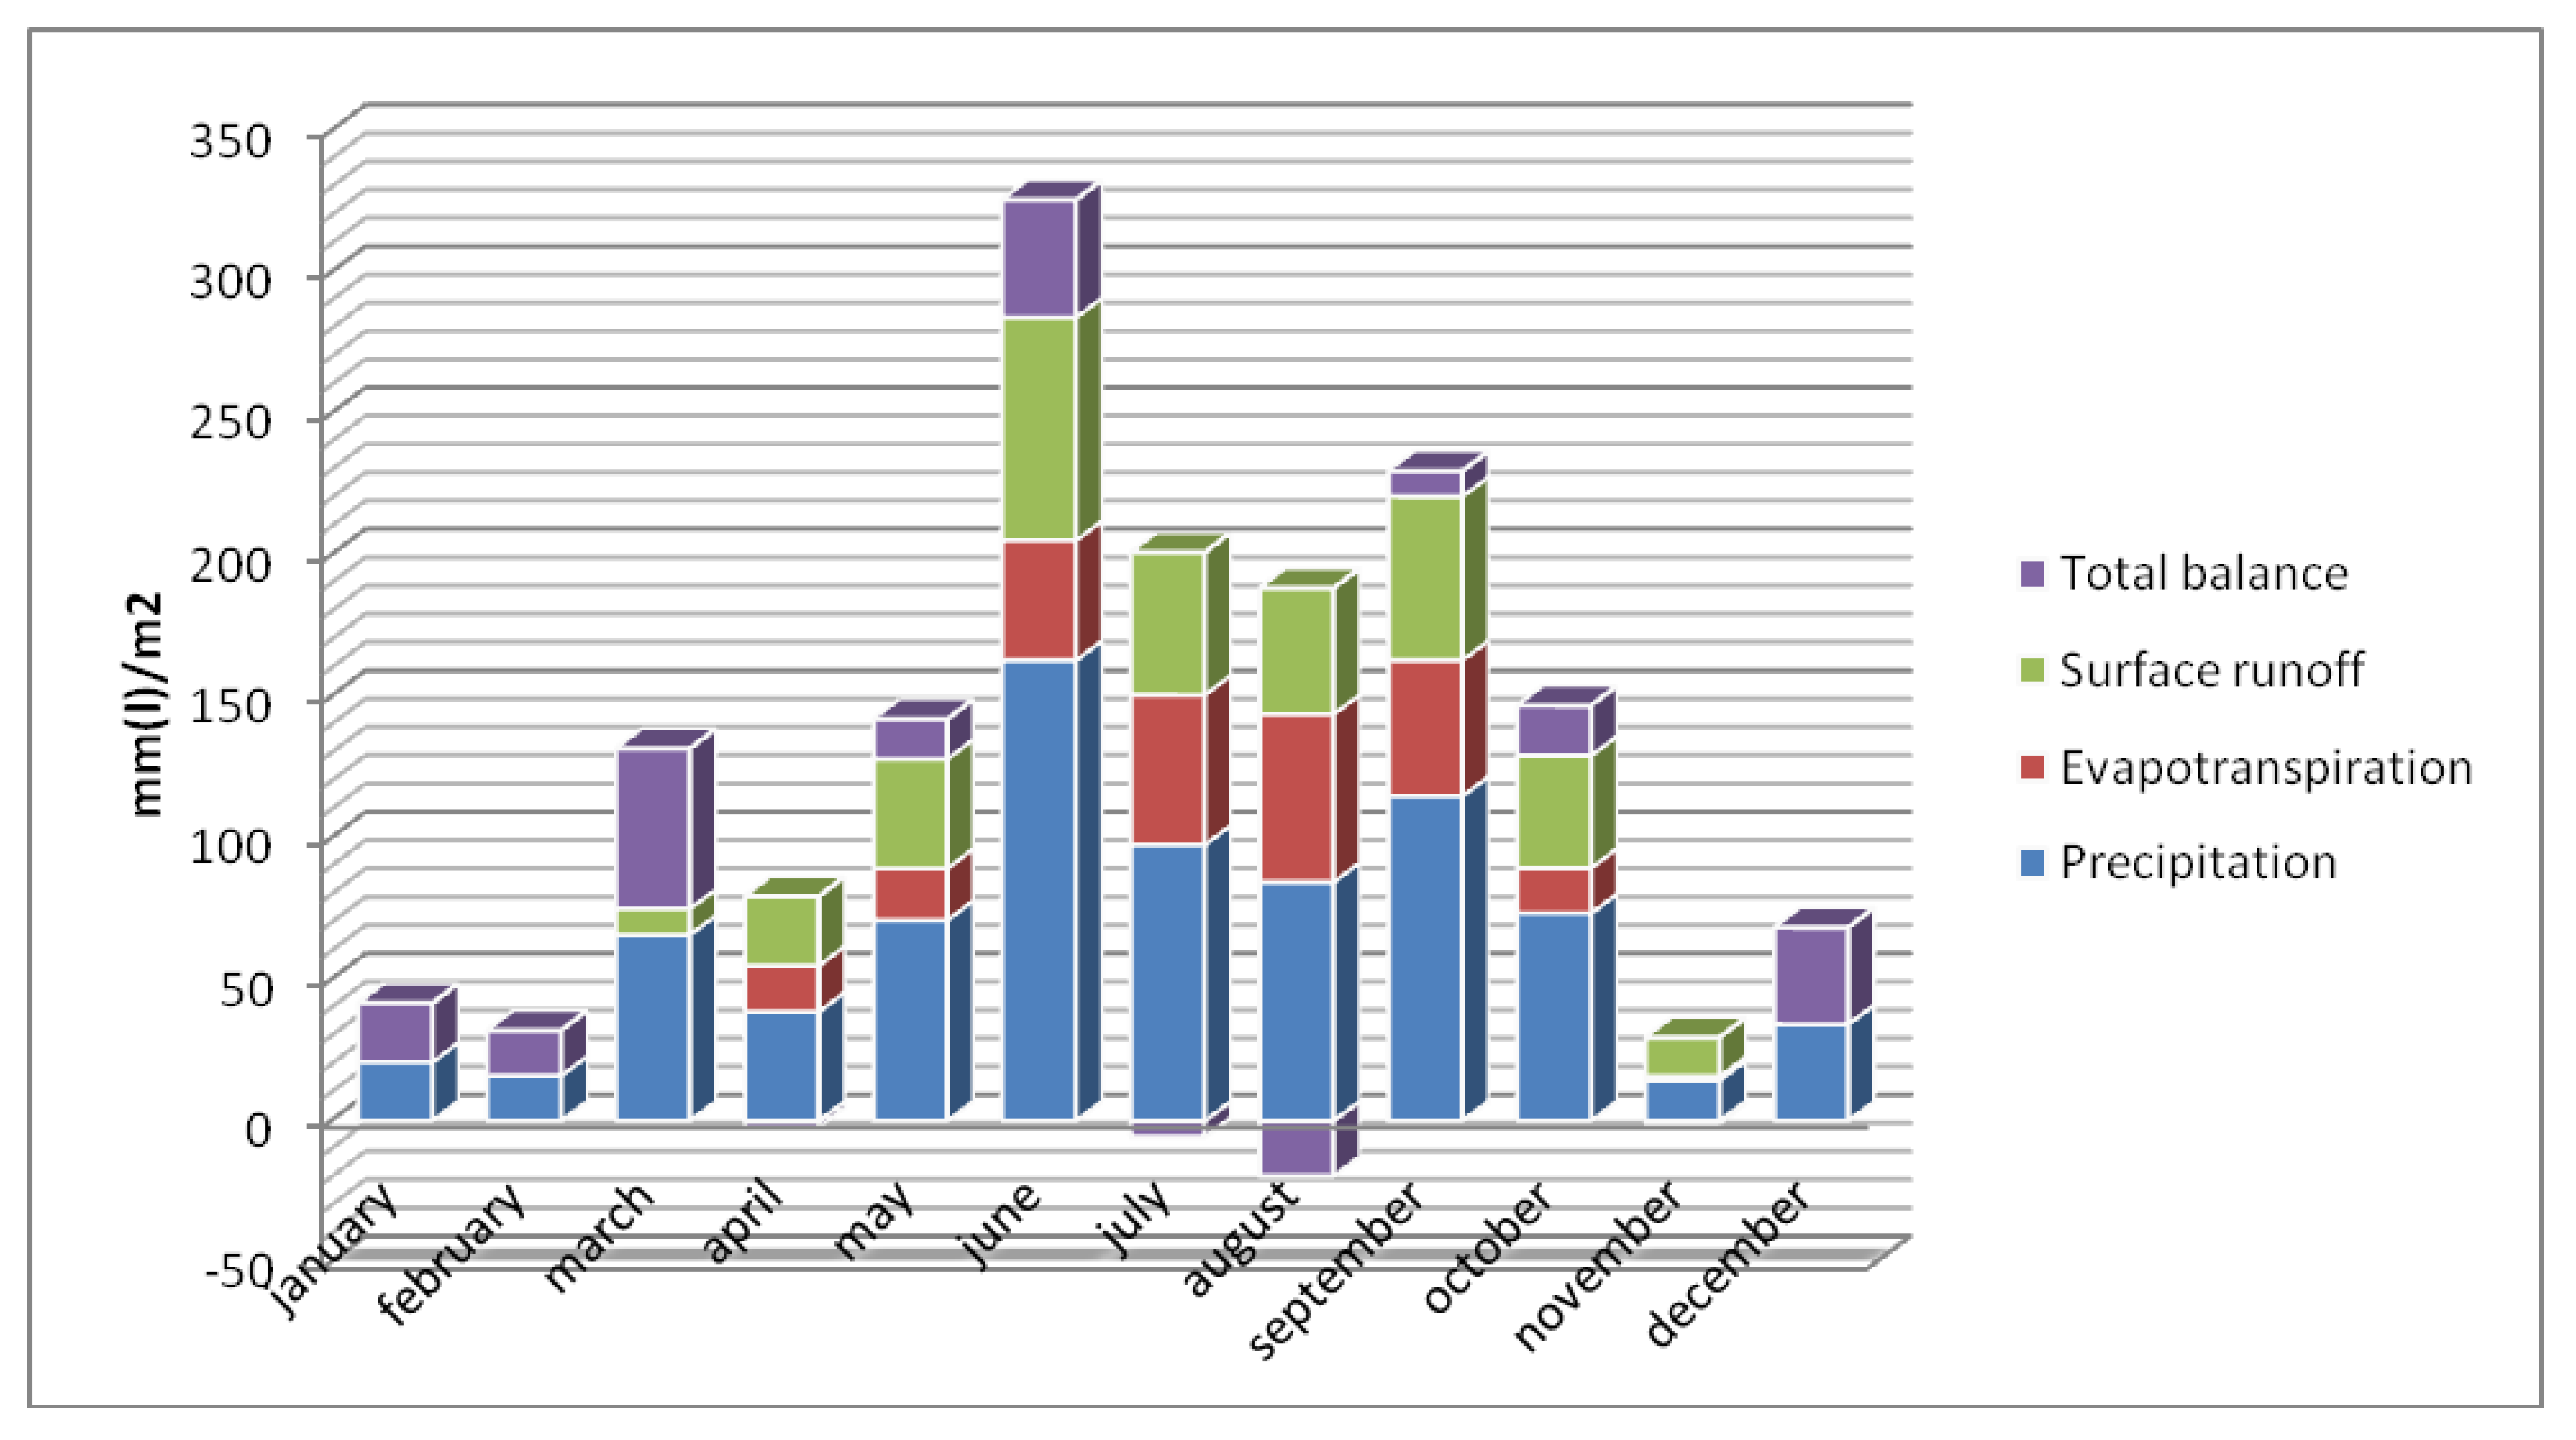
| Month | Temperature Average—°C | Precipitation—mm/m2 | Evapotranspiration—mm/m2 | Surface Runoff—mm/m2 | Total Balance |
|---|---|---|---|---|---|
| January | −2.56 | 20.8 | 0 | 0 | 20.8 |
| February | −7.79 | 16 | 0 | 0 | 16 |
| March | −3.55 | 65.8 | 0 | 9.21 | 56.59 |
| April | 9.00 | 38.6 | 16.28 | 24.44 | −2.12 |
| May | 11.40 | 71 | 18.3 | 38.65 | 14.05 |
| June | 13.28 | 162.8 | 42.34 | 78.93 | 41.53 |
| July | 14.83 | 97.6 | 52.96 | 50.32 | −5.68 |
| August | 15.49 | 84.4 | 59.31 | 44.53 | −19.44 |
| September | 10.40 | 114.8 | 48 | 57.87 | 8.93 |
| October | 6.70 | 73.4 | 16 | 39.71 | 17.69 |
| November | 1.11 | 14.4 | 1.3 | 13.81 | −0.71 |
| December | −3.78 | 34.2 | 0 | 0 | 34.2 |
| year | Average Temperature | Total Precipitation | Total Evapotranspiration | Total Surface Runoff | Balance in mm/m2—Whole Year |
| 2018 | 5.50 | 793.8 | 254.49 | 357.47 | LWRC 181.84 |
| Soil Water Retention Capacity (SWRC) | |||||
|---|---|---|---|---|---|
| Category of SWRC | Degree of Water Retention Capacity (WRC) | Area (m 2) | Area (ha) | Area (%) | Category of Water Resources (Resources Derived from FWC) |
| Very Low | 1 | 769,260.57 | 76.93 | 4.26 | (≤50 mm) |
| 2 | 1,389,818.47 | 138.98 | 7.70 | ||
| Low | 3 | 3,128,321.25 | 312.83 | 17.33 | |
| 4 | 1,169,236.12 | 116.92 | 6.48 | ||
| Medium | 5 | 800,037.31 | 80.00 | 4.43 | (51–100 mm) |
| 6 | 1,830,055.31 | 183.01 | 10.14 | ||
| High | 7 | 3,655,225.27 | 365.52 | 20.25 | ≥100 mm |
| 8 | 3,909,126.74 | 390.91 | 21.66 | ||
| Very high | 9 | 1,281,727.29 | 128.17 | 7.10 | |
| 10 | 121,210.15 | 12.12 | 0.67 | ||
| Total | 18,124,818.48 | 1812.48 | 100 | ||
Publisher’s Note: MDPI stays neutral with regard to jurisdictional claims in published maps and institutional affiliations. |
© 2020 by the authors. Licensee MDPI, Basel, Switzerland. This article is an open access article distributed under the terms and conditions of the Creative Commons Attribution (CC BY) license (http://creativecommons.org/licenses/by/4.0/).
Share and Cite
Krnáčová, Z.; Kenderessy, P.; Hreško, J.; Kubínsky, D.; Dobrovodská, M. Assessment of Landscape Retention Water Capacity and Hydrological Balance in Traditional Agricultural Landscape (Model Area Liptovská Teplička Settlements, Slovakia). Water 2020, 12, 3591. https://doi.org/10.3390/w12123591
Krnáčová Z, Kenderessy P, Hreško J, Kubínsky D, Dobrovodská M. Assessment of Landscape Retention Water Capacity and Hydrological Balance in Traditional Agricultural Landscape (Model Area Liptovská Teplička Settlements, Slovakia). Water. 2020; 12(12):3591. https://doi.org/10.3390/w12123591
Chicago/Turabian StyleKrnáčová, Zdena, Pavol Kenderessy, Juraj Hreško, Daniel Kubínsky, and Marta Dobrovodská. 2020. "Assessment of Landscape Retention Water Capacity and Hydrological Balance in Traditional Agricultural Landscape (Model Area Liptovská Teplička Settlements, Slovakia)" Water 12, no. 12: 3591. https://doi.org/10.3390/w12123591