Article

Analysis of the Water Level Variation in the Polish Part of the Vistula Lagoon (Baltic Sea) and Estimation of Water Inflow and Outflow Transport through the Strait of Baltiysk in the Years 2008–2017

Faculty of Civil and Environmental Engineering, Gdańsk University of Technology, Narutowicza 11/12, 80-233 Gdańsk, Poland
*
Author to whom correspondence should be addressed.
Water 2021, 13(10), 1328; https://doi.org/10.3390/w13101328
Submission received: 17 March 2021 / Revised: 25 April 2021 / Accepted: 8 May 2021 / Published: 11 May 2021

Abstract

:
The Vistula Lagoon is located in both Poland and Russia along the southern coast of the Baltic Sea. It is connected to the Baltic Sea in the Russian part by the Strait of Baltiysk. The purpose of the paper is to identify the dominant factors underlying the water level variation mechanism at Tolkmicko in the Vistula Lagoon, revealed by a statistical analysis of the measured data and a discussion on the inflow and outflow transport variation through the strait, estimated by numerical modeling. Seawater transport is exceptionally valuable in terms of the hydrological water balance in the lagoon. Historical research on the hydrology of the lagoon shows that the water exchange in the lagoon is quite complex due to the presence of several different sources of water balance, such as seawater inflow, river inflow, groundwater inflow, precipitation, and evaporation. Unfortunately, there are no current data on seawater inflow and outflow through the Strait of Baltiysk due to the lack of continuous flow measurements in the strait. A novelty of the current work is an in-depth statistical analysis of the water level variation in the Polish part of the lagoon over a long time period and an estimation of water transport through the Strait of Baltiysk by use of a numerical model. The model reproduces well the water level variation responding to variations in the sea level outside the lagoon and the wind action over the lagoon. The years 2008–2017 were chosen as the analysis period. A two-dimensional free surface shallow water numerical model of the lagoon was adapted to simulate the water level variation in view of the wind over the lagoon and the sea level variation at one open boundary. Finally, it was concluded that the water level variation on the Polish side of the Vistula Lagoon is dominated by two factors: the water level in the Gulf of Gdańsk and the wind over the lagoon. The average annual marine water inflow into the Vistula Lagoon was estimated to be equal to 15.87 km3.

1. Introduction

Coastal lagoons are defined in [1] as inland and shallow water bodies with depths not exceeding a few meters and separated from the sea by a barrier (usually sand). They are connected to the sea by at least one restricted inlet. The orientation of a lagoon may vary, but being parallel to the shore is the dominant feature. According to [2], coastal lagoons occur on about 12% of the length of the world’s coastline. The formation of lagoons can be caused by alluvial progradation, the transgression of barriers in response to a sea level rise or they can be formed behind storm-surge barriers. Some examples of this last type of formation can be found on the southern shores of the Baltic Sea. One of them is the Vistula Lagoon (Figure 1) as well as the neighboring Curonian Lagoon [3].
The water movement in the Vistula Lagoon is related to variations in the sea level in the Gulf of Gdańsk and to the wind action on the water surface of the lagoon [5]. When the water stage of the Gulf of Gdańsk rises over the water level in the lagoon, a water current occurs directed into the lagoon. A reduction in the sea level in the Baltic Sea to below the lagoon water level causes the lagoon water to flow into the sea creating a current in the strait in the opposite direction. The long-term damming of water in the southern part of the lagoon can be a cause of flood risk for the lowland areas of Żuławy Elbląskie (Figure 1) [4]. The mechanism underlying the water level variation in the Polish part of the Vistula Lagoon is considered in this paper. It was estimated in the past that the mean total volume of seawater flowing into the lagoon reaches 15–18 km3 per year [6,7]. Unfortunately, there are no full, continuous, and current data (measurements) on the seawater transport between the Gulf of Gdańsk and the Vistula Lagoon. Recently, Russian researchers started to measure the flow through the strait, but so far only two series of measurements of approximately one month are available [8]. The annual volume of marine water inflow is usually cited and estimated by researchers like [4,5,9,10,11,12] using only data from historical sources such as [6,13]. This identified knowledge gap in the water balance of the Vistula Lagoon is also investigated in this paper.
The main objectives being also parts of the present work are:
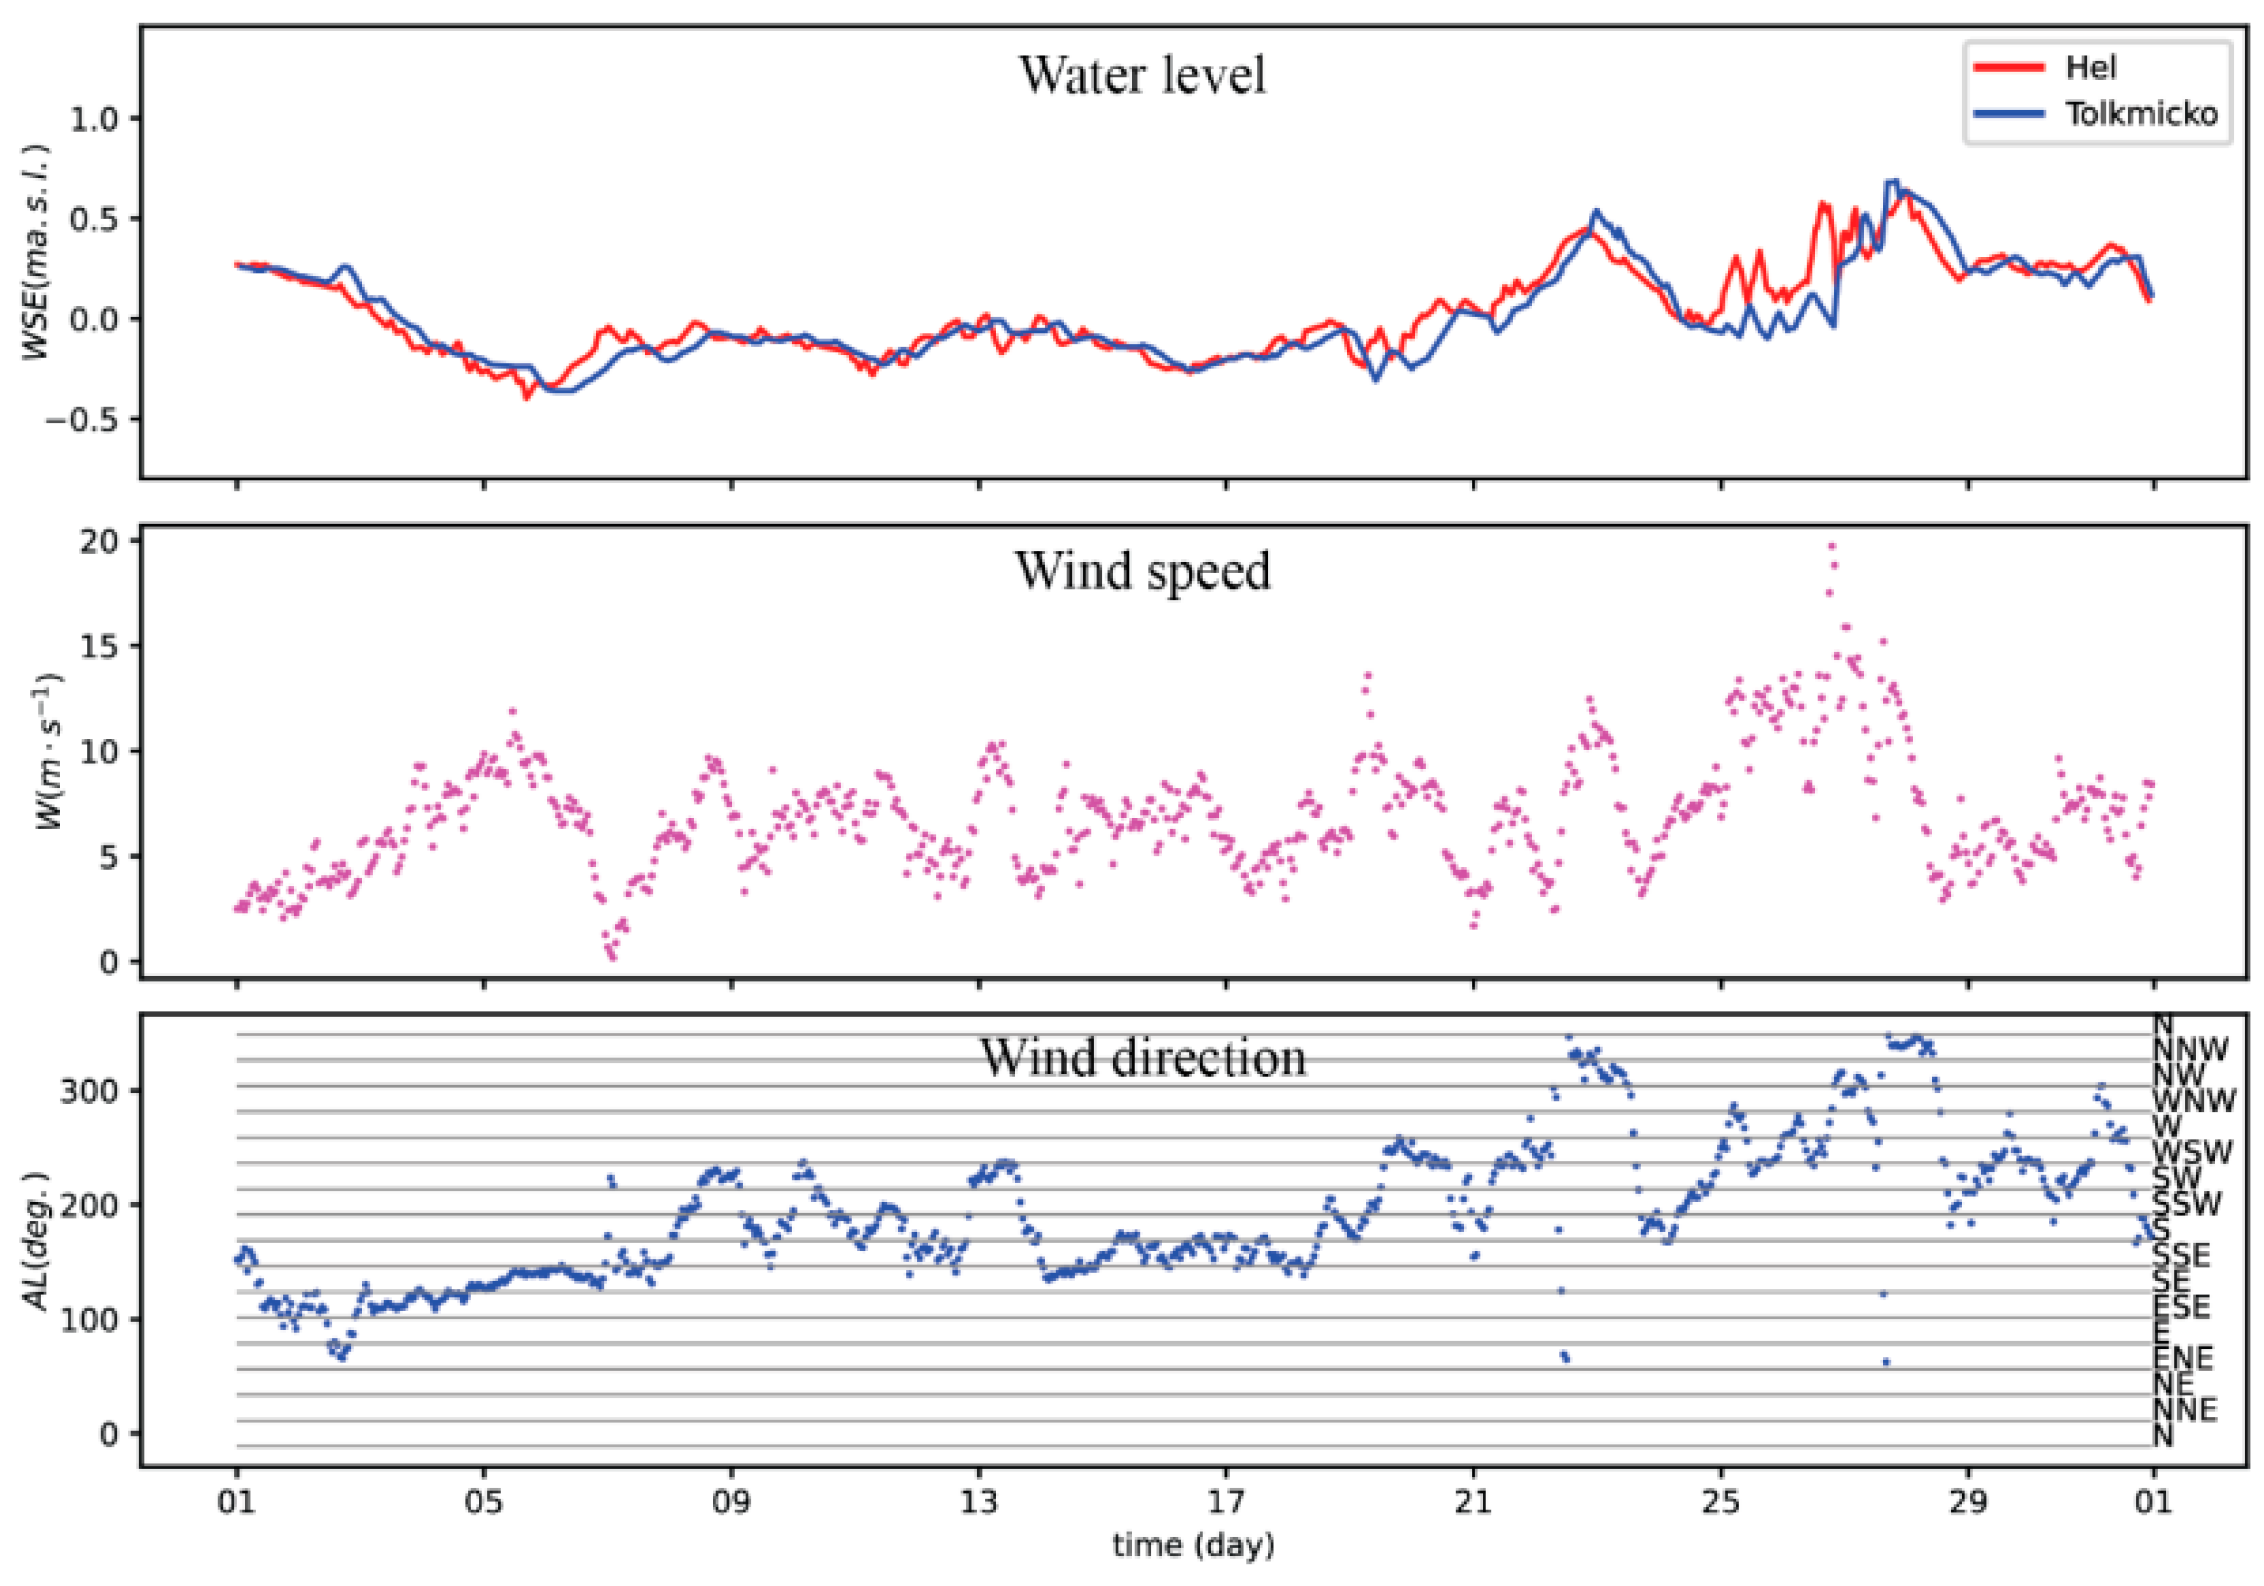
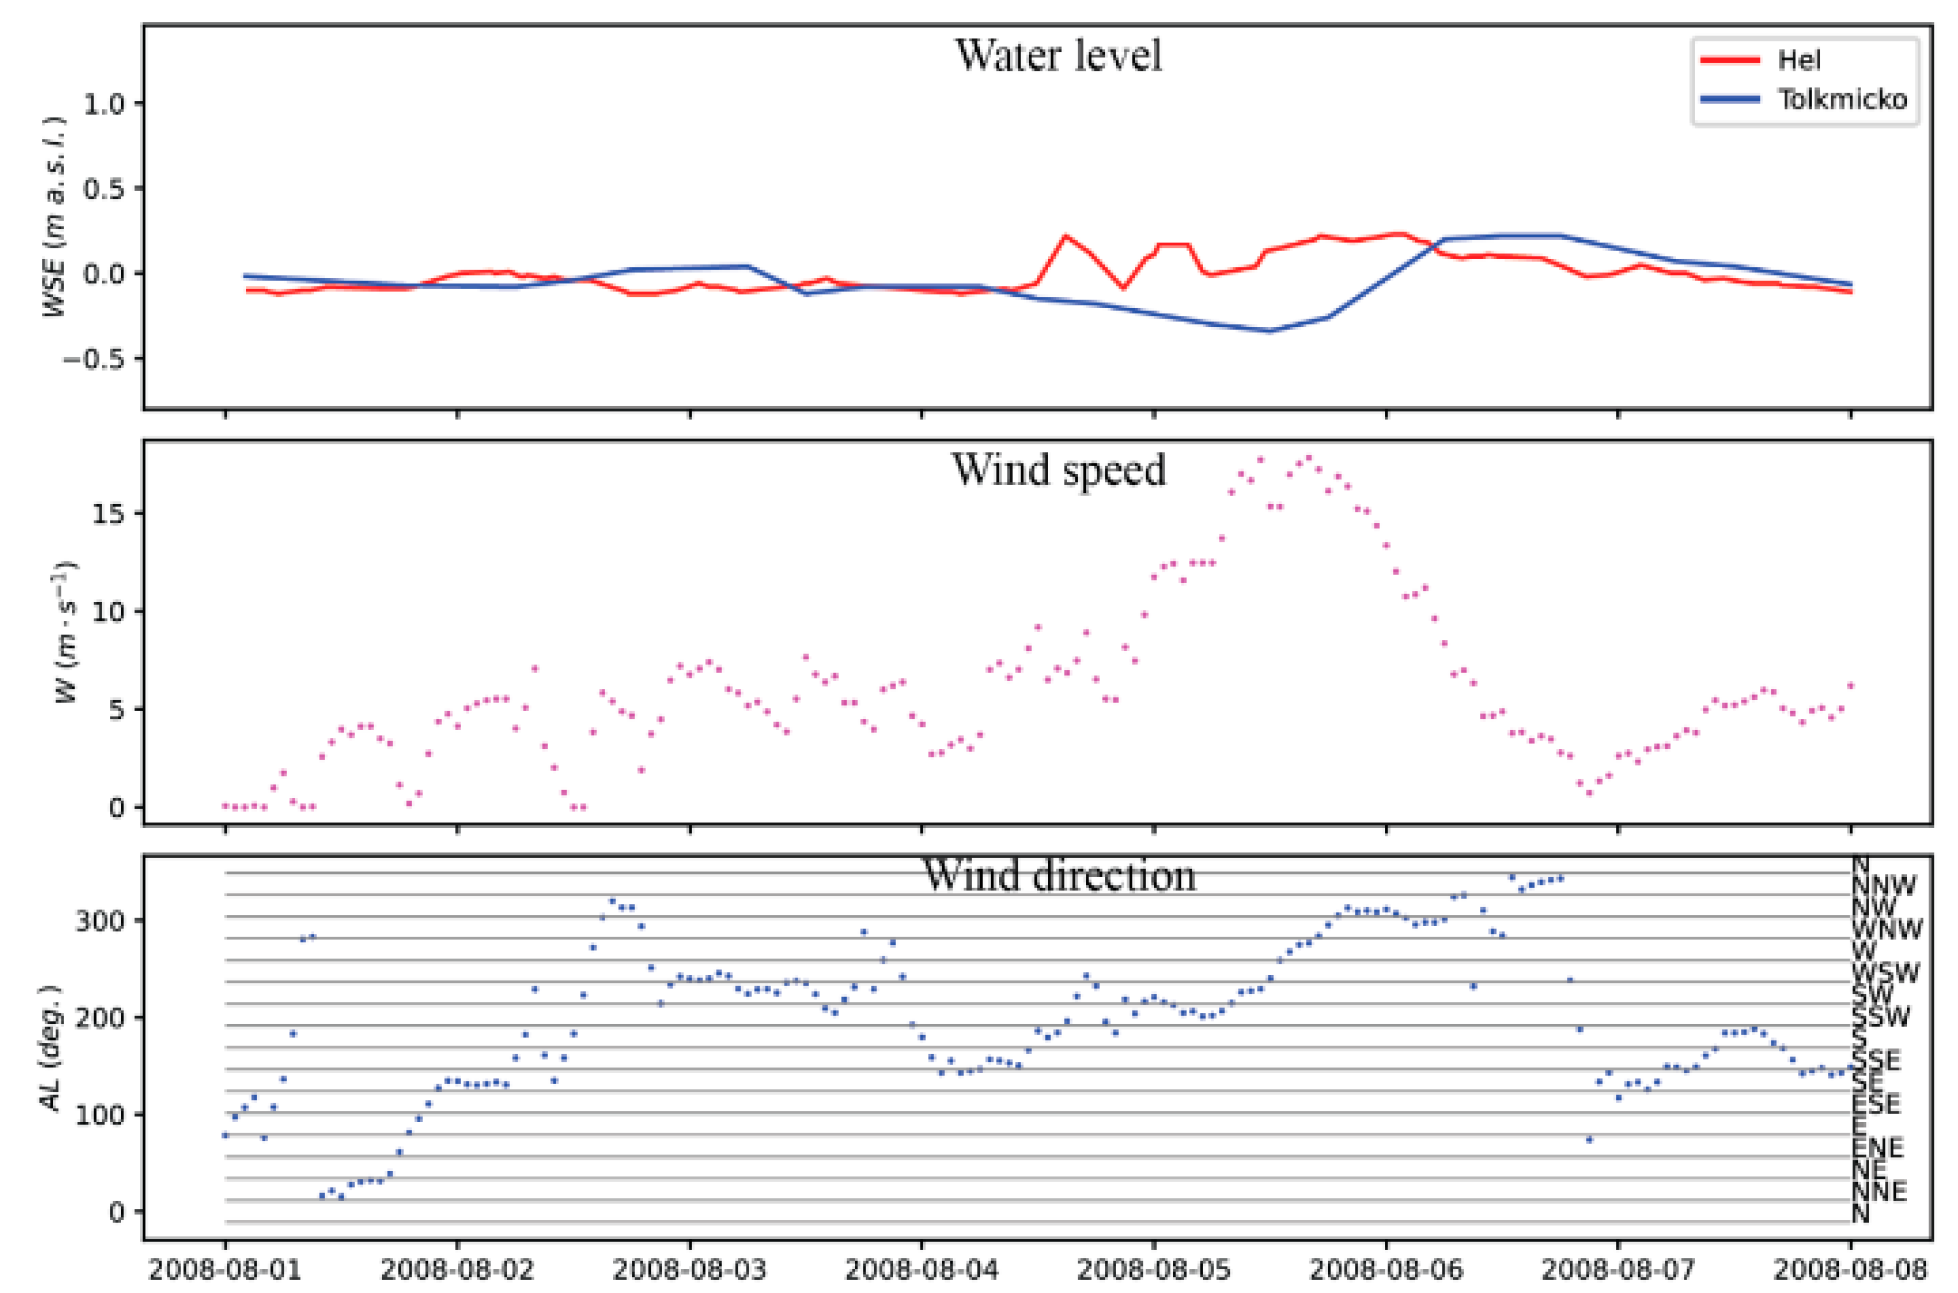
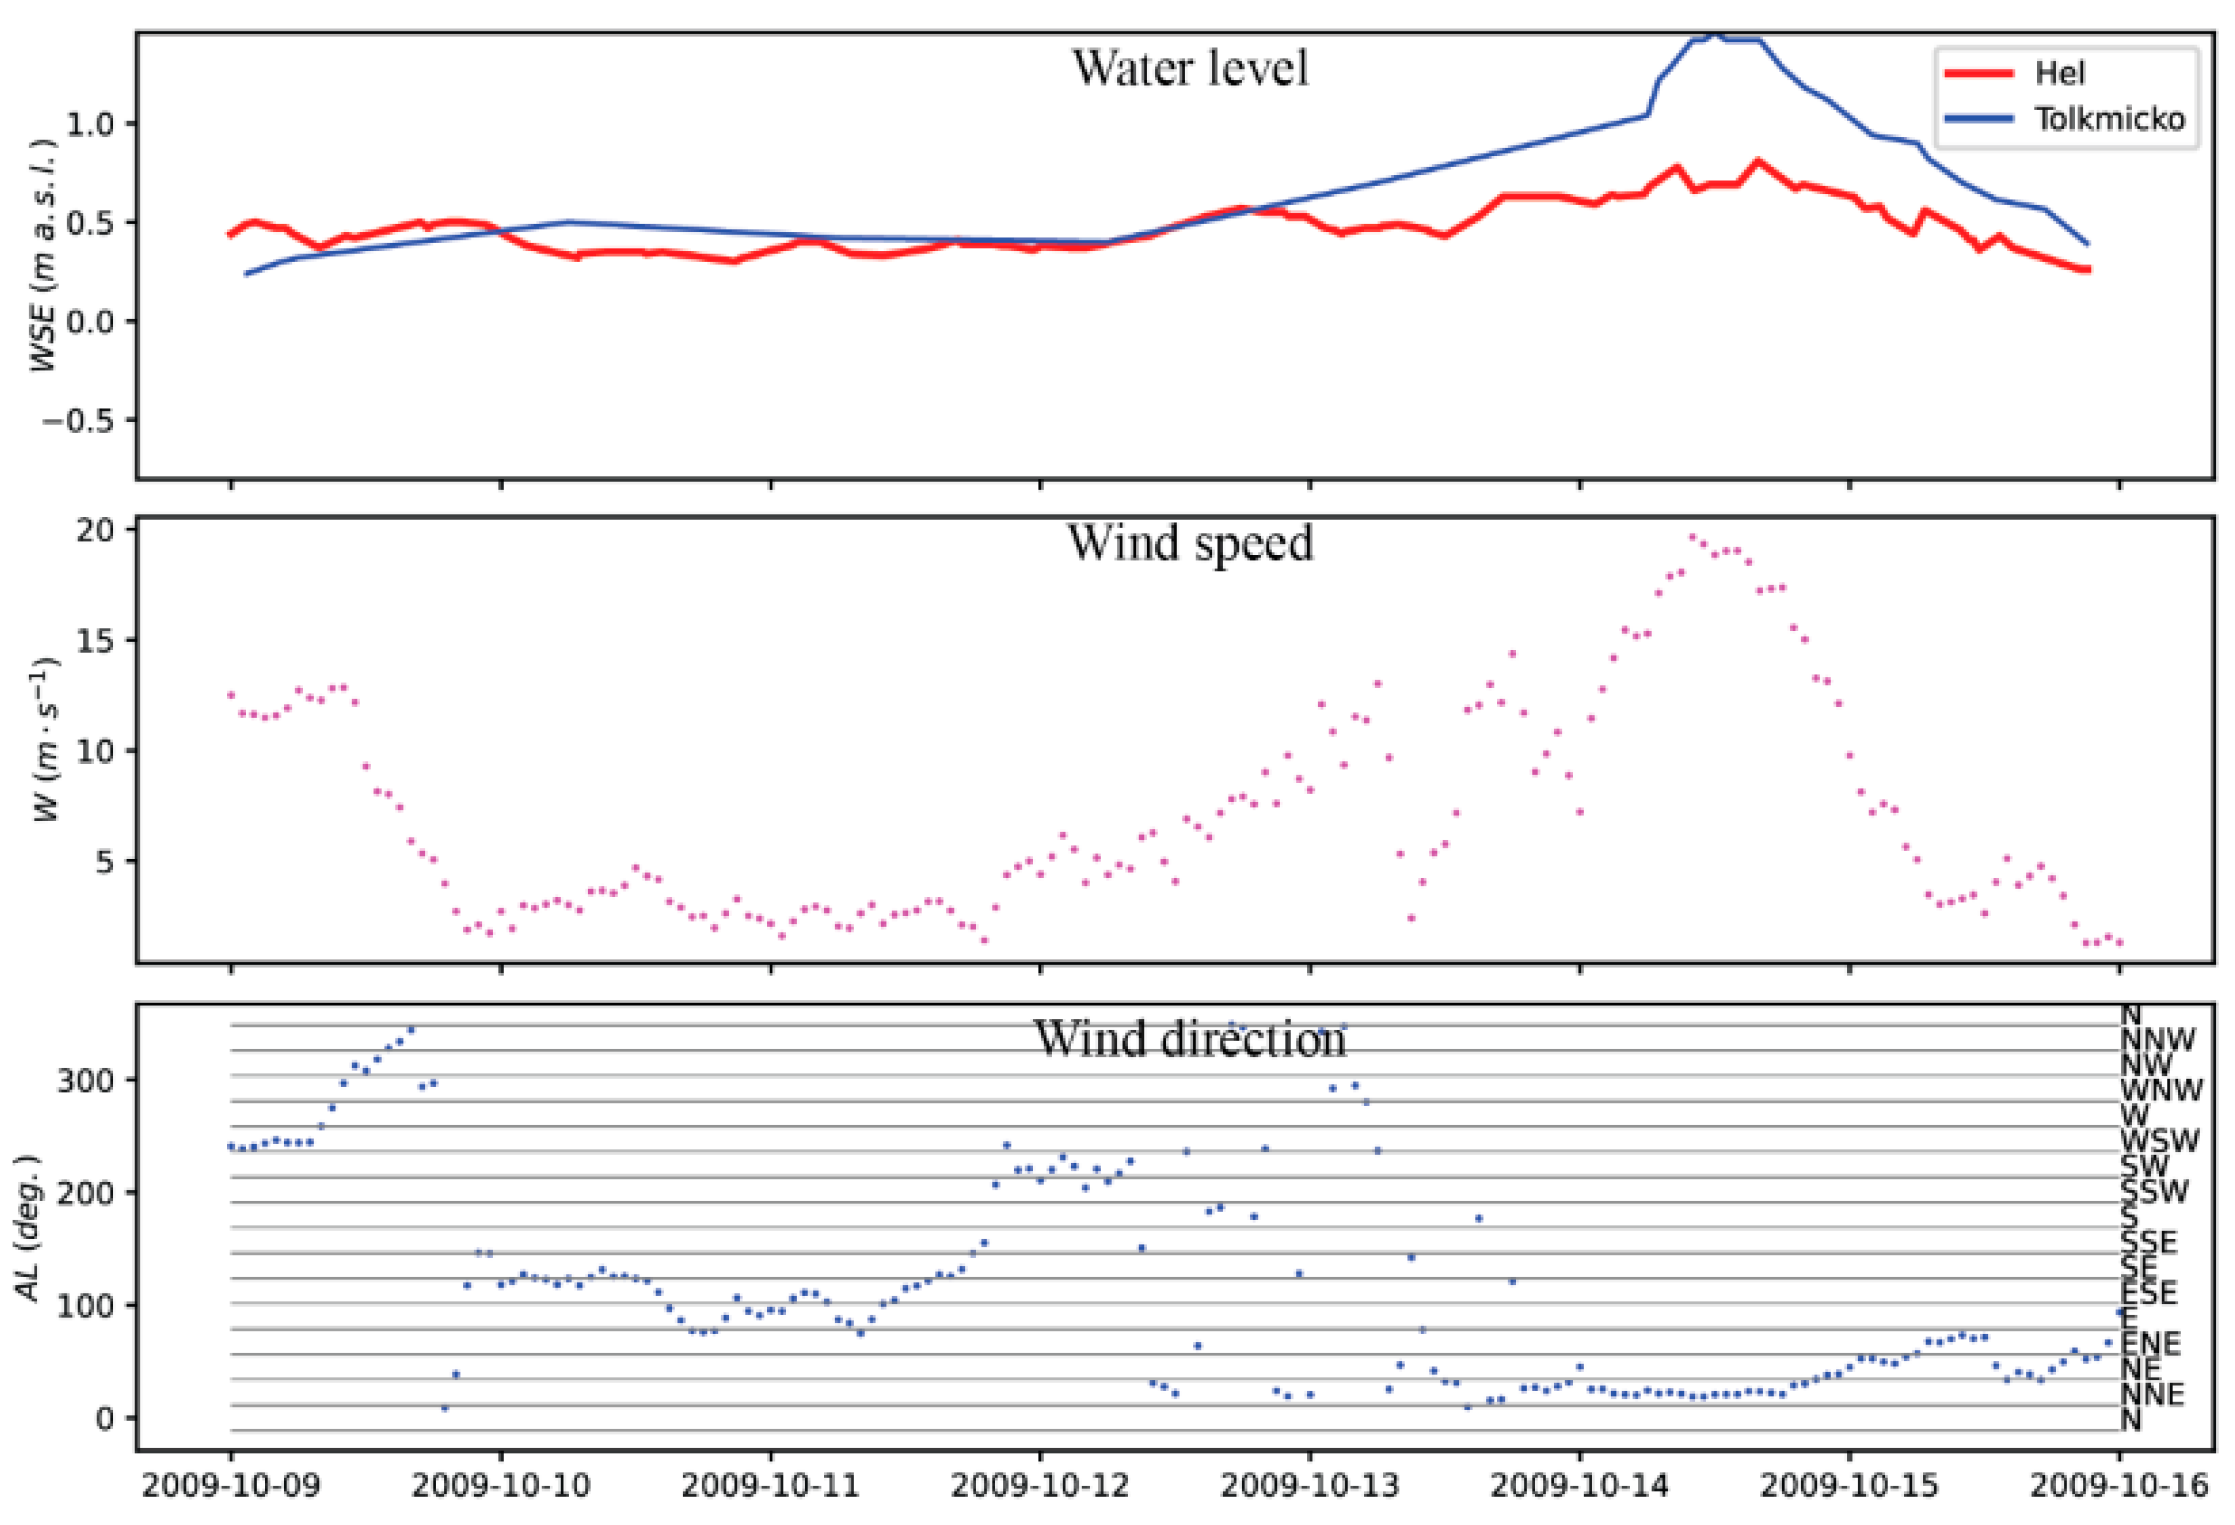
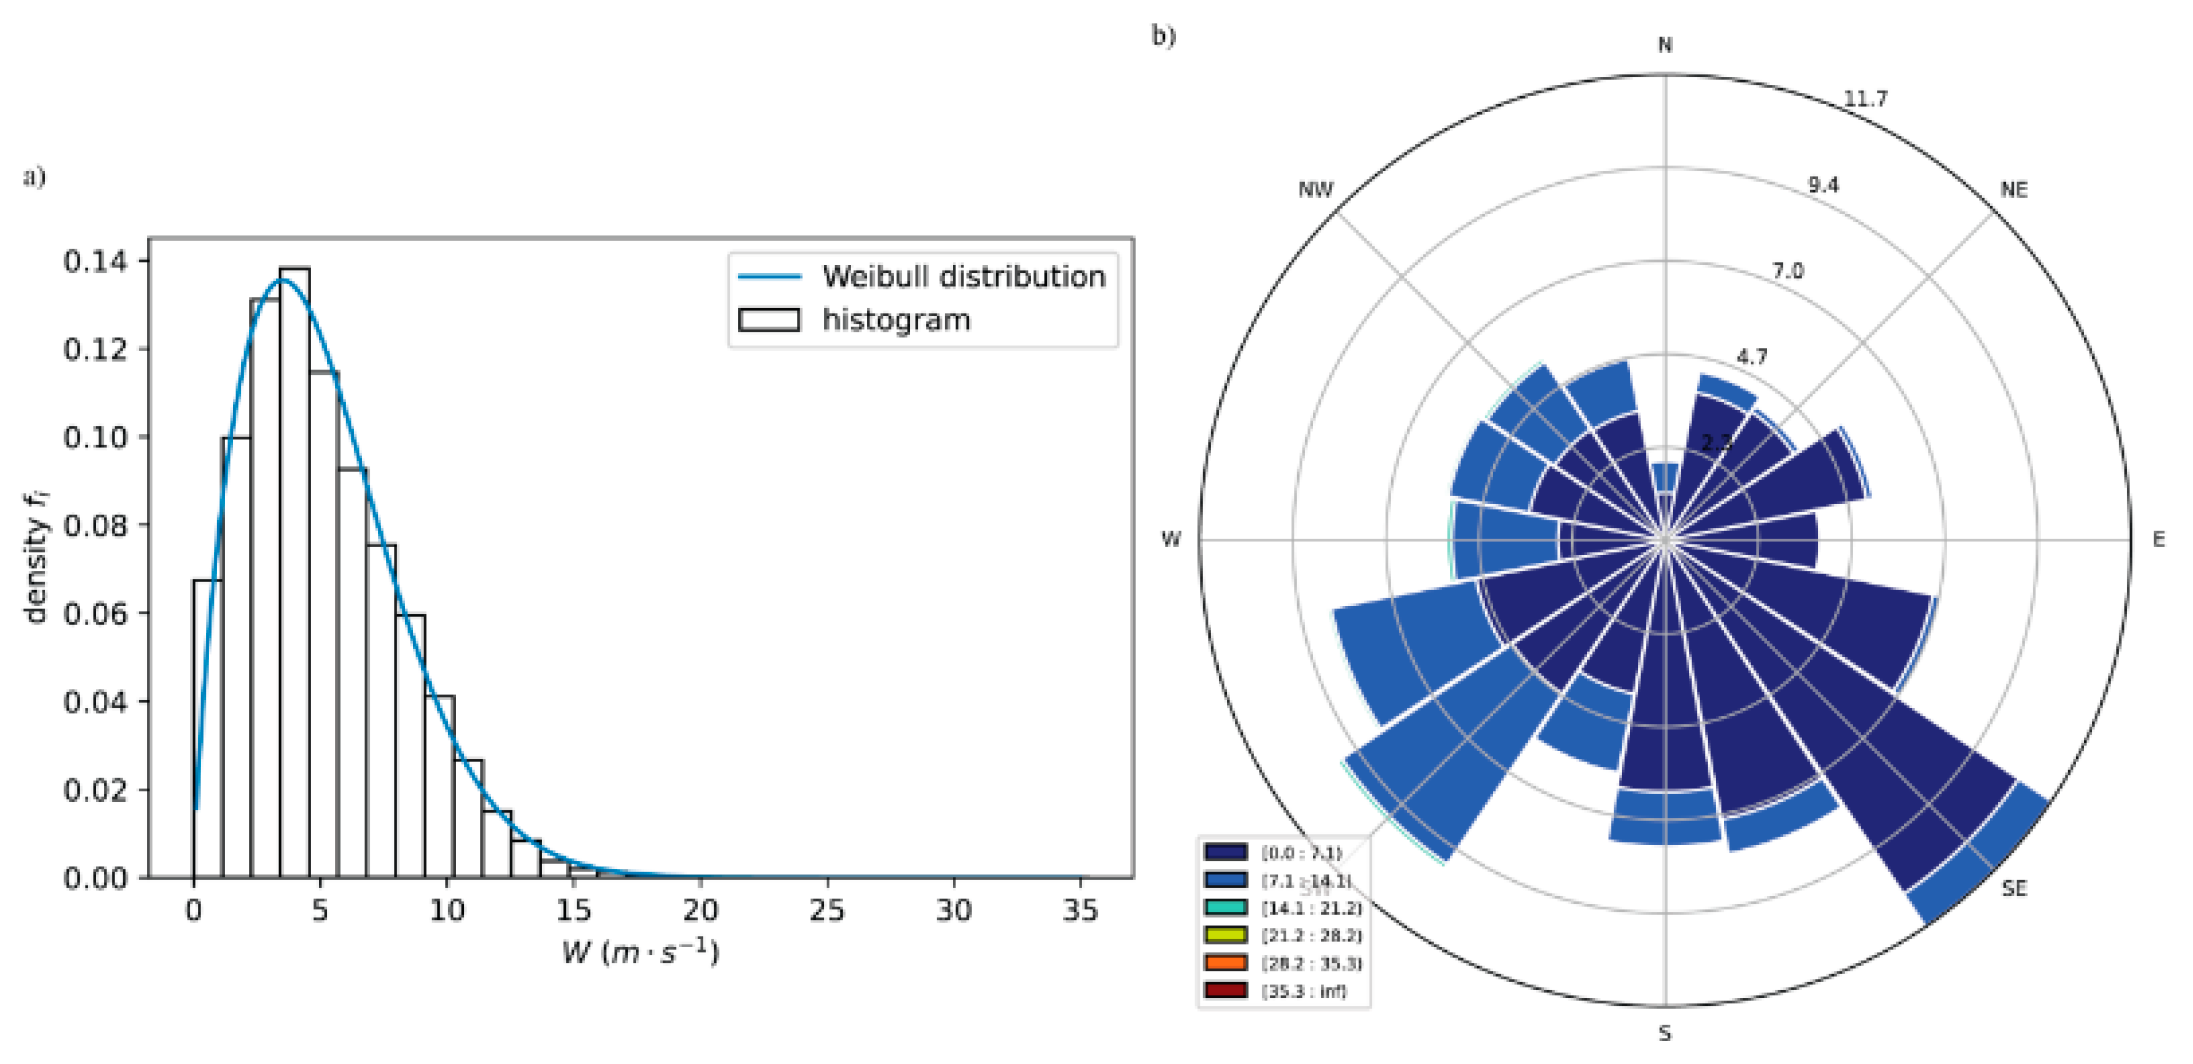
  • a statistical analysis of the water level variation at Tolkmicko station to identify the factors of water damming in the southern part (Polish) of the Vistula Lagoon (the measurements of the water stages in the lagoon and in the Gulf of Gdańsk, as well as wind observations at Nowa Pasłęka meteorological station were used for this research),
  • a validation of the shallow water equations model [4] adopted to simulate the hydrodynamics of the lagoon over a long period of time (the water stage field measurements from Tolkmicko were used for comparison with the calculations),
  • a computational estimation of the marine water transport between the Baltic Sea and the Vistula Lagoon (a numerical simulation of the hydrodynamics of the Vistula Lagoon was carried out for the period 2008–2017).
To the best of the authors’ knowledge, such a long-term study (10-year period) on the hydrodynamics of the Vistula Lagoon has not been conducted so far. Moreover, the results of the work improve the general knowledge of the hydrological characteristics of the lagoon. It should be noted that the water flow rate in the Strait of Baltiysk reaches even 10,000 m3s−1 [6,7]. The total inflow from all the rivers entering into the lagoon is about 180 m3s−1 [6,7], yet this was not investigated in this case study due to the lack of continuous measurements. However, in order to make a full hydrological balance of the water exchange in the lagoon, each of the hydrological elements such as river inflow, ground inflow, precipitation and evaporation should be considered.

2. Materials and Methods
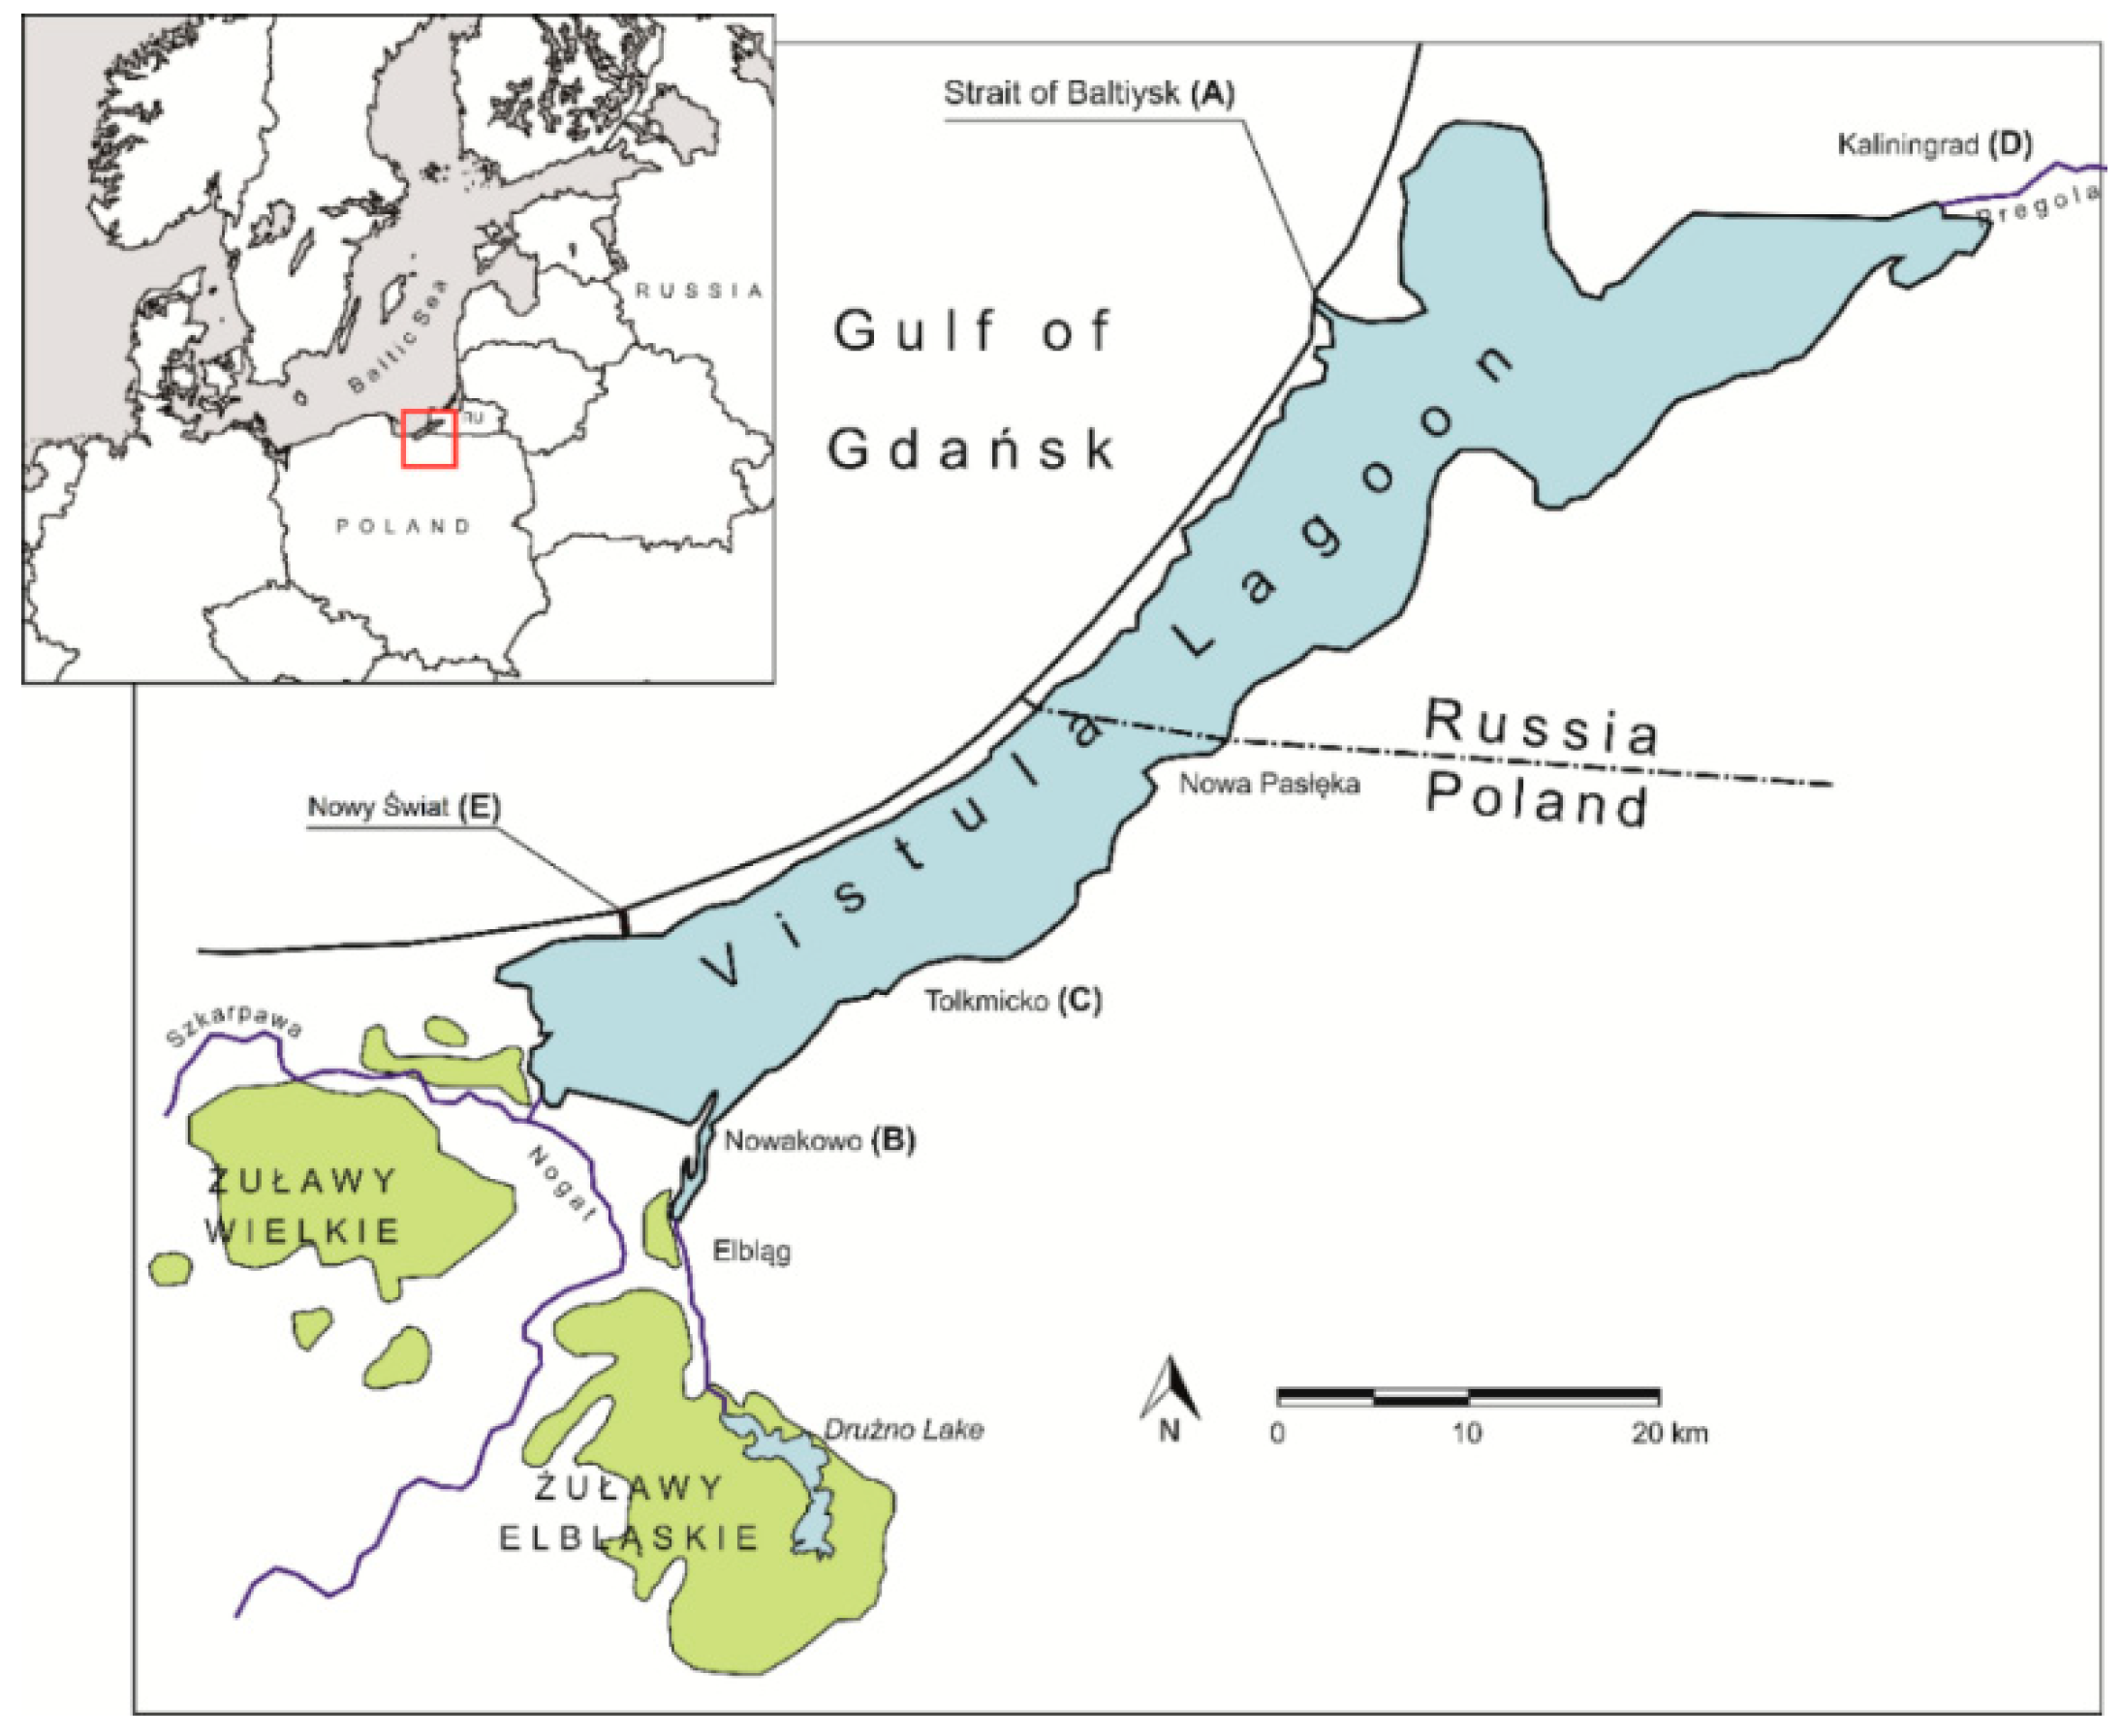
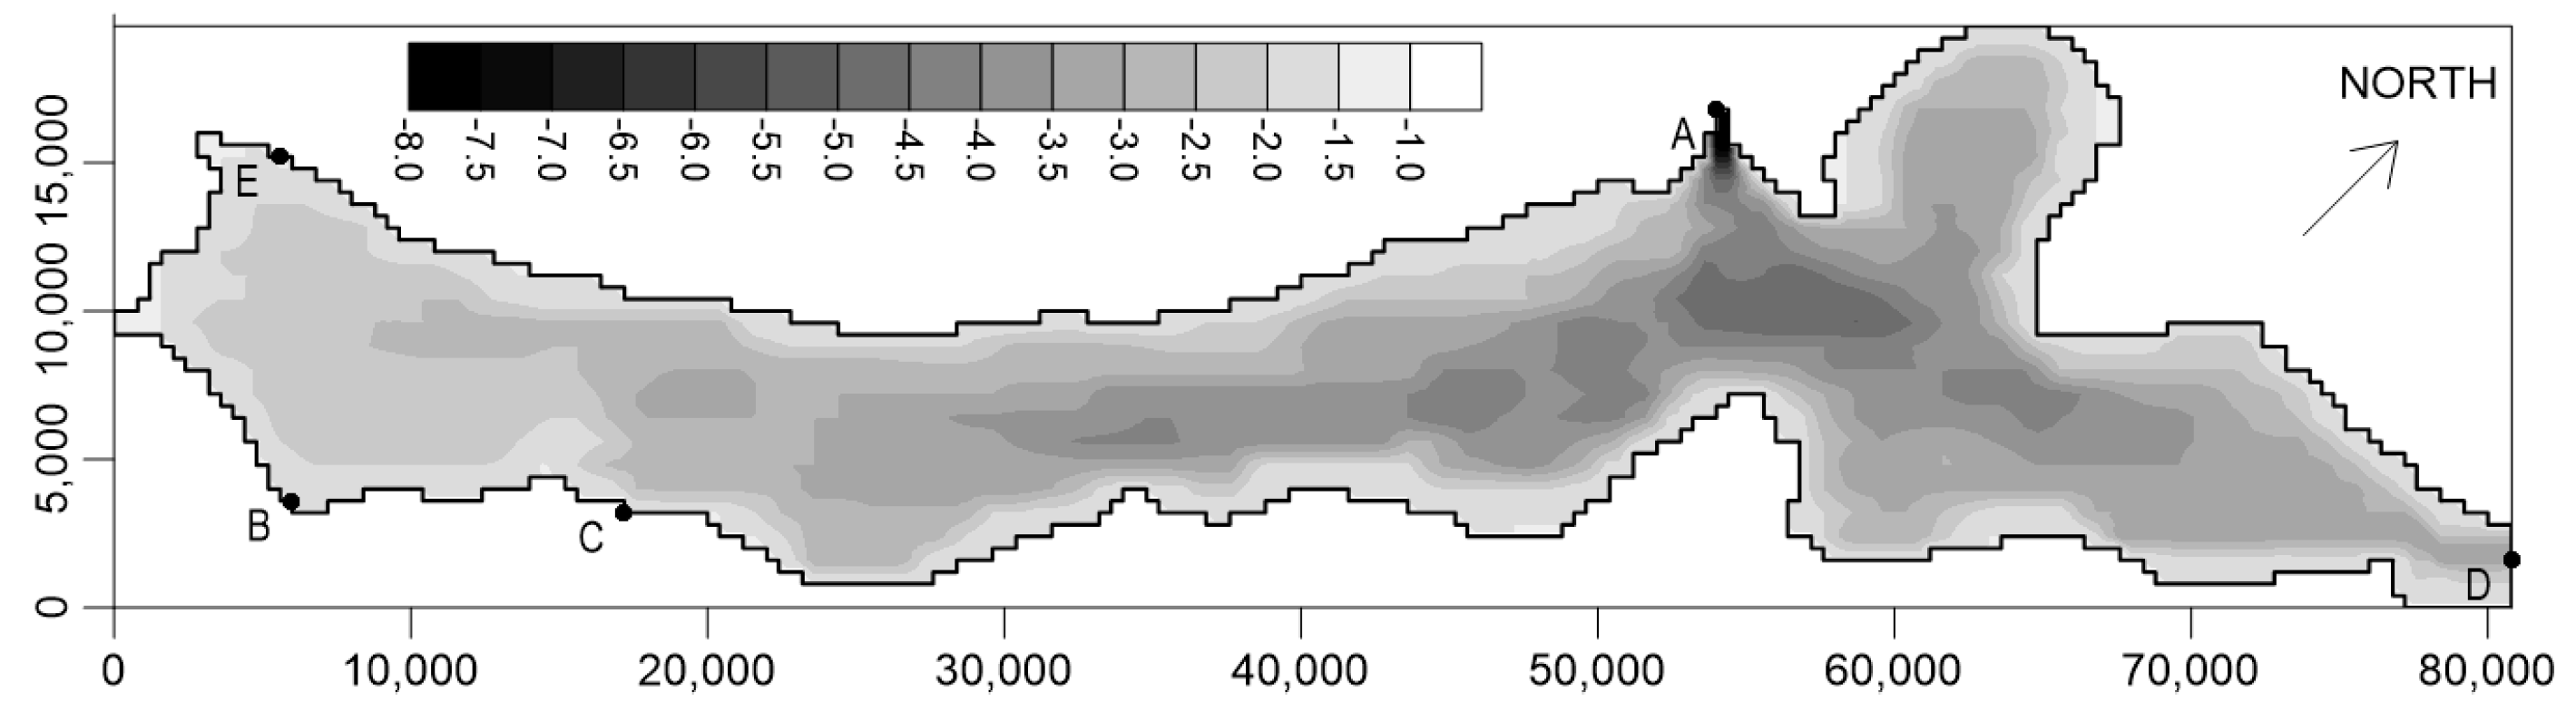
2.1. Study Area

The Vistula Lagoon [6,7,10,14] is a classic example of a coastal lagoon in the southern Baltic Sea (Figure 1). The length of the lagoon is 90.7 km and its width varies from almost 6 km to 13 km. The mean width is 8.9 km. The lagoon is a very shallow basin with a mean depth of only 2.75 m. It is separated from the Gulf of Gdańsk by the Vistula Spit of a length of about 65 km. The only connection between the Vistula Lagoon and the Baltic Sea is through the Strait of Baltiysk, which is 2 km long, 440 m wide and approximately 8.8 m deep. The total area of the lagoon measures 838 km2, of which 472.5 km2 belongs to Russia, and the shoreline is 270 km long [5,6,7,10].
Historically, the Vistula Lagoon was formed as part of the estuary of the Vistula River [10]. The regulation and changing of the course of the Vistula River at the beginning of the 20th century, due to frequent flooding, considerably modified the hydrological regime of the lagoon. Consequently, the annual inflow of the Vistula waters into the lagoon decreased from about 8–9 km3 to 0.7 km3. Since that time, the hydrological and sedimentation regimes of the lagoon have changed. The lagoon has evolved from a freshwater plain estuary to an estuarine lagoon significantly influenced by the Baltic Sea [10].
The largest rivers flowing into the Vistula Lagoon are the Pregoła (providing 62% of the freshwater) and other small rivers in the Russian part, and the Pasłęka, the Elbląg, the Nogat and the Szkarpawa on the Polish side. The inflow of fresh water from the Vistula to the lagoon, as a result of the functioning of locks on the Nogat and the Szkarpawa, is very limited. The average total annual river water inflow to the lagoon is about 180 m3s−1 [6,7]. Some correction of this component of the lagoon water budget was made in [11].
Nowadays [6,11], the hydrology of the Vistula Lagoon is controlled by marine water inflow (18.13 km3 per year) and freshwater gain, which consists of catchment runoff (4.97 km3 per year), precipitation (0.55 km3 per year), and evaporation (a loss of 0.53 km3 per year). The total outflow from the Vistula Lagoon to the sea is estimated to be equal to 23.69 km3 per year. The water balance is complemented by the groundwater flow.
The hydrodynamics of the Vistula Lagoon are usually influenced by changes in the sea level in the Gulf of Gdańsk and by wind action on the water surface of the lagoon [6,7]. Inflow to the lagoon takes place when the water level on the open sea side of the strait is higher than on the lagoon side, and vice versa for the outflow. The occurring difference in the water levels (the water head) between the sea and the lagoon causes a strong water current in the strait. Except for the water transport through the Strait of Baltiysk, the hydrodynamic conditions of the lagoon depend on wind action. In the region of the Vistula Lagoon, SW winds with a velocity from 4 to 6 ms−1 prevail [3,6,7]. These winds cause a rise in the water level in the Gulf of Gdańsk and in the Vistula Lagoon of even 0.8 m above the mean sea level. However, NE winds in particular cause a dangerous water level rise in the southern part of the Vistula Lagoon. For long periods of strong NE winds, a rise in the water level can be observed exceeding +1.0 m and in extreme conditions reaching +1.5 m above the mean sea level [4].

2.2. Hydro-Meteorological and Bathymetric Data

In order to analyze the mechanism of water damming on the Polish side of the Vistula Lagoon and model the hydrodynamics of the Vistula Lagoon, as well as to finally estimate the total water transport [15] between the lagoon and the Baltic Sea, hydro-meteorological data are necessary. It was assumed that the analysis and numerical simulation of the water movement in the Vistula Lagoon and the water discharges in the Strait of Baltiysk would be analyzed in one long period from 2008 to 2017.
The raw hydro-meteorological data contain the water level measurement time series at Tolkmicko and Hel stations in which the measurement frequency was equal to 10 min. Time intervals between 13% of the measurements at Tolkmicko exceed the 10 min interval due to missing observations. Such a situation does not occur in the measurements taken at Hel. The granularity of the wind speed and direction measurements is 1 h. There are no missing observations in the wind measurements data set. The statistical analysis of the data was performed for the data set integrating the raw water elevation and wind data.
As the input data for the water flow simulation, the daily (24-h) averages of the water level measurements in the Gulf of Gdańsk at Hel station were used along with the observed (one per hour) wind direction and speed over the lagoon at Nowa Pasłęka station (Figure 1). The investigation of the variability of the water levels (water stage elevations, WSE (m a.s.l.)) in the lagoon and the hydrodynamic model verification were carried out using the daily averaged water level measurements at Tolkmicko station. All these measurements are public and are published online by the Polish Institute of Meteorology and Water Management [16]. The example data for the year 2008 are presented in the Results and Discussion section. The full set of measurements is available in [17].
Archival bathymetry data [4,7] were also used to build the digital model of the lagoon bottom (Figure 2).

2.3. Statistical Method

The analysis was carried out using the exploratory data analysis approach. The mutual dependence of the considered events was tested using the χ2-independence test [18]. The equality of the empirical probability density functions of water levels was tested with the Kolmogorov–Smirnov test [19]. The time series comparison was performed using a correlation analysis [20]. The statistical analysis was performed using the Anaconda distribution of Python 3.8 [21,22].

2.4. Mathematical Model

Many types of mathematical models of the Vistula Lagoon have been developed over the years, including two-dimensional (2D) hydrodynamic models [4,13,14,23,24,25,26], two-dimensional models composed of hydrodynamics, water quality, and eutrophication modules [27,28], and the more recently developed three-dimensional (3D) models used for sediment transport and migration [9,12,29,30].
The problem of how complex a model is needed to mathematically describe the hydrodynamics of the Vistula Lagoon and calculate the water transport through the Strait of Baltiysk depends on flow characteristics and the aim of the numerical simulation. Simplified 2D barotropic models can be applied in cases of horizontal water flow with small depth and limited vertical velocity. It seems that in general this shallow lagoon meets these conditions [7], except for the Strait of Baltiysk area, where two-layer and two-stream currents occur [30]. Łazarenko and Majewski [6] reported that 74.9% of inflow or outflow are uniform currents, 11.7% two-layer currents (inflow in the bottom layer and outflow at the surface), and 13.4% two-stream currents. In such a case, if a strong variation in the flow parameters is expected, fully 3D hydrodynamic models should be used. However, the present study uses a 2D barotropic model of the entire lagoon and two-layer (baroclinic) water transport events cannot be resolved. This simplification means that the calculation of the water transport through the strait is treated as an estimation.
Despite the significant number of applications of numerical models to the Vistula Lagoon, a multi-year water level variation analysis and a simulation of seawater transport from the Gulf of Gdańsk to the Vistula Lagoon have not been carried out so far. A one-year (1994) period was analyzed in [27].
In the present study, the 2D SWE model is used to simulate the hydrodynamics of the lagoon. The classic set of shallow water equations can be written as [31]:
U t + U U x + V U y + g h x + g n 2 H 4 / 3 U | W | ν o ( 2 U x 2 + 2 U y 2 ) T x H = 0
V t + U V x + V V y + g h y + g n 2 H 4 / 3 V | W | ν o ( 2 V x 2 + 2 V y 2 ) T y H = 0
h t + ( U H ) x + ( V H ) y = 0
where: x,y—spatial coordinates; t—time; U,V—depth-averaged components of velocity in x- and y-direction, respectively; |W| = (U2 + V2)1/2—modulus of the velocity vector; h—water elevation above some plane of reference; H—water depth; g—acceleration due to gravity; n—Manning friction coefficient; ν0—coefficient of horizontal turbulent viscosity; Tx—wind stresses in x-direction; Ty—wind stresses in y-direction.
The splitting technique was used to decompose the 2D mathematical model described by Equations (1)–(3) [4] and then 1D equations were integrated using the finite element method proposed in [32]. The model was verified and validated by its application to simulate the Vistula Lagoon hydrodynamics during short-time surges driven by the wind [4]. Herein, the model was applied to simulate a 10-year-long unsteady flow in the Vistula Lagoon and could be validated by a comparison of the calculated water levels to the measured ones at Tolkmicko station.
In order to simulate the lagoon hydrodynamics, a structured square numerical mesh of grid dimensions Δx = Δy = 400 m was applied. The contour of the calculation area is shown in Figure 2. The initial condition was determined by the hydrostatic state with the horizontal water table corresponding to the initial water level in the Gulf of Gdańsk and the Strait of Baltiysk. The boundary conditions were chosen in relation to the type of boundary. At the open boundary, where the connection of the Vistula Lagoon with the Gulf of Gdańsk exists through the Strait of Baltiysk (composed of 3 computational cells, see Figure 1 and Figure 2, point A), the water surface elevation was forced at the boundary grid cell. Such a condition represents the variation of the sea level forming the water flow through the strait. The water discharge in a normal direction to the cross-section of the strait was always calculated based on the actual value of normal velocity and the water depth. The other lagoon boundaries are located along the shore line and they were treated as closed boundaries with free-slip conditions. The inflow of the rivers entering the lagoon was neglected due to the lack of continuous flow rate measurements, as well as the groundwater flow, precipitation, and evaporation. The roughness of the lagoon bottom was assumed uniform with the Manning coefficient n = 0.024 m–1/3 s [7].
The simulation was carried out for real (observed) data for the time period from 2008 to 2017 with a 5-min time step. The example water level variation measured in the Gulf of Gdańsk (Hel station) and the wind observed at the Nowa Pasłęka meteorological station in 2008 (January) are shown in Figure 3. A uniform wind field over the whole surface of the Vistula Lagoon was assumed. The numerical modeling of the hydrodynamics provided information about the water surface variation in the Vistula Lagoon, and the unsteady flow (discharge) through the Strait of Baltiysk. The former was used to validate the simulations and the latter allowed the water transport from the sea to the Vistula Lagoon to be calculated.

3. Results and Discussion

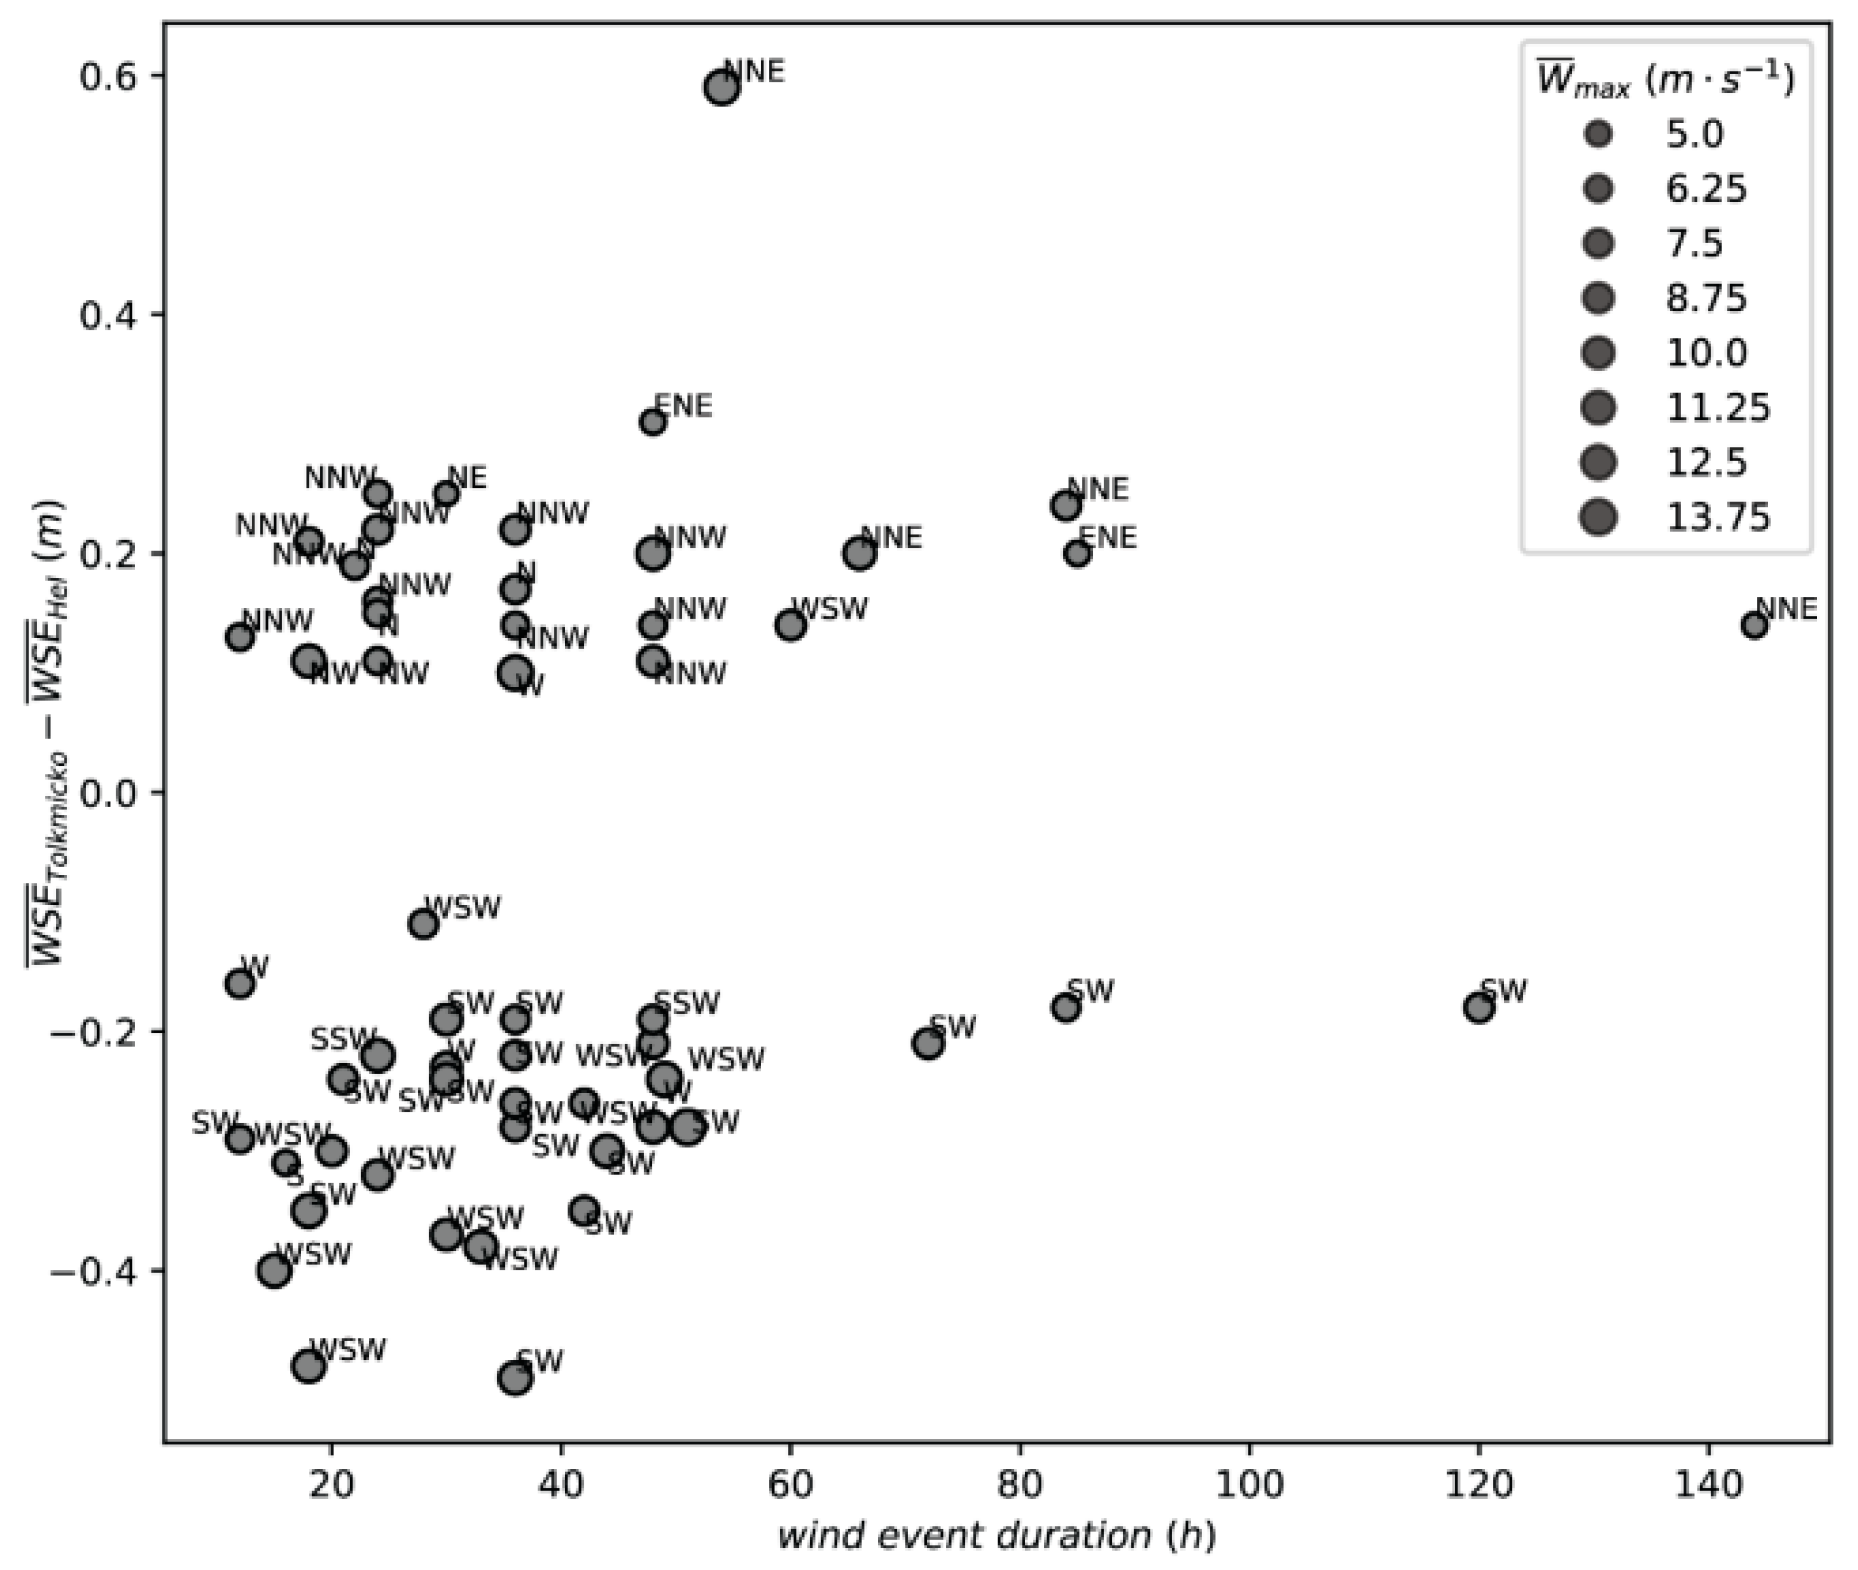
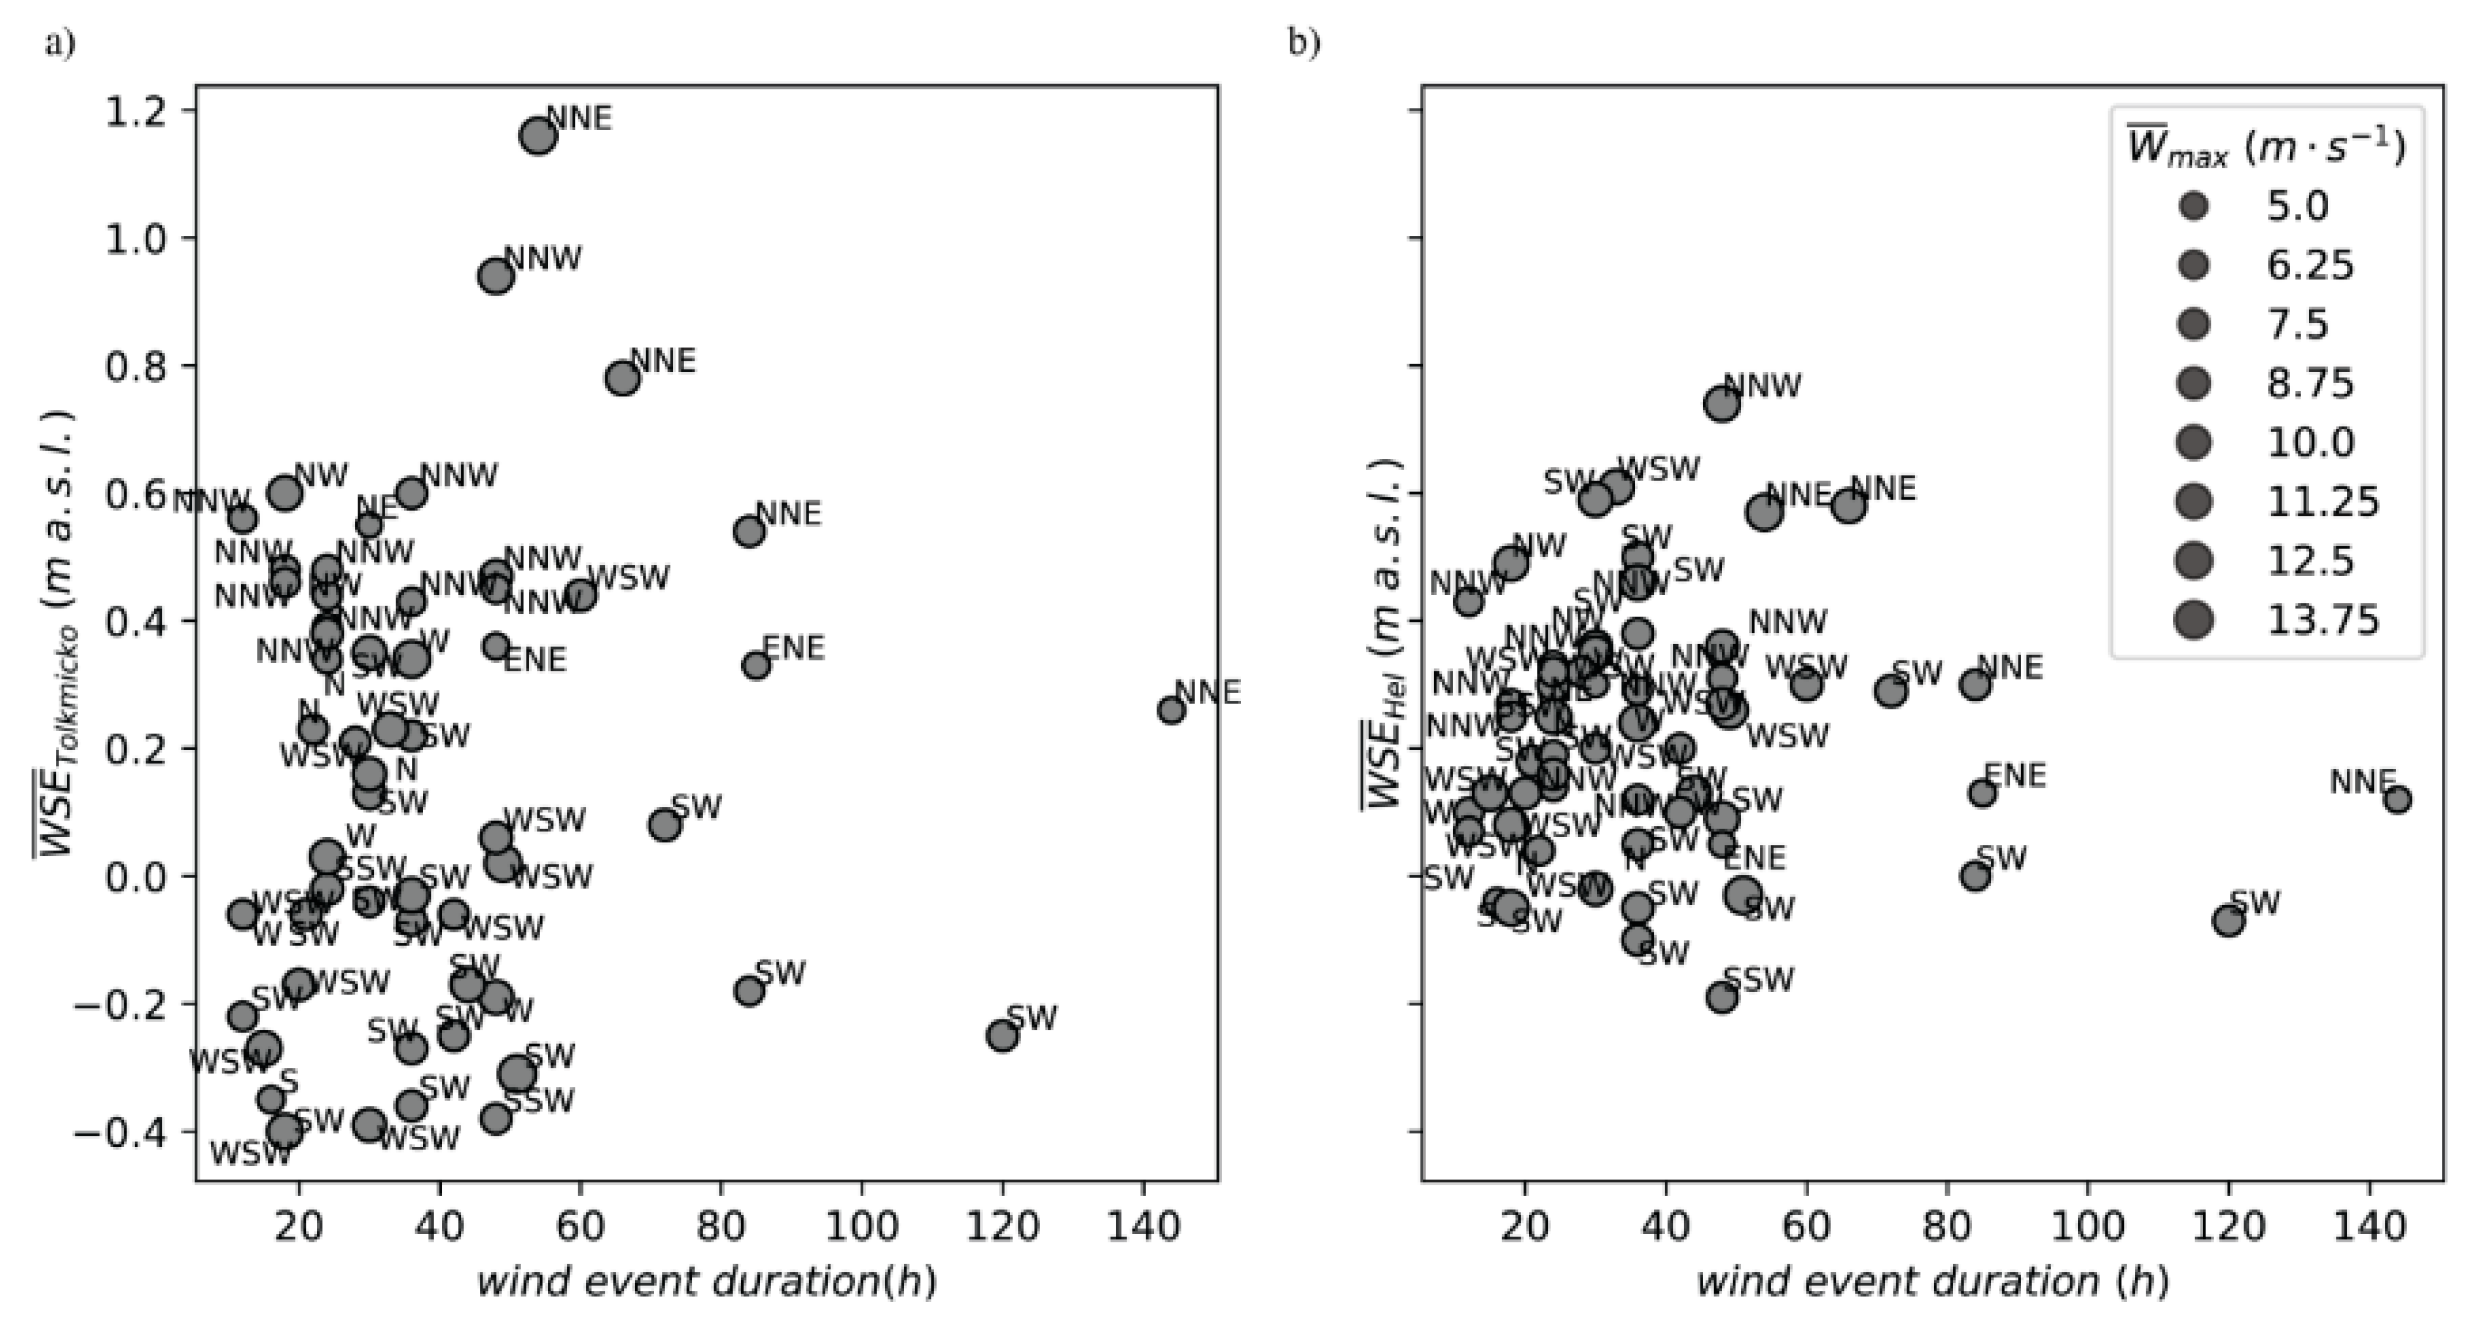
3.1. Variability of the Vistula Lagoon Water Levels (WSE) at Tolkmicko

In order to investigate the mechanism underlying the WSE variation in the Polish part of the Vistula Lagoon, the measurements of the water level at Tolkmicko station and at Hel station, located in the lagoon and in the Gulf of Gdańsk, respectively, were considered. Moreover, to assess the impact of the wind on the lagoon surges, the wind parameters (wind speed and direction) measured at the Nowa Pasłęka station were analyzed. The example of the collected time series data for January of 2008 is displayed in Figure 3.
The empirical probability density functions (PDFs) of the observed water levels at Tolkmicko and Hel are presented in the forms of a box plot and histogram in Figure 4. The summarized observations are given in Table 1. From the table it can be stated that on average the water level at Tolkmicko is lower than at Hel; however, the dispersion of the water levels at Tolkmicko is greater than at Hel. The minimal observed values and quartiles are of similar values; however, the maxima differ: the maximum observed water level at Tolkmicko station is significantly greater than at Hel.
The PDFs of the observed water levels at Tolkmicko and Hel are of a similar type: unimodal bell shaped, slightly positively skewed with the same medians and slightly different means. The general populations of water levels at Hel and Tolkmicko differ significantly (Kolmogorov–Smirnov test p-value = 0.00495). Although both distributions can be considered as normal-type, they are not normal in terms of the goodness of fit test outcomes when compared with the estimated normal distributions (using the maximum likelihood method).
The main factor influencing the water level variations in the southern part of the Vistula Lagoon (illustrated by Tolkmicko) is the water level variation in the coastal waters of the South-Eastern Baltic or the Gulf of Gdańsk (illustrated by Hel) (Figure 3). The statistical dependence between those variables was confirmed by the χ2-independence test (p-value ≈ 0). The lag time between events at Hel and Tolkmicko was determined by correlation coefficient maximization and is equal to 6 h 50 min with the Pearson correlation coefficient R = 0.91.
However, some significant discrepancies between the water levels at the considered stations can be noticed. One such discrepancy can be observed, for example in Figure 3, between 25 and 29 January. The reason for such occurrences is the moderate or strong wind originating (on average) from one direction for about one or more days. A long-lasting wind originating from a westerly direction (W, WNW, WSW) causes the water levels at Tolkmicko to decrease. Such a situation is depicted in Figure 5. If the wind originates from a northerly direction (N, NNE, NE), the water level at Tolkmicko is raised with respect to the water levels at Hel (Figure 6).
To confirm the abovementioned pattern in wind duration and direction influencing the increase and decrease of water levels at Tolkmicko, an analysis of such wind events was undertaken. All noticeable events in which the central tendency of the water level in the southern part of the Vistula Lagoon (illustrated by Tolkmicko) differed significantly from the central tendency in the South-Eastern Baltic (illustrated at Hel) were chosen and analyzed. The analysis was performed with respect to the speed and the duration of the wind originating on average from one dominating direction. For each such event the difference between the mean water levels at Tolkmicko and Hel, the maximum wind speed and the dominating origin of the wind were noticed. The scatter plot displayed in Figure 7 presents the mean difference between the water levels at Tolkmicko and Hel versus the wind event duration. Additionally, the plot displays the maximum observed wind speed using point sizes and the dominating wind direction with labels.
It can be easily noticed that if the wind originates from one direction for 20 or more hours, a significant difference in water levels between Tolkmicko and Hel appears. If the dominating wind direction is a westerly one (W, WNW, WSW), the water level at Tolkmicko decreases. If the wind originates from a northerly direction (N, NNE, NE), the water level at Tolkmicko increases with respect to the water level at Hel. Moreover, it can be noticed that a long-lasting wind originating from one dominating direction influences only the lagoon water level variation at Tolkmicko (Figure 8a) but a similar pattern cannot be clearly recognized in the Gulf of Gdańsk at Hel station (Figure 8b).
The conditions caused by winds originating from a single direction for a long time are the main factors for the occurrence of events at Tolkmicko that can be considered extreme.
The wind measurements performed in Nowa Pasłęka are presented in the form of a histogram (Figure 9a) and a wind rose (Figure 9b). The maximum likelihood estimation of the parameters of the Weibull distribution,
f ( x ) = k λ ( x λ ) k 1 e ( x / λ ) k ,
was performed for the wind speed observations, resulting in k = 1.722 and λ = 5.802 . The probability density function of the Weibull distribution is presented in Figure 9a with a line. Based on the plot, it can be stated that the wind speed at Nowa Pasłęka is distributed according to the Weibull distribution; however, the null hypothesis of the Kolmogorov–Smirnov goodness of fit test was rejected (p-value = 1.42 × 10⁻⁶). Based on the plot of the wind rose, it can be stated that the most frequent directions from which the wind originates are SE, then SW and SSW. The most frequent wind speed intervals are 0–7.1 m s−1 and 7.1–14.1 m s−1. It can be noticed that stronger winds (14.1–21.2 m s−1) more frequently originate from westerly directions (SW, SSW, and W) than from other directions. The wind pattern resembles the wind pattern observed in Baltiysk by Chubarenko et al. [3].

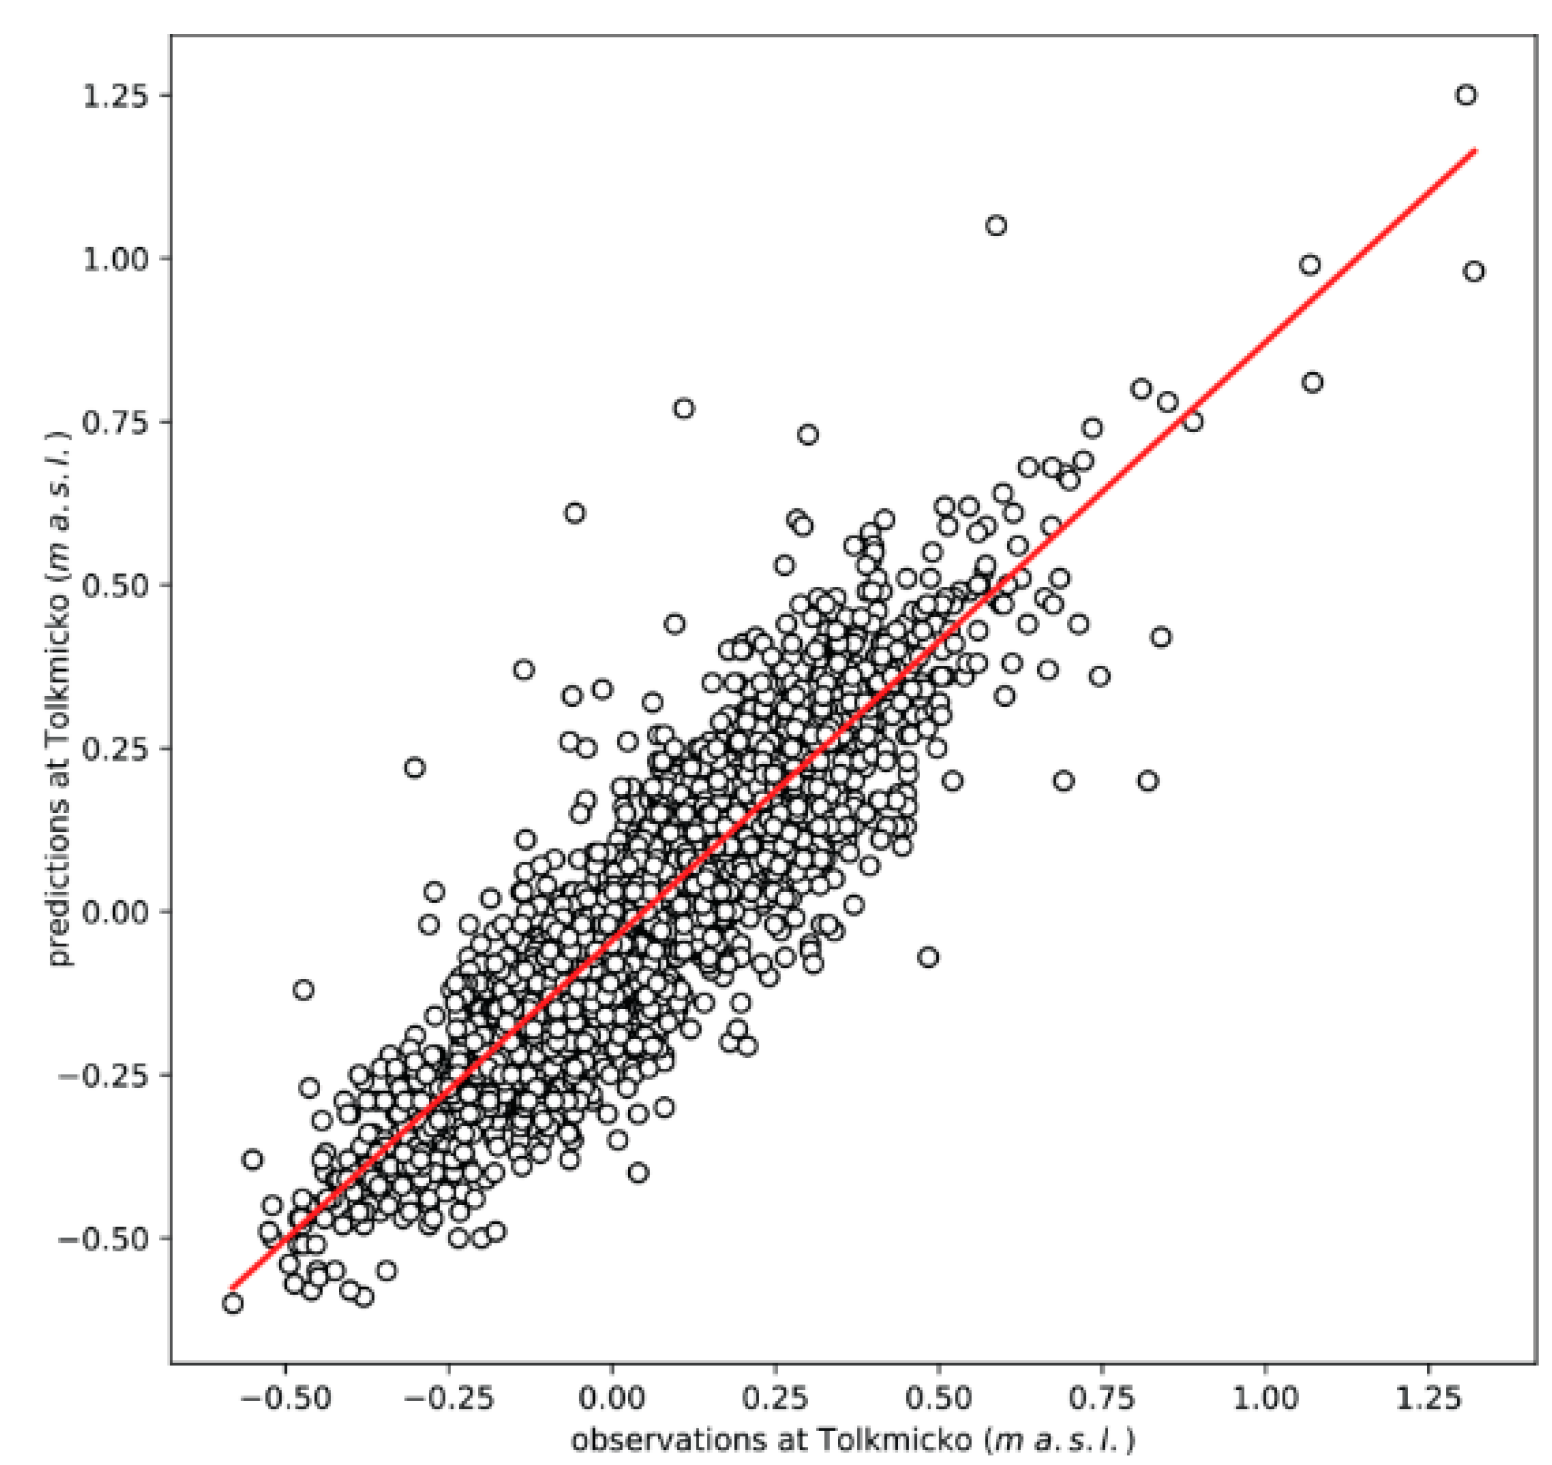
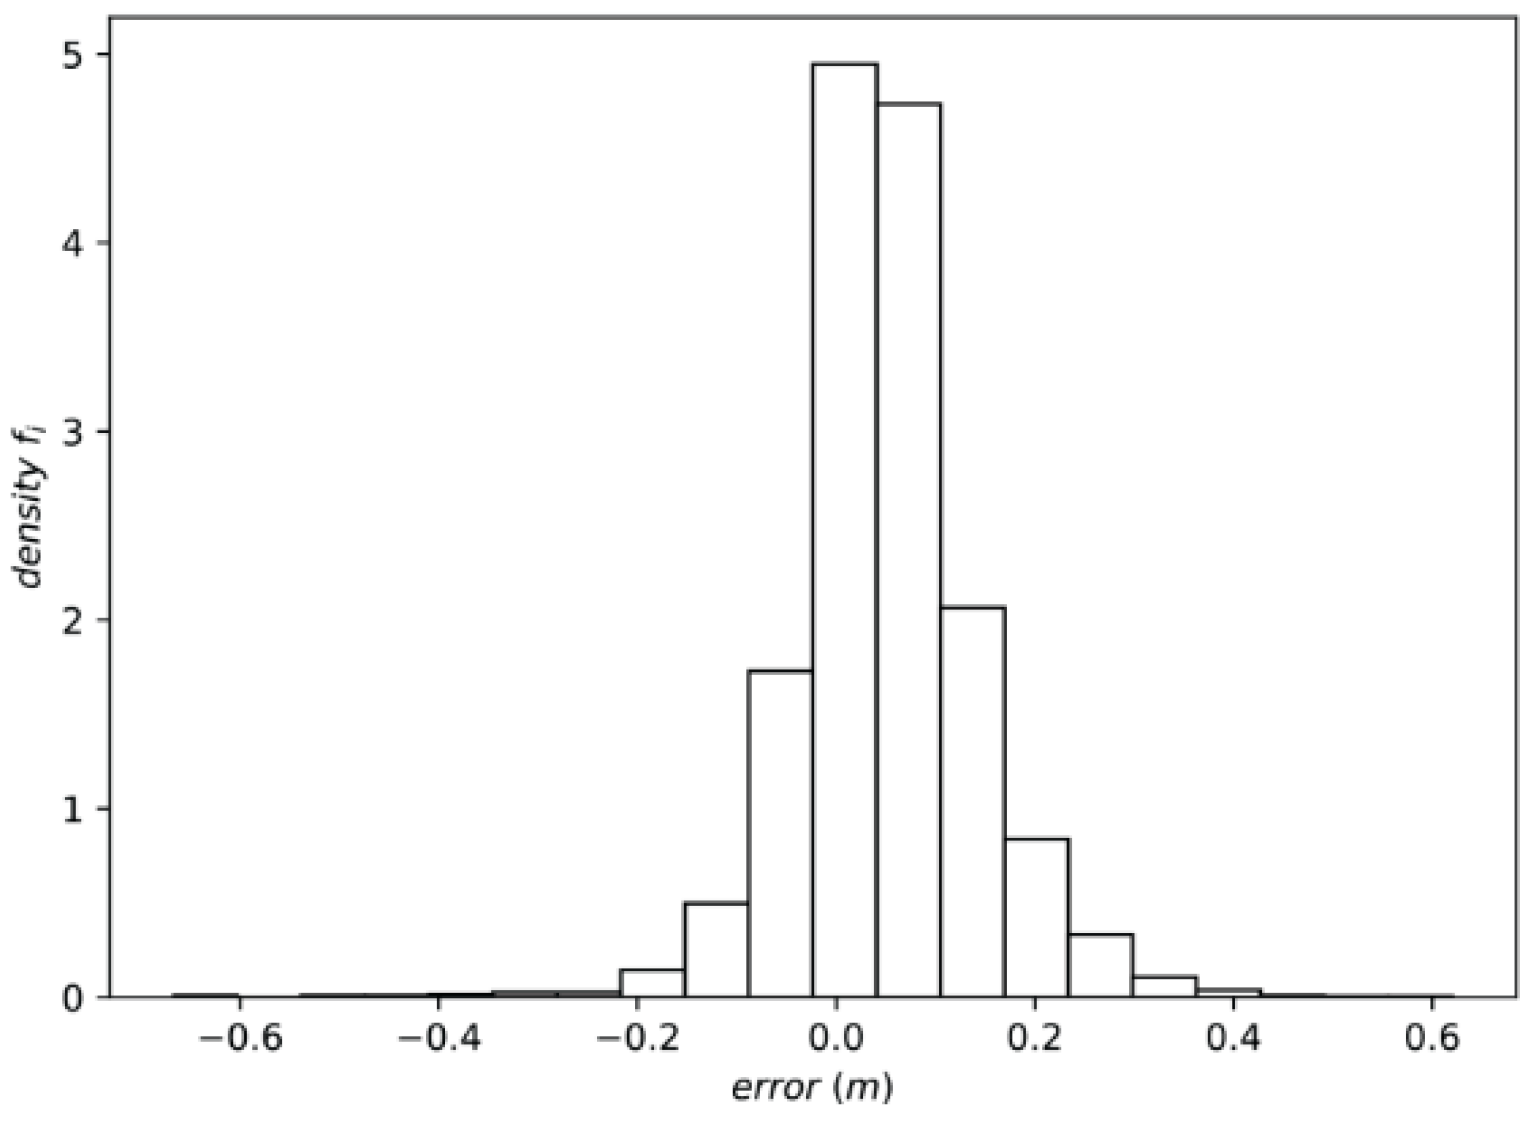
3.2. Validation of the Hydrodynamic Model for the 10-Year-Long Simulation Period

The validation of the model was preceded by using hydrodynamic and meteorological conditions as observed. In order to verify the results, a control point on the Polish shore of the Vistula Lagoon, located near Tolkmicko (see Figure 1 and Figure 2, point C) was chosen. The example (for 2008) observations and results of the numerical simulations of the water surface variation at this point are presented in Figure 10. It can be seen that the computation outcomes can be considered satisfactory. The full set of measurements and calculation results used for the model validation is available in [17].
However, to assess in detail the compliance of the calculations with the measurements, more detailed description is necessary. There are two state-of-the-art approaches for the estimation of the model accuracy: a correlation analysis of the predictions versus observations and the analysis of an error [33,34]. The most widely used estimator for the overall error of the model is the mean square error (MSE). However, in the case of physical sciences, the square root of MSE can be used, which provides better interpretability. Therefore, it was used in this work as a synthetic measure of the model accuracy. In the considered case of the Vistula Lagoon simulation, the estimated linear regression model is y = 0.916x – 0.0443 (Figure 11, red line). The regression line suggests that on average the water level values are slightly underestimated. The Pearson correlation coefficient is equal to R = 0.892 and is significant (p-value ≈ 0); the determination coefficient R2 = 0.796.
The root mean square error of the observations and predictions is given with the following expression:
R M S E = 1 n i = 1 n ( x i c i ) 2
where xi are the observed water levels and ci are the outcomes of the computation (i = 1,...,n) with n denoting the number of values. The value of RMSE is equal to 0.104 m.
The absolute error can be defined as
ε i = x i c i
For such a defined error the maximum negative value (overestimation) is ε m a x = −0.667 m, whereas the maximum positive error value (underestimation) is ε m a x + = 0.620 m. The mean value of the error expresses the bias of the model and is equal to ε ¯ = 0.049 m, whereas the standard deviation of the error is equal to s = 0.0914. The histogram of the absolute error is displayed in Figure 12.
The results displayed in Figure 11 and Figure 12 show that the calculated elevations of the water table are usually slightly underestimated in relation to the measurements (Table 2). For the years 2008–2017, the average underestimation of the results of water levels in the reservoir is about 0.05 m, which is confirmed by the determined bias value. The reason for this is the fact that the external (catchment, river, ground) inflow to the lagoon is not included in the calculations. This assumption ignores the resistance of the lagoon to accept seawater when the water level in the lagoon is partly controlled by intensive river discharge (during spring and autumn maximums of river discharge). It would be necessary to examine seasonal variations of the difference between the model calculated and observed water levels in order to identify the influence of river discharge, but this is currently beyond the scope of this work.
Despite the recurring, slight understatement of the calculations relative to the observations, other statistical measures, such as the correlation coefficient, mean absolute error, or root mean square deviation, testify to the good quality of the simulation results. The comparison between the observed data and the results of the computations obtained for the control point near Tolkmicko confirms that the proposed mathematical model provides reliable simulation results of the hydrodynamics of the Vistula Lagoon.

3.3. Water Transport through the Strait of Baltiysk

The application of the verified and validated 2D hydrodynamic model of the Vistula Lagoon enabled calculations of the flow through the Strait of Baltiysk. Calculations of the time-varying water discharge were carried out on the basis of the unsteady flow velocity and the water depth in the strait (in one calculation cell near point A, Figure 2). The example results of the calculated day averaged flow rates for 2008 are presented in Figure 13. The positive and negative discharge values depend on the flow direction in the strait and represent the water outflow and inflow to the lagoon, respectively.
In order to estimate the annual seawater transport between the Gulf of Gdańsk and the Vistula Lagoon, the flow discharges were integrated in one-year time periods. Inflows and outflows through the strait were added separately, which made it possible to calculate the accumulative volume of water entering and leaving the lagoon from 1 January to 31 December each year. The water accumulation was calculated during a simulation with a 5-min time step. The calculated results are collected in Table 3.
Data regarding the water exchange between the Vistula Lagoon and the Baltic Sea are not readily available, which was described in detail in [11]. Early research has shown that the total volume of seawater inflow into the lagoon reaches 15–18 km3 per year [3,6,7]. The total outflow from the lagoon was estimated at about 24 km3 [5]. However, researchers working today on hydrological processes of the Vistula Lagoon use historical data only. The most recent source data cited by researchers may be found in [6] and [13]. No more up-to-date studies were identified that would provide scientific data for this research area.
The annual average values of seawater inflow and outflow, presented in [6], are 17 km3 and 20.5 km3, respectively. The numerical simulations presented in [13] demonstrated the dynamics of the water exchange in the Vistula Lagoon through the Strait of Baltiysk for a one-year period (1994). The calculation was done using the MIKE21 hydrodynamic model. The accumulative annual inflow of marine water into the Vistula Lagoon in 1994 amounted to about 18.1 km3; the annual outflow (including the river outflow) toward the Baltic Sea in the same year was about 22.5 km3.
In the discussion of the calculations and historical data, only the total seawater inflow volume can be compared. The calculated outflow from the lagoon to the Gulf of Gdańsk (average 15.89 km3 in the period 2008–2017, Table 3) is devoid of other hydrological balance components and cannot be compared with the source data (20.5 and 22.5 km3), where additional hydrological processes (e.g., river flow) were incorporated, forming the total outflow. The total inflow to the Vistula Lagoon, calculated for the period 2008–2017 (Table 3), is in the range of 14.31 km3 to 17.78 km3. The average accumulative marine inflow amounts to 15.87 km3.
The results obtained are in a similar range to those described in [7], and moreover, close to the annual average presented in [6] and slightly lower than those estimated for 1994 [13]. This makes it possible to assess the seawater supply to the Vistula Lagoon obtained for the period 2008–2017 as reliable. These data may constitute the necessary current information to perform a full hydrological balance of the lagoon.

4. Conclusions

The results of the statistical analysis confirmed that the main mechanism underlying the water level variation in the Vistula Lagoon is driven by the water level in the Gulf of Gdańsk. However, when it comes to events that can be considered as causing an extreme increase or decrease in the water level, the main factor is strong wind originating from one dominating direction over a long period of time. Thus, the two main factors determining the water stage variation on the Polish side of the Vistula Lagoon are the water level in the gulf and the wind. This result supports the previously formulated understanding of the Vistula Lagoon hydrodynamics [6,7,10] and, additionally, brings more detailed information about the wind parameters and duration needed to produce extremes.
The results of the two-dimensional mathematical modeling of the hydrodynamics of the Vistula Lagoon and the simulations of the seawater transport into and from the lagoon in the period 2008–2017 allow the following to be concluded:
  • The Vistula Lagoon 2D hydrodynamic model was verified and the simulation results were validated using water stage elevation measurements at Tolkmicko control point. Although the results obtained for the years 2008–2017 are slightly understated in relation to the observations, the calculations should be considered reliable, which was confirmed by statistical measures.
  • The application of the validated hydrodynamic model enabled calculations of the flow through the Strait of Baltiysk. The calculated discharges in the strait provided the data to estimate the total accumulative inflow and outflow of seawater entering and leaving the lagoon, respectively.
  • The average annual marine water inflow into the Vistula Lagoon between 2008 and 2017 was calculated to be equal to 15.87 km3. The minimum and maximum total inflows were estimated as 14.31 km3 and 17.78 km3, respectively. These values, although different, are consistent with the data given in historical sources and can be used to update the hydrological balance of the waters of the Vistula Lagoon.

Author Contributions

Conceptualization: M.S.; Data curation: P.Z.; Formal analysis: M.S., W.A.; Investigation: M.S., W.A.; Methodology: M.S., W.A.; Resources: P.Z.; Software: M.S.; Validation: M.S.; Visualization: W.A.; Writing—original draft: M.S., W.A.; Writing—review and editing: M.S. and P.Z. All authors have read and agreed to the published version of the manuscript.

Funding

This research received no external funding.

Institutional Review Board Statement

Not applicable.

Informed Consent Statement

Not applicable.

Data Availability Statement

The data presented in this study are openly available in repository Most Wiedzy at doi:10.34808/5wgr-5r25, reference number [17].

Conflicts of Interest

The authors declare no conflict of interest.

References

  1. Kjerfve, B. Coastal Lagoons. In Elsevier Oceanography Series; Kjerfve, B., Ed.; Coastal Lagoon Processes; Elsevier: Amsterdam, The Netherlands, 1994; Volume 60, pp. 1–8. [Google Scholar]
  2. Bird, E.C.F. Coastal Geomorphology: An Introduction; John Wiley & Sons: Hoboken, NJ, USA, 2011; ISBN 978-1-119-96435-3. [Google Scholar]
  3. Chubarenko, B.; Domnin, D.; Navrotskaya, S.; Stont, Z.; Chechko, V.; Bobykina, V.; Pilipchuk, V.; Karmanov, K.; Domnina, A.; Bukanova, T.; et al. Transboundary Lagoons of the Baltic Sea. In The Diversity of Russian Estuaries and Lagoons Exposed to Human Influence; Kosyan, R., Ed.; Estuaries of the World; Springer International Publishing: Cham, Switzerland, 2017; pp. 149–189. ISBN 978-3-319-43392-9. [Google Scholar]
  4. Szydłowski, M.; Kolerski, T.; Zima, P. Impact of the Artificial Strait in the Vistula Spit on the Hydrodynamics of the Vistula Lagoon (Baltic Sea). Water 2019, 11, 990. [Google Scholar] [CrossRef] [Green Version]
  5. Cieśliński, R.; Lewandowski, A. Hydrological regime of the Vistula Lagoon and the possible changes due to the construction of the waterway connecting the Vistula Bay with the Gulf of Gdansk. Inżynieria Morska Geotech. 2013, 1, 69–78. [Google Scholar]
  6. Łazarenko, N.N.; Majewski, A. Hydrometeorological System of the Vistula Lagoon; Communication Publishing House: Warsaw, Poland, 1975. [Google Scholar]
  7. Szymkiewicz, R. Hydrodynamics of Vistula Lagoon; Monography of P.A.S.: Warsaw, Poland, 1992. [Google Scholar]
  8. Chubarenko, B.V.; Zakirov, R.B. Water Exchange of Nontidal Estuarine Coastal Vistula Lagoon with the Baltic Sea. J. Waterw. Port Coast. Ocean Eng. 2021, 147. [Google Scholar] [CrossRef]
  9. Bielecka, M.; Kazmierski, J. A 3D Mathematical Model of Vistula Lagoon Hydrodynamics-General Assumptions and Results of Preliminary Calculations. Groundwater 2003, 80, 2–4. [Google Scholar]
  10. Chubarenko, B.; Margoński, P. The Vistula Lagoon. In Ecology of Baltic Coastal Waters; Schiewer, U., Ed.; Ecological Studies; Springer: Berlin/Heidelberg, Germany, 2008; pp. 167–195. ISBN 978-3-540-73524-3. [Google Scholar]
  11. Cieśliński, R.; Chlost, I. Water Balance Characteristics of the Vistula Lagoon Coastal Area along the Southern Baltic Sea. Baltica 2017, 30, 107–117. [Google Scholar] [CrossRef]
  12. Kruk, M.; Kempa, M.; Tjomsland, T.; Durand, D. The use of mathematical models to predict changes in the environment of the Vistula Lagoon. In Vistula Lagoon–Natural Environment and Modern Methods of His Research Project on the Example of Visla; Publishing PWSZ: Elbląg, Poland, 2011; pp. 165–180. [Google Scholar]
  13. Chubarenko, I.P.; Chubarenko, B.V. General Water Dynamics of the Vistula Lagoon. Environ. Chem. Phys. 2002, 24, 213–217. [Google Scholar]
  14. Chubarenko, B.; Chubarenko, I.; Baudler, H. Comparison of Darss-Zingst Bodden Chain and Vistula Lagoon (Baltic Sea) in a View of Hydrodynamic Numerical Modelling. Baltica 2005, 18, 56–67. [Google Scholar]
  15. Takeoka, H. Fundamental Concepts of Exchange and Transport Time Scales in a Coastal Sea. Cont. Shelf Res. 1984, 3, 311–326. [Google Scholar] [CrossRef]
  16. IMGW-PIB Meteorological and Hydrological Measurement Data. Available online: https://dane.imgw.pl/data/dane_pomiarowo_obserwacyjne/ (accessed on 17 April 2020).
  17. Szydłowski, M.; Artichowicz, W.; Zima, P. Dataset: Analysis of the Water Level Variation at the Polish Part of the Vistula Lagoon (2008–2017). Gdańsk Univ. Technol. 2021. Most Wiedzy. [Google Scholar] [CrossRef]
  18. Kenney, J.F.; Keeping, E.S. Mathematics of Statistics, 2nd ed.; Princeton Van Nostrand: New York, NY, USA, 1951; Volume 2. [Google Scholar]
  19. Boes, D.C.; Graybill, F.A.; Mood, A.M. Introduction to the Theory of Statistics, 3rd ed.; McGraw-Hill: New York, NY, USA, 1974. [Google Scholar]
  20. Shumway, R.H.; Stoffer, D.S. Time Series Analysis and Its Applications: With R Examples, 4th ed.; Springer Texts in Statistics; Springer International Publishing: Berlin/Heidelberg, Germany, 2017; ISBN 978-3-319-52451-1. [Google Scholar]
  21. Anaconda Software Distribution. Computer Software. Available online: https://anaconda.com (accessed on 25 September 2020).
  22. Python Software Foundation. The Python Language Reference, Version 3.8. Available online: https://docs.python.org/3.8/reference/ (accessed on 25 September 2020).
  23. Szymkiewicz, R. A Mathematical Model of Storm Surge in the Vistula Lagoon, Poland. Coast. Eng. 1992, 16, 181–203. [Google Scholar] [CrossRef]
  24. Catewicz, Z.; Jankowski, A. Model H-N of stationary flows in Vistula Lagoon. Podstawy Gospod. Sr. Mor. III Studia Mater. Oceanol. 1983, 40, 223–249. [Google Scholar]
  25. Kolerski, T.; Zima, P.; Szydłowski, M. Mathematical Modeling of Ice Thrusting on the Shore of the Vistula Lagoon (Baltic Sea) and the Proposed Artificial Island. Water 2019, 11, 2297. [Google Scholar] [CrossRef] [Green Version]
  26. Szymkiewicz, R. Analysis of a concept of changing the hydrodynamic conditions of the Vistula Lagoon. Inżynieria Morska 1984, 6, 258–260. [Google Scholar]
  27. Chubarenko, I.; Tchepikova, I. Modelling of Man-Made Contribution to Salinity Increase into the Vistula Lagoon (Baltic Sea). Ecol. Model. 2001, 138, 87–100. [Google Scholar] [CrossRef]
  28. Kwiatkowski, J.; Rasmussen, E.K.; Ezhova, E.; Chubarenko, B. The eutrophication model of the Vistula Lagoon. Oceanol. Stud. 1997, 26, 5–33. [Google Scholar]
  29. Chubarenko, B.; Chechko, V.; Kileso, A.; Krek, E.; Topchaya, V. Hydrological and Sedimentation Conditions in a Non-Tidal Lagoon during Ice Coverage—The Example of Vistula Lagoon in the Baltic Sea. Estuar. Coast. Shelf Sci. 2019, 216, 38–53. [Google Scholar] [CrossRef]
  30. Chubarenko, B.V.; Leitsina, L.V.; Esiukova, E.E.; Kurennoy, D.N. Model Analysis of the Currents and Wind Waves in the Vistula Lagoon of the Baltic Sea. Oceanology 2012, 52, 748–753. [Google Scholar] [CrossRef]
  31. Stelling, G.S. On the Construction of Computational Methods for Shallow Water Flow Problems; Rijkwaterstaat Comunications: The Hague, The Netherlands, 1983. [Google Scholar]
  32. Szymkiewicz, R. Oscillation-Free Solution of Shallow Water Equations for Nonstaggered Grid. J. Hydraul. Eng. 1993, 119, 1118–1137. [Google Scholar] [CrossRef]
  33. Piñeiro, G.; Perelman, S.; Guerschman, J.P.; Paruelo, J.M. How to Evaluate Models: Observed vs. Predicted or Predicted vs. Observed? Ecol. Model. 2008, 216, 316–322. [Google Scholar] [CrossRef]
  34. James, G.; Witten, D.; Hastie, T.; Tibshirani, R. An Introduction to Statistical Learning: With Applications in R; Springer Texts in Statistics; Springer: New York, NY, USA, 2013; ISBN 978-1-4614-7137-0. [Google Scholar]
Figure 1. Location of the Vistula Lagoon [4].
Water 13 01328 g001
Figure 2. Simplified shape and bathymetry (m a.s.l.) of the Vistula Lagoon (in meters) [4]: A—Strait of Baltiysk, B—Nowakowo, C—Tolkmicko, D—Kaliningrad, E—Nowy Świat.
Water 13 01328 g002
Figure 3. Water level (WSE) variation at Hel and Tolkmicko stations and wind speed and direction observed at Nowa Pasłęka in January of 2008 (raw data; measurement frequency of WSE is 10 (min), wind data 1 (h)).
Water 13 01328 g003
Figure 4. WSE (raw data) comparison at Tolkmicko (blue) and Hel (red) stations. Histograms and box plots.
Water 13 01328 g004
Figure 5. Water level (WSE) variation at Tolkmicko and Hel, wind speed and direction—the case (1–8 August 2008) in which wind originates from a westerly direction for a long period of time causes the water level at Tolkmicko to decrease in comparison to the water level at Hel (raw data; measurement frequency of WSE is 10 (min), wind data 1 (h)).
Water 13 01328 g005
Figure 6. Water level (WSE) variation at Tolkmicko and Hel, wind speed and direction—the case (9–16 October 2009) in which wind originates from a northerly direction for a long period of time causes the water level at Tolkmicko to increase in comparison to the water level at Hel (raw data; measurement frequency of WSE is 10 (min), wind data 1 (h)).
Water 13 01328 g006
Figure 7. Difference between the average water levels (WSE) at Tolkmicko and Hel versus the wind event duration time. The label denotes the dominating wind direction, the size denotes the observed maximum wind speed.
Water 13 01328 g007
Figure 8. Averaged water levels (WSE) at (a) Tolkmicko, (b) Hel versus wind event duration time. Label denotes the dominating wind direction, size denotes the observed maximum wind speed.
Water 13 01328 g008
Figure 9. (a) Wind speed (m s−1) histogram and estimated Weibull distribution probability density function and (b) wind rose at Nowa Pasłęka meteorological station (2008–2017).
Water 13 01328 g009
Figure 10. Observed (black) and calculated (blue) water level (WSE) variation at Tolkmicko in 2008.
Water 13 01328 g010
Figure 11. Observed and predicted water level at Tolkmicko station.
Water 13 01328 g011
Figure 12. Histogram of the simulation absolute error.
Water 13 01328 g012
Figure 13. Calculated water flow discharge through the Strait of Baltiysk in 2008.
Water 13 01328 g013
Table 1. Basic statistical characteristics of the WSE (m a.s.l.) at Tolkmicko and Hel stations (raw data).
ParameterTolkmickoHel
mean0.0880.095
std. dev.0.2020.193
minimum−0.760−0.800
q0.25−0.040−0.030
median0.0900.090
q0.750.2100.210
maximum1.4601.150
Table 2. The basic statistical characteristics of the observed daily averaged WSE (m a.s.l.) at Tolkmicko and the simulation outcome.
ParameterObservationsComputationsError
mean0.0590.0100.049
std. dev.0.1980.2030.092
minimum−0.580−0.600−0.667
q0.25−0.060−0.1200.000
median0.0600.0100.045
q0.750.1790.1300.096
maximum1.3191.2500.620
Table 3. Calculated water transport through the Strait of Baltiysk.
Value/Year2008200920102011201220132014201520162017Average
Annual accumulative inflow (km3)17.7815.4015.7616.2316.3515.4214.3116.5015.1815.7315.87
Annual accumulative outflow (km3)17.6015.6615.6815.9515.9715.5714.4316.7515.3815.9415.89
Publisher’s Note: MDPI stays neutral with regard to jurisdictional claims in published maps and institutional affiliations.

