
Bulk Drag Predictions of Riparian Arundo donax Stands through UAV-Acquired Multispectral Images
by
 , , and
Giuseppe Francesco Cesare Lama
1,2,* ,
,
Mariano Crimaldi
1 ,
,
Vittorio Pasquino
2,
Roberta Padulano
3 and
Giovanni Battista Chirico
1
1
Department of Agricultural Sciences, Water Resources Management and Biosystems Engineering Division, University of Naples Federico II, 80055 Portici, NA, Italy
2
Department of Civil, Architectural and Environmental Engineering (DICEA), University of Naples Federico II, 80125 Napoli, NA, Italy
3
Impacts on Agriculture, Forests and Ecosystem Services (IAFES) Division, Fondazione Centro Euro-Mediterraneo sui Cambiamenti Climatici, 01100 Viterbo, VT, Italy
*
Author to whom correspondence should be addressed.
Water 2021, 13(10), 1333; https://doi.org/10.3390/w13101333
Submission received: 26 February 2021
/
Revised: 28 April 2021
/
Accepted: 29 April 2021
/
Published: 11 May 2021
(This article belongs to the Special Issue Ecohydraulics Modeling and Simulation)
Abstract
:Estimating the main hydrodynamic features of real vegetated water bodies is crucial to assure a balance between their hydraulic conveyance and environmental quality. Riparian vegetation stands have a high impact on vegetated channels. The present work has the aim to integrate riparian vegetation’s reflectance indices and hydrodynamics of real vegetated water flows to assess the impact of riparian vegetation morphometry on bulk drag coefficients distribution along an abandoned vegetated drainage channel fully covered by 9–10 m high Arundo donax (commonly known as giant reed) stands, starting from flow average velocities measurements at 30 cross-sections identified along the channel. A map of riparian vegetation cover was obtained through digital processing of Unnamed Aerial Vehicle (UAV)-acquired multispectral images, which represent a fast way to observe riparian plants’ traits in hardly accessible areas such as vegetated water bodies in natural conditions. In this study, the portion of riparian plants effectively interacting with flow was expressed in terms of ground-based Leaf Area Index measurements (LAI), which easily related to UAV-based Normalized Difference Vegetation Index (NDVI). The comparative analysis between Arundo donax stands NDVI and LAI map enabled the analysis of the impact of UAV-acquired multispectral imagery on bulk drag predictions along the vegetated drainage channel.
1. Introduction
The presence of aquatic vegetation inside vegetated open channels has a strong impact on flood hazards in urban areas [1,2,3]. The identification of the riparian vegetation traits affecting flow resistance is one of the most relevant topics of both modeling and experimental analyses in ecohydraulics [4,5]. Riparian plants behave differently depending on their bio-mechanical and morphometric traits, and on their submergence. According to Västilä and Järvelä [4], when flexural rigidity of riparian plant’s stems is very far from negligible, flow resistance associated with weed riparian vegetation species can be computed by exploiting Leaf Area Index (LAI). to estimate the so-called bulk drag coefficient [6,7]. The implications of the interaction between flow and vegetation in vegetated water bodies on their main fluid dynamic features have been largely investigated in many experimental and numerical analyses by schematizing riparian plants as natural-like elements [8,9,10,11].
Among other methods associated with remote sensing data, digital processing of images acquired through Unmanned Aerial Vehicles (UAV) represents a promising tool for mapping the most relevant riparian vegetation parameters within vegetated water bodies. UAV-based multi and hyperspectral images have been largely applied in many forestry and precision agriculture studies [12,13,14,15,16]. However, a methodology for predicting the main hydrodynamic features of real vegetated water bodies based on these approaches is still an open research window. Indeed, most previous studies in real-scale riparian vegetation and hydrodynamic conditions have analyzed riparian plants by directly collecting them from the field, as reported by Tinoco et al. [3] and Västilä and Järvelä [4].
The present study represents one of the first efforts in estimating and validating bulk drag coefficients [4] induced by 9–10 m high Arundo donax stands, a very common riparian species [17], covering an abandoned drainage channel, based on vegetative flow resistance model proposed by Västilä and Järvelä for rigid plants [4] through the digital processing of UAV-acquired multispectral images. As shown by Tinoco et al. [3] and Etminan et al. [18], when dealing with real vegetated water bodies, vortices and mixing production associated with riparian vegetation stands depends on the only bulk drag coefficients , which consequently affects the environmental quality of both terrestrial and aquatic ecosystems within. Thus, to predict the effects of riparian vegetation stands morphometry on the hydrodynamic behavior of real vegetated streams, the knowledge of real-scale bulk drag coefficients is essential.
First, the study case is presented in terms of ecohydraulic and phenological conditions of the examined riparian vegetation species. Streamwise velocity components and ground-based Leaf Area Index (LAI) measurements were carried out at 30 cross-sections uniformly spaced along the examined vegetated drainage channel by means of a propeller-type OTT® C31 Universal Current Meter (OTT HydroMet, Kempten, Germany) and LI-COR® LAI2000 Plant Canopy Analyzer (LI-COR Inc., Lincoln, Nebraska, USA) device, respectively. The ground-based LAI measurements of the portion of Arundo donax stands effectively interacting with water flow (hereinafter indicated as LAI*) were then correlated to UAV-based Normalized Difference Vegetation Index (NDVIUAV) maps of the examined riparian stands to obtain LAI* maps of the whole channel, whose values are hereinafter indicated as LAI*UAV. In detail, 10 ground-based LAI* measurements were randomly taken across each of the 30 examined cross-sections, and the NDVIUAV values corresponding to the pixel located at the same measuring points were then compared to them.
It was demonstrated that the uncertainties associated with LAI*UAV of the examined 9–10 m high Arundo donax stands based on digital processing of multispectral images do not heavily affect the distribution of predictions along the examined vegetated drainage channel, being NDVI a very robust predictor of LAI*.
2. Materials and Methods
2.1. Study Area
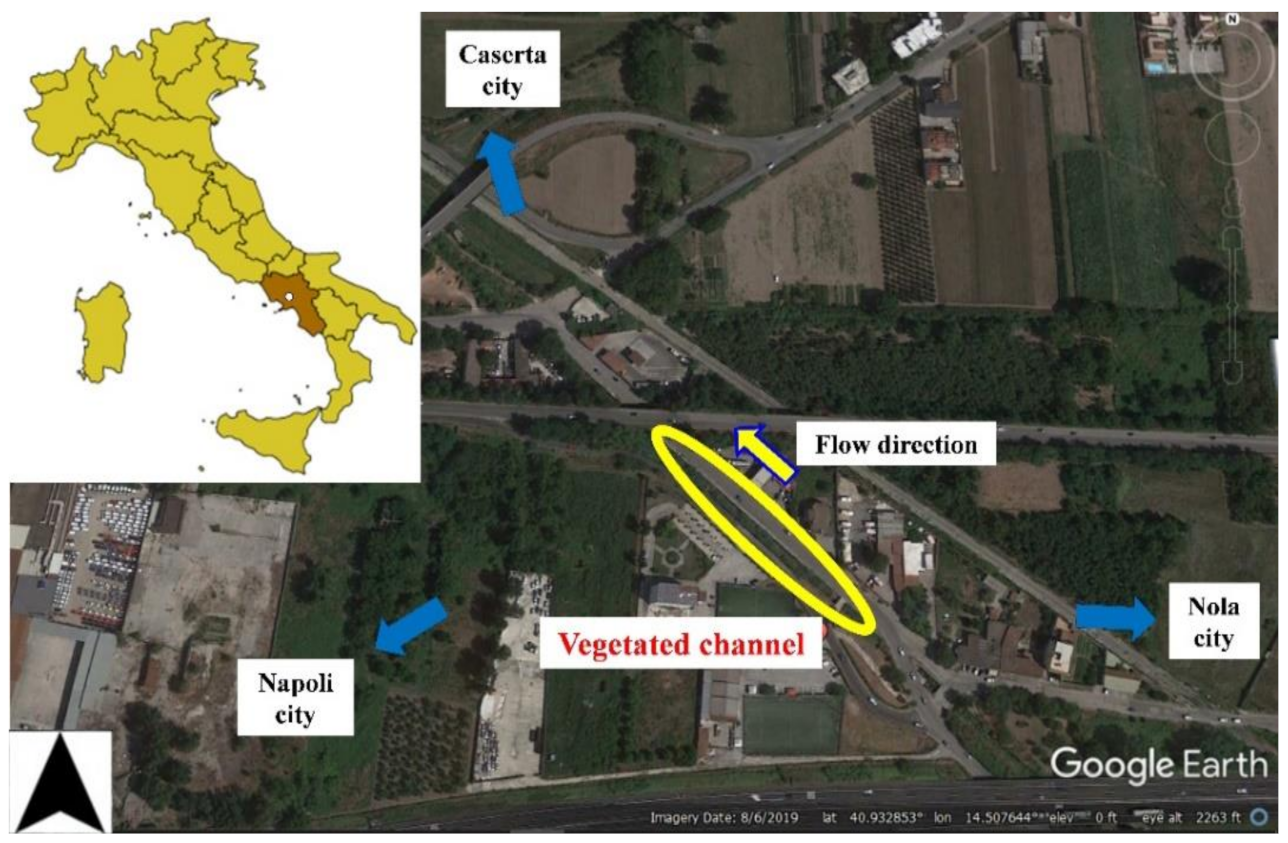
The study area examined in the present study (40°55′55″ N–14°30′32″ E) is a 115.5 m long and 5.50 m wide abandoned vegetated drainage channel, with a slope approximately equal to 0.5%, colonized by 9–10 m high Arundo donax stands, most known as giant reed, located in Nola (Campania, Southern Italy), as displayed in Figure 1.
Three experimental field campaigns were carried out in the study area, two of them devoted respectively to flow velocity measurements and ground-based Leaf Area Index measurements of Arundo donax stands’ portion effectively interacting with flow (LAI*) at 30 channel’s cross-sections, whilst the third was devoted to Normalized Difference Vegetation Index (NDVI) mapping derived by UAV-acquired multispectral images of the examined riparian plants.
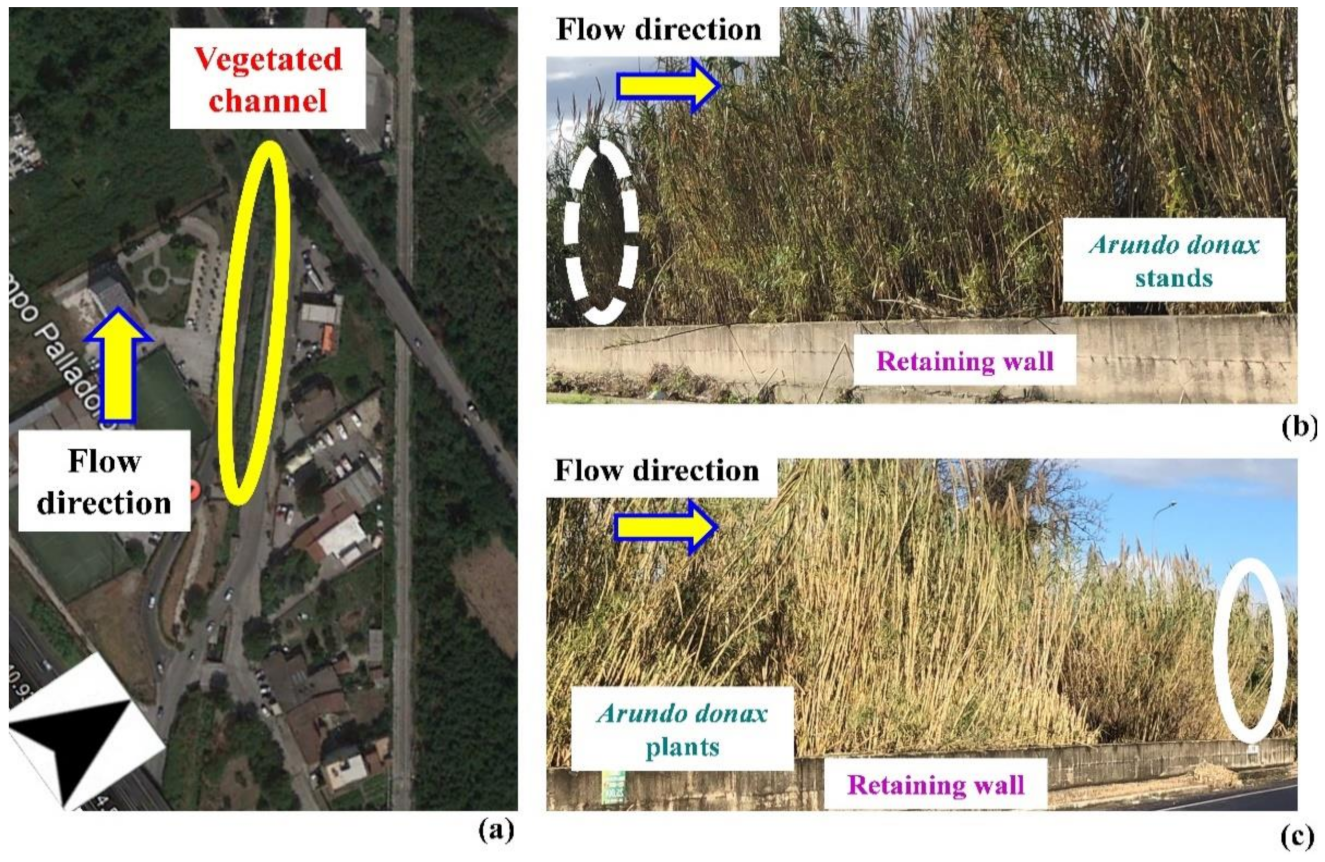
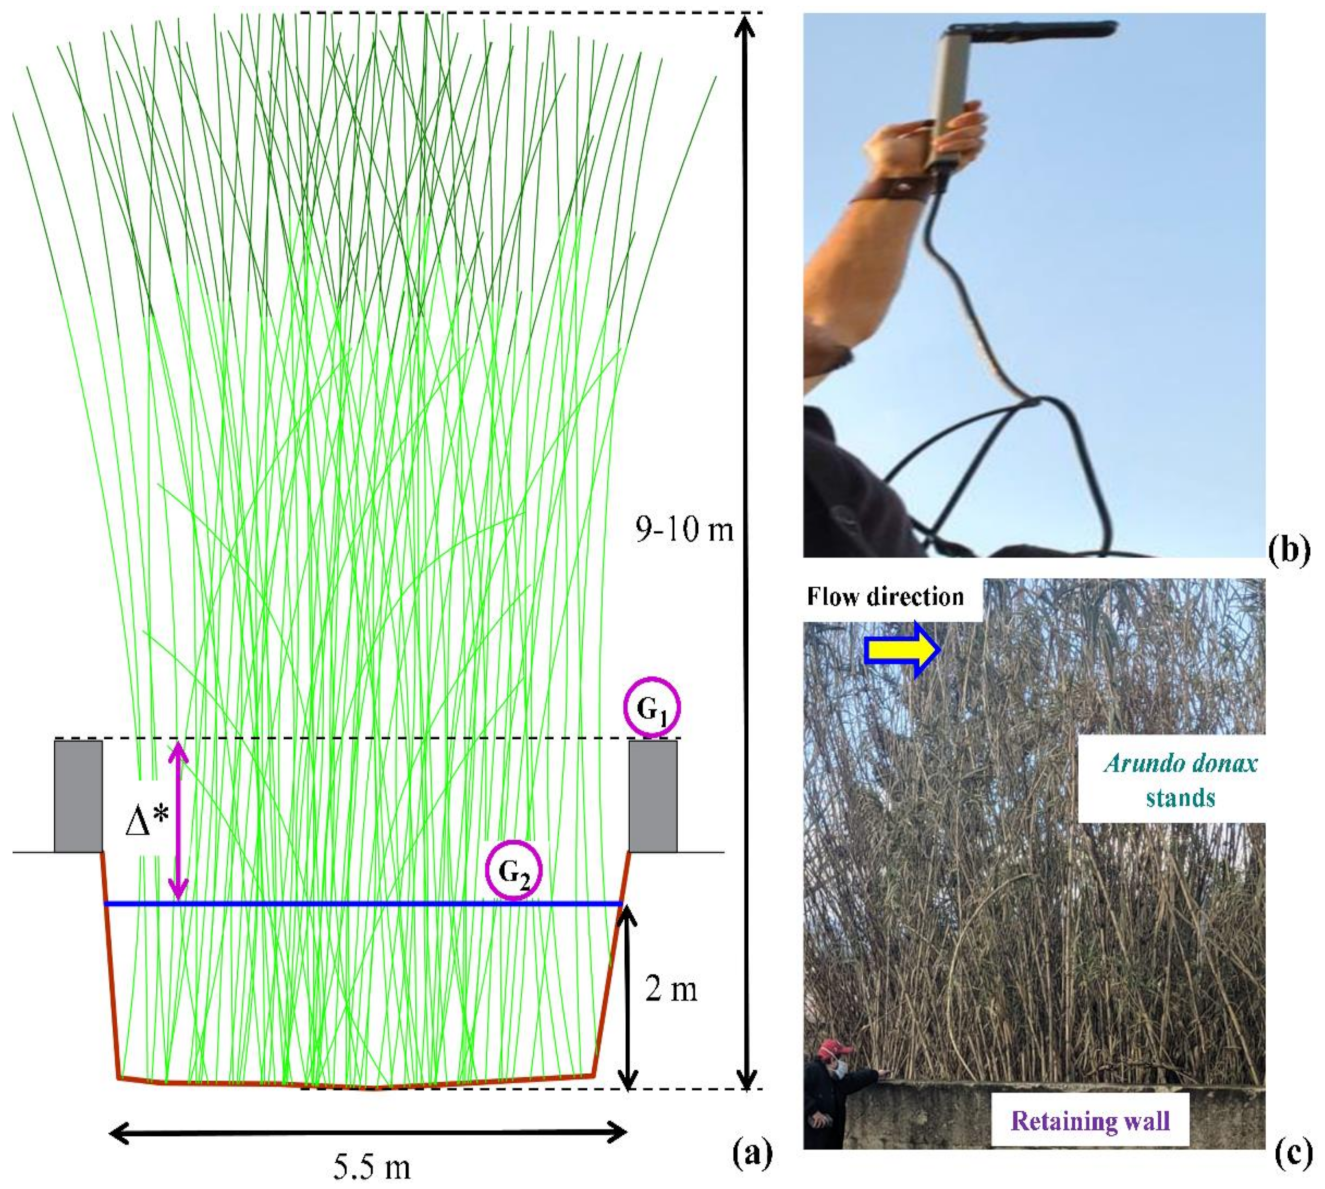
The examined channel serves a densely urbanized area, representing both a key infrastructure for mitigating pluvial and flash floods and offers important ecosystem services [1,2]. It is uniformly 2 m deep and thus the 9–10 m high Arundo donax stands were emergent. Figure 2a gives a view of the examined drainage channel, while Figure 2b,c show respectively its upstream and downstream cross-sections.
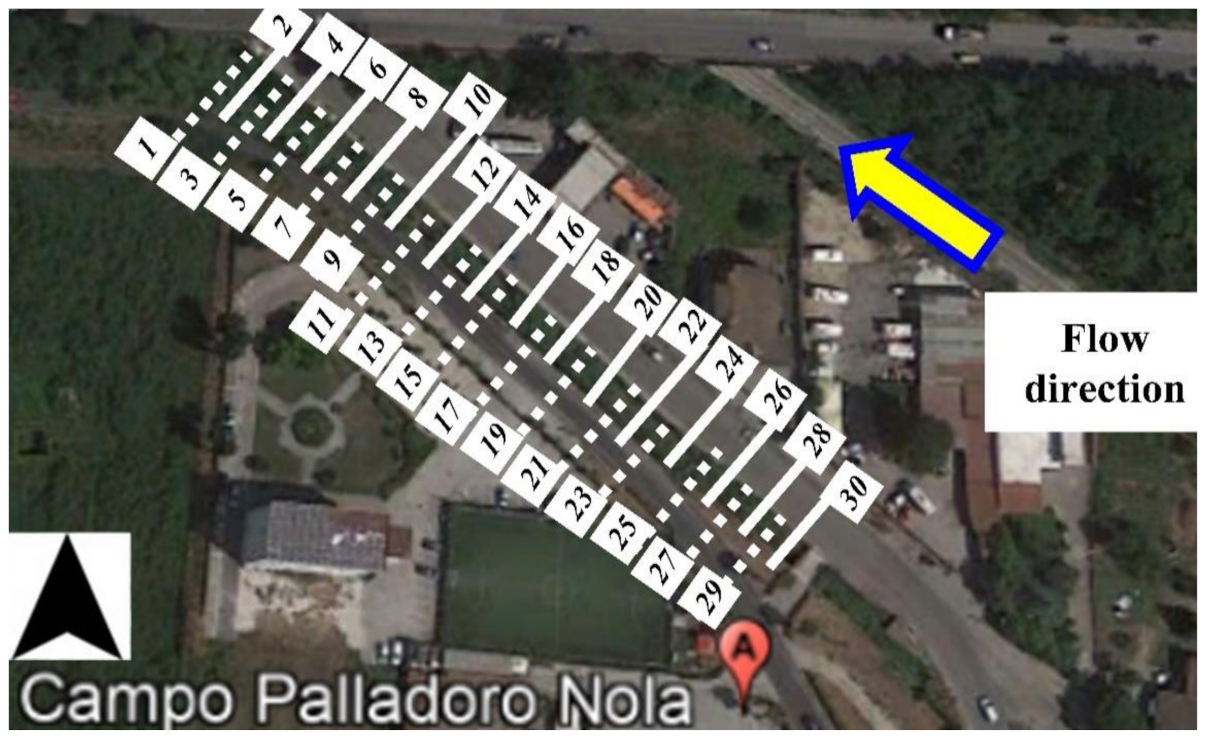
As depicted in Figure 3, LAI* and flow velocity measurements were carried out at 30 cross-sections, uniformly distributed along the vegetated drainage channel examined in the present study, located 3.85 m apart. In detail, 10 LAI* measurements were randomly carried out at each cross-section for a total of 300 data, while the streamwise velocity measurements were performed at 27 measuring points belonging to an experimental measuring grid arranged to calculate the flow average velocity U. It was then possible to estimate a discharge of 0.15 m3 s−1.
The three experimental set-ups adopted here to perform streamwise velocity components u, LAI*, and NDVI measurements are described in the next sections.
2.2. Experimental Hydrodynamic and Riparian Vegetation Measurements
2.2.1. Hydrodynamic Response of Arundo donax Stands
Hydrodynamics of vegetated streams is highly affected by the different responses of the natural elements involved in the real-scale interaction between water flow and riparian plants to water flow [4,6]. As shown in Figure 4, rigid and emergent reed—or giant reed—stands covering vegetated open channels are subjected to two forces [6,7] according to the well-known cantilever beam theory [19]: weight force W, proportional to gravity acceleration g and drag force FD, proportional to flow average velocity U.
Under these physical assumptions, flow average velocity U can be expressed as follows [7,20]:
where is the so-defined bulk drag coefficient [4], to which corresponds the flow average velocity U of each Arundo donax stand analyzed here, LAI* is the Leaf Area Index of the portion of Arundo donax stands effectively interacting with flow, R is the hydraulic radius defined by the ratio between flow area wetted perimeter at each cross-section, and J is the slope of the energy line, equal to the channel’s bed longitudinal slope under the hypothesis of uniform flow conditions. Thus, by applying the model proposed by Västilä and Järvelä [4], it is possible to compute the corresponding values of bulk drag coefficients as follows:
2.2.2. Experimental Flow Average Velocity U Measurements
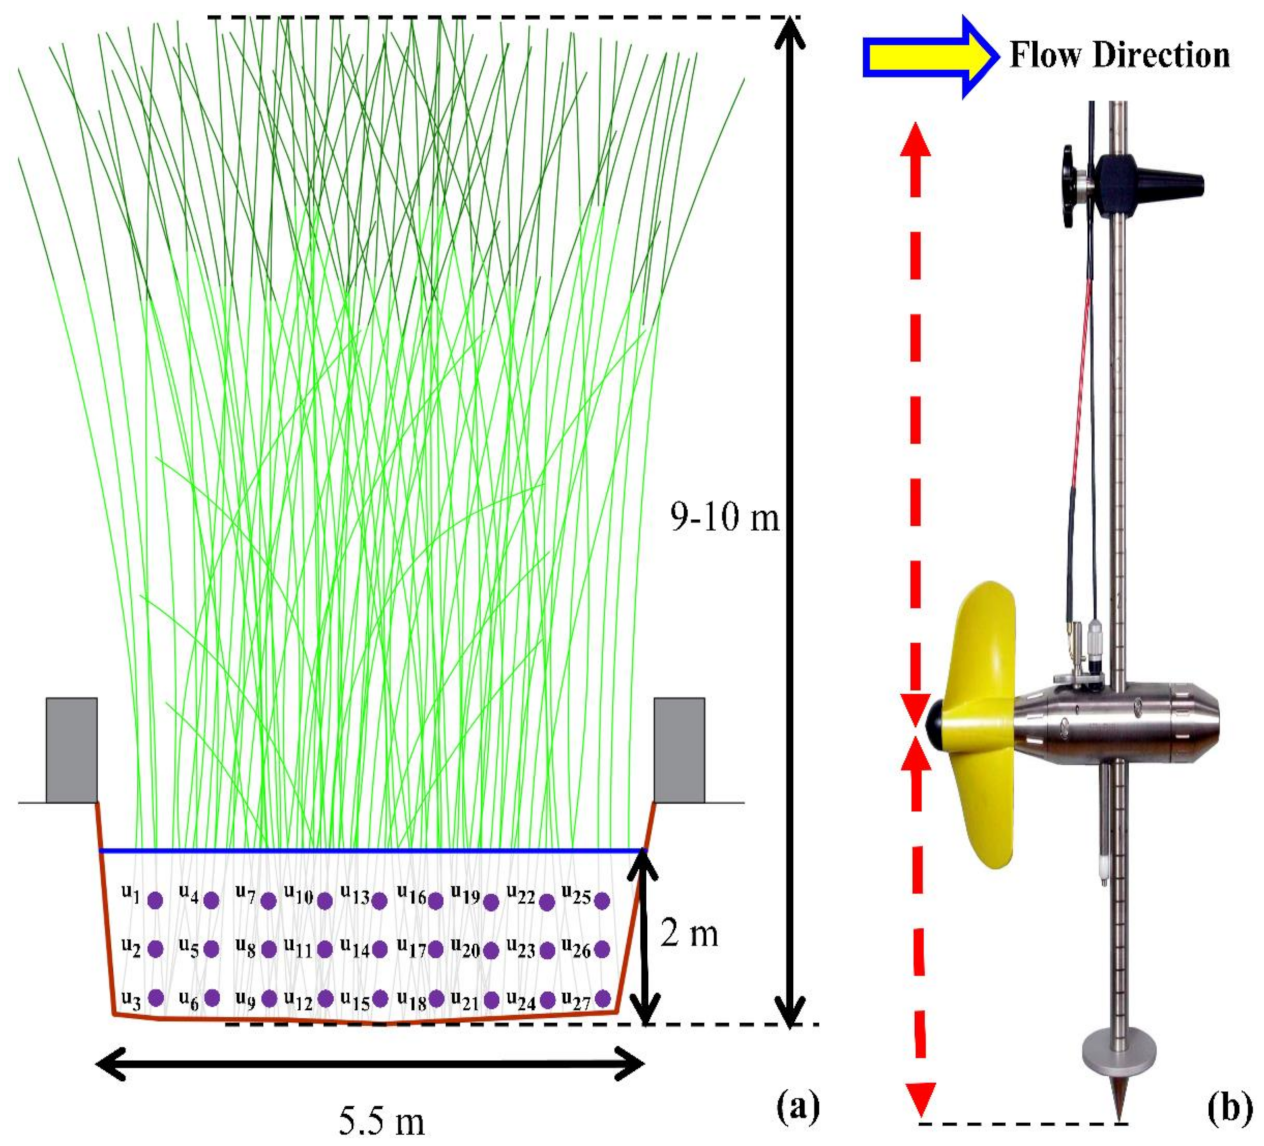
Streamwise velocity components u (m s−1) were measured at each of the 30 channel’s cross-sections through a propeller-type OTT® C31 Universal Current Meter, as depicted in Figure 5a. The experimental measuring grid was composed of 27 points spaced 0.50 m in both vertical and spanwise (or horizontal) directions, as shown in Figure 5b.
Flow area and wetted perimeter of each cross-sections were assessed by considering the real channel’s bed topography. Flow average velocities U were then computed once the experimental cross-sectional u distribution at each examined channel’s cross-section was known.
2.3. Experimental Measurements of Riparian Vegetation Indices
2.3.1. Arundo donax Stands’ LAI* Measurements
LAI analysis is representative of riparian vegetation growth and health, widely employed in the analysis of climate change effects on flooding hazards, as reported in many works on the protection and improvement of ecological services in both natural and manmade environments [21,22,23,24,25]. In the present study, a total of 300 LAI* measurements were performed at 30 cross-sections, spaced 3.85 m along the vegetated drainage channel under diffusive sky conditions to reduce the effect of sunlight fluctuations. As displayed in Figure 6a, ten LAI* measurements were randomly retrieved at each cross-section and then used for further statistical analyses, according to an experimental methodology introduced by Lama et al. [26]. In their research, the Authors analytically quantified the uncertainty in indirect LAI measurements and its impact on the accuracy of flow velocity estimations based on the vegetative flow resistance model proposed by Västilä and Järvelä [4].
After a preliminary phase of signal calibration indicated by Figure 6b, the 150° wide optical sensor of LI-COR® LAI2000 Plant Canopy Analyzer device measured the rate of sunlight transmitted through the Arundo donax canopy corresponding to the portion of vegetation going from the top of the channel’s retaining wall (position G1 in Figure 6a) to water table (position G2 in Figure 6a), indicated as Δ*. It was computed as the difference between the ground-based LAI measurements carried out at position G1 and those performed at position G2. An example of ground-based LAI measurements carried out at position G1 is reported in Figure 6c.
2.3.2. UAV-Acquired Multispectral Images
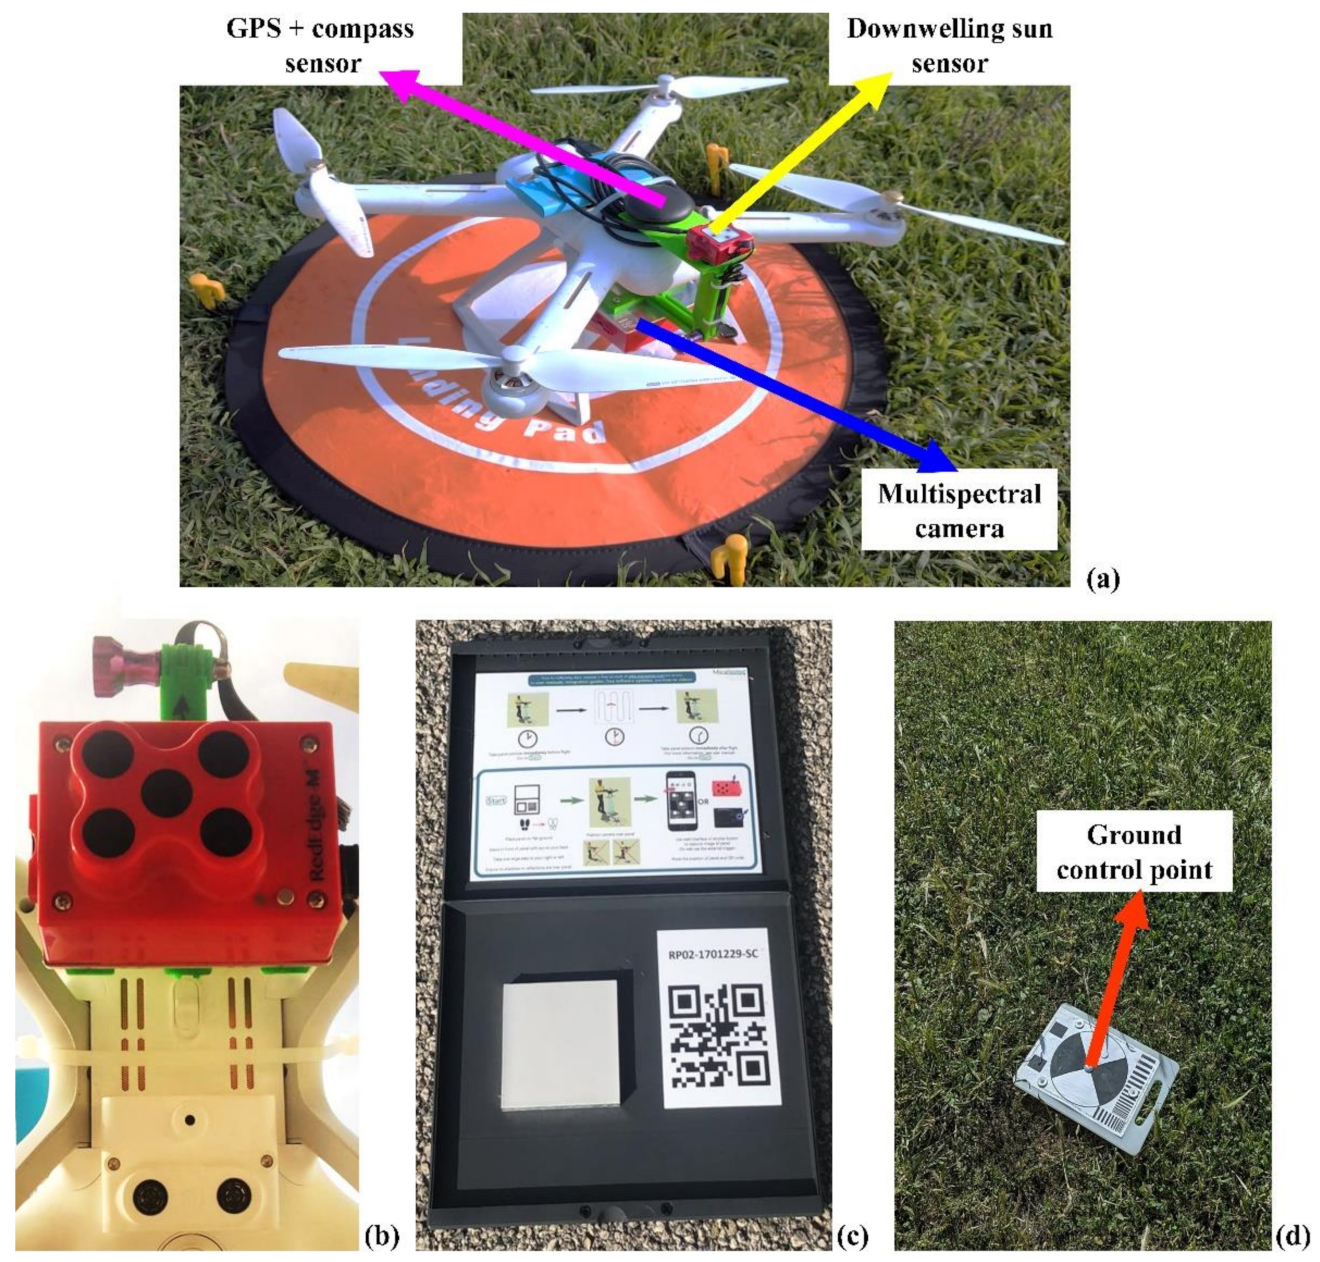
In the present work, UAV-based images of the examined vegetated drainage channel were acquired through a MicaSense® RedEdge-M (AgEagle Sensor Systems Inc., MicaSense, Seattle, WA, USA) multispectral camera [24,25] mounted on a Fimi® Xiaomi MiDrone 4k multirotor (Fimi Robot Technology Co., Ltd., Shenzen, China) device and supported by GPS + compass and downwelling sun sensors, as shown in Figure 7a.
A total of 1640 multispectral images were taken on average for each experimental UAV flight. After data collection in the field, the acquired images were then digitally post-processed.
The radiometric calibration of the MicaSense® RedEdge-M multispectral camera’s sensors (Figure 7b) was carried out by taking a single multispectral photograph to a reference calibration panel (Figure 7c) before and after each UAV flight. In detail, the radiometric calibration was performed by considering the experimental sunlight conditions in the field, based on the known panel wavelength value, as described by Mamaghani and Salvaggio [27] and Hakala et al. [28], among others. As shown in Figure 7d, since the experimental field is in a highly urbanized area, Ground Control Points (GCP) were taken either by taking coordinates of known fixed points (building corners, street corners, and so on) or by using GCPs placed in the experimental area. All GCPs have known coordinates recorded by a differential real-time kinematics (RTK) GPS [29].
In the present study, digital image and orthorectification processing were performed according to the following workflow:
- Import photos and manually remove image outliers: photos taken before and during UAV take-off, during UAV landing, photos outside the boundaries of the experimental vegetated drainage channel;
- Conversion of geotagged images (WGS84) GPS coordinates to match GCPs coordinate system;
- Photo alignment and import GCPs list (also include the accuracy of 3D coordinates X/Y/Z);
- Verify and link markers to images. It was feasible to mark each GCP in 3–6 images since the acquired images and markers have the same coordinate reference system;
- Sparse point cloud cleaning, removing all points with reprojection error [30] higher than 1, camera alignment optimization, and dense cloud building;
- Digital Elevation Model (DEM) building from dense cloud and orthomosaic based on DEM.
MicaSense® RedEdge-M multispectral camera’s most relevant parameters and their ranges are summarized in the next Table 1.
The UAV device employed here to acquire and then digitally process the multispectral images of the 9–10 m high Arundo donax stands covering the examined vegetated drainage channel is shown in Figure 8a. Each experimental UAV flight plan was set to obtain the highest quality of image acquisition in terms of the camera sensors’ coverage, as displayed in Figure 8b.
In the present study, the UAV flight plan was set to an altitude and a flight speed equal respectively to 20 m and 3 m s−1, this way it was possible to obtain an average overlap between two consecutive multispectral photos of 75% both vertically (along the flight direction) and horizontally (orthogonal to the flight direction) as well as minimize the influence of wind turbulence generated by UAV rotors on the examined Arundo donax stands. All the multispectral images acquired here were then processed via a structure-from-motion algorithm to rectify, stitch, and assemble the orthomosaic of the vegetated drainage channel [31,32].
2.3.3. Arundo donax Stands’ NDVI Map
UAVs are considered as a fast way to assess riparian vegetation indicators such as riparian stands LAI in hardly accessible areas like abandoned vegetated streams. The digital processing of multispectral images acquired through UAV devices represents a useful tool to remotely observe the growth in riparian vegetation cover and, therefore, the hydrodynamic behavior of vegetated open channels colonized by riparian stands in natural phenological conditions.
The first outcome of this research is represented by the direct correlation between NDVI derived by UAV-acquired multispectral images (NDVIUAV) and LAI* measurements of the examined riparian vegetation cover, obtained by adopting the same methodology reported in previous precision agriculture studies on UAV-based crop production indicators [33,34,35]. Riparian vegetation NDVIUAV maps are extremely useful for flooding risk management in natural and urban vegetated areas. In detail, NDVIUAV estimations of the 9–10 m high Arundo donax stands were easily derived by digitally processing UAV-acquired multispectral images by applying the following equation obtained on the basis of the spectral reflectance wavelengths ranging between 680 and 785 nm [36,37]:
where ρNIR and ρRED are the experimental spectral reflectance measurements of the examined Arundo donax stands acquired by the multispectral camera’s sensors in the Red Edge and Near-Infrared regions, respectively. The typical values of the five spectral bands and center wavelength acquired by the multispectral camera’s sensors are shown in Table 2, where the Band Number and corresponding names, the center of each spectral band in terms of Wavelength (nm), and the Bandwidth (nm) in terms of Full Width at Half Maximum (FWHM) are summarized [38,39].
NDVIUAV = (ρNIR − ρRED)/(ρNIR + ρRED),
2.3.4. Arundo donax Stands’ LAI* Map
In the present work, the LAI* map associated with the 9–10 m high Arundo donax stands covering the examined vegetated drainage channel was obtained based on a comparison performed between NDVIUAV map and LAI* measurements, both corresponding to the same 10 measuring pixels randomly distributed across each of the 30 channel’s cross-sections, for a total of 300 pairs of data.
NDVIUAV values were computed from a multispectral orthomosaic created in Agisoft® Metashape Pro v1.6 software via raster algebra operations to stitch together all UAV-acquired multispectral images were aiming at creating a single digital image of the examined vegetated drainage channel. The 300 pairs of data were randomly split into a training dataset composed of 200 pairs of data, employed to calibrate the linear regression and a test dataset composed of 100 pairs of data, to validate it, as suggested by Arsenault et al. [40], among others.
2.4. Bulk Drag Coefficients Predictions
Following Equation (2), the average LAI* referred to each of the 30 examined channel’s cross-sections and those estimated by applying the linear regression law obtained between NDVIUAV and LAI* were employed to calculate the cross-sectional bulk drag coefficients , respectively indicated as and as . By directly comparing them, it was possible to analyze the impact of the uncertainty in UAV-based LAI* (LAI*UAV) values on the real-scale bulk drag coefficients predictions associated with the vegetated drainage channel examined in this study, to assess the reliability in employing them in more complex ecohydraulic numerical models of real vegetated streams fully covered by riparian weed species as Arundo donax stands at field scale.
3. Results
3.1. Flow Velocity Measurements
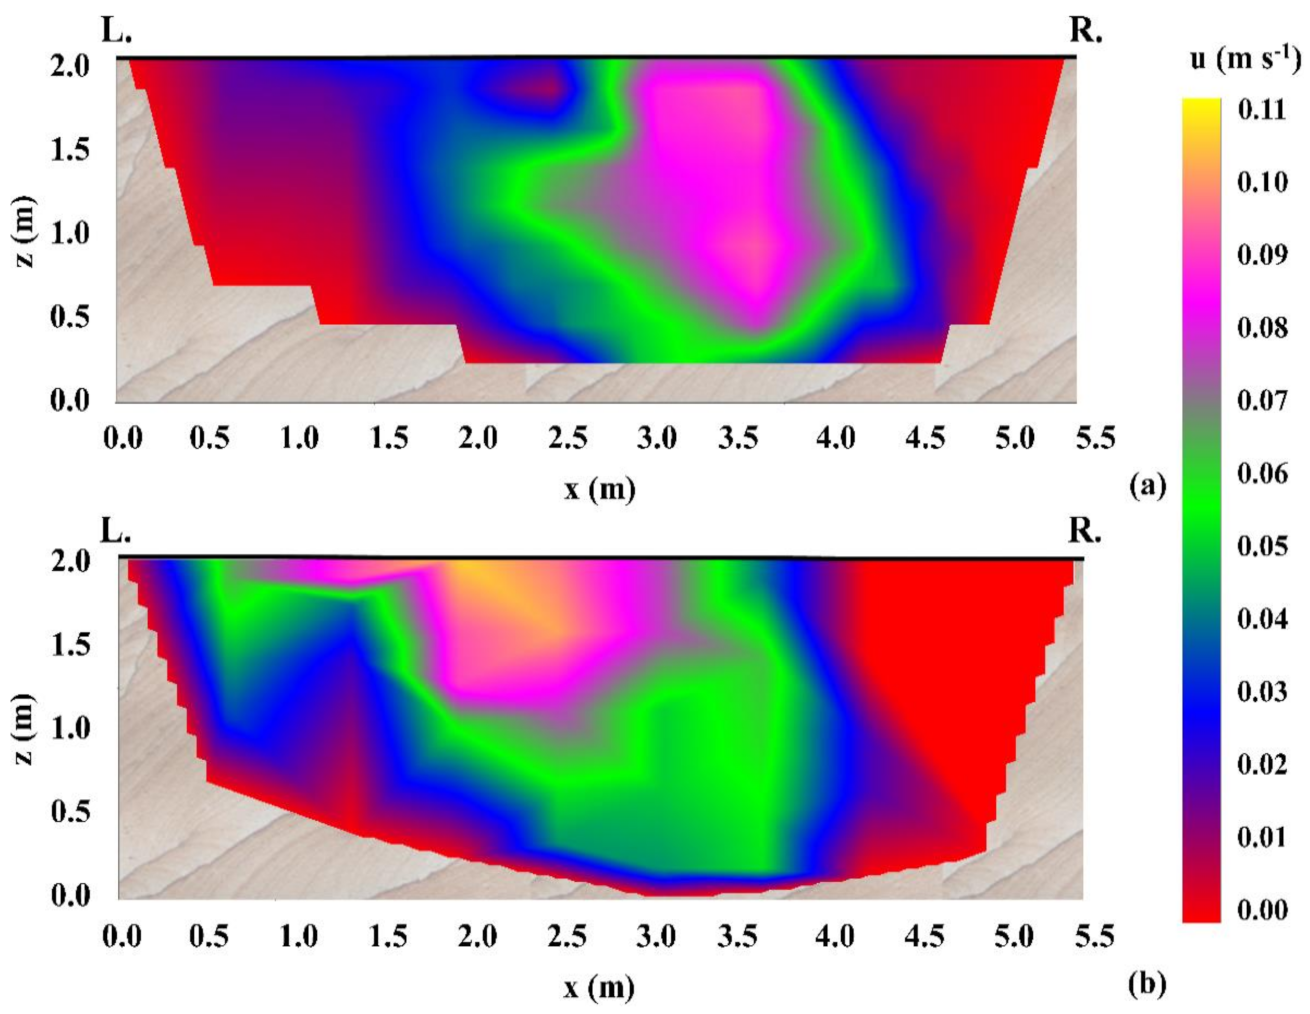
For the sake of brevity, Figure 9a and Figure 9b show the experimental cross-sectional distributions of streamwise velocity components u (m s−1) at respectively the only upstream and downstream cross-sections of the vegetated drainage channel fully covered by 9–10 m high Arundo donax stands.
In Table 3 are summarized the experimental values of flow area A (m2), wetted perimeter χ (m), hydraulic radius R (m), and flow average velocity U (m s−1) computed at the same 30 channel’s cross-sections selected for comparing LAI* and NDVIUAV.
3.2. Arundo donax Stands’ NDVIUAV Map
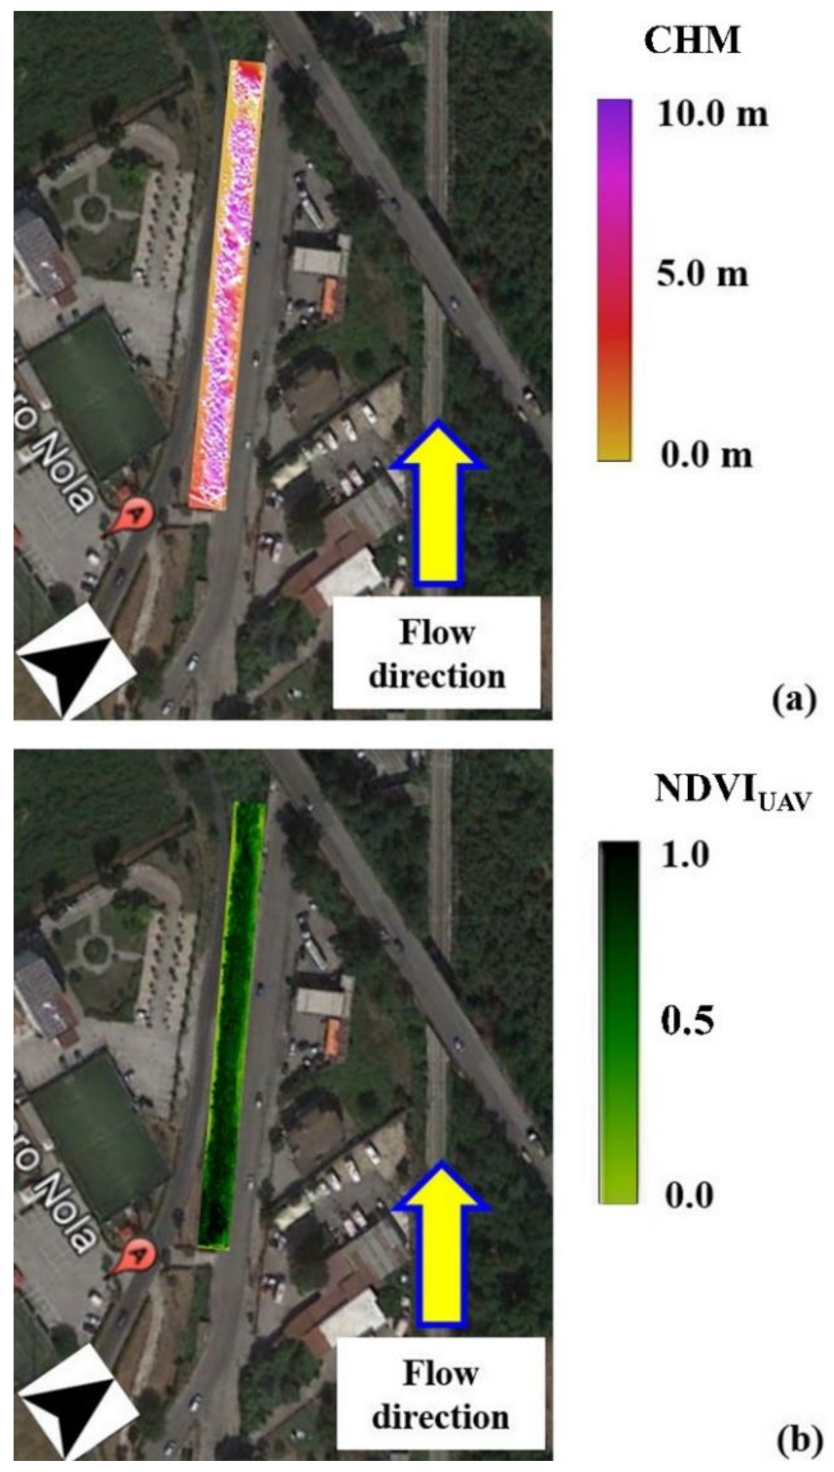
As suggested by Jimenez-Berni et al. [41], it was feasible to obtain the so-called Canopy Height Model (CHM) map in Figure 10a, representing the map of Arundo donax stands’ heights directly from DEM based on the digital processing of the UAV-acquired multispectral images. Then, the NDVIUAV map was retrieved by applying Equation (3) at each pixel of the UAV-acquired multispectral images, as shown in Figure 10b.
It is important to highlight here that UAV-acquired multispectral images refer to the reflectance properties of the upper portions of Arundo donax stands’ canopy and stems, which are necessarily correlated to the lower stands ’ portion effectively interacting with water flow dynamics, due to phenological and morphological processes, inevitably affected by the whole Arundo donax growth [42].
A complete analysis of the interplay between all the biological components of green volumes involved in these processes is out from the purposes of this study and will be examined more in detail in further works on riparian Arundo donax and Phragmites australis stands’ growth. Consequently, the further comparative analysis can be considered as properly representative of the real phenological evolution of the examined riparian vegetation species.
3.3. NDVIUAV and LAI* Correlation: Calibration and Validation
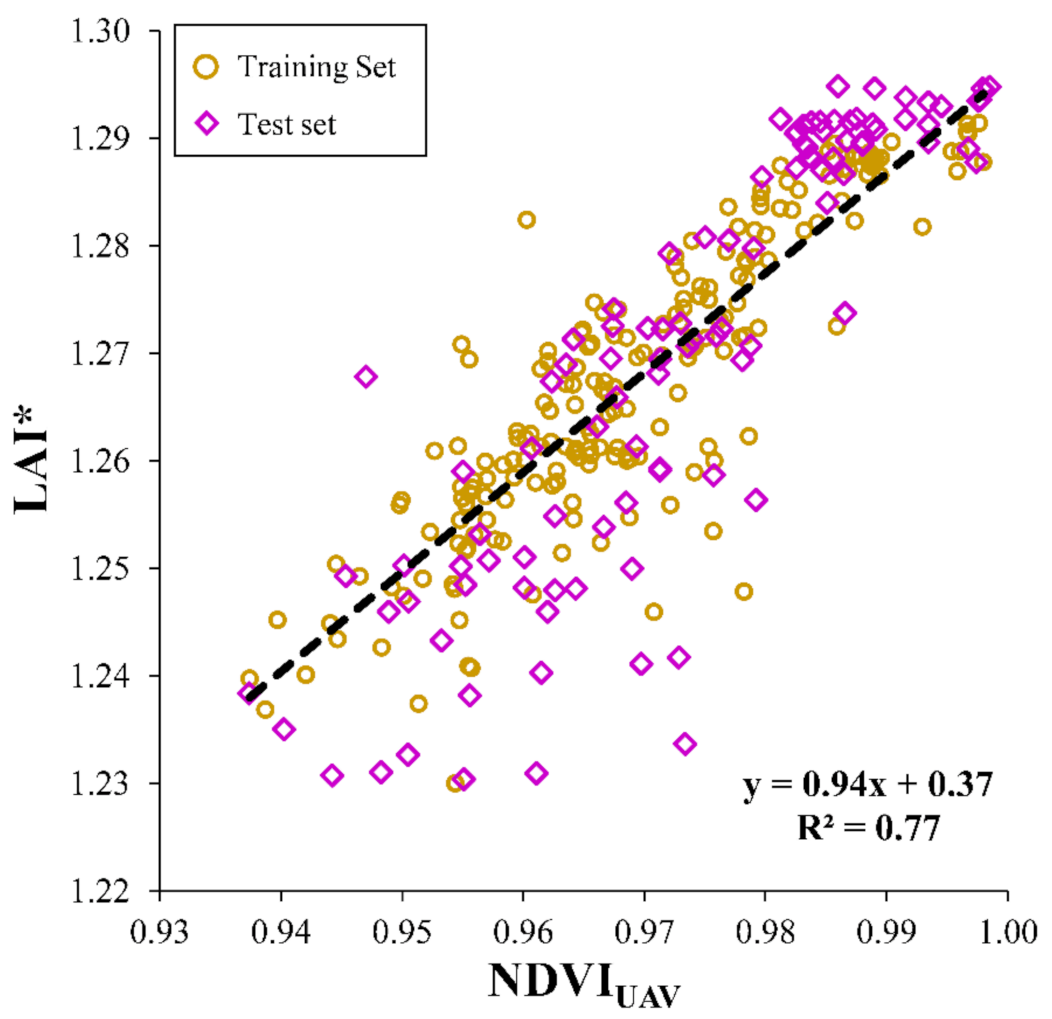
As reported in Figure 11, in order to detect the degree of dependence between LAI* and NDVIUAV and to establish a possible correlation between the two experimental vegetation indices corresponding to the examined 9–10 m high Arundo donax stands, a linear regression analysis was performed on 300 pairs of data recorded at 30 channel’s cross-sections, based on split sampling validation method [41]. In detail, 200 data were analyzed for the training set to calibrate the regression linear law, and the remaining 100 data were employed for validating it.
A high correlation existing between NDVIUAV values and LAI*Gm ones was observed in Figure 11, testified by a coefficient of determination R2 equal to 0.77. This demonstrates that NDVIUAV represents a good predictor for LAI* measurements in vegetated flows fully covered by senescent Arundo donax stands. The regression model obtained here is a linear function with an angular coefficient equal to 0.94 and a low intercept equal to 0.37. Based on a test set composed of 100 pairs of data, the validation of the linear regression confirmed the high level of correlation existing between the two riparian vegetation indices analyzed here (R2 = 0.75).
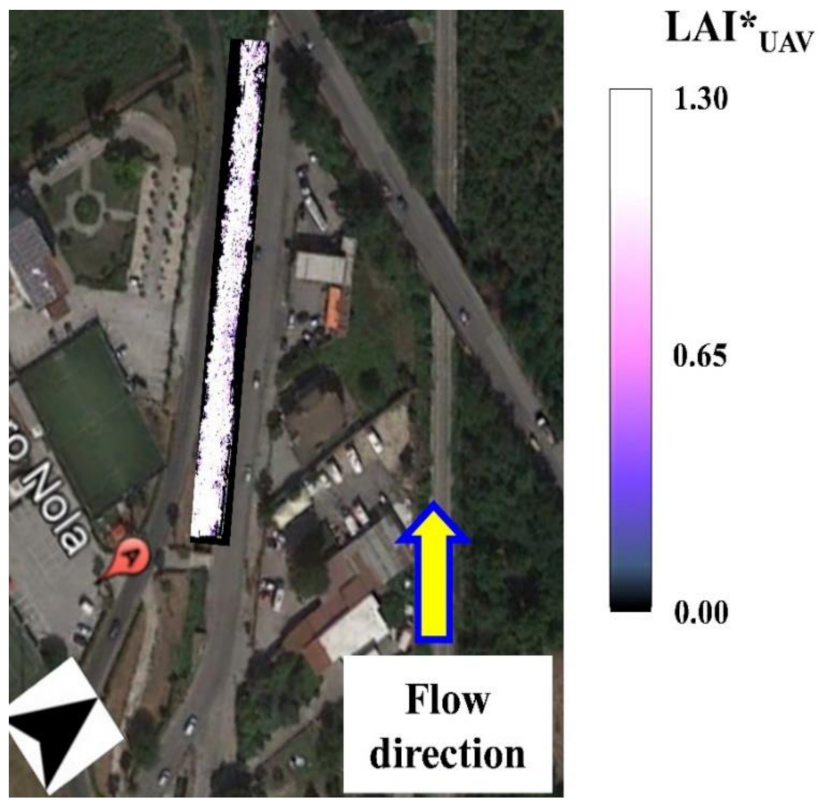
The LAI* values obtained by applying the linear law displayed in Figure 11 to all the NDVIUAV map pixels are indicated as LAI*UAV, and the corresponding map is presented in Figure 12 to visualize LAI*UAV distribution along the whole vegetated drainage channel fully covered by 9–10 m high Arundo donax stands.
3.4. Comparison of Bulk Drag Coefficients Predictions
Figure 13 reports a comparative analysis performed between bulk drag coefficients predictions obtained by employing respectively ground-based LAI* () and LAI*UAV estimations () of the examined Arundo donax stands. A linear regression analysis was carried out to easily evaluate the impact of the performance of UAV-based multispectral imagery on predictions accuracy, based on the vegetative flow resistance model proposed by Västilä and Järvelä for rigid and emergent riparian stands [4].
It emerges from the comparative analysis shown in Figure 13 that and assume values extremely comparable, almost identical, as indicated by a very high coefficient of determination R2 = 0.98.
4. Discussion
UAV-based remote sensing allows recording riparian vegetation dimensional traits in areas whose access is difficult. UAVs are widely used in precision agriculture and forestry studies and applications [43,44] to calculate and then mapping riparian vegetation indexes. Their use can be extended to the prediction LAI in areas where it is not possible to easily harvest riparian vegetation samples, such as abandoned vegetated open channels. The outcomes of this study showed a good correlation between ground-based LAI measurements and NDVI derived by digital processing of UAV-acquired multispectral images. The outcomes in terms of LAI distributions agree with the main findings of the study carried out by Fagnano et al. [45] who experimentally recorded LAI of Arundo donax stands during their whole phenological evolution for one year.
The accuracy of LAI estimations of the portion of 9–10 m high Arundo donax stands effectively interacting with water flow, derived from the NDVIUAV map obtained from UAV-acquired multispectral image is highly comparable with the outcomes of the study proposed by Tan et al. [46], which analyzed different types of wheat plants at distinct growth and foliation stages. Indeed, they obtained values of coefficients of determination R2 equal to 0.78, 0.77, and 0.76 for respectively erectophile, middle, and planophile samples, equal to that observed here (R2 = 0.77), corresponding to a phenological condition of Arundo donax senescence. The main assumption made here in terms of ground-based LAI estimations leads to the morphological and phenological correlations existing between the upper riparian canopy and lower stems. This issue can be overcome in future studies by accurately monitoring the 3D morphometry of Arundo donax stands’ covers at field scale in many different vegetated streams in natural conditions.
It was observed that bulk drag coefficients predictions are independent, or very little dependent, on the uncertainty in LAI* derived by digital processing of UAV-acquired multispectral images of Arundo donax stands covering the examined vegetated drainage channel, indicating that UAV-based NDVI is a suitable parameter to be employed in the prediction of bulk drag coefficients of senescent riparian Arundo donax stands. It is extremely interesting since, as reported in the studies performed by Luhar and Nepf [47] and Zhang and Nepf [48], an accurate prediction of the actual bulk drag coefficients is crucial for analyzing the effects of the combination of stems reconfiguration and plants canopy sheltering on the mean and turbulent hydrodynamic behavior of real vegetated water bodies. Differently from the present study case characterized by the massive presence of invasive and senescent Arundo donax stands, Zhang and Nepf [48] have examined experimental data retrieved under a condition of patchy riparian vegetation, which inevitably limited the reduction of bulk drag coefficients compared to the experimental field condition of total riparian vegetation abandonment observed in our real-scale analysis.
5. Conclusions
Bulk drag coefficients associated with a real vegetated drainage channel fully covered by 9–10 m high Arundo donax stands were predicted and validated here, based on the LAI map derived by NDVI assessments obtained through digital processing of UAV-acquired multispectral images of the riparian vegetation cover. NDVIUAV map values were correlated to ground-based LAI measurements of Arundo donax portion effectively interacting with flow to obtain LAI* maps to estimate the bulk drag coefficients associated with 30 cross-sections identified along the examined vegetated drainage channel. It was possible applying the predictive model of vegetative flow resistance proposed by Västilä and Järvelä [4] once the experimental values of the main hydraulic and hydrodynamic features measured at the same channel’s cross-sections [49,50,51,52] were known. The strong capability of UAV-acquired multispectral imagery in estimating the bulk drag coefficients of the examined vegetated drainage channel fully covered by 9–10 m high Arundo donax stands was then demonstrated by a comparative analysis performed between prediction assessed by considering the average observed and UAV-based LAI measurements at the same 30 channel’s cross-sections, respectively.
Also, it was demonstrated here that NDVI data recordings based on UAV-acquired multispectral images can be exploited to develop further methods for predicting actual LAI* or other riparian and aquatic vegetation indices, such as those based on deep learning/machine learning algorithms, already widely validated in many precision agriculture and rainfall prediction studies [53,54,55,56]. Further studies are certainly undergoing to develop these algorithms [57,58] and making even faster the assessment of the most relevant changes in water flow dynamic features of vegetated open channels associated with different riparian vegetation species, under many distinct ecohydraulic conditions, by also analyzing the key bio-mechanical and morphometric properties of riparian stands at micro-scale [59,60,61].
The results of this study represent a satisfactory advance in the monitoring of riparian vegetation dimensional properties in the field, particularly in real-scale models and simulations of vegetated flows to be employed as supporting tool for the proposal of the most appropriate mitigating scenarios of flooding events in natural and urban areas surrounding vegetated water bodies [62,63,64,65,66,67].
Author Contributions
Conceptualization, G.F.C.L. and V.P.; methodology, G.F.C.L., M.C. and R.P.; validation, G.F.C.L. and G.B.C.; investigation, M.C.; data curation, G.F.C.L., M.C., V.P. and R.P.; writing—original draft preparation, G.F.C.L., M.C. and R.P.; writing—review and editing, G.F.C.L., R.P. and G.B.C. All authors have read and agreed to the published version of the manuscript.
Funding
This research received no external funding.
Informed Consent Statement
Informed consent was obtained from all subjects involved in the study.
Data Availability Statement
The data presented in this study are available on request from the corresponding author.
Acknowledgments
The Authors want to thank Biagio Simonetti and Danny Martino from BiEMME Engineering Ltd. for their technical support during the UAV acquisitions in the field and NDVI and bed topography pre- and post-processing. The Authors also want to kindly thank Marco Casoria and Kristiano Rædleo for their precious assistance in rendering and layout customing.
Conflicts of Interest
The authors declare no conflict of interest.
References
- De Paola, F.; Ranucci, A. Analysis of spatial variability for stormwater capture tank assessment. Irrig. Drain. 2012, 61, 682–690. [Google Scholar] [CrossRef]
- Padulano, R.; Reder, A.; Rianna, G. An ensemble approach for the analysis of extreme rainfall under climate change in Naples (Italy). Hydrol. Process. 2019, 33, 2020–2036. [Google Scholar] [CrossRef]
- García-Gamero, V.; Peña, A.; Laguna, A.M.; Giráldez, J.V.; Vanwalleghem, T. Factors controlling the asymmetry of soil moisture and vegetation dynamics in a hilly mediterranean catchment. J. Hydrol. 2021, 126207. [Google Scholar] [CrossRef]
- Västilä, K.; Järvelä, J. Modeling the flow resistance of woody vegetation using physically based properties of the foliage and stem. Water Resour. Res. 2014, 50, 229–245. [Google Scholar] [CrossRef]
- Gualtieri, C.; Martone, I.; Filizola Junior, N.P.; Ianniruberto, M. Bedform Morphology in the Area of the Confluence of the Negro and Solimões-Amazon Rivers, Brazil. Water 2020, 12, 1630. [Google Scholar] [CrossRef]
- Schoelynck, J.; Struyf, E. Silicon in aquatic vegetation. Funct. Ecol. 2016, 30, 1323–1330. [Google Scholar] [CrossRef] [Green Version]
- Lama, G.F.C.; Chirico, G.B. Effects of reed beds management on the hydrodynamic behaviour of vegetated open channels. In Proceedings of the 2020 IEEE International Workshop on Metrology for Agriculture and Forestry (MetroAgriFor), Trento, Italy, 4–6 November 2020; pp. 149–154. [Google Scholar] [CrossRef]
- Breda, N.J.J. Ground-based measurements of leaf area index: A review of methods, instruments and current controversies. J. Exp. Bot. 2003, 54, 2403–2417. [Google Scholar] [CrossRef]
- Rhee, D.S.; Woo, H.; Kwon, B.; Ahn, H.K. Hydraulic resistance of some selected vegetation in open channel flows. River Res. Appl. 2008, 24, 673–687. [Google Scholar] [CrossRef]
- Cáceres-Euse, A.; Variano, E.A.; Toro-Botero, F.M.; Gómez-Giraldo, A.; Osorio, A.F. Simplified Model for Oscillatory Flow-Submerged Canopy Interaction. J. Hydraul. Eng. 2020, 146, 040200732. [Google Scholar] [CrossRef]
- Zhu, L.; Chen, Q. Numerical Modeling of Surface Waves over Submerged Flexible Vegetation. J. Eng. Mech. 2015, 141. [Google Scholar] [CrossRef]
- Tahvildari, N. Numerical modeling of the interactions between nonlinear waves and arbitrarily flexible vegetation. Coast. Eng. Proc. 2017, 1, 32. [Google Scholar] [CrossRef] [Green Version]
- Taddia, Y.; Russo, P.; Lovo, S.; Pellegrinelli, A. Multispectral UAV monitoring of submerged seaweed in shallow water. Appl. Geomat. 2020, 12, 19–34. [Google Scholar] [CrossRef] [Green Version]
- Li, Z.; Chen, H.; White, J.C.; Wulder, M.A.; Hermosilla, T. Discriminating treed and non-treed wetlands in boreal ecosystems using time series Sentinel-1 data. Int. J. Appl. Earth. Obs. 2020, 85, 102007. [Google Scholar] [CrossRef]
- Sannino, M.; Piscopo, R.; Serrapica, F.; Masucci, F.; di Francia, A.; Assirelli, A.; Cervelli, E.; Faugno, S. On Farm Evaluation of Maize Biomass, Dry Matter and Crude Protein by Using Yield Monitor Equipment. In Proceedings of the 28th European Biomass Conference and Exhibition Proceedings, on online, 6–9 July 2020; pp. 103–106. [Google Scholar] [CrossRef]
- Chasmer, L.; Mahoney, C.; Millard, K.; Nelson, K.; Peters, D.; Merchant, M.; Hopkinson, C.; Brisco, B.; Niemann, O.; Montgomery, J.; et al. Remote Sensing of Boreal Wetlands 2: Methods for Evaluating Boreal Wetland Ecosystem State and Drivers of Change. Remote Sens. 2020, 12, 1321. [Google Scholar] [CrossRef] [Green Version]
- Bustamante, J.; Aragonés, D.; Afán, I.; Luque, C.J.; Pérez-Vázquez, A.; Castellanos, E.M.; Díaz-Delgado, R. Hyperspectral sensors as a management tool to prevent the invasion of the exotic cordgrass Spartina densiflora in the Doñana wetlands. Remote Sens. 2016, 8, 1001. [Google Scholar] [CrossRef] [Green Version]
- Etminan, V.; Lowe, R.J.; Ghisalberti, M. A new model for predicting the drag exerted by vegetation canopies. Water Resour. Res. 2017, 53, 3179–3196. [Google Scholar] [CrossRef]
- Magliulo, G.; Petrone, C.; Capozzi, V.; Maddaloni, G.; Lopez, P.; Manfredi, G. Seismic performance evaluation of plasterboard partitions via shake table tests. Bull. Earthquake Eng. 2014, 12, 1657–1677. [Google Scholar] [CrossRef]
- Lama, G.F.C. Flow Resistance in Open Channels Colonized by Phragmites australis: Field Experiments and Modeling. Ph.D. Thesis, Water Resources Management and Biosystems Engineering Division, Department of Agricultural Sciences, University of Naples Federico II, Naples, Italy, 8 May 2020. [Google Scholar]
- Adão, T.; Hruška, J.; Pádua, L.; Bessa, J.; Peres, E.; Morais, R.; Sousa, J.J. Hyperspectral Imaging: A Review on UAV-Based Sensors, Data Processing and Applications for Agriculture and Forestry. Remote Sens. 2017, 9, 1110. [Google Scholar] [CrossRef] [Green Version]
- Khaliq, A.; Comba, L.; Biglia, A.; Ricauda Aimonino, D.; Chiaberge, M.; Gay, P. Comparison of Satellite and UAV-Based Multispectral Imagery for Vineyard Variability Assessment. Remote Sens. 2019, 11, 436. [Google Scholar] [CrossRef] [Green Version]
- Bianco, F.; Race, M.; Papirio, S.; Oleszczuk, P.; Esposito, G. The addition of biochar as a sustainable strategy for the remediation of PAH-contaminated sediments. Chemosphere 2021, 263, 128274. [Google Scholar] [CrossRef]
- Papirio, S. Coupling acid pretreatment and dosing of Ni and Se enhances the biomethane potential of hazelnut skin. J. Clean. Prod. 2020, 262, 12140. [Google Scholar] [CrossRef]
- Motohka, T.; Nasahara, K.N.; Oguma, H.; Tsuchida, S. Applicability of Green-Red Vegetation Index for Remote Sensing of Vegetation Phenology. Remote Sens. 2010, 2, 2369–2387. [Google Scholar] [CrossRef] [Green Version]
- Lama, G.F.C.; Errico, A.; Pasquino, V.; Mirzaei, S.; Preti, F.; Chirico, G.B. Velocity Uncertainty Quantification based on Riparian Vegetation Indices in open channels colonized by Phragmites australis. J. Ecohydraul. 2021, in press. [Google Scholar]
- Mamaghani, B.; Salvaggio, C. Multispectral Sensor Calibration and Characterization for sUAS Remote Sensing. Sensors 2019, 19, 4453. [Google Scholar] [CrossRef] [PubMed] [Green Version]
- Hakala, T.; Markelin, L.; Honkavaara, E.; Scott, B.; Theocharous, T.; Nevalainen, O.; Näsi, R.; Suomalainen, J.; Viljanen, N.; Greenwell, C.; et al. Direct Reflectance Measurements from Drones: Sensor Absolute Radiometric Calibration and System Tests for Forest Reflectance Characterization. Sensors 2018, 18, 1417. [Google Scholar] [CrossRef] [Green Version]
- Desta, E.; Nex, F.; Kerle, N. Accuracy assessment of real-time kinematics (RTK) measurements on unmanned aerial vehicles (UAV) for direct geo-referencing. Geo. Spat. Inf. Sci. 2020, 23, 165–181. [Google Scholar]
- López-Martínez, A.; Cuevas, F.J. Multiple View Relations Using the Teaching and Learning-Based Optimization Algorithm. Computers 2020, 9, 101. [Google Scholar] [CrossRef]
- Pijl, A.; Tosoni, M.; Roder, G.; Sofia, G.; Tarolli, P. Design of Terrace Drainage Networks Using UAV-Based High-Resolution Topographic Data. Water 2019, 11, 814. [Google Scholar] [CrossRef] [Green Version]
- Pijl, A.; Quarella, E.; Vogel, T.A.; D’Agostino, V.; Tarolli, P. Remote sensing vs. field-based monitoring of agricultural terrace degradation. Int. Soil Water Conserv. Res. 2021, 9, 1–10. [Google Scholar] [CrossRef]
- Di Nisio, A.; Adamo, F.; Acciani, G.; Attivissimo, F. Fast Detection of Olive Trees Affected by Xylella Fastidiosa from UAVs Using Multispectral Imaging. Sensors 2020, 20, 4915. [Google Scholar] [CrossRef]
- Micasense Inc. Automatic Calibration Panel Detection (QR Mode). Available online: https://support.micasense.com/hc/en-us/articles/360018618774 (accessed on 14 December 2020).
- Hashimoto, N.; Saito, Y.; Homma, K. Simulation of Reflectance and Vegetation Indices for Unmanned Aerial Vehicle (UAV) Monitoring of Paddy Fields. Remote Sens. 2019, 11, 2119. [Google Scholar] [CrossRef] [Green Version]
- Li, S.; Yuan, F.; Ata-UI-Karim, S.T.; Zheng, H.; Cheng, T.; Liu, X.; Tian, Y.; Zhu, Y.; Cao, W.; Cao, Q. Combining Color Indices and Textures of UAV-Based Digital Imagery for Rice LAI Estimation. Remote Sens. 2019, 11, 1763. [Google Scholar] [CrossRef] [Green Version]
- Martínez-Guanter, J.; Egea, G.; Pérez-Ruiz, M.; Apolo-Apolo, O.E. Estimation of the Leaf Area Index in Maize Based on UAV Imagery Using Deep Learning Techniques, in Precision Agriculture; Wageningen Academic Publishers: Wageningen, The Netherlands, 2019; pp. 389–395. [Google Scholar] [CrossRef]
- Rouse, J.W., Jr.; Haas, R.H.; Schell, J.A.; Deering, D.W. Monitoring vegetation systems in the Great Plains with ERTS. In Third Earth Resources Technology Satellite-1 Symposium: Section A-B. Technical Presentations; Stanley, C., Freden, E.P., Mercanti, M., Becker, A., Eds.; Scientific and Technical Information Office, National Aeronautics and Space Administration: Washington, DC, USA, 1974; pp. 309–329. [Google Scholar]
- Sarghini, F.; De Vivo, A. Analysis of preliminary design requirements of a heavy lift multirotor drone for agricultural use. Chem. Eng. Trans. 2017, 58, 625–630. [Google Scholar] [CrossRef]
- Arsenault, R.; Brissette, F.; Martel, J.-L. The hazards of split-sample validation in hydrological model calibration. J. Hydrol. 2018, 566, 346–362. [Google Scholar] [CrossRef]
- Jimenez-Berni, J.A.; Deery, D.M.; Rozas-Larraondo, P.; Condon, A.G.; Rebetzke, G.J.; James, R.A.; Bovill, W.D.; Furbank, R.T.; Sirault, X.R.R. High Throughput Determination of Plant Height, Ground Cover, and Above-Ground Biomass in Wheat with LiDAR. Front. Plant Sci. 2018, 9, 237. [Google Scholar] [CrossRef] [PubMed] [Green Version]
- Fabbrini, F.; Ludovisi, R.; Alasia, O.; Flexas, J.; Douthe, C.; Ribas Carbó, R.; Robson, P.; Taylor, G.; Scarascia-Mugnozza, G.; Keurentjes, J.J.B.; et al. Characterization of phenology, physiology, morphology and biomass traits across a broad Euro-Mediterranean ecotypic panel of the lignocellulosic feedstock Arundo donax. GCB Bioenergy 2019, 11, 152–170. [Google Scholar] [CrossRef]
- Raj, R.; Suradhaniwar, S.; Nandan, R.; Jagarlapudi, A.; Walker, J. Drone-Based Sensing for Leaf Area Index Estimation of Citrus Canopy. In Proceedings of UASG 2019. Lecture Notes in Civil Engineering; Jain, K., Khoshelham, K., Zhu, X., Tiwari, A., Eds.; Springer: Cham, Switzerland, 2020; Volume 51, pp. 79–89. [Google Scholar]
- Candiago, S.; Remondino, F.; De Giglio, M.; Dubbini, M.; Gattelli, M. Evaluating Multispectral Images and Vegetation Indices for Precision Farming Applications from UAV Images. Remote Sens. 2015, 7, 4026–4047. [Google Scholar] [CrossRef] [Green Version]
- Fagnano, M.; Impagliazzo, A.; Mori, M.; Fiorentino, N. Agronomic and Environmental Impacts of Giant Reed (Arundo donax L.): Results from a Long-Term Field Experiment in Hilly Areas Subject to Soil Erosion. Bioenergy Res. 2015, 8, 415–422. [Google Scholar] [CrossRef]
- Tan, C.W.; Zhang, P.P.; Zhou, X.X.; Wang, Z.X.; Xu, Z.Q.; Mao, W.; Li, W.X.; Huo, Z.Y.; Guo, W.S.; Yun, F. Quantitative monitoring of leaf area index in wheat of different plant types by integrating NDVI and Beer-Lambert law. Sci. Rep. 2020, 10, 929. [Google Scholar] [CrossRef]
- Luhar, M.; Nepf, H.M. From the blade scale to the reach scale: A characterization of aquatic vegetative drag. Adv. Water Res. 2013, 51, 305–316. [Google Scholar] [CrossRef]
- Zhang, X.; Nepf, H.M. Flow-induced reconfiguration of aquatic plants, including the impact of leaf sheltering. Limnol. Oceanogr. 2020, 65, 2697–2712. [Google Scholar] [CrossRef]
- Lama, G.F.C.; Errico, A.; Francalanci, S.; Solari, L.; Preti, F.; Chirico, G.B. Evaluation of Flow Resistance Models Based on Field Experiments in a Partly Vegetated Reclamation Channel. Geosciences 2020, 10, 47. [Google Scholar] [CrossRef] [Green Version]
- Errico, A.; Lama, G.F.C.; Francalanci, S.; Chirico, G.B.; Solari, L.; Preti, F. Flow dynamics and turbulence patterns in a drainage channel colonized by common reed (Phragmites australis) under different scenarios of vegetation management. Ecol. Eng. 2019, 133, 39–52. [Google Scholar] [CrossRef]
- Gijón Mancheño, A.; Jansen, W.; Winterwerp, J.C.; Uijttewaal, W.S.J. Predictive model of bulk drag coefficient for a nature-based structure exposed to currents. Sci. Rep. 2021, 11, 3517. [Google Scholar] [CrossRef]
- Tinoco, R.O.; San Juan, J.E.; Mullarney, C. Simplification bias: Lessons from laboratory and field experiments on flow through aquatic vegetation. Earth Surf. Process. Landf. 2020, 45, 121–143. [Google Scholar] [CrossRef]
- Capolupo, A.; Nasta, P.; Palladino, M.; Cervelli, E.; Boccia, L.; Romano, N. Assessing the ability of hybrid poplar for in-situ phytoextraction of cadmium by using UAV-photogrammetry and 3D flow simulator. Int. J. Remote Sens. 2018, 39, 5175–5194. [Google Scholar] [CrossRef]
- Pelosi, A.; Villani, P.; Falanga Bolognesi, S.; Chirico, G.B.; D’Urso, G. Predicting Crop Evapotranspiration by Integrating Ground and Remote Sensors with Air Temperature Forecasts. Sensors 2020, 20, 1740. [Google Scholar] [CrossRef] [Green Version]
- Padulano, R.; Lama, G.F.C.; Rianna, G.; Santini, M.; Mancini, M.; Stojiljkovic, M. Future rainfall scenarios for the assessment of water availability in Italy. In Proceedings of the 2020 IEEE International Workshop on Metrology for Agriculture and Forestry (MetroAgriFor), Trento, Italy, 4–6 November 2020; pp. 241–246. [Google Scholar] [CrossRef]
- Esposito, M.; Crimaldi, M.; Cirillo, V.; Sarghini, F.; Maggio, A. Drone and sensor technology for sustainable weed management: A review. Chem. Biol. Technol. Agric. 2021, 8, 18. [Google Scholar] [CrossRef]
- Crimaldi, M.; Cristiano, V.; De Vivo, A.; Isernia, M.; Ivanov, P.; Sarghini, F. Neural Network Algorithms for Real Time Plant Diseases Detection Using UAVs. In Innovative Biosystems Engineering for Sustainable Agriculture, Forestry and Food Production; Coppola, A., Di Renzo, G., Altieri, G., D’Antonio, P., Eds.; Springer: Cham, Switzerland, 2020; pp. 827–835. [Google Scholar] [CrossRef]
- Pizarro, A.; Dal Sasso, S.F.; Perks, M.T.; Manfreda, S. Identifying the optimal spatial distribution of tracers for optical sensing of stream surface flow. Hydrol. Earth Syst. Sc. 2020, 24, 5173–5185. [Google Scholar] [CrossRef]
- Licata, V.; D’Onofrio, A.; Silvestri, F. Microstructural factors affecting the static and the cyclic resistance of a pyroclastic silty sand. Géotechnique 2018, 5, 434–441. [Google Scholar] [CrossRef]
- Lama, G.C.; Gentile, G.; Cerruti, G.; Lavorgna, M.; Ambrogi, V.; Carfagna, C. Shape-Memory Nanocomposite Elastomers Filled with Carbon Nanomaterials. Adv. Sci. Technol. 2016, 100, 5–10. [Google Scholar] [CrossRef]
- Buonanomi, G.; Salvatori, N.; Zotti, M.G.; Stinca, A.; Motti, R.; Idbella, M.; Caternì, F.; Mazzoleni, S.; Giannino, F. Parasitic plant causes ephemeral “rainbow” pattern in a reservoir bank. J. Veg. Sci. 2020, 00, 1–12. [Google Scholar] [CrossRef]
- Lama, G.F.C.; Errico, A.; Francalanci, S.; Solari, L.; Chirico, G.B.; Preti, F. Hydraulic Modeling of Field Experiments in a Drainage Channel Under Different Riparian Vegetation Scenarios. In Innovative Biosystems Engineering for Sustainable Agriculture, Forestry and Food Production; Coppola, A., Di Renzo, G., Altieri, G., D’Antonio, P., Eds.; Springer: Cham, Switzerland, 2020; pp. 69–77. [Google Scholar] [CrossRef]
- Furlani, S.; Vaccher, V.; Macovaz, V.; Devoto, S. A Cost-Effective Method to Reproduce the Morphology of the Nearshore and Intertidal Zone in Microtidal Environments. Remote Sens. 2020, 12, 1880. [Google Scholar] [CrossRef]
- D’Ippolito, A.; Calomino, F.; Alfonsi, G.; Lauria, A. Flow Resistance in Open Channel Due to Vegetation at Reach Scale: A Review. Water 2021, 13, 116. [Google Scholar] [CrossRef]
- Lama, G.F.C.; Errico, A.; Francalanci, S.; Chirico, G.B.; Solari, L.; Preti, F. Comparative analysis of modeled and measured vegetative Chézy flow resistance coefficients in a drainage channel vegetated by dormant riparian reed. In Proceedings of the 2019 IEEE International Workshop on Metrology for Agriculture and Forestry (MetroAgriFor), Portici, Italy, 24–26 October 2019; pp. 180–184. [Google Scholar] [CrossRef]
- Jalonen, J.; Järvelä, J.; Virtanen, J.-P.; Vaaja, M.; Kurkela, M.; Hyyppä, H. Determining Characteristic Vegetation Areas by Terrestrial Laser Scanning for Floodplain Flow Modeling. Water 2015, 7, 420–437. [Google Scholar] [CrossRef] [Green Version]
- Nasta, P.; Allocca, C.; Deidda, R.; Romano, N. Assessing the impact of seasonal-rainfall anomalies on catchment-scale water balance components. Hydrol. Earth Syst. Sci. 2020, 24, 3211–3227. [Google Scholar] [CrossRef]
Figure 1.
Study area overview (40°55′55″ N–14°30′32″ E, Nola—Southern Italy). The yellow ellipse indicates the vegetated drainage channel fully covered by 9–10 m high Arundo donax stands. The yellow arrow indicates the flow direction.
Figure 1.
Study area overview (40°55′55″ N–14°30′32″ E, Nola—Southern Italy). The yellow ellipse indicates the vegetated drainage channel fully covered by 9–10 m high Arundo donax stands. The yellow arrow indicates the flow direction.

Figure 2.
(a) Aerial view of the vegetated drainage channel fully covered by 9–10 m high Arundo donax stands, indicated by the yellow ellipse, and drainage channel’s retaining wall. (b) Upstream and (c) Downstream cross-sections of the vegetated drainage channel, respectively indicated by dashed and continuous white ellipses. The yellow arrow indicates the flow direction.

Figure 3.
Aerial view of the 30 cross-sections of the vegetated drainage channel fully covered by 9–10 m high Arundo donax stands, located 3.85 m apart. The yellow arrow indicates the flow direction.
Figure 3.
Aerial view of the 30 cross-sections of the vegetated drainage channel fully covered by 9–10 m high Arundo donax stands, located 3.85 m apart. The yellow arrow indicates the flow direction.

Figure 4.
Hydrodynamic scheme of rigid emergent Arundo donax stands interacting with water flow in vegetated streams: h and hv are the water level and the height of the stand, respectively. The yellow arrow indicates the flow direction. Adapted from Lama and Chirico [7] and Lama [20].

Figure 5.
(a) Scheme of the measuring grid composed of 27 points at each cross-section (violet measuring points) employed for the experimental velocity measurements. (b) Propeller-type OTT® C31 Universal Current Meter device, sliding on a vertical round wading rod (red bidirectional dashed arrows). The yellow arrow indicates the flow direction.

Figure 6.
(a) Experimental scheme of LAI* measurements: G1 and G2 are respectively the measuring positions located above the channel’s retaining wall and above water level (purple circles), while Δ* is the portion of Arundo donax effectively interacting with flow (purple line), to which corresponds LAI*. (b) Sunlight calibration of LI-COR® LAI2000 Plant Canopy Analyzer device and (c) ground-based LAI measurements at position G1 associated with the channel’s upstream cross-section.

Figure 7.
(a) View of the UAV employed in this study. Multispectral camera, downwelling sun sensor, and GPS + compass sensor are here indicated by yellow, pink, and blue arrows, respectively. (b) MicaSense® RedEdge-M multispectral camera, fixed as payload on the selected UAV. (c) Reference calibration panel employed for calibrating the multispectral camera to the field sunlight conditions and (d) Ground control point overview (orange arrow).

Figure 8.
(a) UAV (yellow ellipse) and (b) experimental flight plan overviews. The yellow arrow indicates the flow direction.
Figure 8.
(a) UAV (yellow ellipse) and (b) experimental flight plan overviews. The yellow arrow indicates the flow direction.

Figure 9.
Experimental cross-sectional distributions of streamwise velocity components u (m s−1) at the vegetated drainage channel’s (a) upstream and (b) downstream cross-sections.
Figure 9.
Experimental cross-sectional distributions of streamwise velocity components u (m s−1) at the vegetated drainage channel’s (a) upstream and (b) downstream cross-sections.

Figure 10.
UAV-based (a) Canopy Height Model (CHM) and (b) Normalized Difference Vegetation Index (NDVIUAV) maps of the 9–10 m high Arundo donax stands. The yellow arrow indicates the flow direction.
Figure 10.
UAV-based (a) Canopy Height Model (CHM) and (b) Normalized Difference Vegetation Index (NDVIUAV) maps of the 9–10 m high Arundo donax stands. The yellow arrow indicates the flow direction.

Figure 11.
Linear law between NDVIUAV and LAI* referred to the 30 channel’s cross-sections, for a total of 300 pairs of data. The Training (200 pairs of data) and Test datasets (100 pairs of data) are indicated here by yellow unfilled circles and purple unfilled diamonds, respectively.
Figure 11.
Linear law between NDVIUAV and LAI* referred to the 30 channel’s cross-sections, for a total of 300 pairs of data. The Training (200 pairs of data) and Test datasets (100 pairs of data) are indicated here by yellow unfilled circles and purple unfilled diamonds, respectively.

Figure 12.
LAI*UAV map of the vegetated drainage channel fully covered by 9–10 m high Arundo donax stands. The yellow arrow indicates the flow direction.
Figure 12.
LAI*UAV map of the vegetated drainage channel fully covered by 9–10 m high Arundo donax stands. The yellow arrow indicates the flow direction.

Figure 13.
Comparison of bulk drag coefficients obtained through average LAI* and LAI*UAV estimations at the 30 channel’s cross-sections, respectively indicated as and .
Figure 13.
Comparison of bulk drag coefficients obtained through average LAI* and LAI*UAV estimations at the 30 channel’s cross-sections, respectively indicated as and .


Table 1.
Main parameters of the MicaSense® RedEdge-M multispectral camera employed in the present study, and ranges.
Table 1.
Main parameters of the MicaSense® RedEdge-M multispectral camera employed in the present study, and ranges.
| Parameters | Ranges |
|---|---|
| Weight | 170 g (Including DLS) |
| Dimensions | 9.4 cm × 6.3 cm × 4.6 cm |
| Power | 4.2 V–15.8 V, 4 W nominal, 8 W peak |
| Spectral Bands | Narrowband: Blue, Green, Red, Red Edge, Near IR |
| Ground Sample Distance | 8.2 cm pixel−1 (per band) at 120 m–400 ft AGL |
| Max Capture Speed | 1 capture per second (all bands), 12-bit RAW |
Table 2.
Spectral bands acquired by the multispectral camera’s sensors and features: Band Number, Band Name, Center Wavelength (nm), and Bandwidth (nm) in terms of Full Width at Half Maximum (FWHM).
Table 2.
Spectral bands acquired by the multispectral camera’s sensors and features: Band Number, Band Name, Center Wavelength (nm), and Bandwidth (nm) in terms of Full Width at Half Maximum (FWHM).
| Band Number | Band Name | Center Wavelength (nm) | Bandwidth FWHM (nm) |
|---|---|---|---|
| 1 | Blue | 475 | 20 |
| 2 | Green | 560 | 20 |
| 3 | Red | 668 | 10 |
| 4 | Red Edge | 717 | 10 |
| 5 | Near IR | 840 | 40 |
Table 3.
Values of the hydraulic parameters of the 30 measuring channels’ cross-sections: flow area A (m2), wetted perimeter χ (m), hydraulic radius R (m), and flow average velocity U (m s−1).
Table 3.
Values of the hydraulic parameters of the 30 measuring channels’ cross-sections: flow area A (m2), wetted perimeter χ (m), hydraulic radius R (m), and flow average velocity U (m s−1).
| Cross-Section | A (m2) | χ (m) | R (m) | U (m s−1) |
|---|---|---|---|---|
| 1 | 8.695 | 8.120 | 1.071 | 0.01725 |
| 2 | 8.720 | 8.060 | 1.082 | 0.01720 |
| 3 | 8.705 | 8.115 | 1.073 | 0.01723 |
| 4 | 8.730 | 8.240 | 1.059 | 0.01718 |
| 5 | 8.656 | 8.145 | 1.063 | 0.01733 |
| 6 | 8.673 | 8.116 | 1.069 | 0.01730 |
| 7 | 8.689 | 8.148 | 1.066 | 0.01726 |
| 8 | 8.711 | 8.161 | 1.067 | 0.01722 |
| 9 | 8.654 | 8.162 | 1.060 | 0.01733 |
| 10 | 8.667 | 8.116 | 1.068 | 0.01731 |
| 11 | 8.734 | 8.129 | 1.074 | 0.01717 |
| 12 | 8.697 | 8.123 | 1.071 | 0.01725 |
| 13 | 8.710 | 8.144 | 1.069 | 0.01722 |
| 14 | 8.630 | 8.112 | 1.064 | 0.01738 |
| 15 | 8.724 | 8.130 | 1.073 | 0.01719 |
| 16 | 8.686 | 8.126 | 1.069 | 0.01727 |
| 17 | 8.724 | 8.115 | 1.075 | 0.01719 |
| 18 | 8.710 | 8.120 | 1.073 | 0.01722 |
| 19 | 8.700 | 8.112 | 1.072 | 0.01724 |
| 20 | 8.600 | 8.134 | 1.057 | 0.01744 |
| 21 | 8.670 | 8.171 | 1.061 | 0.01730 |
| 22 | 8.768 | 8.152 | 1.076 | 0.01711 |
| 23 | 8.713 | 8.114 | 1.074 | 0.01721 |
| 24 | 8.555 | 8.105 | 1.056 | 0.01753 |
| 25 | 8.668 | 8.130 | 1.066 | 0.01731 |
| 26 | 8.668 | 8.160 | 1.062 | 0.01731 |
| 27 | 8.665 | 8.117 | 1.068 | 0.01731 |
| 28 | 8.760 | 8.120 | 1.079 | 0.01712 |
| 29 | 8.631 | 8.128 | 1.062 | 0.01738 |
| 30 | 8.650 | 8.130 | 1.064 | 0.01734 |
Publisher’s Note: MDPI stays neutral with regard to jurisdictional claims in published maps and institutional affiliations. |
© 2021 by the authors. Licensee MDPI, Basel, Switzerland. This article is an open access article distributed under the terms and conditions of the Creative Commons Attribution (CC BY) license (https://creativecommons.org/licenses/by/4.0/).
Share and Cite
MDPI and ACS Style
Lama, G.F.C.; Crimaldi, M.; Pasquino, V.; Padulano, R.; Chirico, G.B. Bulk Drag Predictions of Riparian Arundo donax Stands through UAV-Acquired Multispectral Images. Water 2021, 13, 1333. https://doi.org/10.3390/w13101333
AMA Style
Lama GFC, Crimaldi M, Pasquino V, Padulano R, Chirico GB. Bulk Drag Predictions of Riparian Arundo donax Stands through UAV-Acquired Multispectral Images. Water. 2021; 13(10):1333. https://doi.org/10.3390/w13101333
Chicago/Turabian StyleLama, Giuseppe Francesco Cesare, Mariano Crimaldi, Vittorio Pasquino, Roberta Padulano, and Giovanni Battista Chirico. 2021. "Bulk Drag Predictions of Riparian Arundo donax Stands through UAV-Acquired Multispectral Images" Water 13, no. 10: 1333. https://doi.org/10.3390/w13101333
Note that from the first issue of 2016, this journal uses article numbers instead of page numbers. See further details here.