
Sediment Distribution, Retention and Morphodynamic Analysis of a River-Dominated Deltaic System

1
Department of River-Coastal Science and Engineering, Tulane University, New Orleans, LA 70118, USA
2
Coastal Protection and Restoration Authority, Baton Rouge, LA 70802, USA
3
Gomez and Sullivan Engineers, Utica, NY 13502, USA
*
Author to whom correspondence should be addressed.
Water 2021, 13(10), 1341; https://doi.org/10.3390/w13101341
Submission received: 26 March 2021
/
Revised: 30 April 2021
/
Accepted: 7 May 2021
/
Published: 12 May 2021
(This article belongs to the Section Water Erosion and Sediment Transport)
Abstract
:River deltas have received considerable attention due to coastal land loss issues caused by subsidence, storms, and sea level rise. Improved understanding of deltaic processes and dynamics is vital to coastal restoration efforts. This paper describes the application of process-based morphodynamic models to a prograding river delta. The analysis focuses on the flow and sediment dynamics amongst the interconnected channel network of the delta. The models were validated against observations of velocity and sediment concentrations for the Wax Lake Delta (WLD) of the Atchafalaya River system in Louisiana, USA. The WLD provides an opportunity as a natural laboratory for studying the processes associated with river dominated deltaic growth. It includes a network of bifurcated channels that self-organize and dynamically adjust, as the delta grows seaward to the Gulf of Mexico. The model results for a flood event show that 47% of the flow exits the system as channelized flow and the remaining 53% exits as overbank flow. The fine sediment (silt and clay) distribution was proportional with water fluxes throughout the channel network, whereas sand distribution was influenced by geometric attributes (size, invert elevation, and alignment) of the distributary channels. The long-term deltaic growth predicted by the model compares well with the observations for the period 1998–2012. This paper provides insights on how the distribution of flow and sediment amongst the interconnected delta channels influences the morphodynamics of the delta to reach a dynamic equilibrium within this relatively young deltaic system.
1. Introduction
Deltas are complex depositional features developed from river mouth sediment deposition and dispersal [1,2]. They are a preferred human habitat, with a population of over half a billion residing in major coastal cities [3,4]. River deltas have received considerable attention due to coastal land loss issues caused by subsidence, sea level rise, and extreme weather events [5]. Human activities such as river modification, hydrocarbons, and ground water extraction have further exacerbated land loss in modern deltas [1]. These actions have hindered natural deltaic processes and deprived wetlands from riverine inputs that formed and nourished them. In the case of the Lower Mississippi River Delta (LMRD), limited sediment supply to wetlands due to upstream dam construction and flood protection levees has contributed to wetland losses. Proposed engineered crevasses via river diversions are intended to mitigate these losses [6,7,8,9,10,11]. Sediment diverted to the shallow receiving basin would allow the river to build new land and sustain existing wetland areas. Creation of a river delta by such engineered activity relies on our understanding of existing river dominated deltas and is essential to develop effective coastal restoration strategies.
It is primarily believed that deltaic morphology is controlled by riverine and coastal processes such as river discharge, sediment supply, waves, and tides [12]. Characteristics of incoming sediment and the substrate of the receiving basin also influence the delta morphology [13]. Numerical models facilitate understanding of the interplay among these physical processes and how they individually or collectively affect the evolution and formation of deltas [14,15,16]. Numerical models are also used to predict the response of river deltas to environmental drivers such as sea level rise, subsidence, and flood events [17,18]. Distributary channel networks convey water, sediment, and nutrients across the delta surface and play an important role in the deltaic growth pattern [19,20,21]. Therefore, it is important to gain insights into how water and sediment are transported in the distributary channel networks. Information about water and sediment distribution within deltaic channel networks are relatively limited in the literature due to a lack of data. Correlations between water and sediment fluxes are not clearly understood, although some studies explored the hydrologic connectivity between distributary channels and interdistributary islands in a river delta, quantified water fluxes conveyed from the channels to the islands, and related this exchange to the delta evolution and environmental transport [22]. The majority of the published research on distributary channel networks focused on network topology [23,24,25,26,27]. Quantitative metrics have been proposed to describe channel network topology and such metrics have been used to obtain information on delta dynamic processes (e.g., exchange of water and sediment fluxes between channel networks) [27].
This study aims to gain understanding of flow and sediment dynamics in the channel network of a river delta system. In particular, this study investigates: (a) the partitioning of the water and sediment fluxes (both coarse and fine sediment) among the distributary channels; (b) the relationship between the sediment capturing efficiency in the distributary channels and the channel geometric parameters; and (c) the long-term flow and sediment dynamics in the channel network. The Wax Lake Delta (WLD), a river delta system in coastal Louisiana, was identified as a suitable system to perform the analysis. The findings of this study, however, are broadly applicable to other river-dominated deltaic systems.
2. Wax Lake Delta
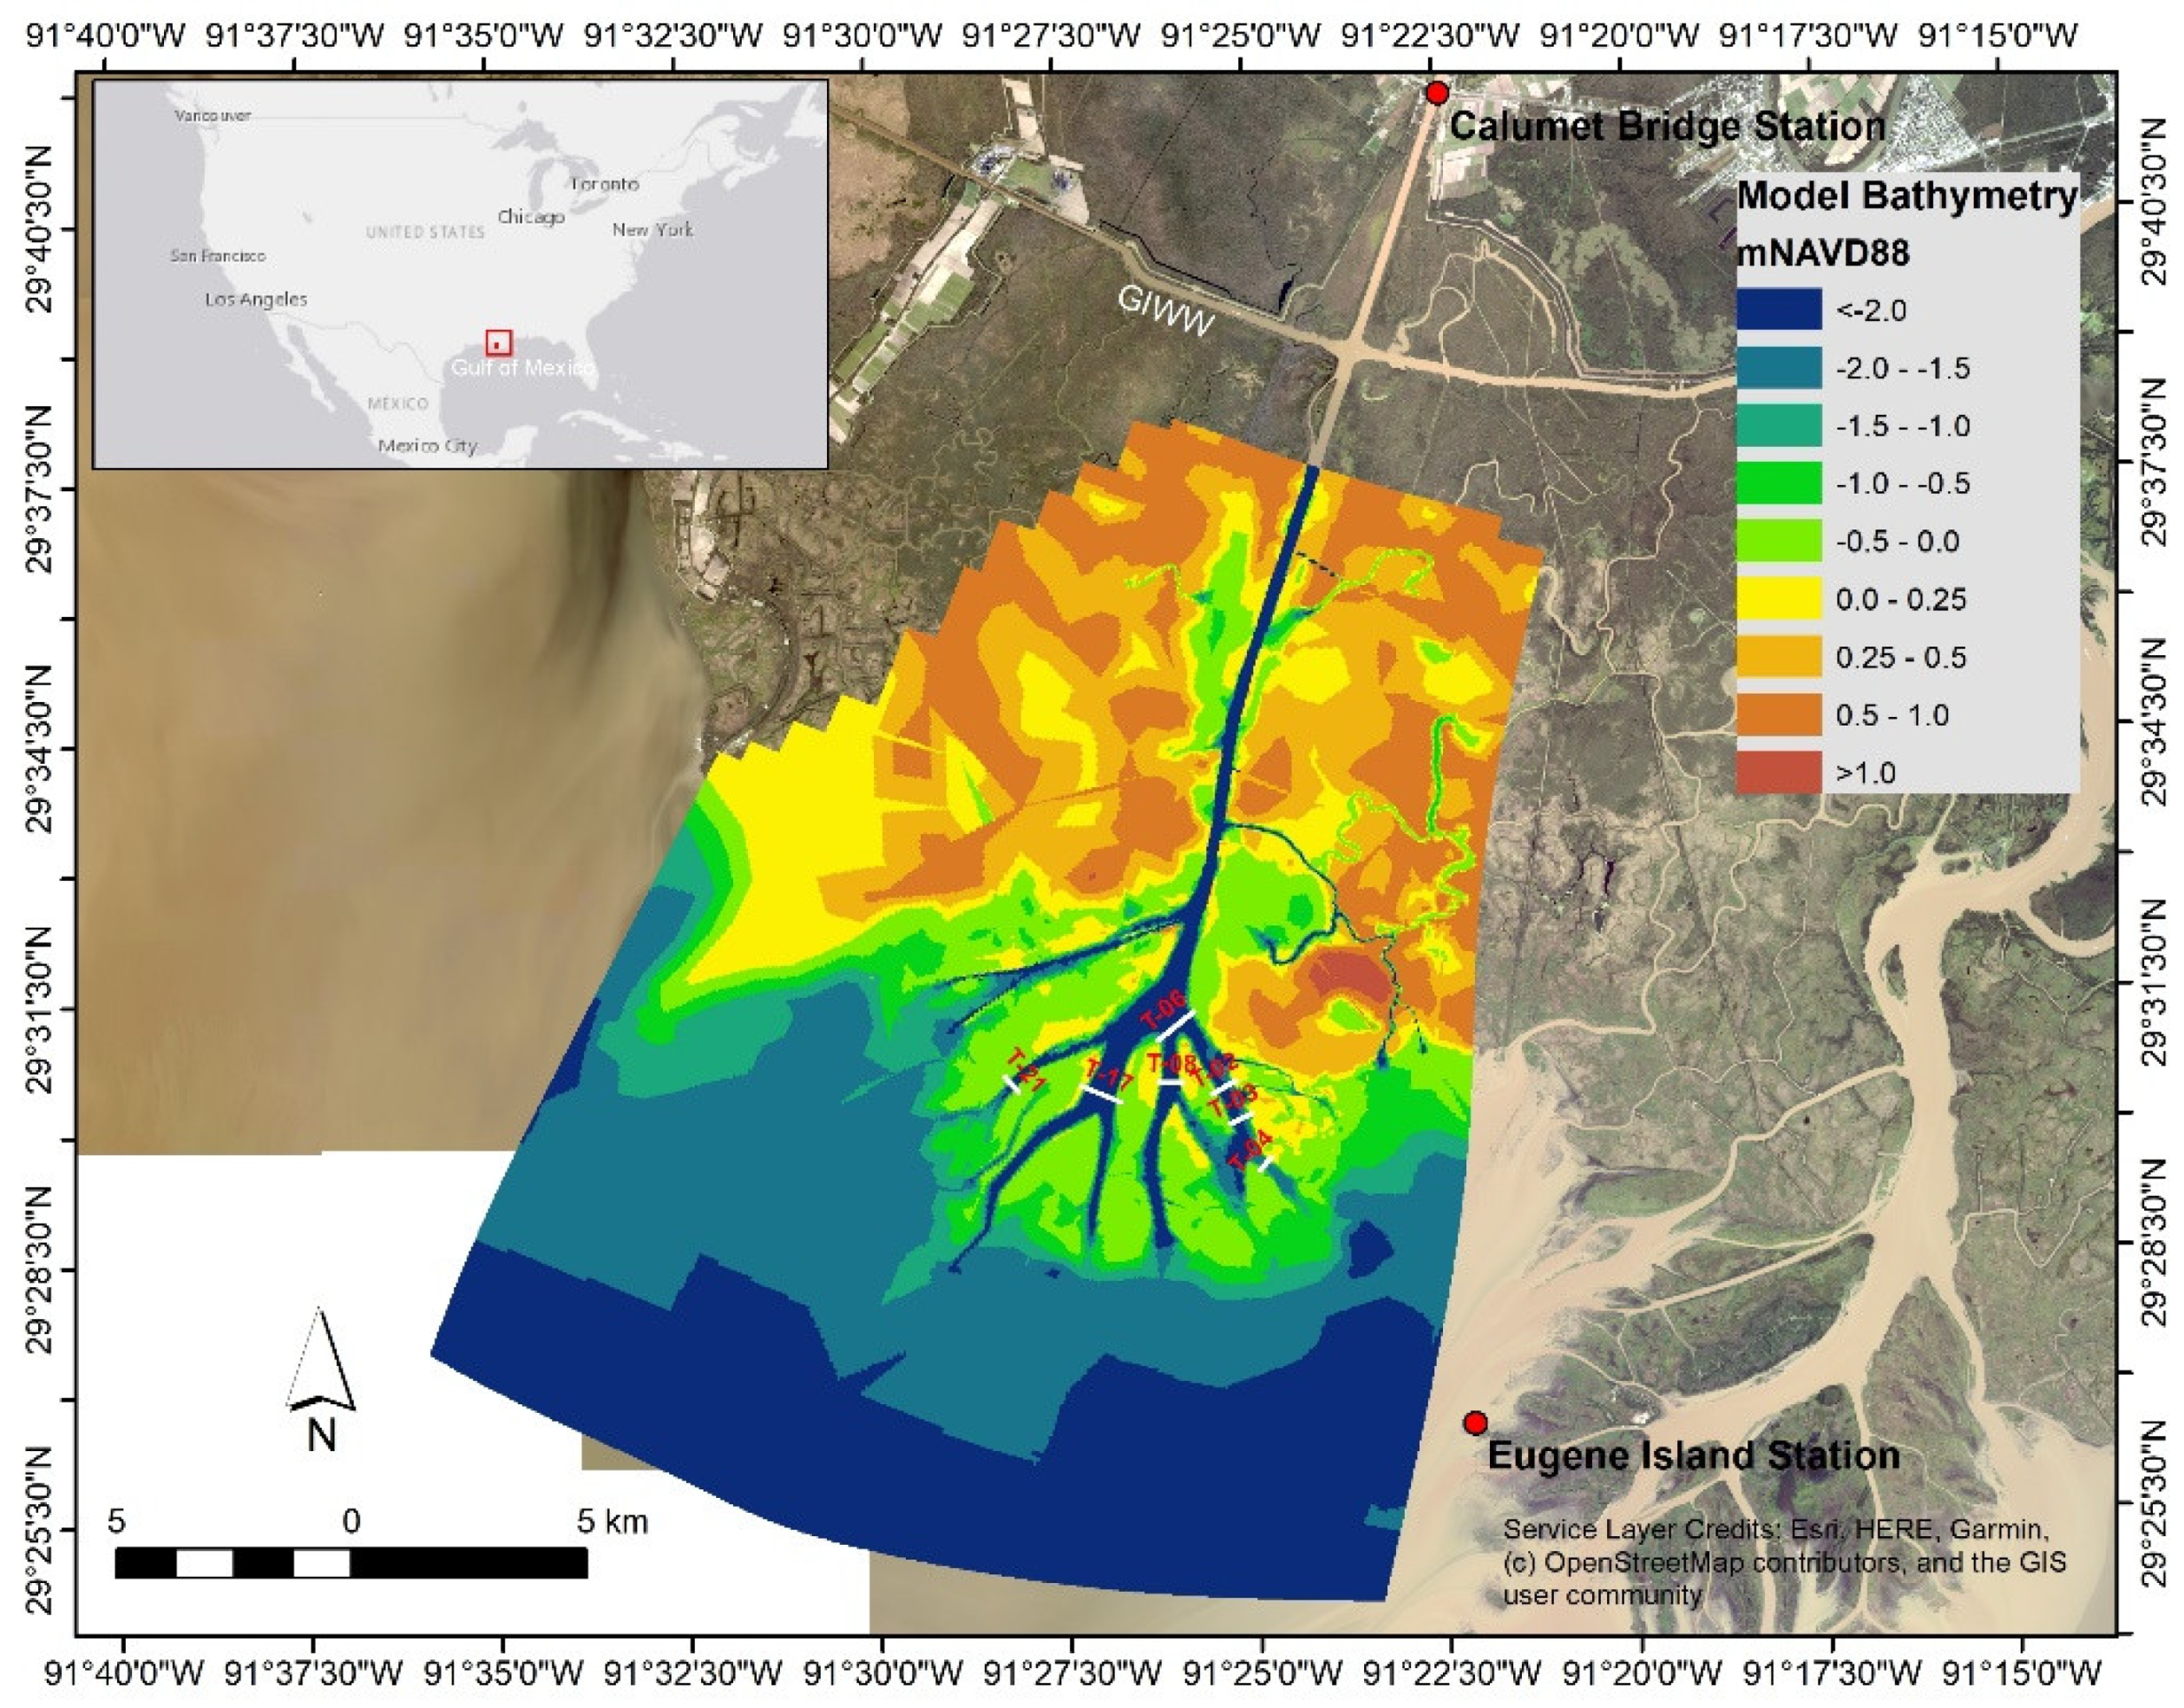
Wax Lake Delta (WLD) is located approximately 32 km southwest of Morgan City, LA, USA, at the downstream end of the Wax Lake Outlet (WLO) (Figure 1). The WLO, a man-made waterway with a design discharge capacity of 12,000 m3/s, was constructed by the US Army Corps of Engineers in 1941 primarily to reduce the flood stages at Morgan City by diverting Atchafalaya River flow to the Gulf of Mexico. As a result of this water diversion, fluvial sediment started depositing in the shallow Atchafalaya Bay (~2 m deep) [28] and formed the initial sub-aqueous foundation of the delta. As sediment deposition continued over time, the delta began to prograde, and it became sub-aerial following the large flood of 1973 (peak flow of 20,000 m3/s measured at Simmersport, LA, USA), which brought significant amounts of sand from upstream sources and caused channel bed erosion [29]. Since then, the delta has been growing actively and prograding towards the Gulf of Mexico. Recent studies reveal that WLD has been gaining land at an approximate rate of 1–3 km2/year during the past three decades [30,31]. The delta is characterized by a network of bifurcating channels that elongate as the delta grows seaward; the primary channels grew at rates of 60–80 m/year, and the remaining channels grew at 116 m/year based on time series analysis of 33 aerial images between 1974 and 2016 [30].
The WLO receives 40–50% of the Atchafalaya River flow. Water and sediment discharge vary seasonally with high discharge usually occurring between January and June [29]. Based on the record from 1986 to 2014 at the USGS gauging station on the WLO at Calumet Bridge, the annual average flow is 2520 m3/s. The minimum monthly flow typically occurs during the month of September and is about 1270 m3/s, and the peak monthly flow occurs during the month of April and is approximately 3640 m3/s. During the high-flow season, the average velocities in the channel network are in the range of 2 to 2.5 m/s, whereas suspended sediment concentrations are 20 times higher than those during the low-flow season [32]. Under normal conditions, tides and wind-driven waves in the Atchafalaya Bay are typically mild. Tides are mixed diurnal with an average amplitude of approximately 30 cm [32]. The significant wave height rarely exceeds 0.5 m [2,8].
3. Methods
3.1. Numerical Model
Delft3D, a numerical modeling suite developed by Deltares [33], was used to set up the process-based hydrodynamic and sediment transport model of WLD. Delft3D consists of several dynamically coupled modules. The flow module simulates the hydrodynamics on a rectangular or curvilinear finite difference grid by solving the unsteady shallow water equations derived from the Navier Stokes equations for incompressible free surface flow in 2D or 3D [34]. Sediment transport and the resulting morphological changes are calculated in each time step after the hydrodynamic calculation is completed, such that changes to the topography and bathymetry within the computational grid are available to calculate hydrodynamics in the next time step; that is, the hydrodynamic and sediment transport and morphology calculations are internally coupled.
The morphology module computes sediment transport differently for coarse (≥64 µm) and fine (<64 µm) sediment fractions, both of which are considered here. For coarse sediments, the van Rijn [35,36,37] method, which computes both suspended and bed load transport, is used. This method has been developed for and applied to both riverine and coastal environments [11,35,36,37,38]. Fine sediments are transported as suspended load; the erosion and deposition of fine sediment are based on the Partheniades–Krone formulation, according to which the sediment flux to and from the bed are dependent on the ratios of bed shear stress to user-defined critical shear stress values for erosion (Tcr,e) and deposition (Tcr,d) [39]. If the bed shear stress is larger than the critical shear stress for deposition, no sedimentation will occur. For further details on the model dynamics, the interested reader is referred to [33].
3.2. Model Setup
The model domain encompasses the upstream WLO channel beginning slightly downstream of the Gulf Intracoastal Waterway (GIWW) intersection, the entire Wax Lake Delta complex, upstream floodplains on each side of the main channel, and a portion of the Gulf of Mexico (Figure 1). The computational mesh has a resolution ranging from 25 × 25 m to 100 × 100 m, with higher resolution over the subaerial portion of the delta. The three-dimensional (3D) model consists of ten sigma-layers in the vertical direction with size decreasing from 25% at the top to 1% at the channel bottom to adequately capture the velocity gradient represented in the logarithmic vertical profile. The 3D model was used to investigate the flow and sediment partitioning, and the sediment capture efficiency in the distributary channels. For the 3D model simulations, a steady state setup was used. The field observations available for the model calibration and validation were gathered for a specific flow condition; one high-flow and one low-flow condition. Hence, the steady state setup was adequate and consistent with the available field observations.
For computational efficiency, the morphology model was operated in 2D depth-averaged mode and with coarser grid resolution. The 2D morphodynamic simulations were performed in an unsteady mode, where a flow hydrograph was used at the Calumet Bridge representing a 15-year record. The corresponding sediment load was calculated using a rating curve.
The bathymetry assembled by the U.S. Army Corps of Engineers for the Lower Atchafalaya system was used in this study [40]. The initial bathymetry of the model was primarily derived from the 1998 USACE Lower Atchafalaya hydrographic survey combined with Light Detection and Ranging (LiDAR) survey of the overbank areas. The bed level is referenced with respect to the North American Vertical Datum 1988 (NAVD88). The hydrodynamic and sediment transport model is driven by two boundaries: (1) the upstream inflow boundary for water discharge and sediment concentration, and (2) the open water tides (Figure 1). The field observations used in this study were obtained from [41,42,43]. For the steady-state setup, the upstream discharge and corresponding sediment load were used for the dates corresponding with the collection of the field observations. For the unsteady simulations, the full 15-year hydrograph record and corresponding rating curves were used for the water and sediment inflows, respectively. For the tidal records and due to limitations in the availability of data, the Eugene Island station was used to represent the open water conditions. It should be emphasized that this system is river-dominated (due to the small tidal amplitude), and hence this approximation does not influence the overall system dynamics, especially for the long-term morphological simulations.
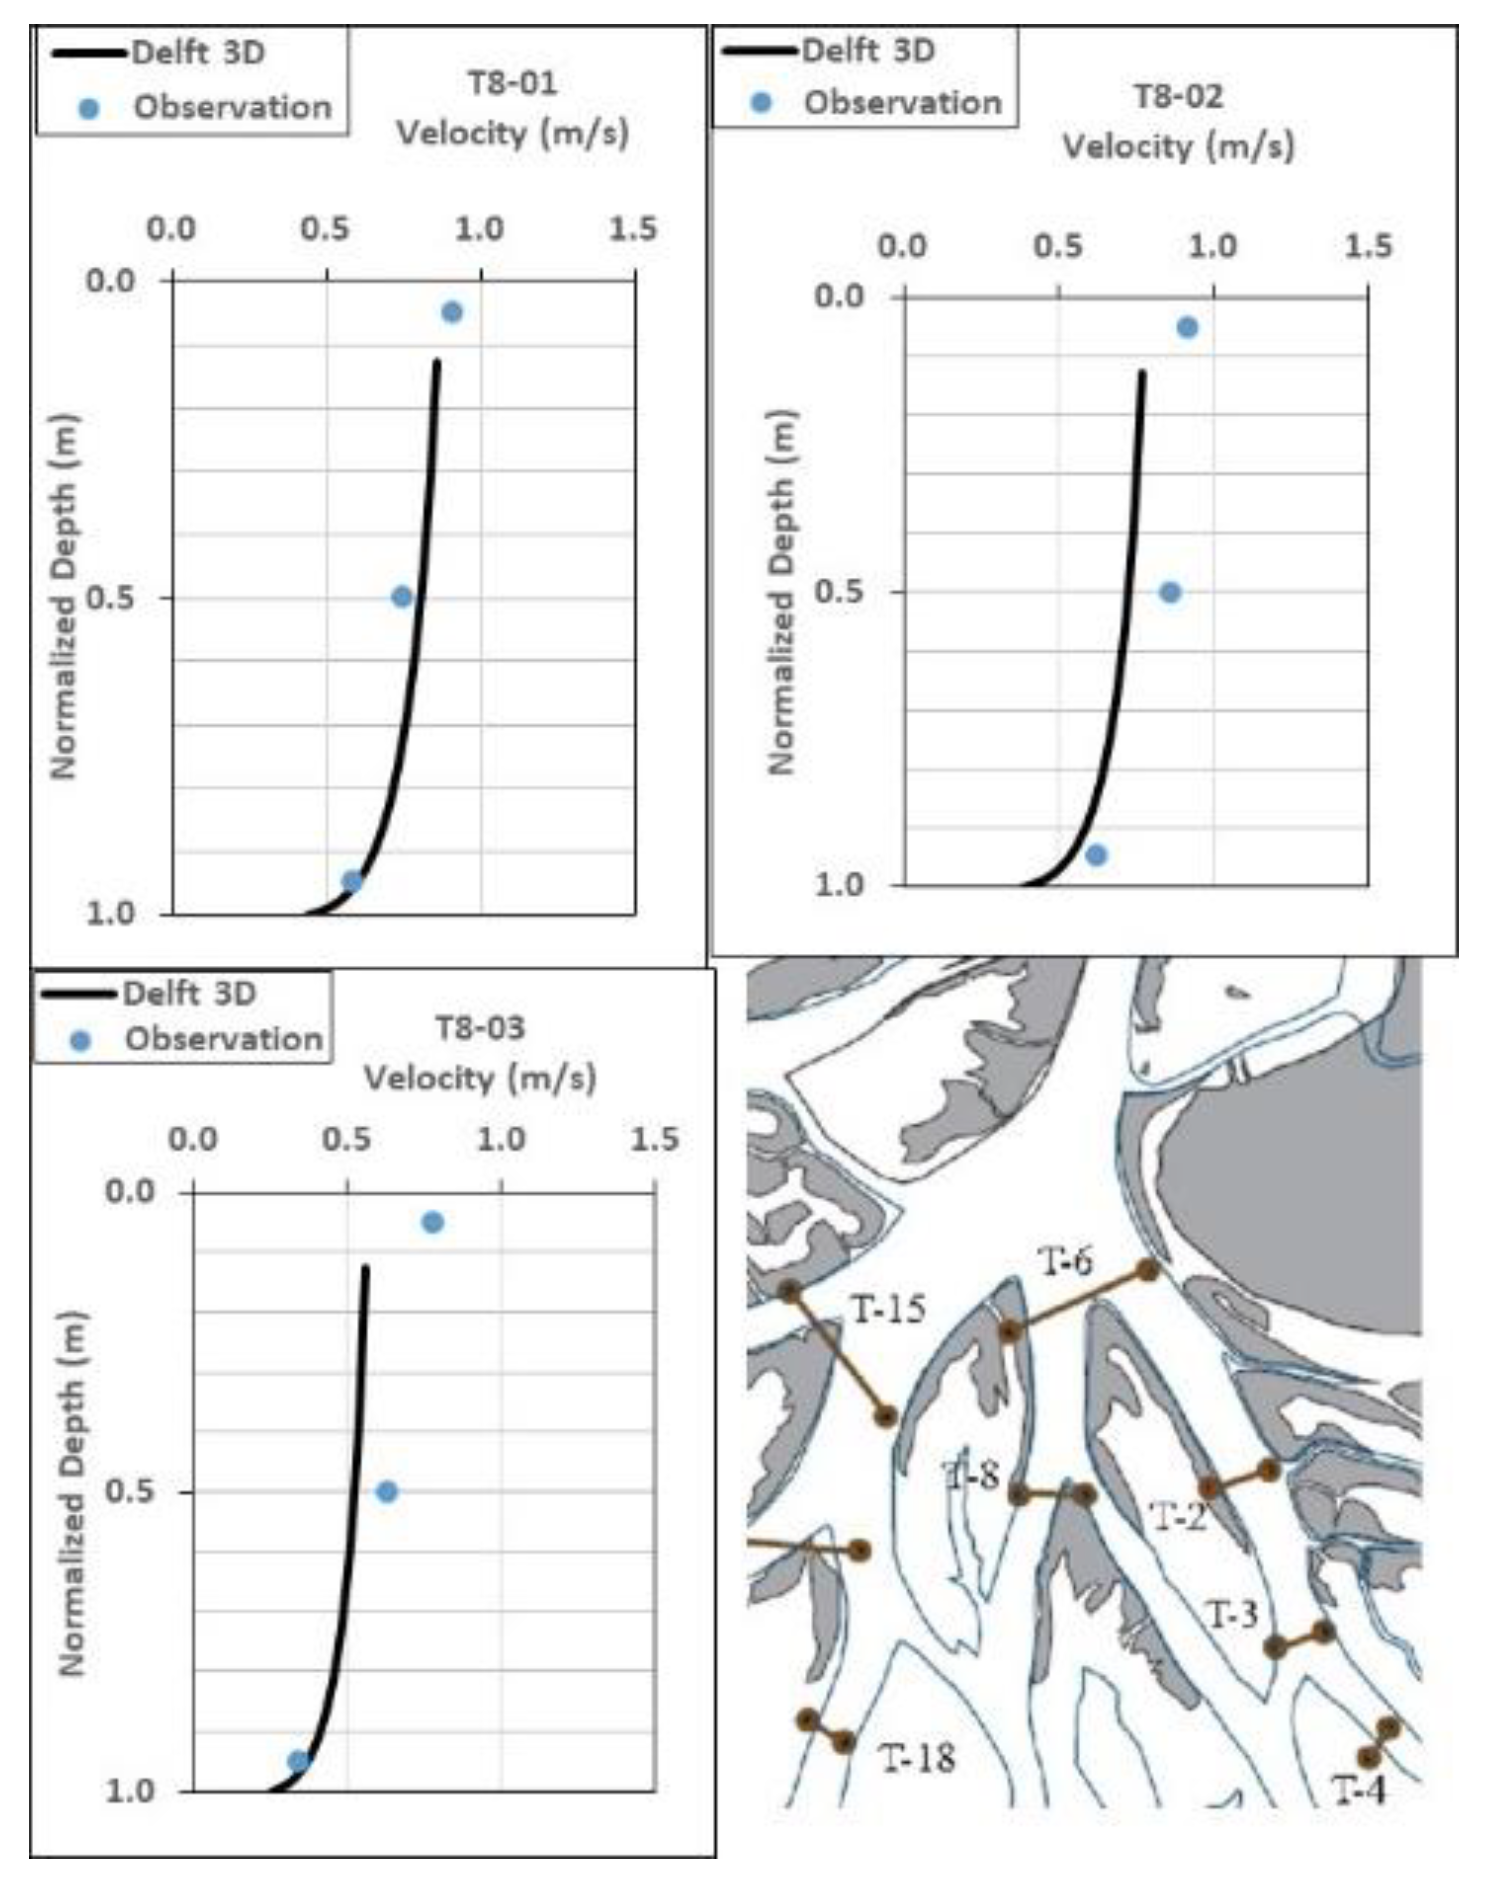
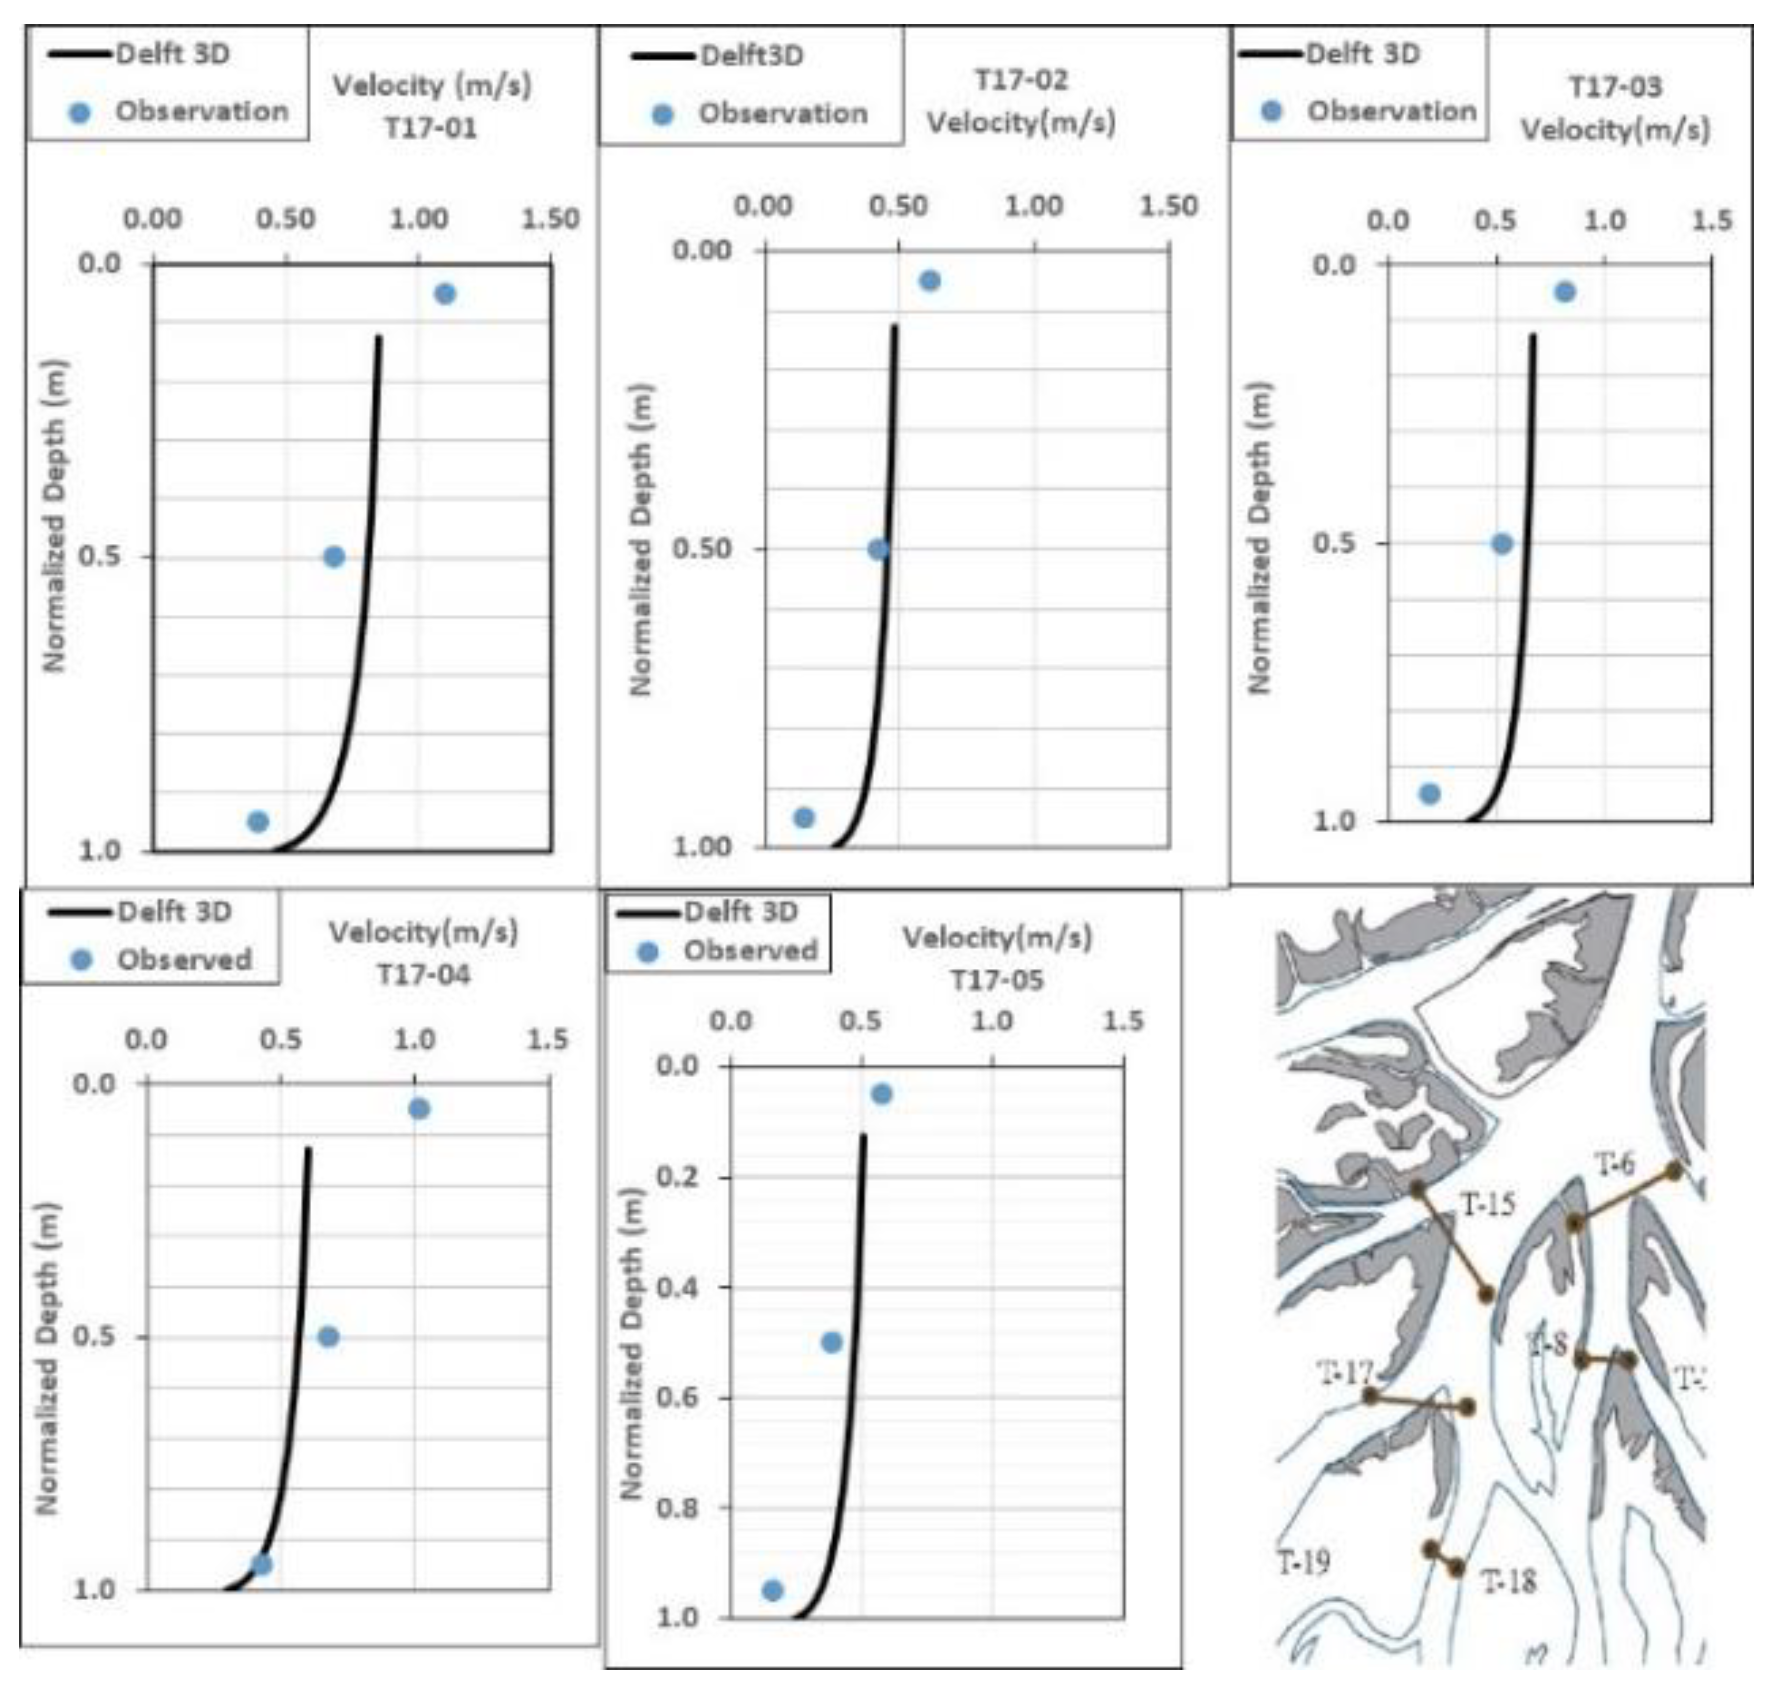
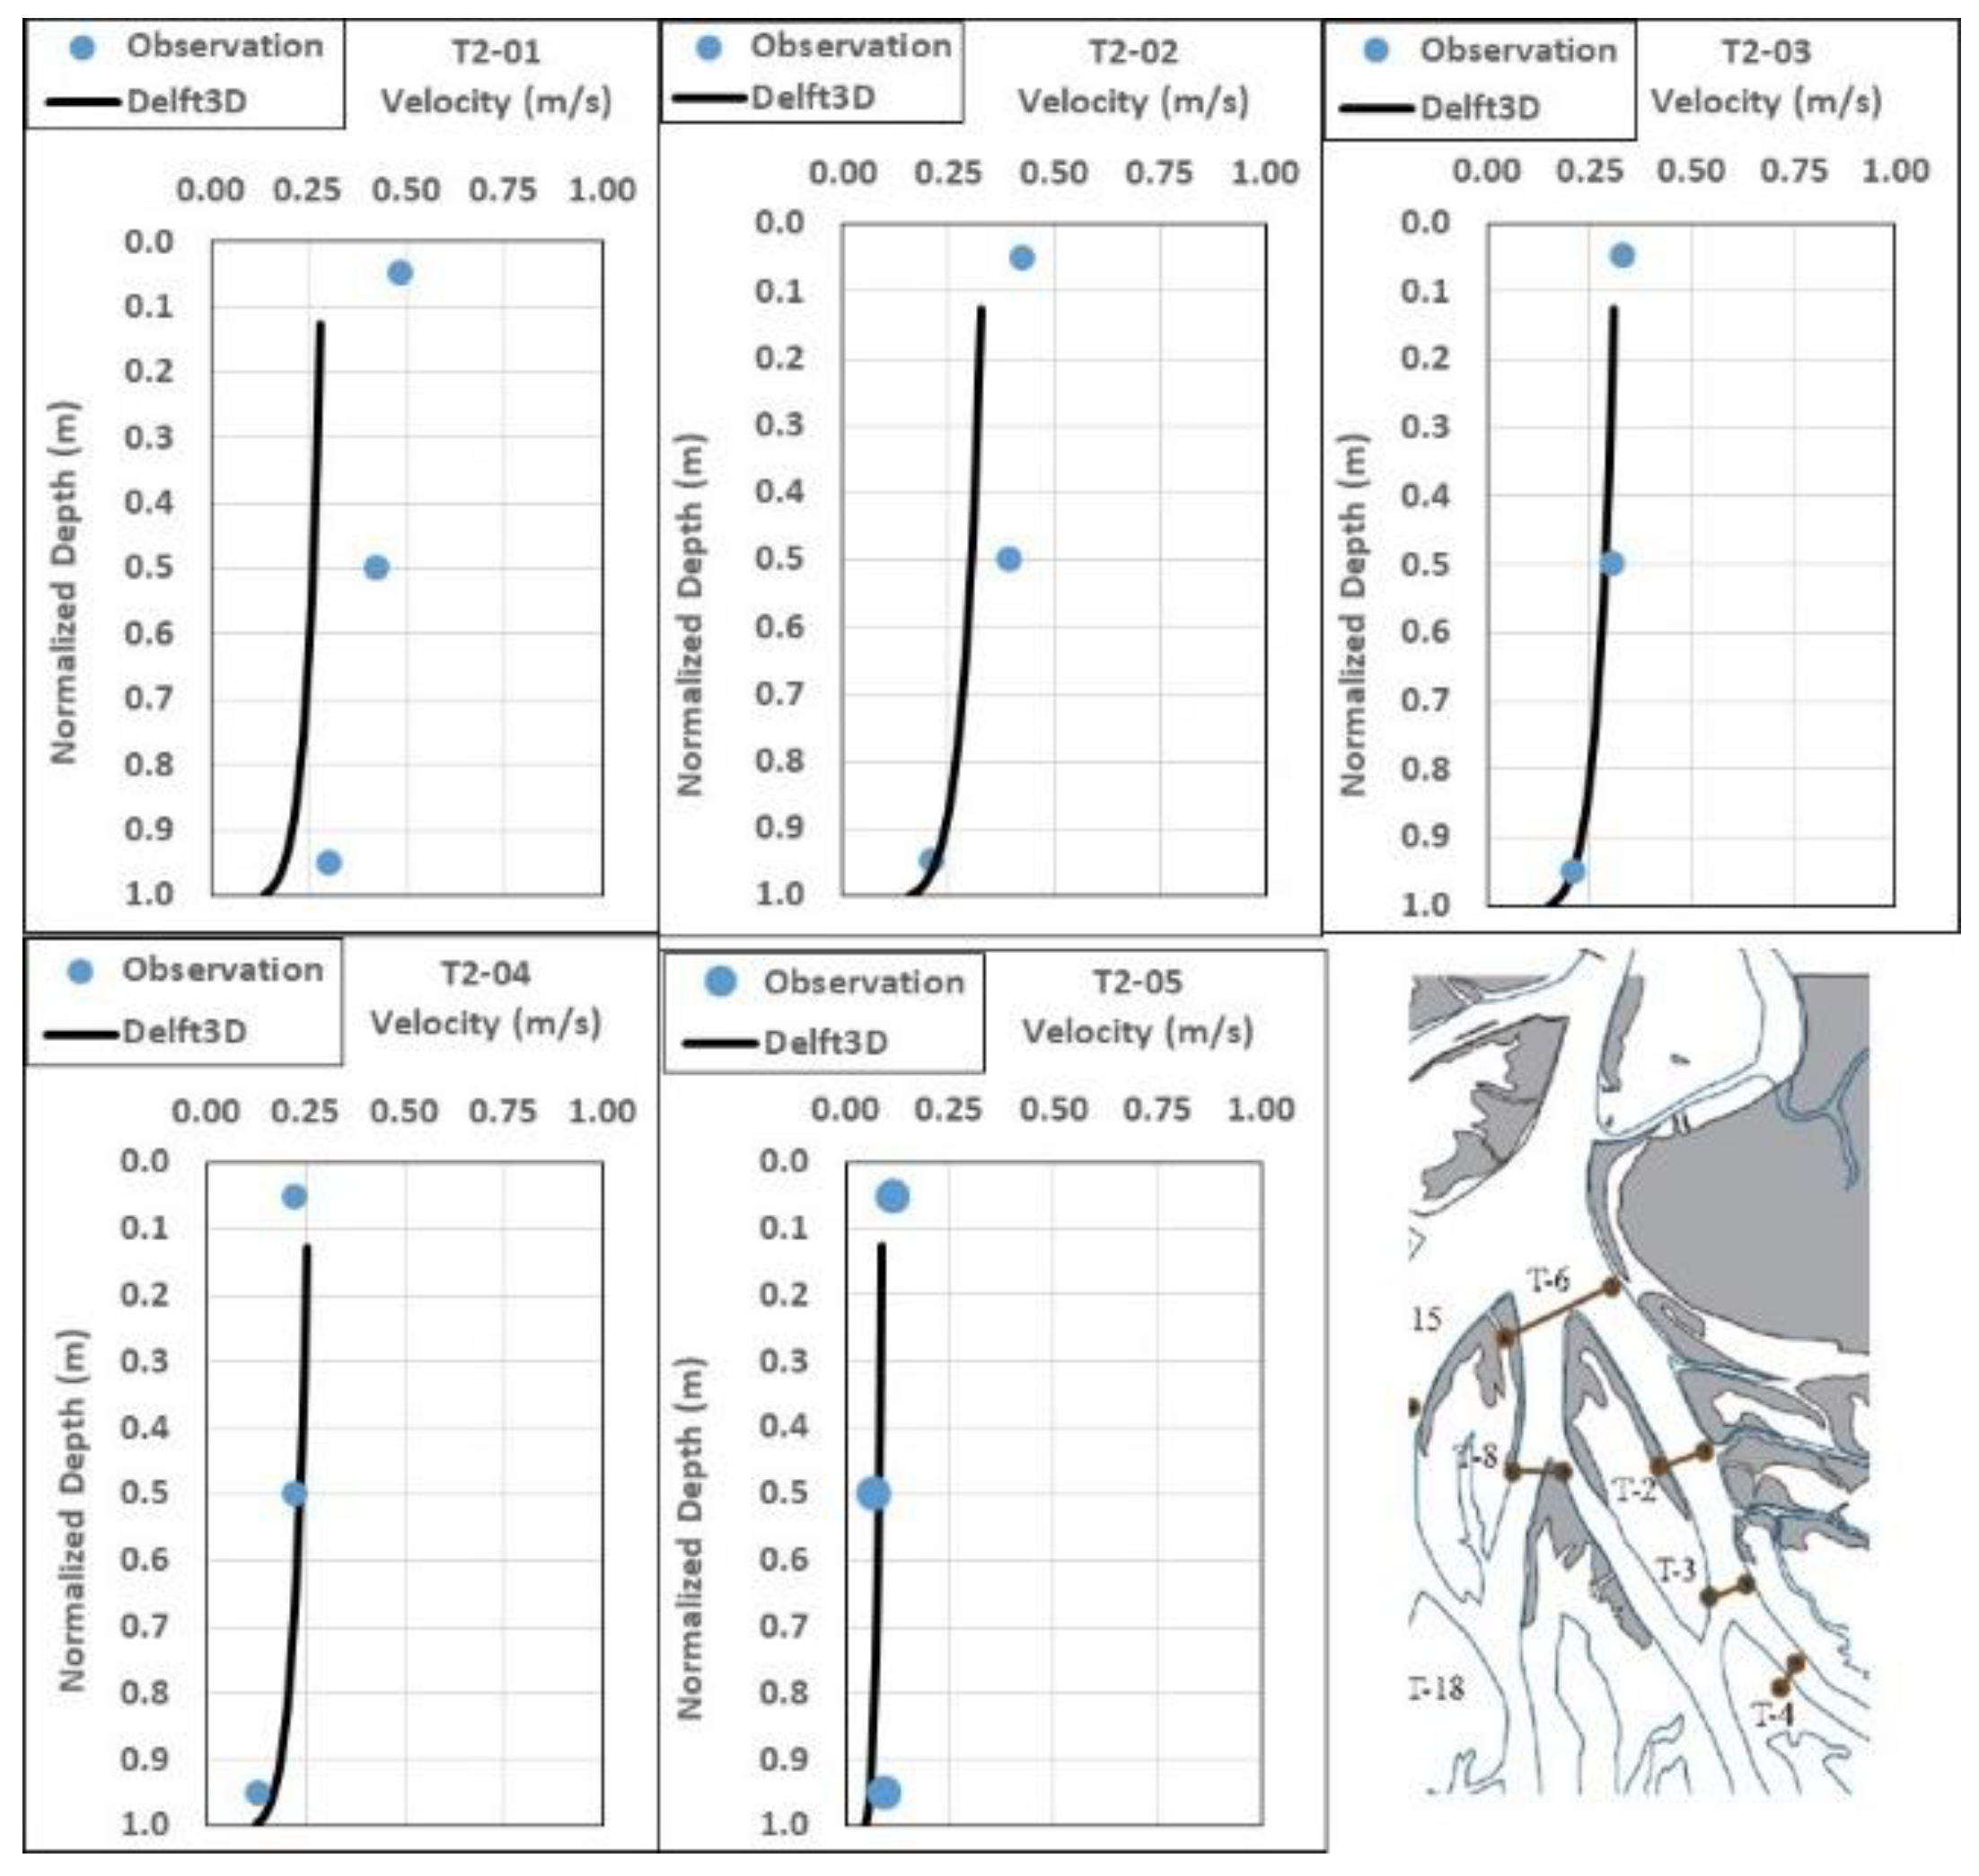
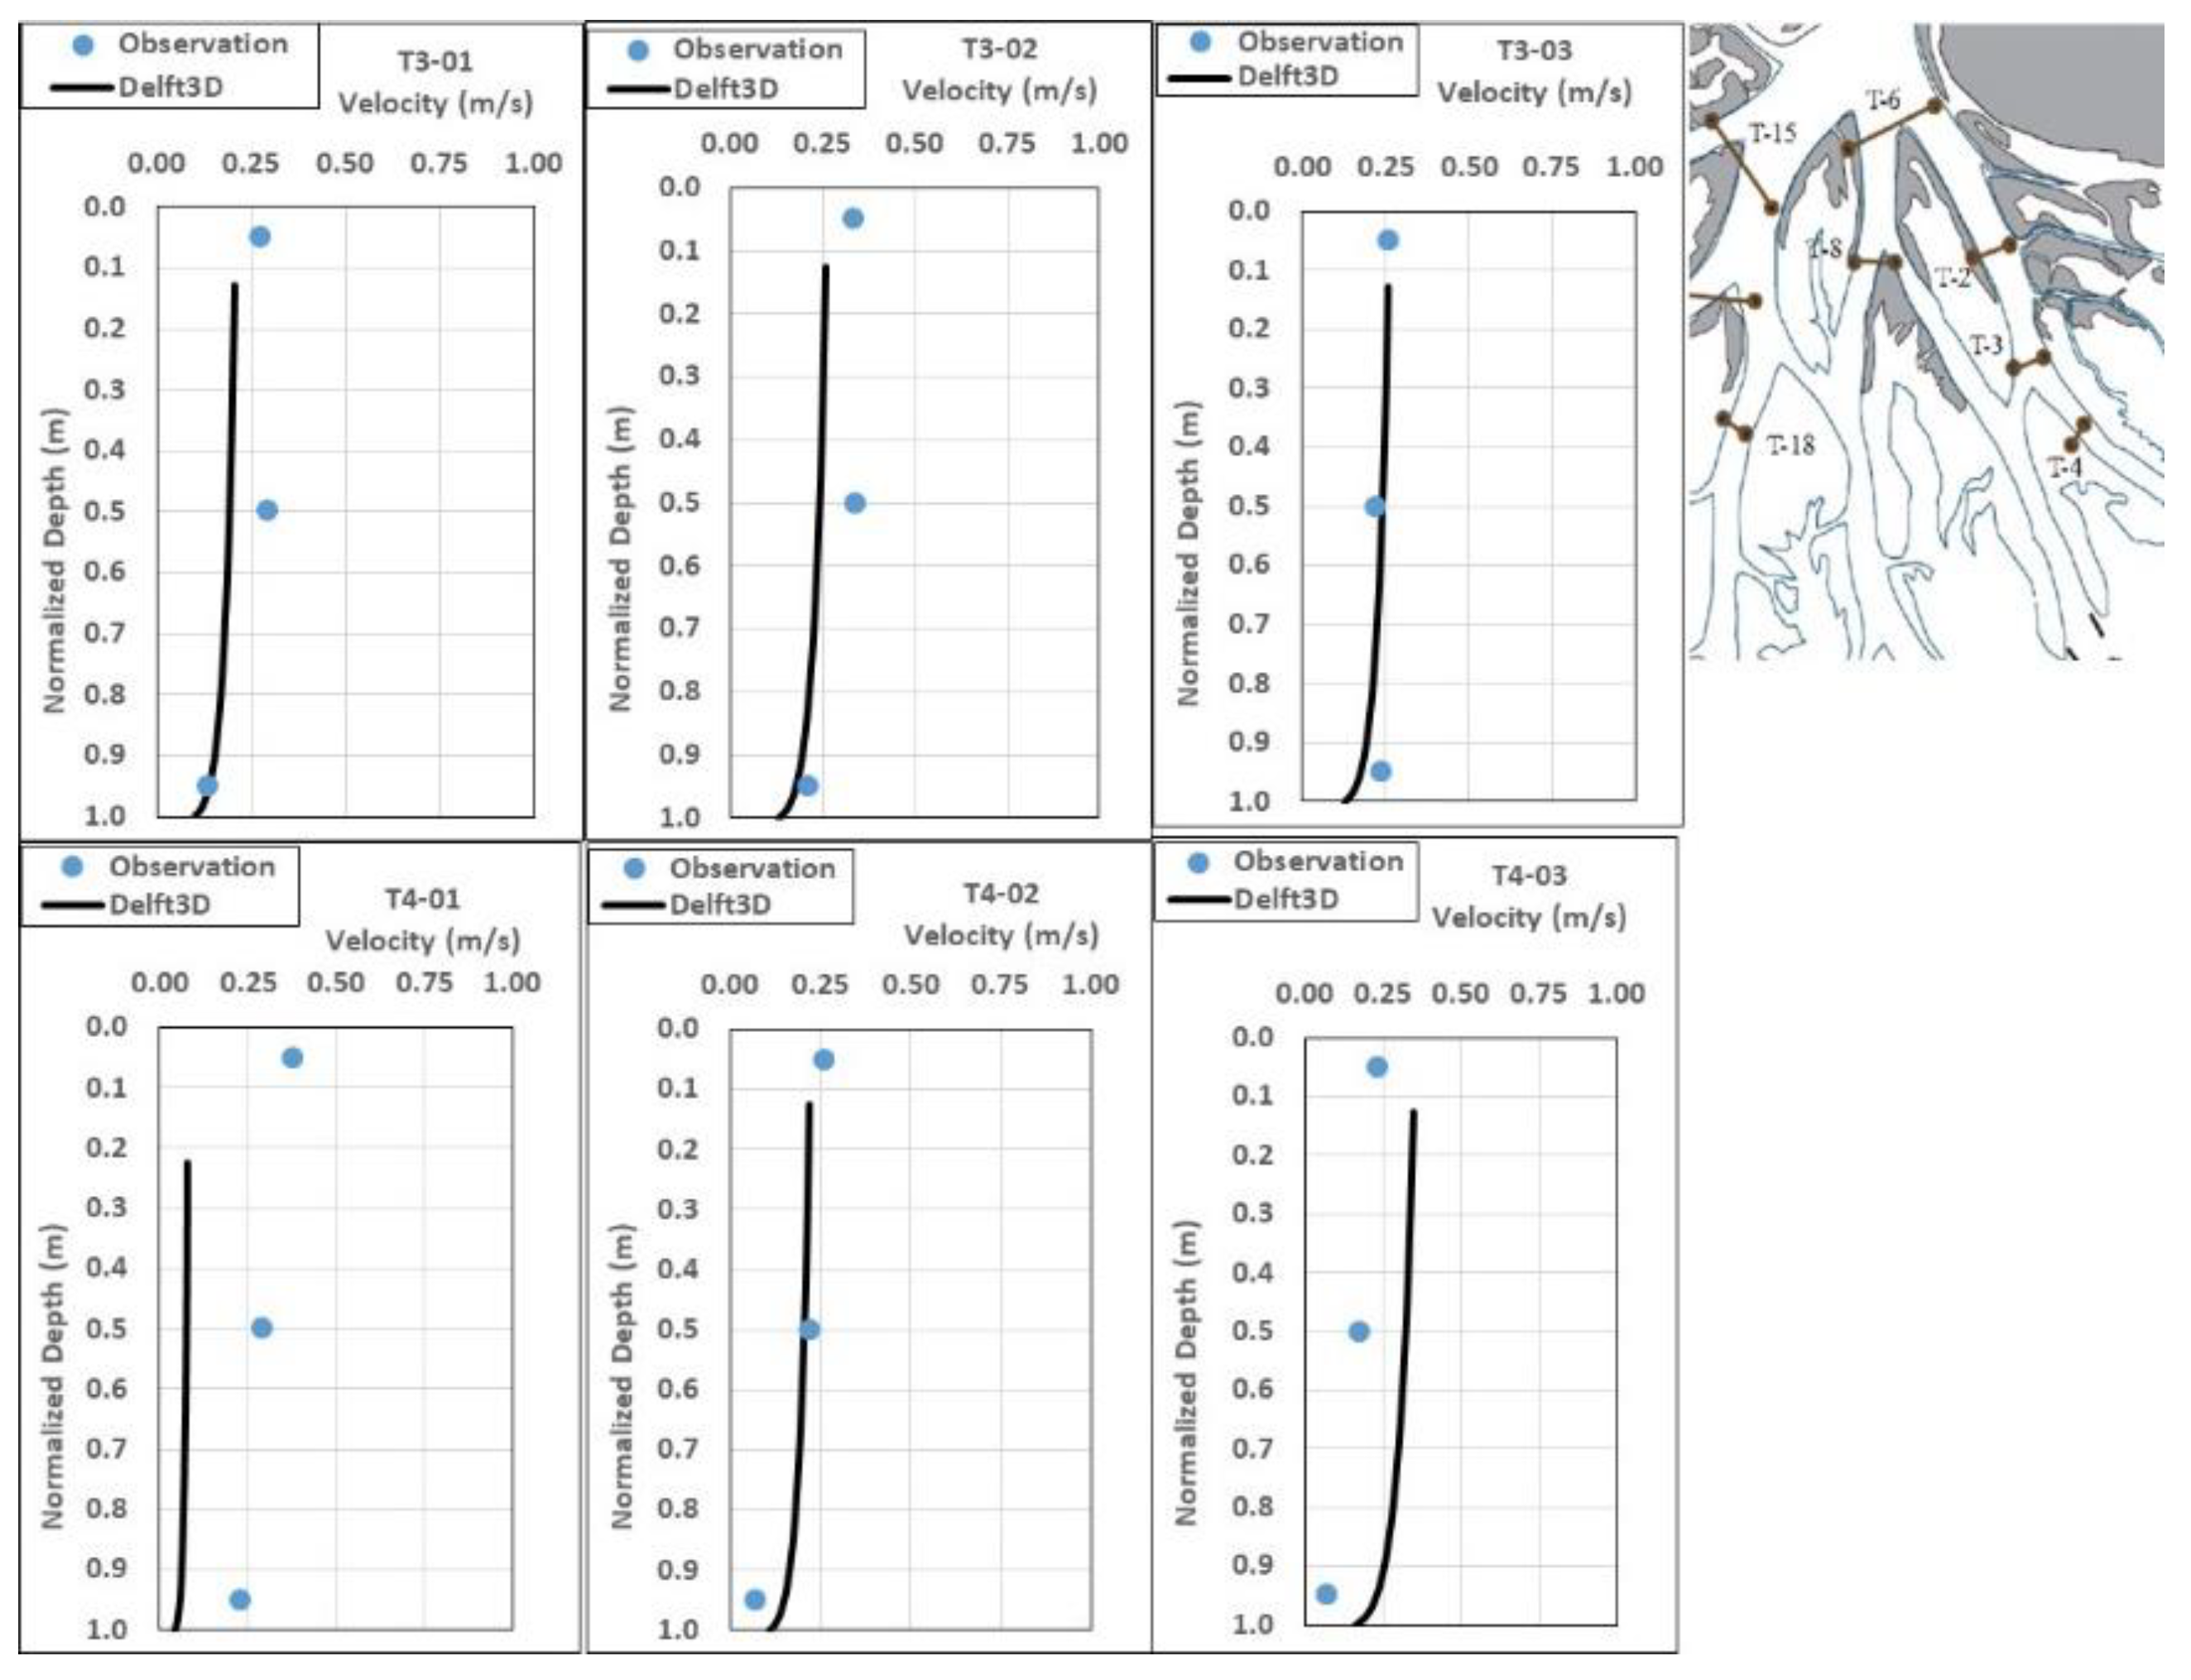
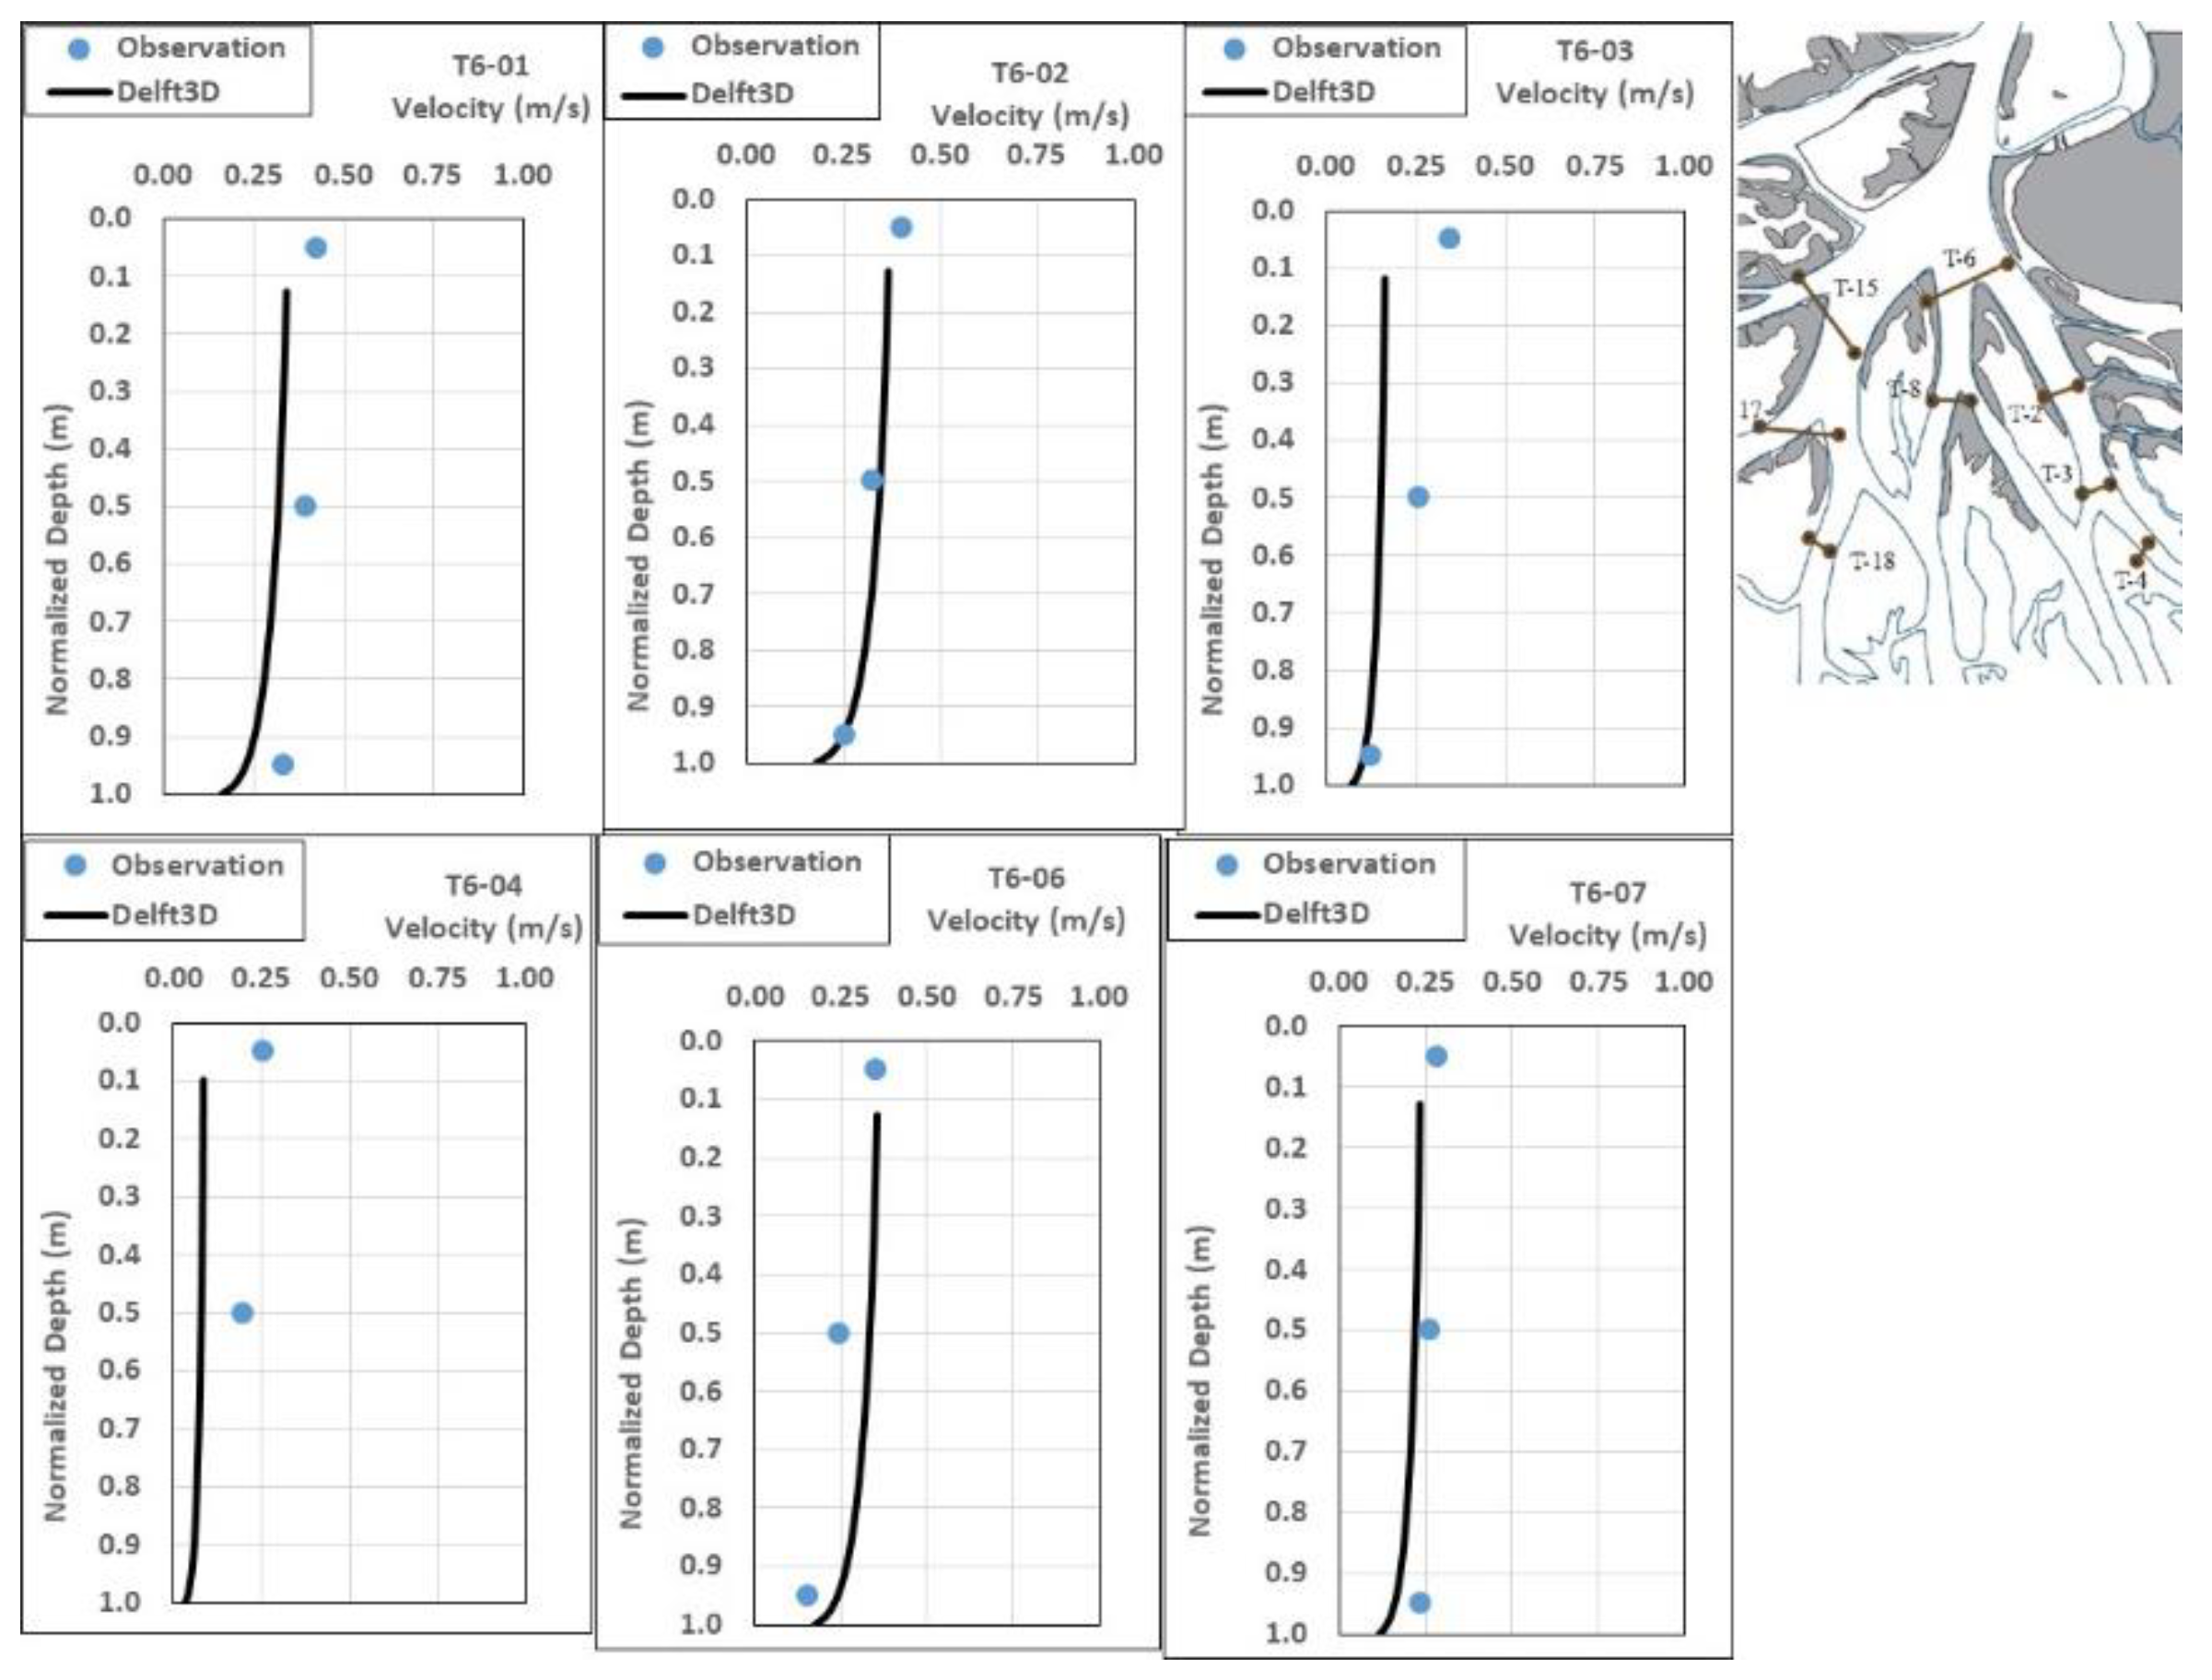
Velocity and total suspended sediment measurements made in the WLD channels during 2000–2001 formed the basis for the calibration and validation of the hydrodynamic and sediment transport components of the model (Figure 1) [32]. Each measured transect contains several sample points, and at each point, measurements of velocity and total suspended sediment concentrations were taken at 0.05, 0.5, and 0.95 of the total depth [8,32]. The morphodynamic component was calibrated against the delta growth rate estimated by recent studies [30,31,44].
The hydrodynamic model calibration was performed using an upstream boundary discharge value of 4012 m3/s, which is the average discharge measured at the Calumet gage during the high flow event (river flood) occurring 25–27 February 2001. It was confirmed that the discharge measured at the Calumet Bridge accurately represents the flow entering the WLD [42]. The open boundary was given a stage value of 0.296 m above NAVD88, the average water level measured at the Atchafalaya Bay near the Eugene Island gage for the same period. For the validation, the upstream discharge was 1150 m3/s and the downstream open boundary stage was 0.17 m (NAVD88), which are average measured values for the period 28–31 May 2000. The Chezy roughness value was the main parameter used in the hydrodynamic calibration–validation process. Roughness values of 90 and 40 m1/2/s for channels and overbank, respectively, were found to give a reasonable agreement. The model was then validated against the velocity measurements made during the low flow event occurring on 28–31 May 2000.
Three sediment fractions were used in this model to represent both the suspended and bed sediment load. The first fraction is fine sand (D50 = 100 μm) representing the coarse sediment, and the remaining two fractions are silt (30 μm) and clay (1.25 μm) representing fine sediment. USGS field observation at the WLO, Calumet, reveals that the suspended sediment consists primarily of fine sediment (silt and clay particles, D50 < 64 μm). The upstream boundary for sediment transport, during the calibration period, was 58 mg/L for sand, 225 mg/L for silt, and 163 mg/L for clay. Breakdown of silt (58%) and clay (42%) in total suspended fine sediment was based on the fine sediment distribution rating curve developed using historical observed sediment load and flow data [45]. For the model validation, because there was no USGS suspended sediment measurement available at the Calumet Station to define the upstream boundary for the validation period, sediment rating curves were developed for both the total fine and sand suspended sediment using the historical flow and sediment data (1998–2014) measured at this station. The equations (Equations (1) and (2)) of the rating curves developed are:
where a = 9.7972 × 10⁻⁴; b = −1.8863; c = 9.1383 × 101 and Q is the upstream flow (m3/s).
where A = 0.2629; B = 1.5013, and Q is the upstream flow (m3/s).
Based on the sediment rating curves, upstream inflow sediment concentration of 0 mg/L for sand, 18 mg/L for silt, and 73 mg/L for clay was applied in conjunction with flow and water level boundary conditions used in hydrodynamic validation. Due to low upstream flow (1150 m3/s), the rating curve dictated a zero-concentration value for suspended sand during the validation period. The sediment transport calibration–validation process focused on multiple parameters: critical shear stresses of erosion (Tcr,e); settling velocities and sediment erosion rates for fine sediment in the Partheniades–Krone formulation; and the grain size diameter (D50), and suspended and bed load multiplication factors in the Van Rijn [35,36,37] coarse sediment formulation. Several sensitivity tests were performed to identify the values of these parameters that resulted in optimal model performance, and the ranges of values tested for sediment properties are presented in Table 1.
The same three sediment fractions were used to define the stratigraphy layers of soil in the morphology model. Sediment vibracores taken at WLD show that sand occupies 67% of the total thickness of the delta deposits [29]. The WLD is a depositional system like other river deltas. However, the channel network shows systematic widening and erosion into bedrock composed of consolidated mud [44]. The initial bed compositions were designed based on this information and consist of two uniformly mixed layers. Marsh areas (above −1.0 m NAVD88) of the islands were considered as “marsh soil” and were parameterized with a critical shear stress for erosion of 1.5 Pa in the model setup. Below −1.0 m NAVD88, the soil was characterized as consolidated clay in the model setup. Based on the degree of compaction, this material was assigned a critical shear stress for erosion of 4 Pa to represent the erosion-resistant consolidated mud. Most of the distributary channels have a bed level below −1.0 m, and so were assigned to consolidated clay down to −10 m NAVD88. Below the consolidated clay layer was the sand layer, with a thickness of 25 m.
The depth-averaged model was calibrated and validated using the same dataset described above. To gain computational speed, a time dilation and Morphological Acceleration Factor (MORFAC) technique was used for long-term morphodynamic simulations [34,46]. Time dilation was achieved by approximating each day as 24 min of simulation and the resulting morphological change in sediment fluxes for each time step was multiplied by a MORFAC value of 60. This value was selected based on previous studies [46,47], in addition to sensitivity tests that were performed using a simplified model with similar grid resolution and flow conditions to confirm that the acceleration factor did not produce significant bias in results. A statistical parameter Brier Skill Score (BSS) was used for assessment of the acceleration factors from 1 to 180 (Figure 2). The BSS between the reference simulation (MORFAC = 1) and a simulation with MORFAC > 1 higher than 0.8 is considered to be excellent to capture the morphological changes in complex engineering model application [48].
4. Results
4.1. Model Calibration and Validation
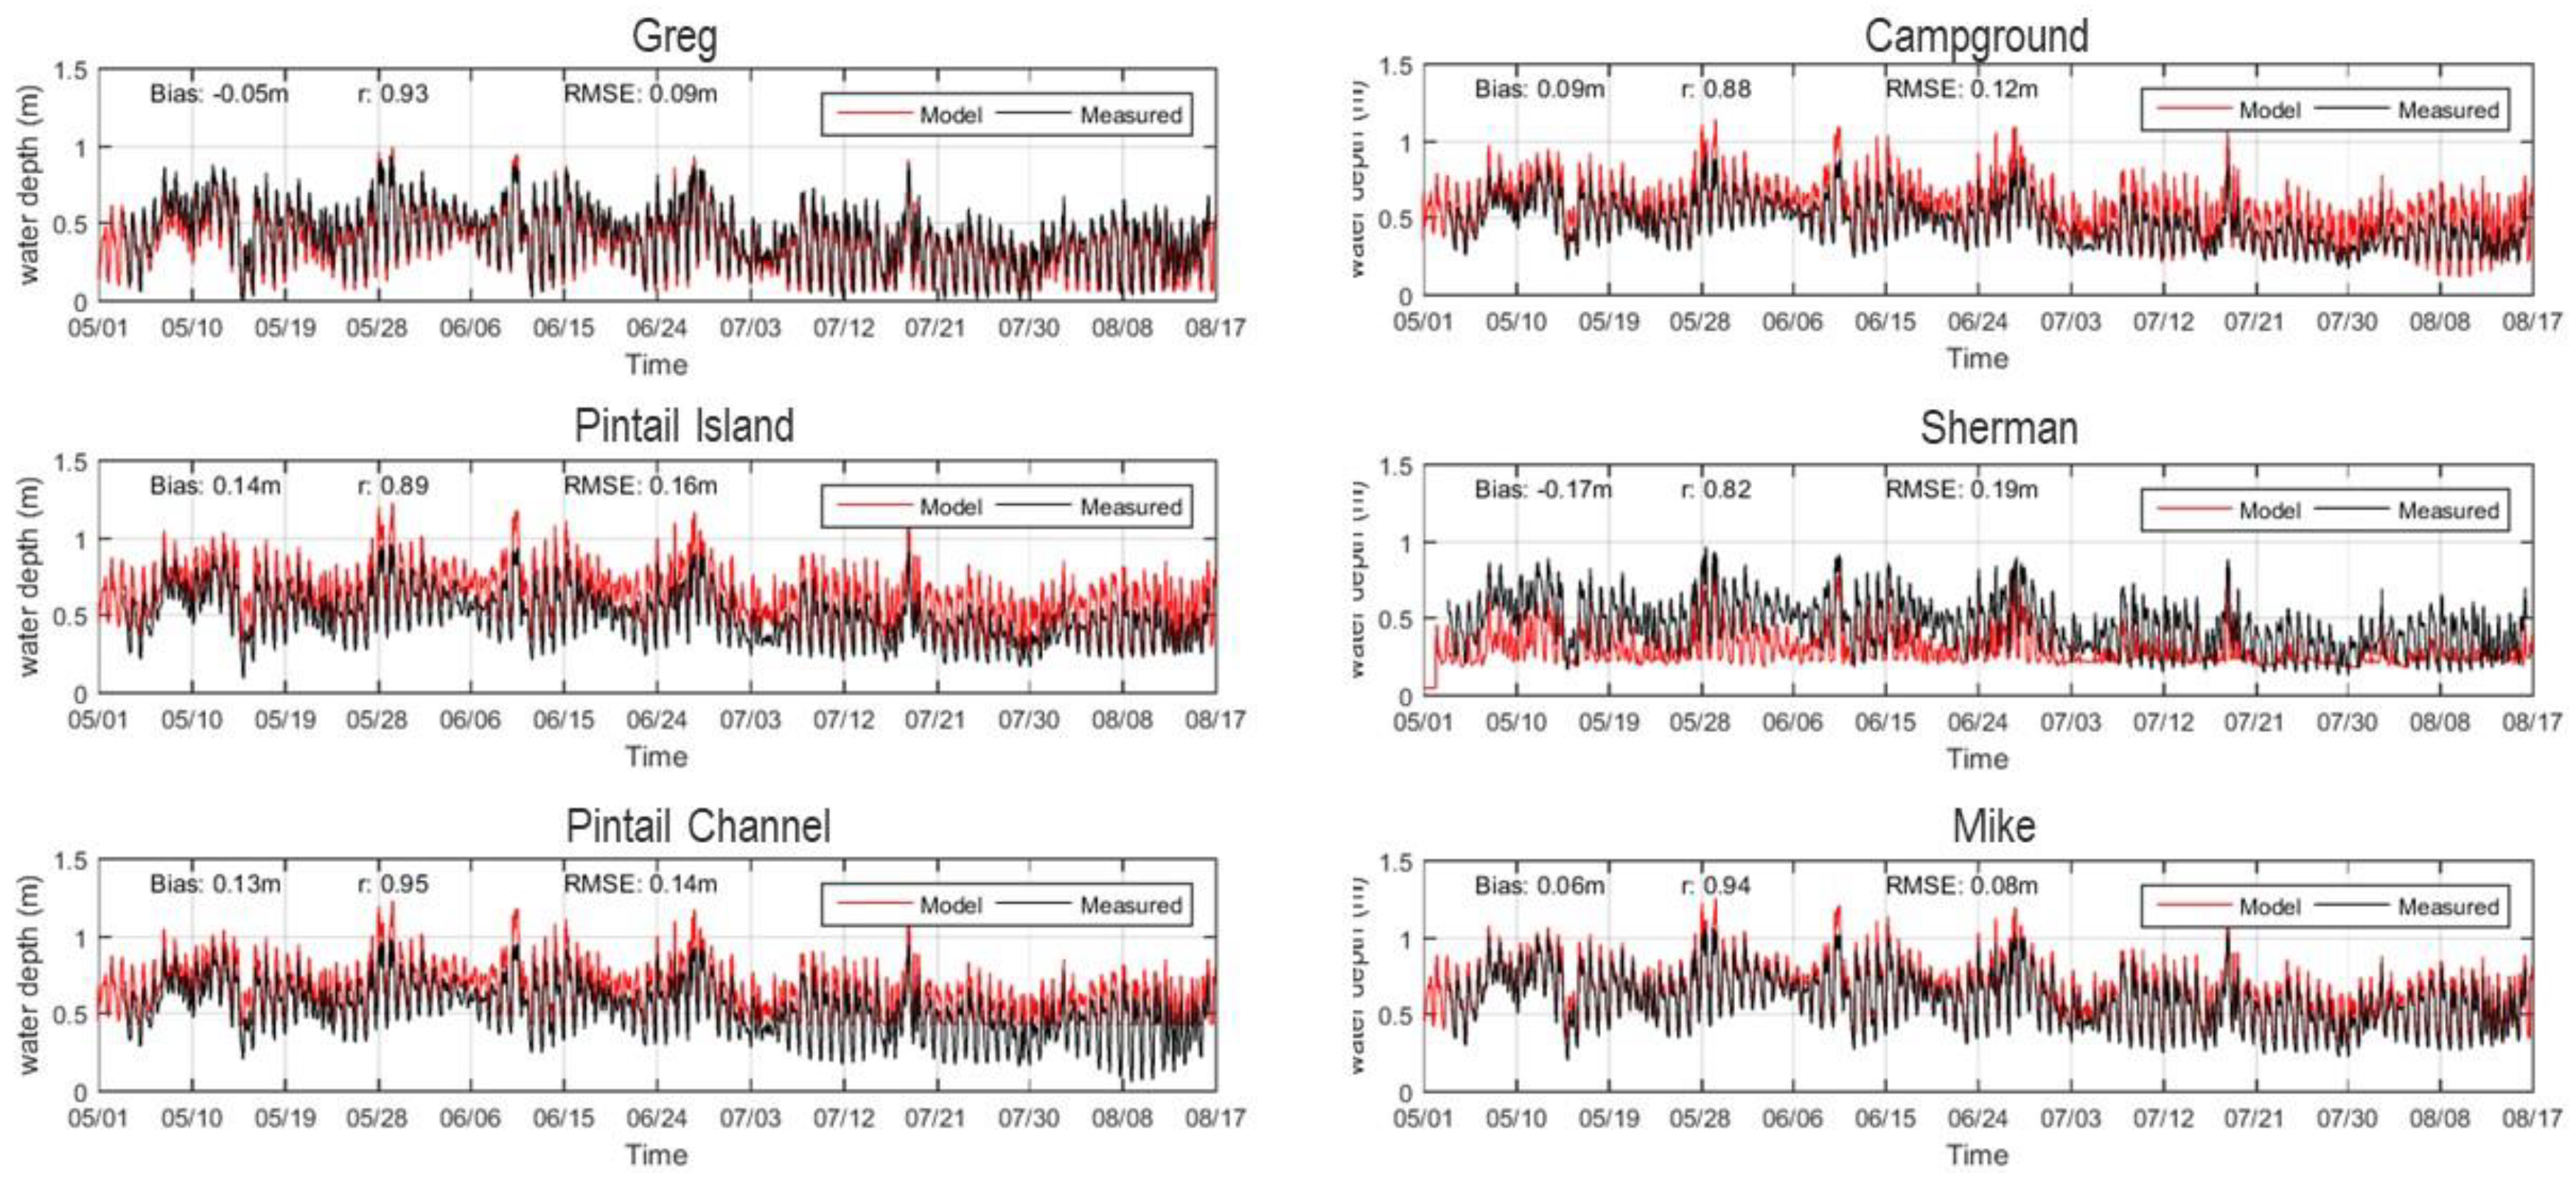
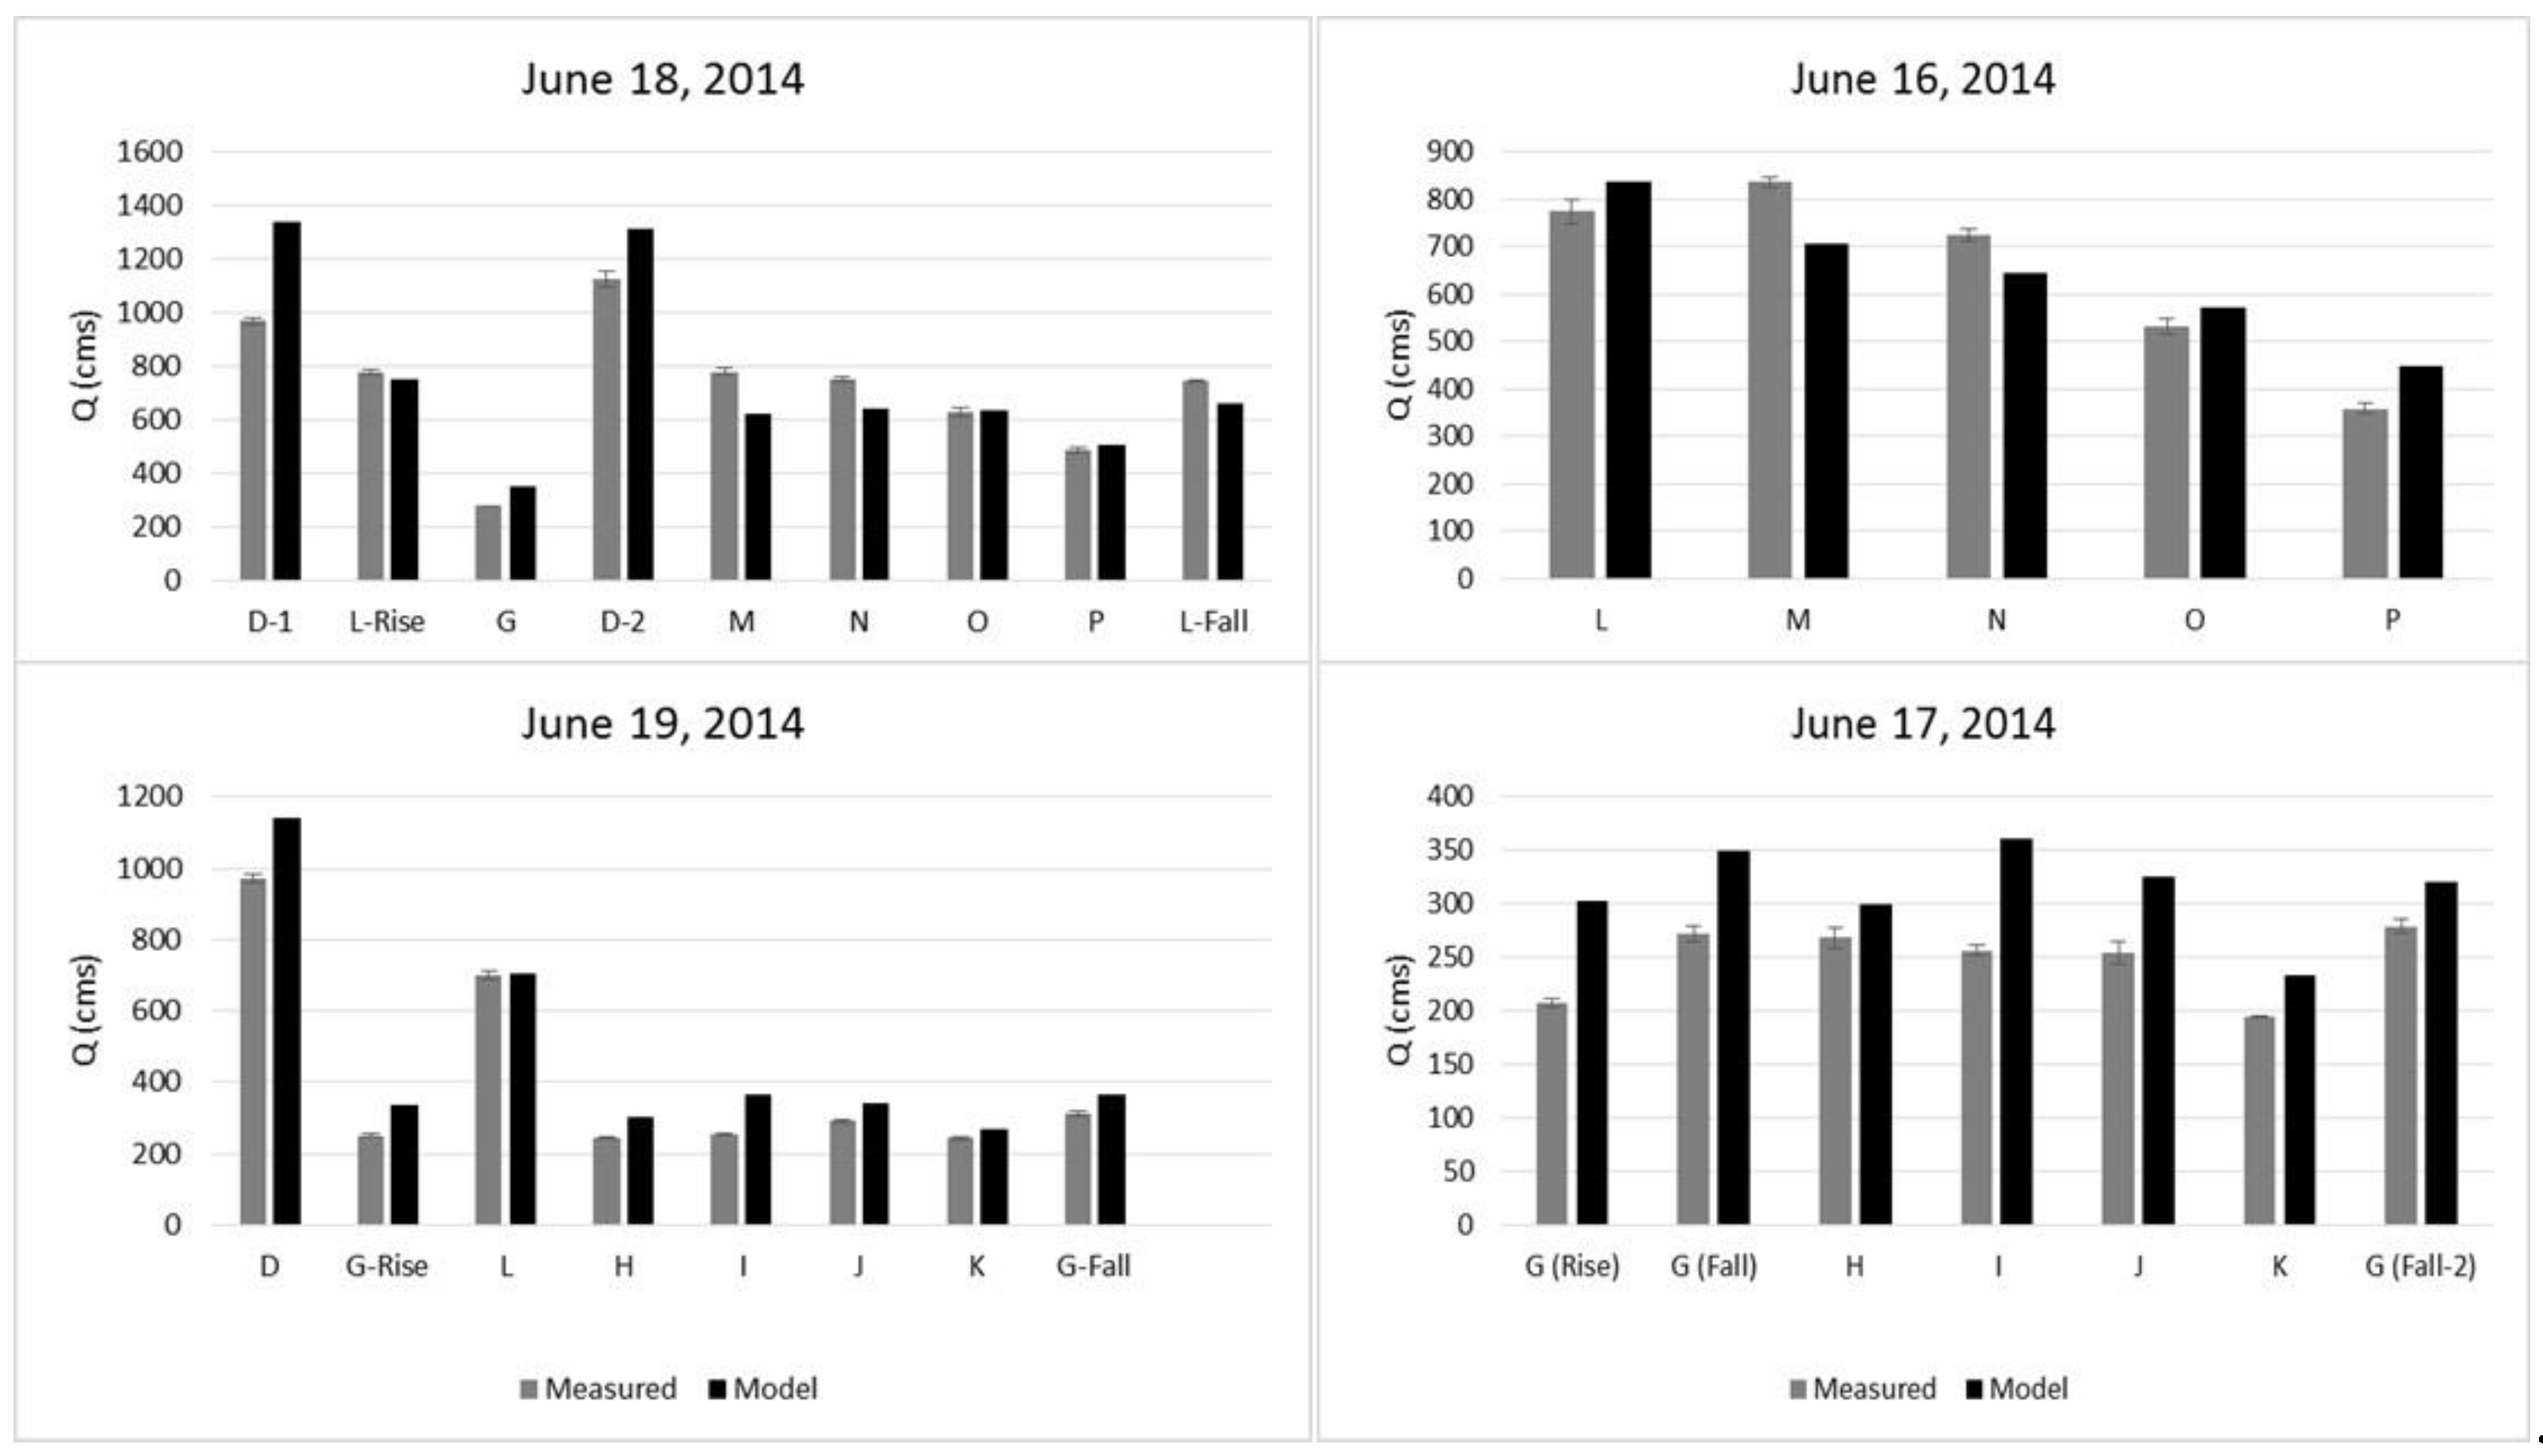
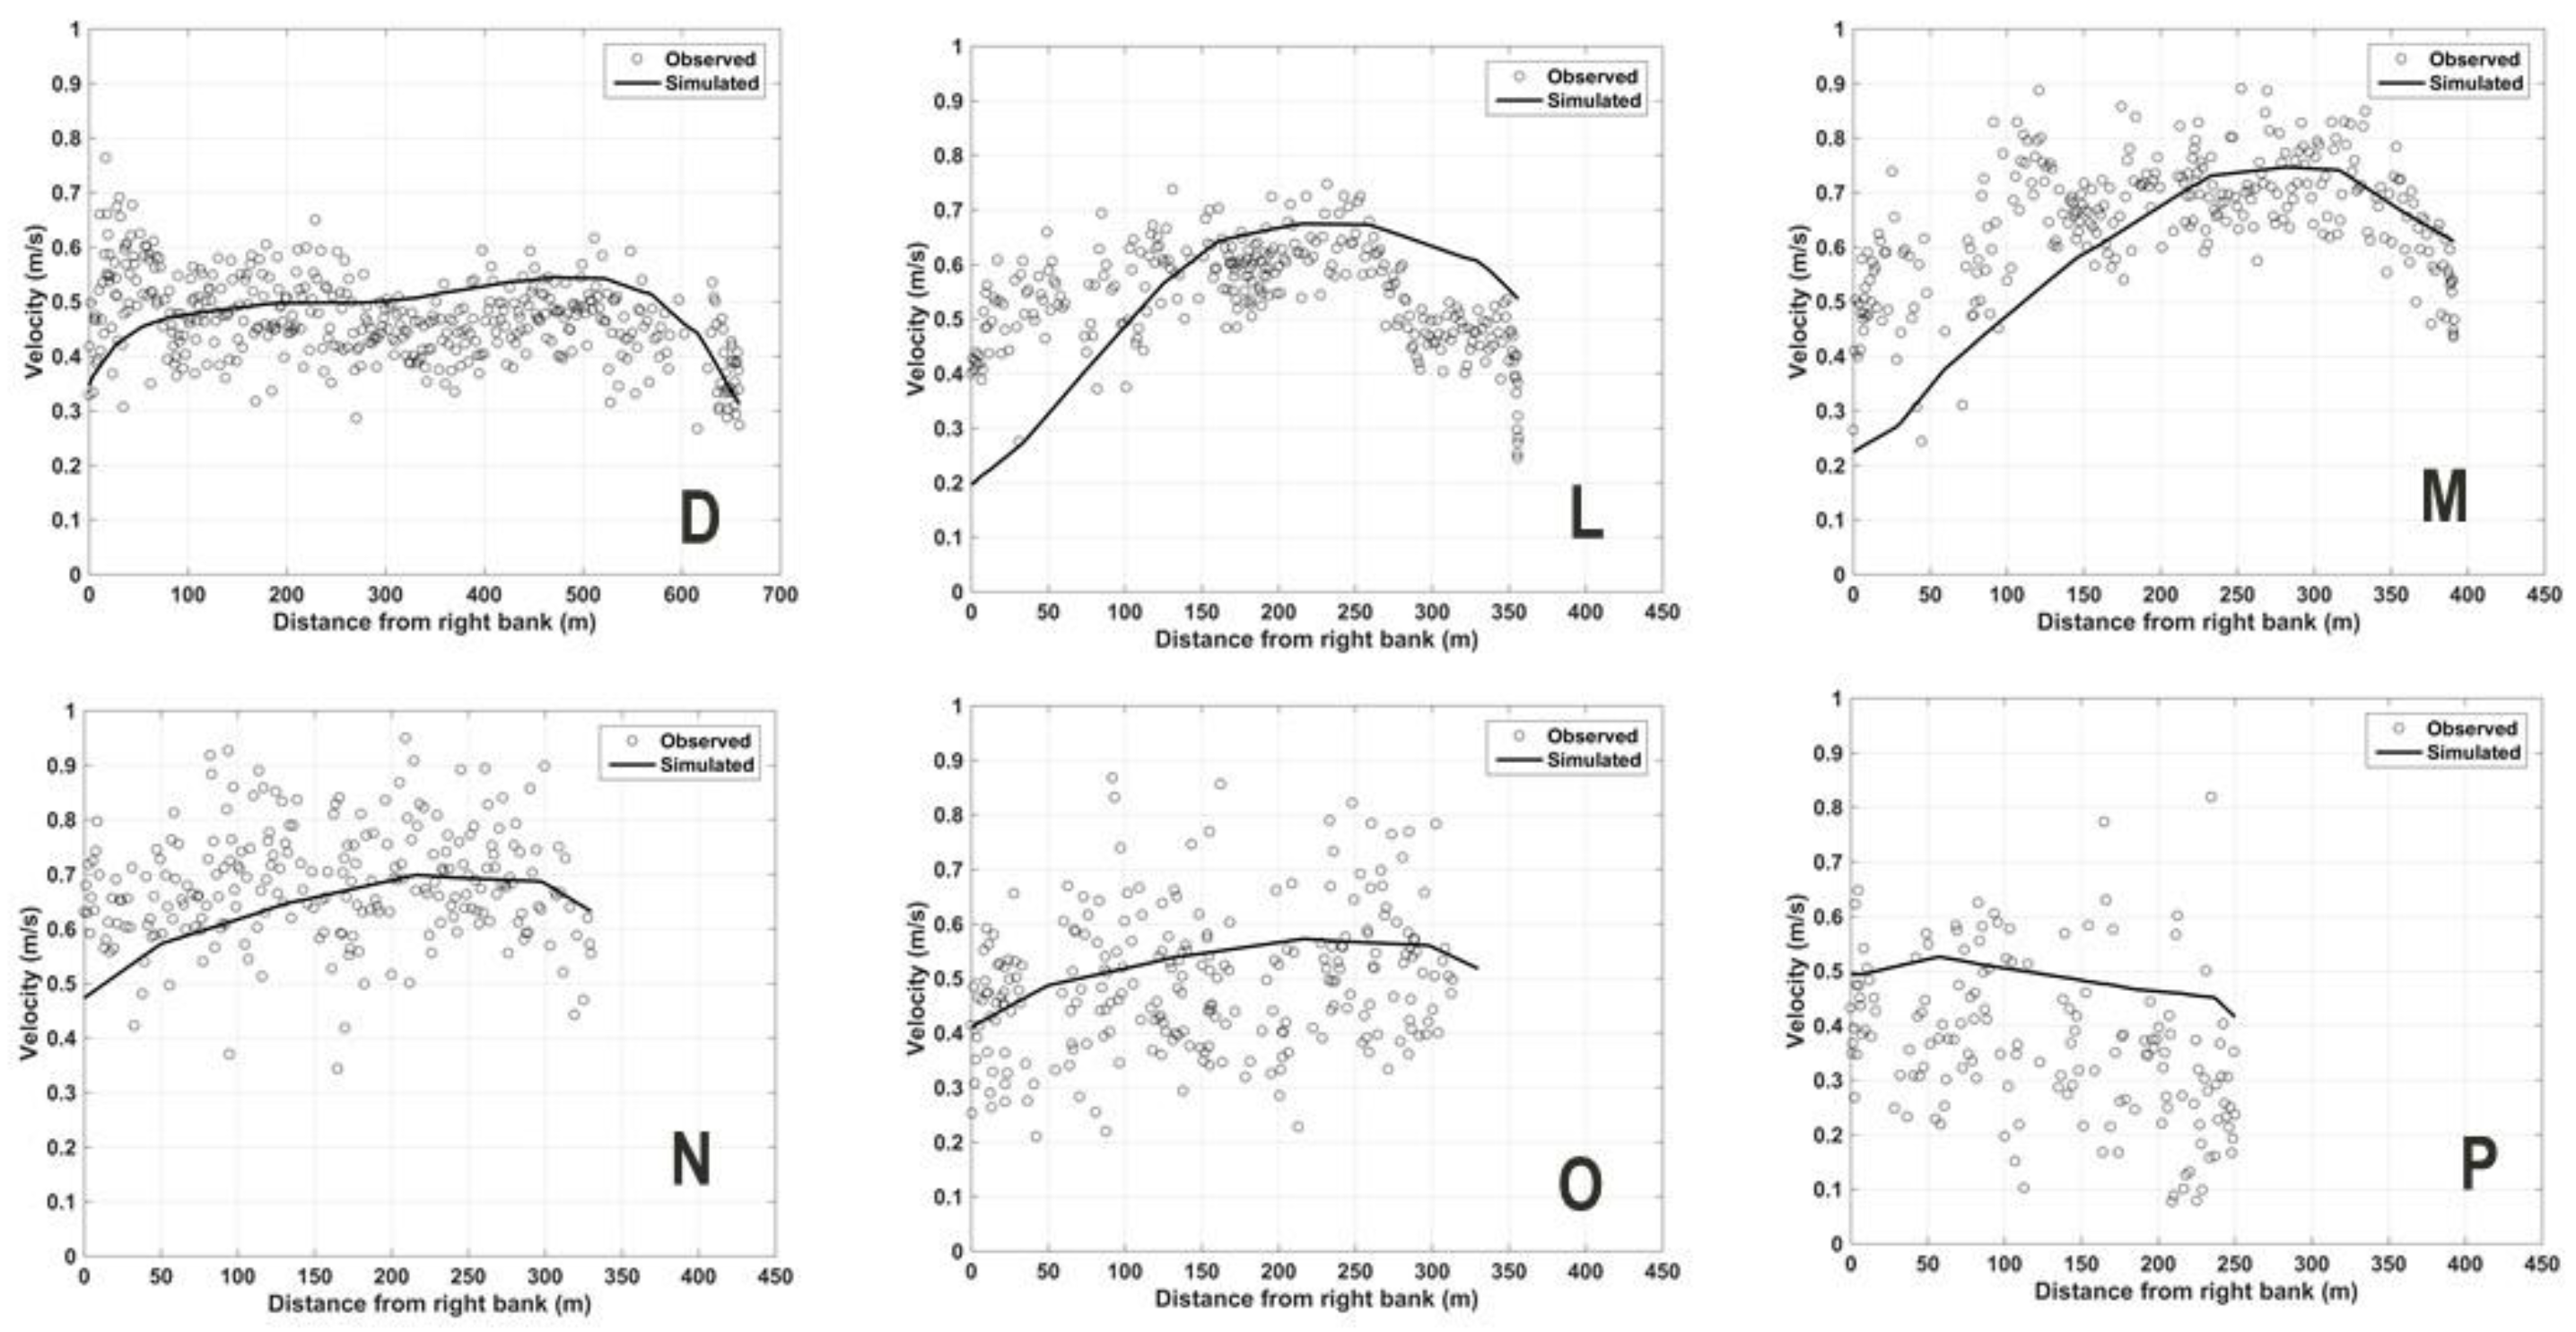
Steady-state 3D model: The simulated vertical velocity profiles compare well with the field observations (see Figure 3, Figure 4, Figure 5, Figure 6 and Figure 7). Similarly, comparison of the simulated and observed suspended sediment concentration at each sample point of the available transects were made for both the 3D and 2D models (see example in Figure 8). It should be also noted that additional calibration and validation of the hydrodynamic component of this model under unsteady conditions have been performed and showed good comparison with field observations [49]. Further, additional comparisons between modeled and measured water level, discharge, and velocity are included in Appendix A.
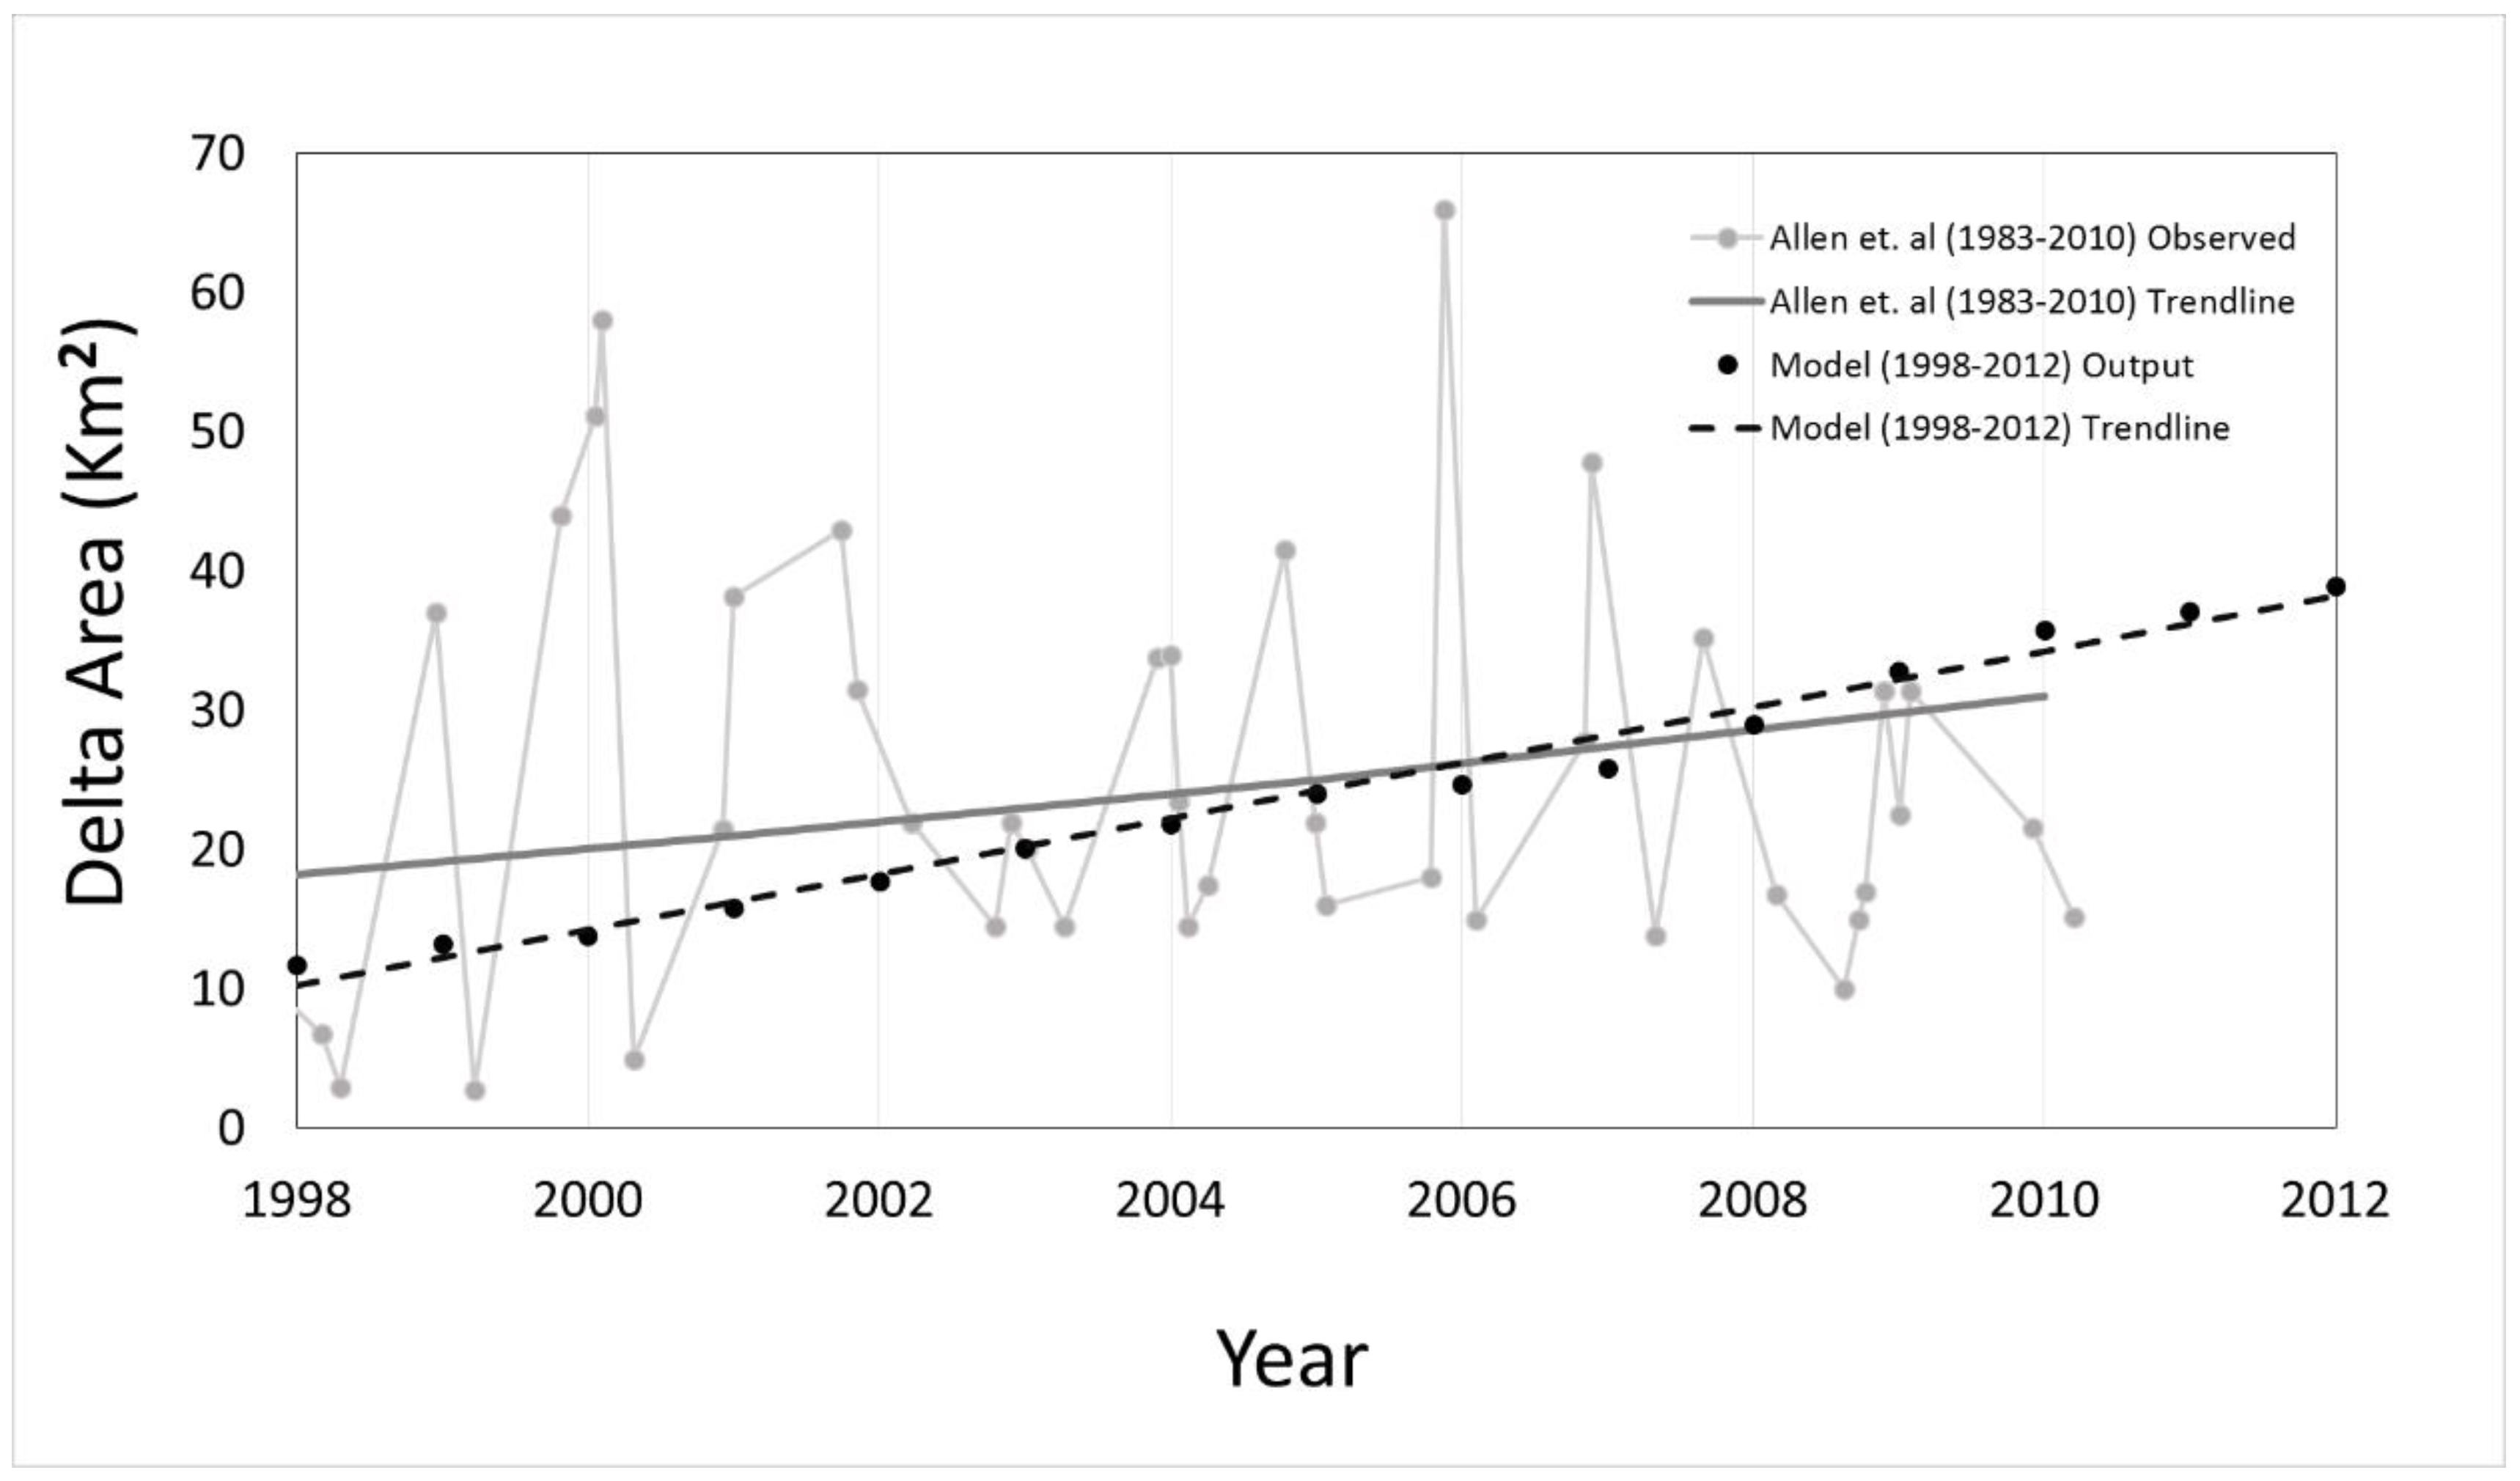
Morphodynamic 2D model: Figure 9 shows the comparison of the simulated and observed [30] trendline of the delta growth. It should be noted that the large annual variabilities in the observations stem from the prevailing water surface elevation during the time of recording the aerial images. These large annual variabilities add uncertainty to the exact trend line that should represent the average annual deltaic growth. Over the 15 years, the model predicts an average growth rate of 1.9 km2/year (above 0 m NAVD88), whereas the remote sensing analysis study estimated an average growth rate of 1 km2/year. Other studies showed that the subaqueous delta planform grew at a rate of approximately 1.72 km2/year between 1974 and 2016, and the subaerial part of the delta grew at the same rate but slowed down after about 1999 [31]. It is plausible that these estimated growth rates are higher than the time series analysis of the aerial imagery due to uncertainties in capturing some processes, e.g., sediment redistribution by waves, and accurate representation of subsidence. Therefore, the land growth rate, calculated based on the subaerial part (above 0 m NAVD88) of the delta, might be overestimated by the models. Despite these uncertainties, the estimated growth rate is reasonable.
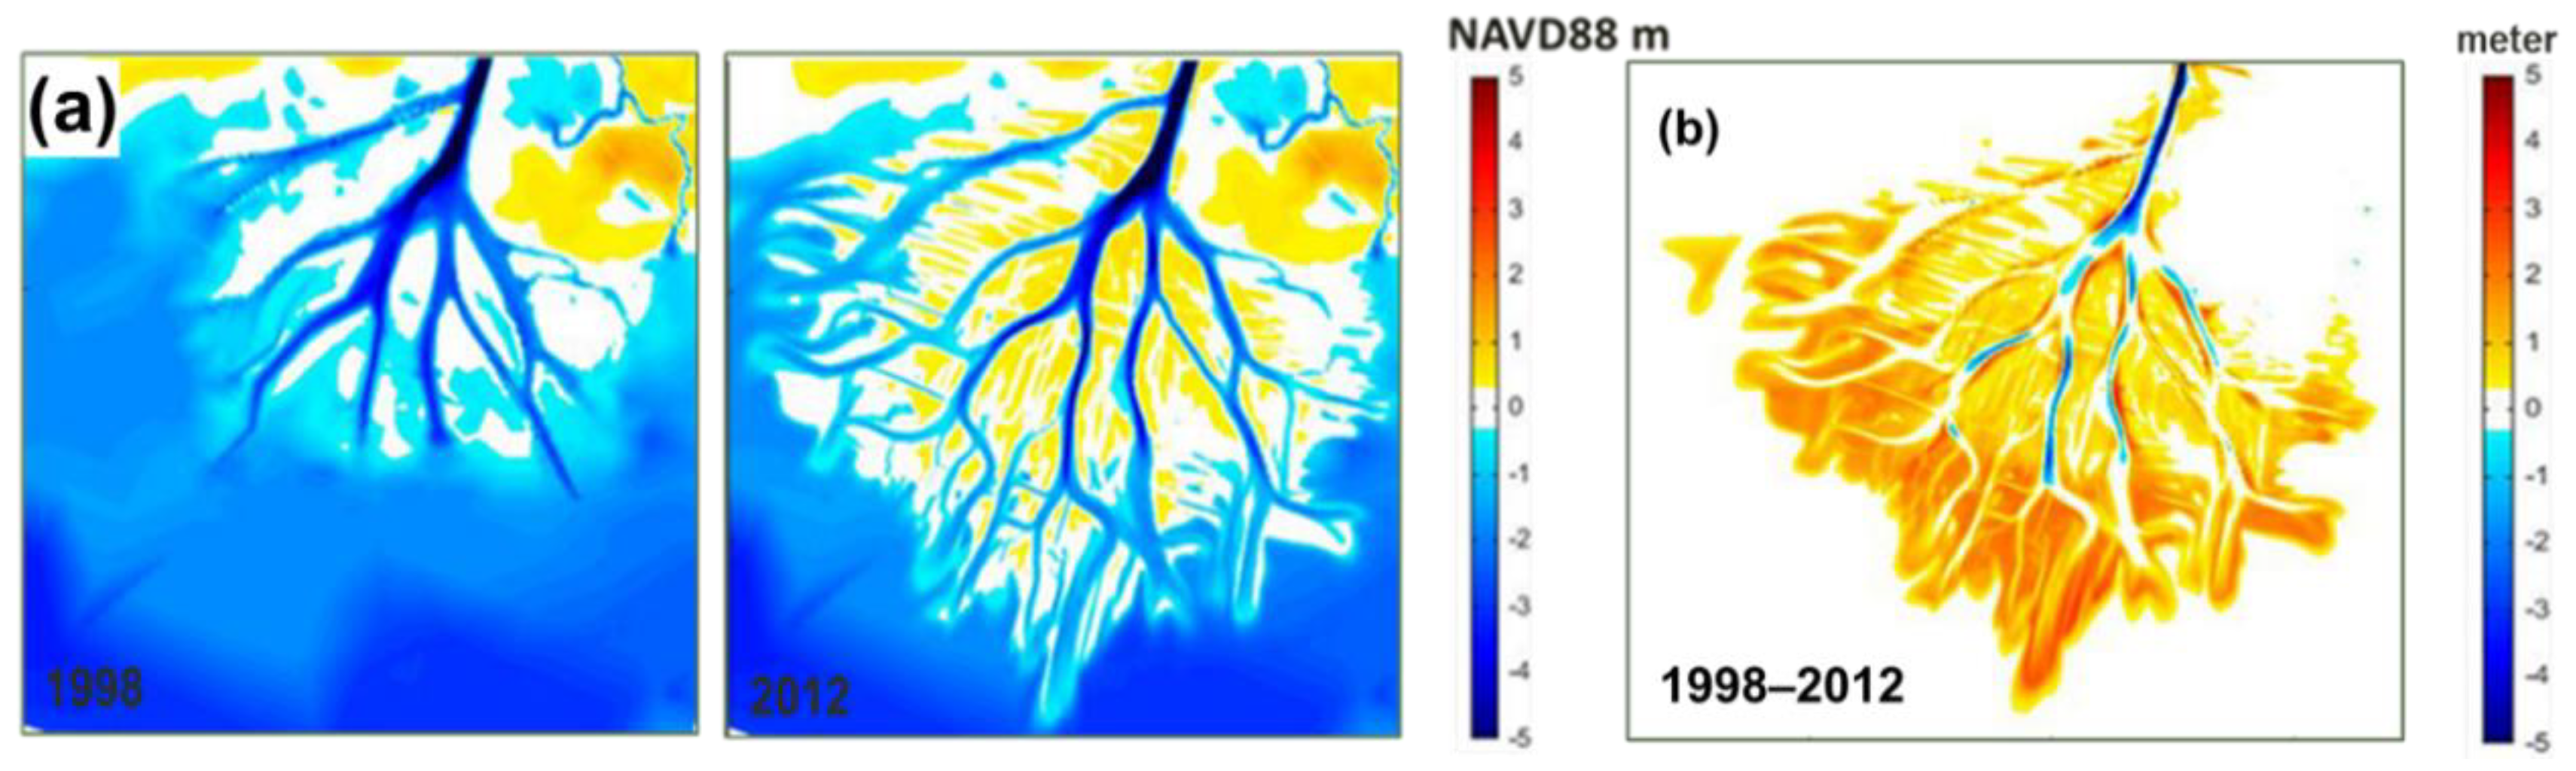
The simulated landscape illustrates the growth of WLD and the cumulative erosion and deposition pattern from 1998 to 2012 (Figure 10). The model results show that the delta prograded seaward with island aggradation and channel elongation. The model is able to reproduce the approximate radial symmetric depositional pattern of the prototype WLD. The modeling results in an estimated seaward progradation rate of 0.23 km/year for the period 1998–2012 (radial distance of shoreline from the delta apex), which agrees well with, albeit slightly lower than, the observed progradation rate of 0.27 km/year (NCED, 2010) [50].
4.2. Flow and Sediment Partitioning in the Channel Networks during Flood Event
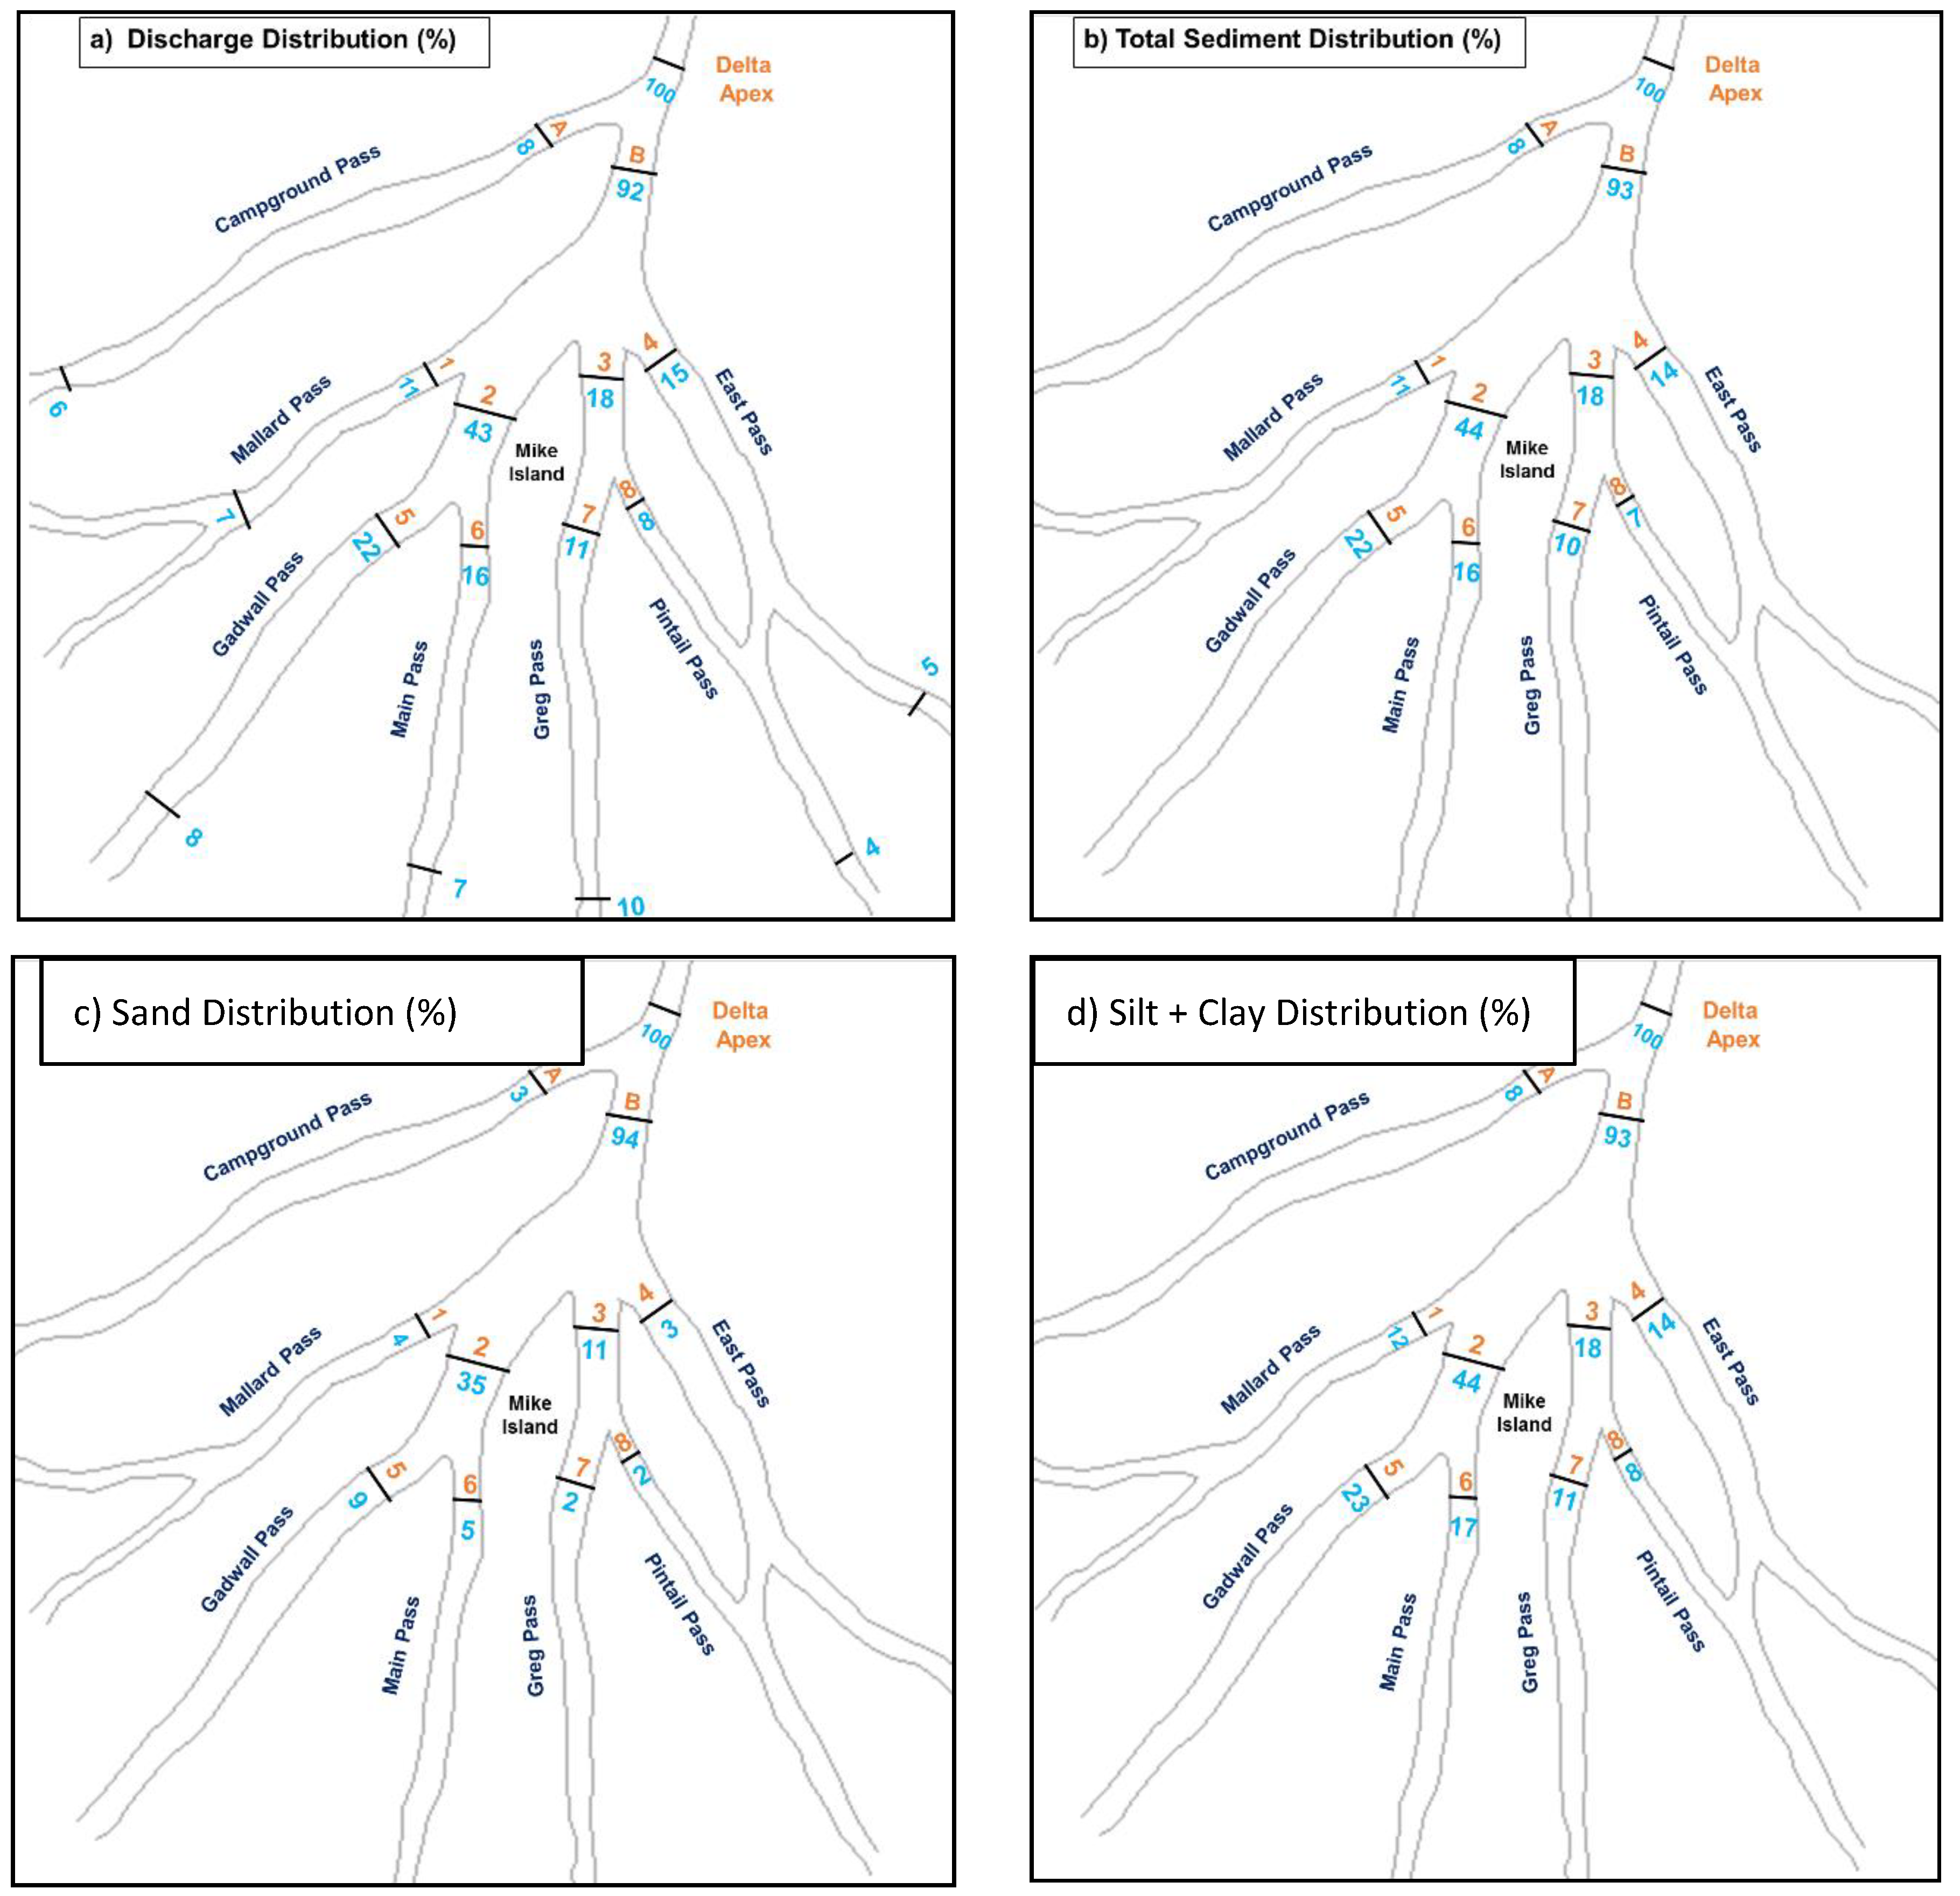
Understanding the dynamics of water and sediment distribution in the delta channel network is important because it influences the morphology of the delta. To gain insights into this, the proportions of water and sediment fluxes through the distributary channels were investigated using the calibrated 3D model results for the river flood event. The flow and sediment distributions are shown in Figure 11. At the first bifurcation (i.e., channels A and B), the flow and sediment splits with a large asymmetry. Flow and sediment proportions are higher in the channels flowing on the eastern side (Gadwall, Main, Greg, Pintail, and East Passes) of the delta compared to the channels on the western side (Campground and Mallard Passes). Approximately 20% of the flow and total sediment fluxes are discharged to the western channels and the remaining 80% to eastern channels. Fine sediment is distributed nearly uniformly within a channel cross-section. Thus, the fine sediment (mud) distribution in percentage is consistent with water fluxes throughout the channel network. The sand distribution percentage, on the other hand, is different from the water distribution among the channels. The channel orientation and geometry (especially depth) influences the sand distribution among the various channels [7,10]. Further, there is significant decrease in the sand transport capacity as the flow progresses down the delta and hence significant proportions of sand loads are deposited in the channels.
At the initial bifurcations of the eastern side (i.e., 1, 2, 3 and 4), flow loss from the channels to the islands is small (~5%). However, the loss in flow increases progressively in the seaward direction. Approximately 47% of the flow exits the system as channelized flow and the remaining 53% flows over the islands. Hiatt and Passalacqua [22] recently found that in WLD, 23–54% of the incoming distributary channel flow crosses over the islands via secondary channels and overbank flow. Their estimates were based on the field measurement at the upstream and downstream end of Gadwall and Main Passes during an average flow condition (3344 m3/s at Calumet Station). Our modeling results are in agreement with their results, because 55 and 65% of the incoming flow at Main Pass and Gadwall Pass, respectively, are conveyed to the islands during a river flood event (4000 m3/s at Calumet Station). Significant flow exchange occurs mainly at the distal portion of the delta complex where vegetation is thin and levees are subaqueous, whereas losses are relatively small in the upper portion of the channel–island complex due to limited exchange between the primary channel and island interior. Our experiments support the significant hydrological connections between channels and islands, and connections are more pronounced further downstream at the subaqueous part of the delta. The numerical model also provides quantitative information for all the existing islands and channels of the delta.
4.3. Channel Morphology
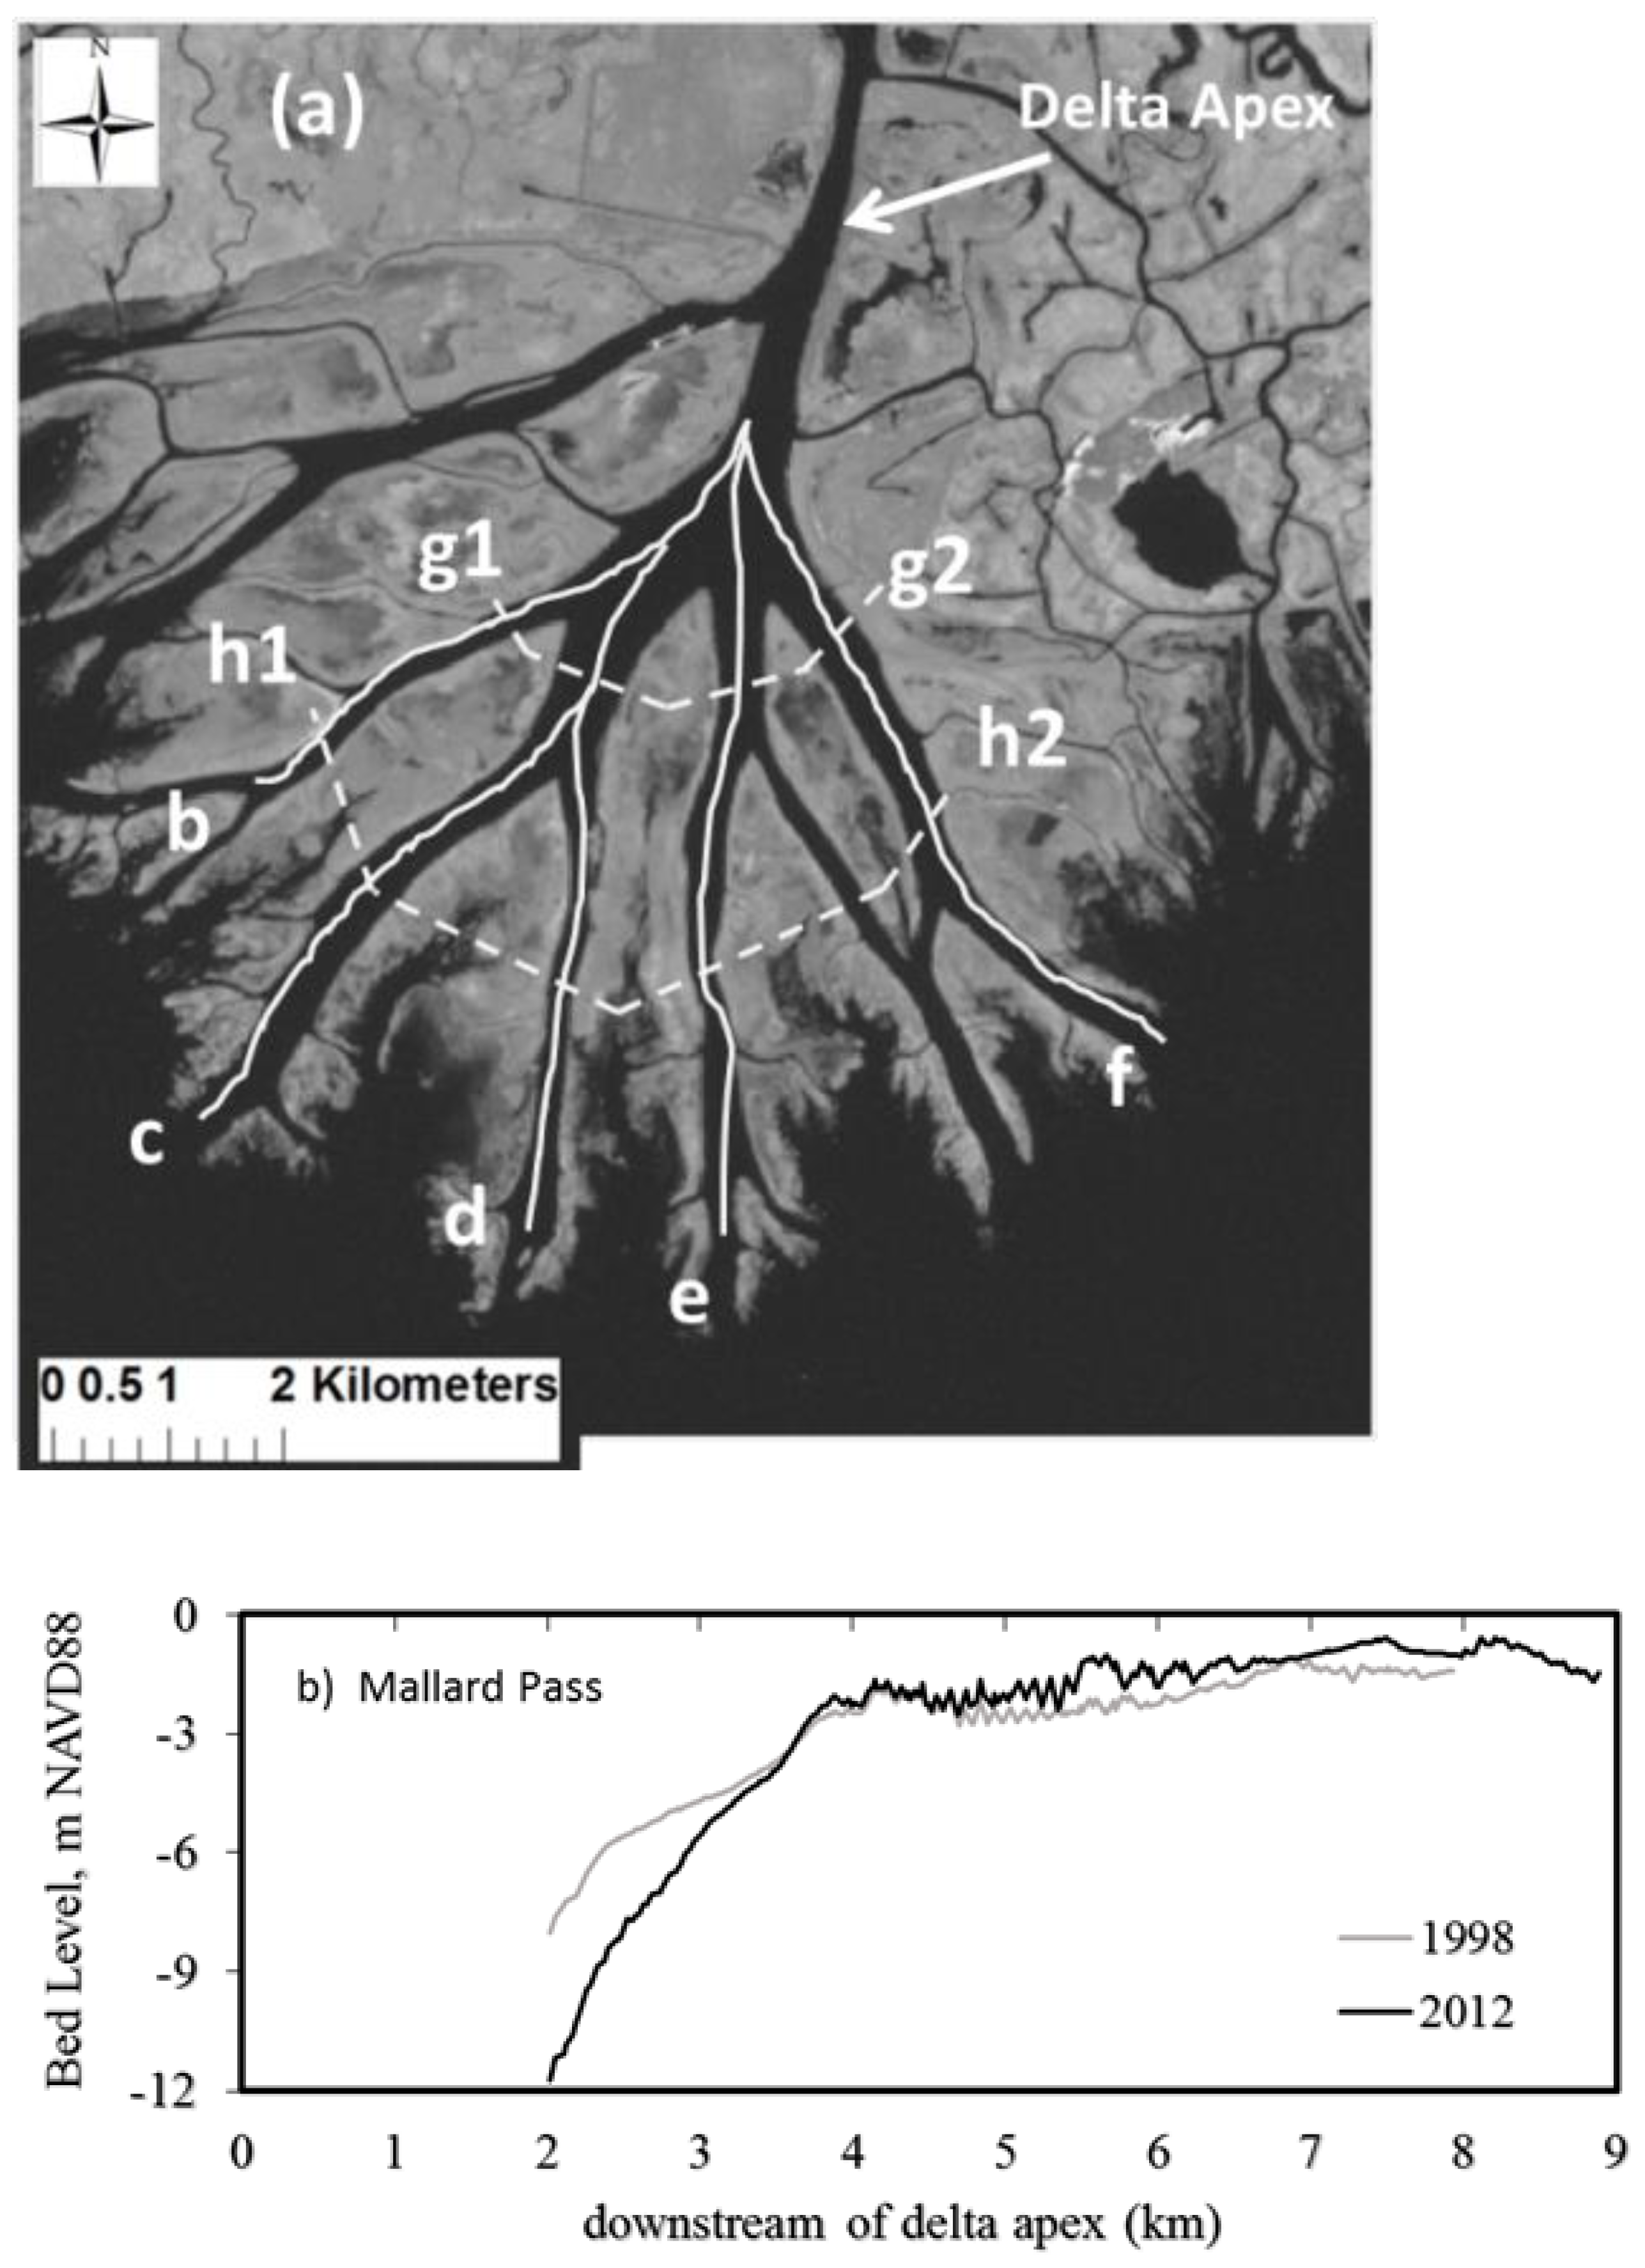
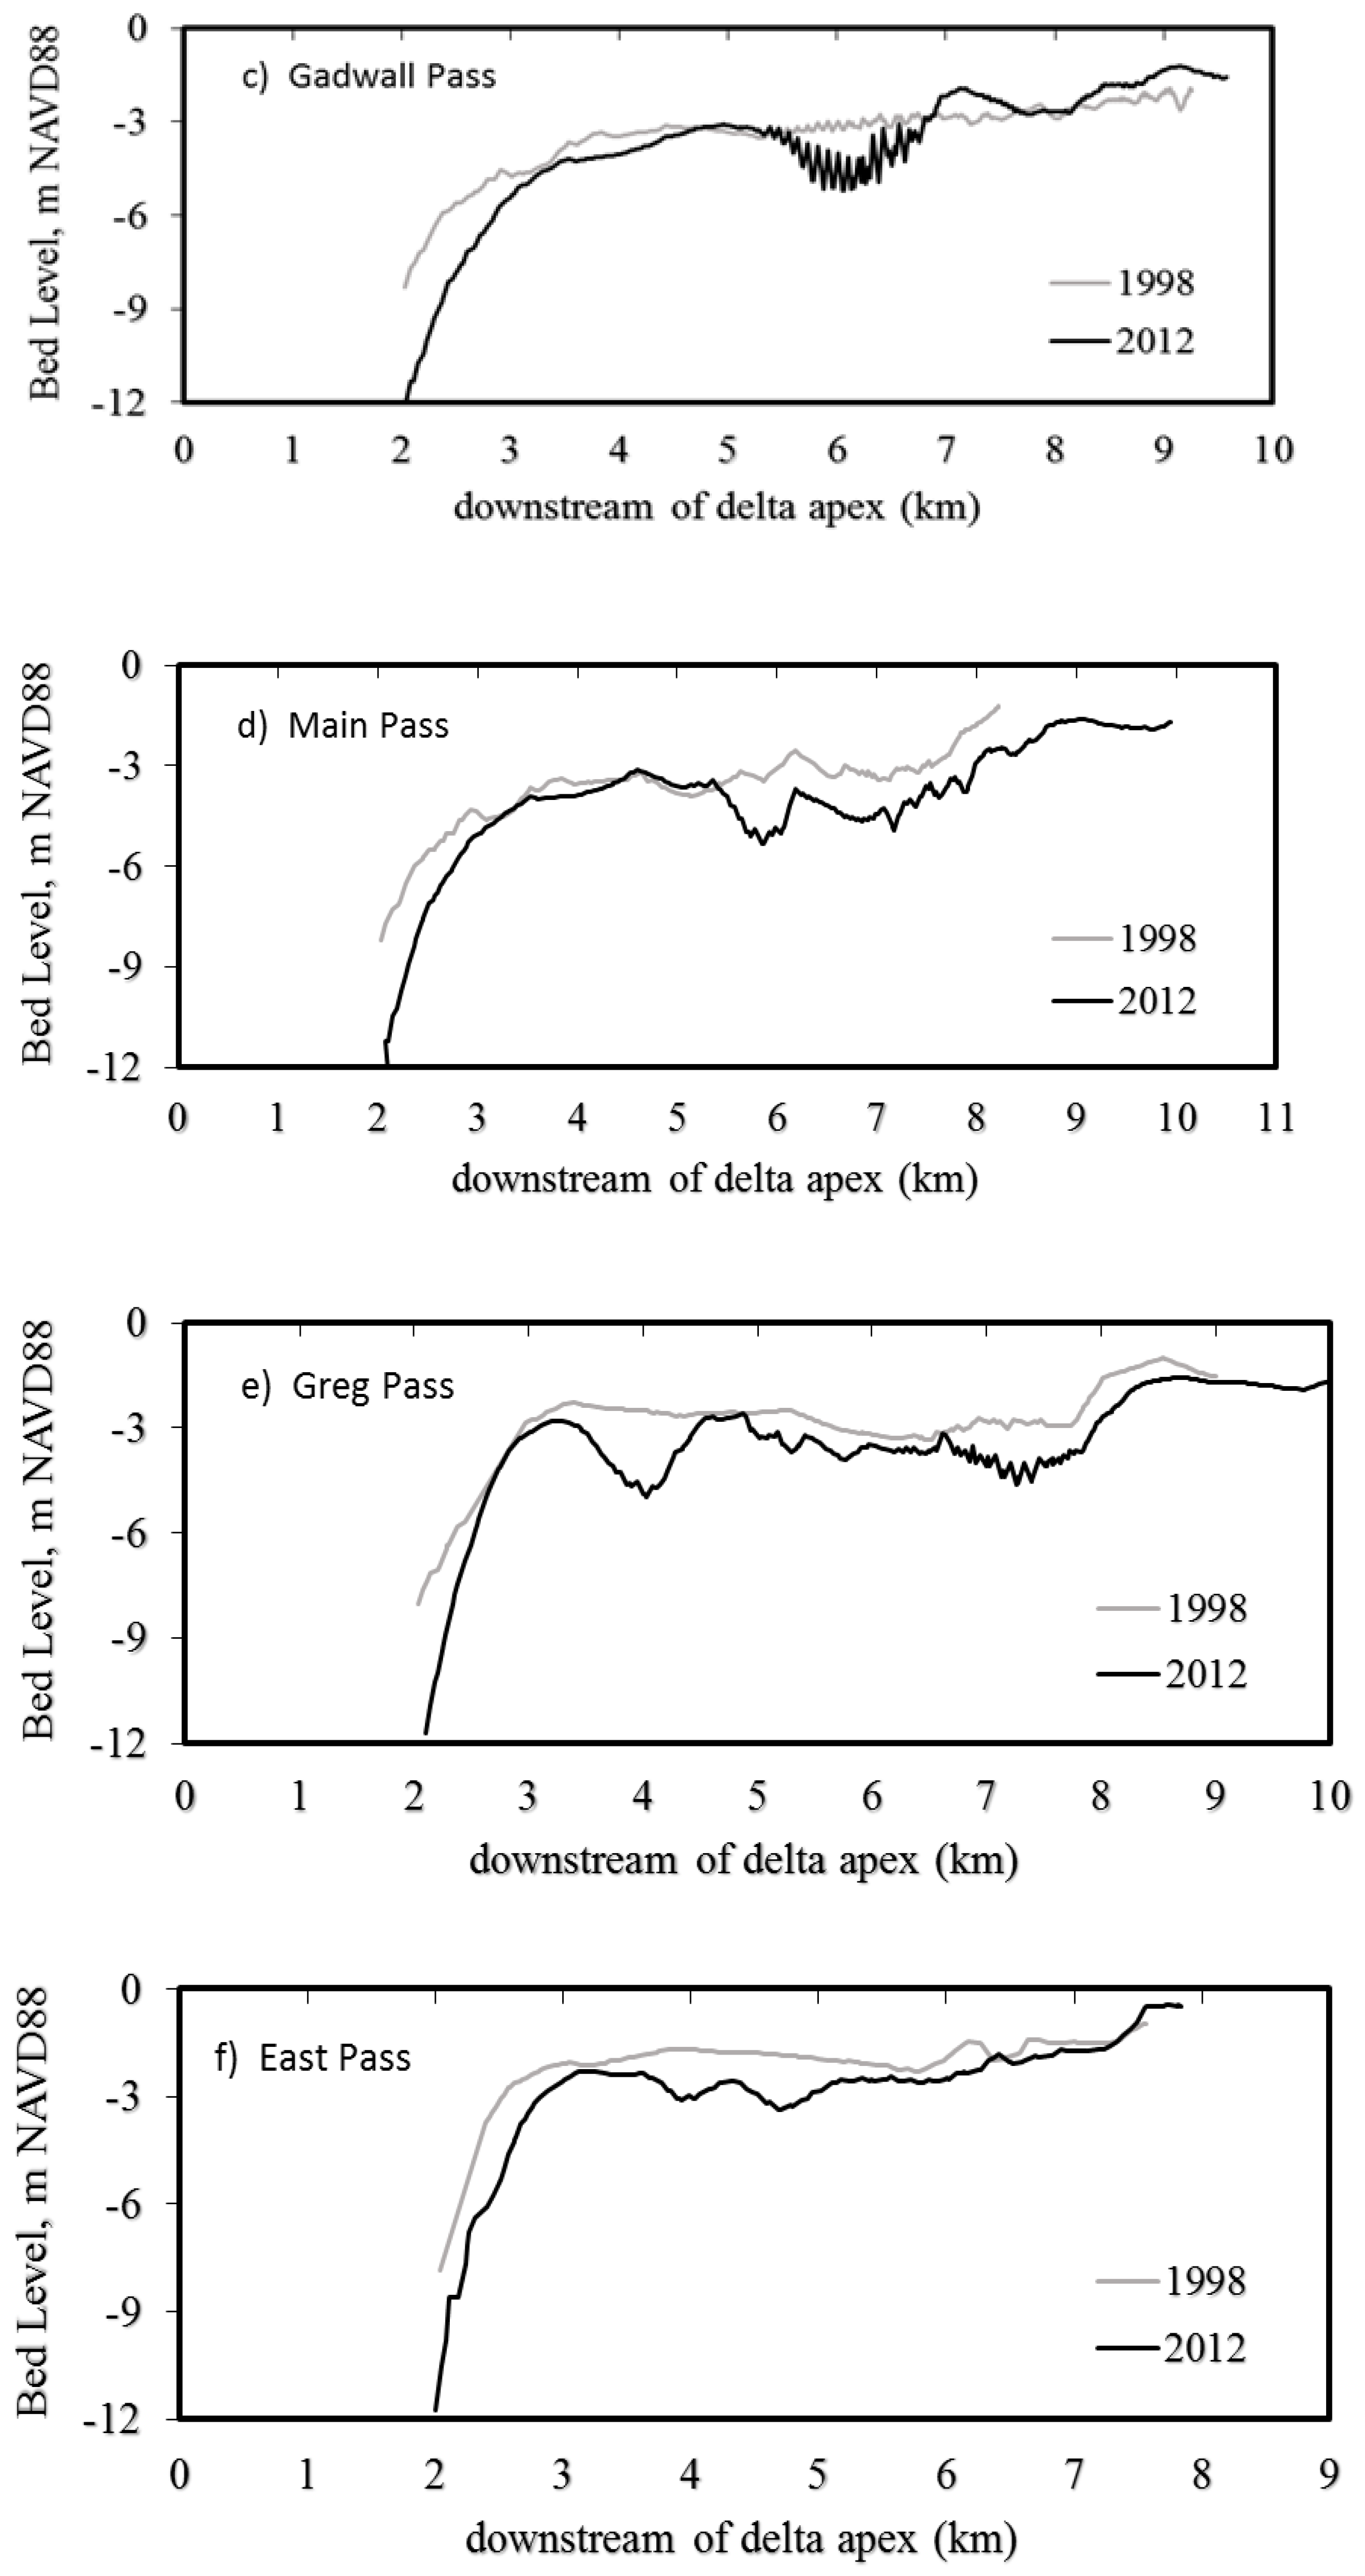
The 2D model results demonstrate the morphological development in the WLD distributary channels during 1998–2012. Longitudinal transects (Figure 12b–f) shows that the distributary channels in general have become deeper over time due to erosion. The erosion is at a maximum near the delta apex and decreases downstream. The model result suggests that the distributary channels become depositional approximately 6–8 km downstream of the apex. However, the extent and magnitude of erosion varies among channels. Shaw et al. [41] presented a similar trend in WLD channel morphology. Their findings were based on comparison between bathymetric transects from 1999 and pre-delta bathymetry from 1935.
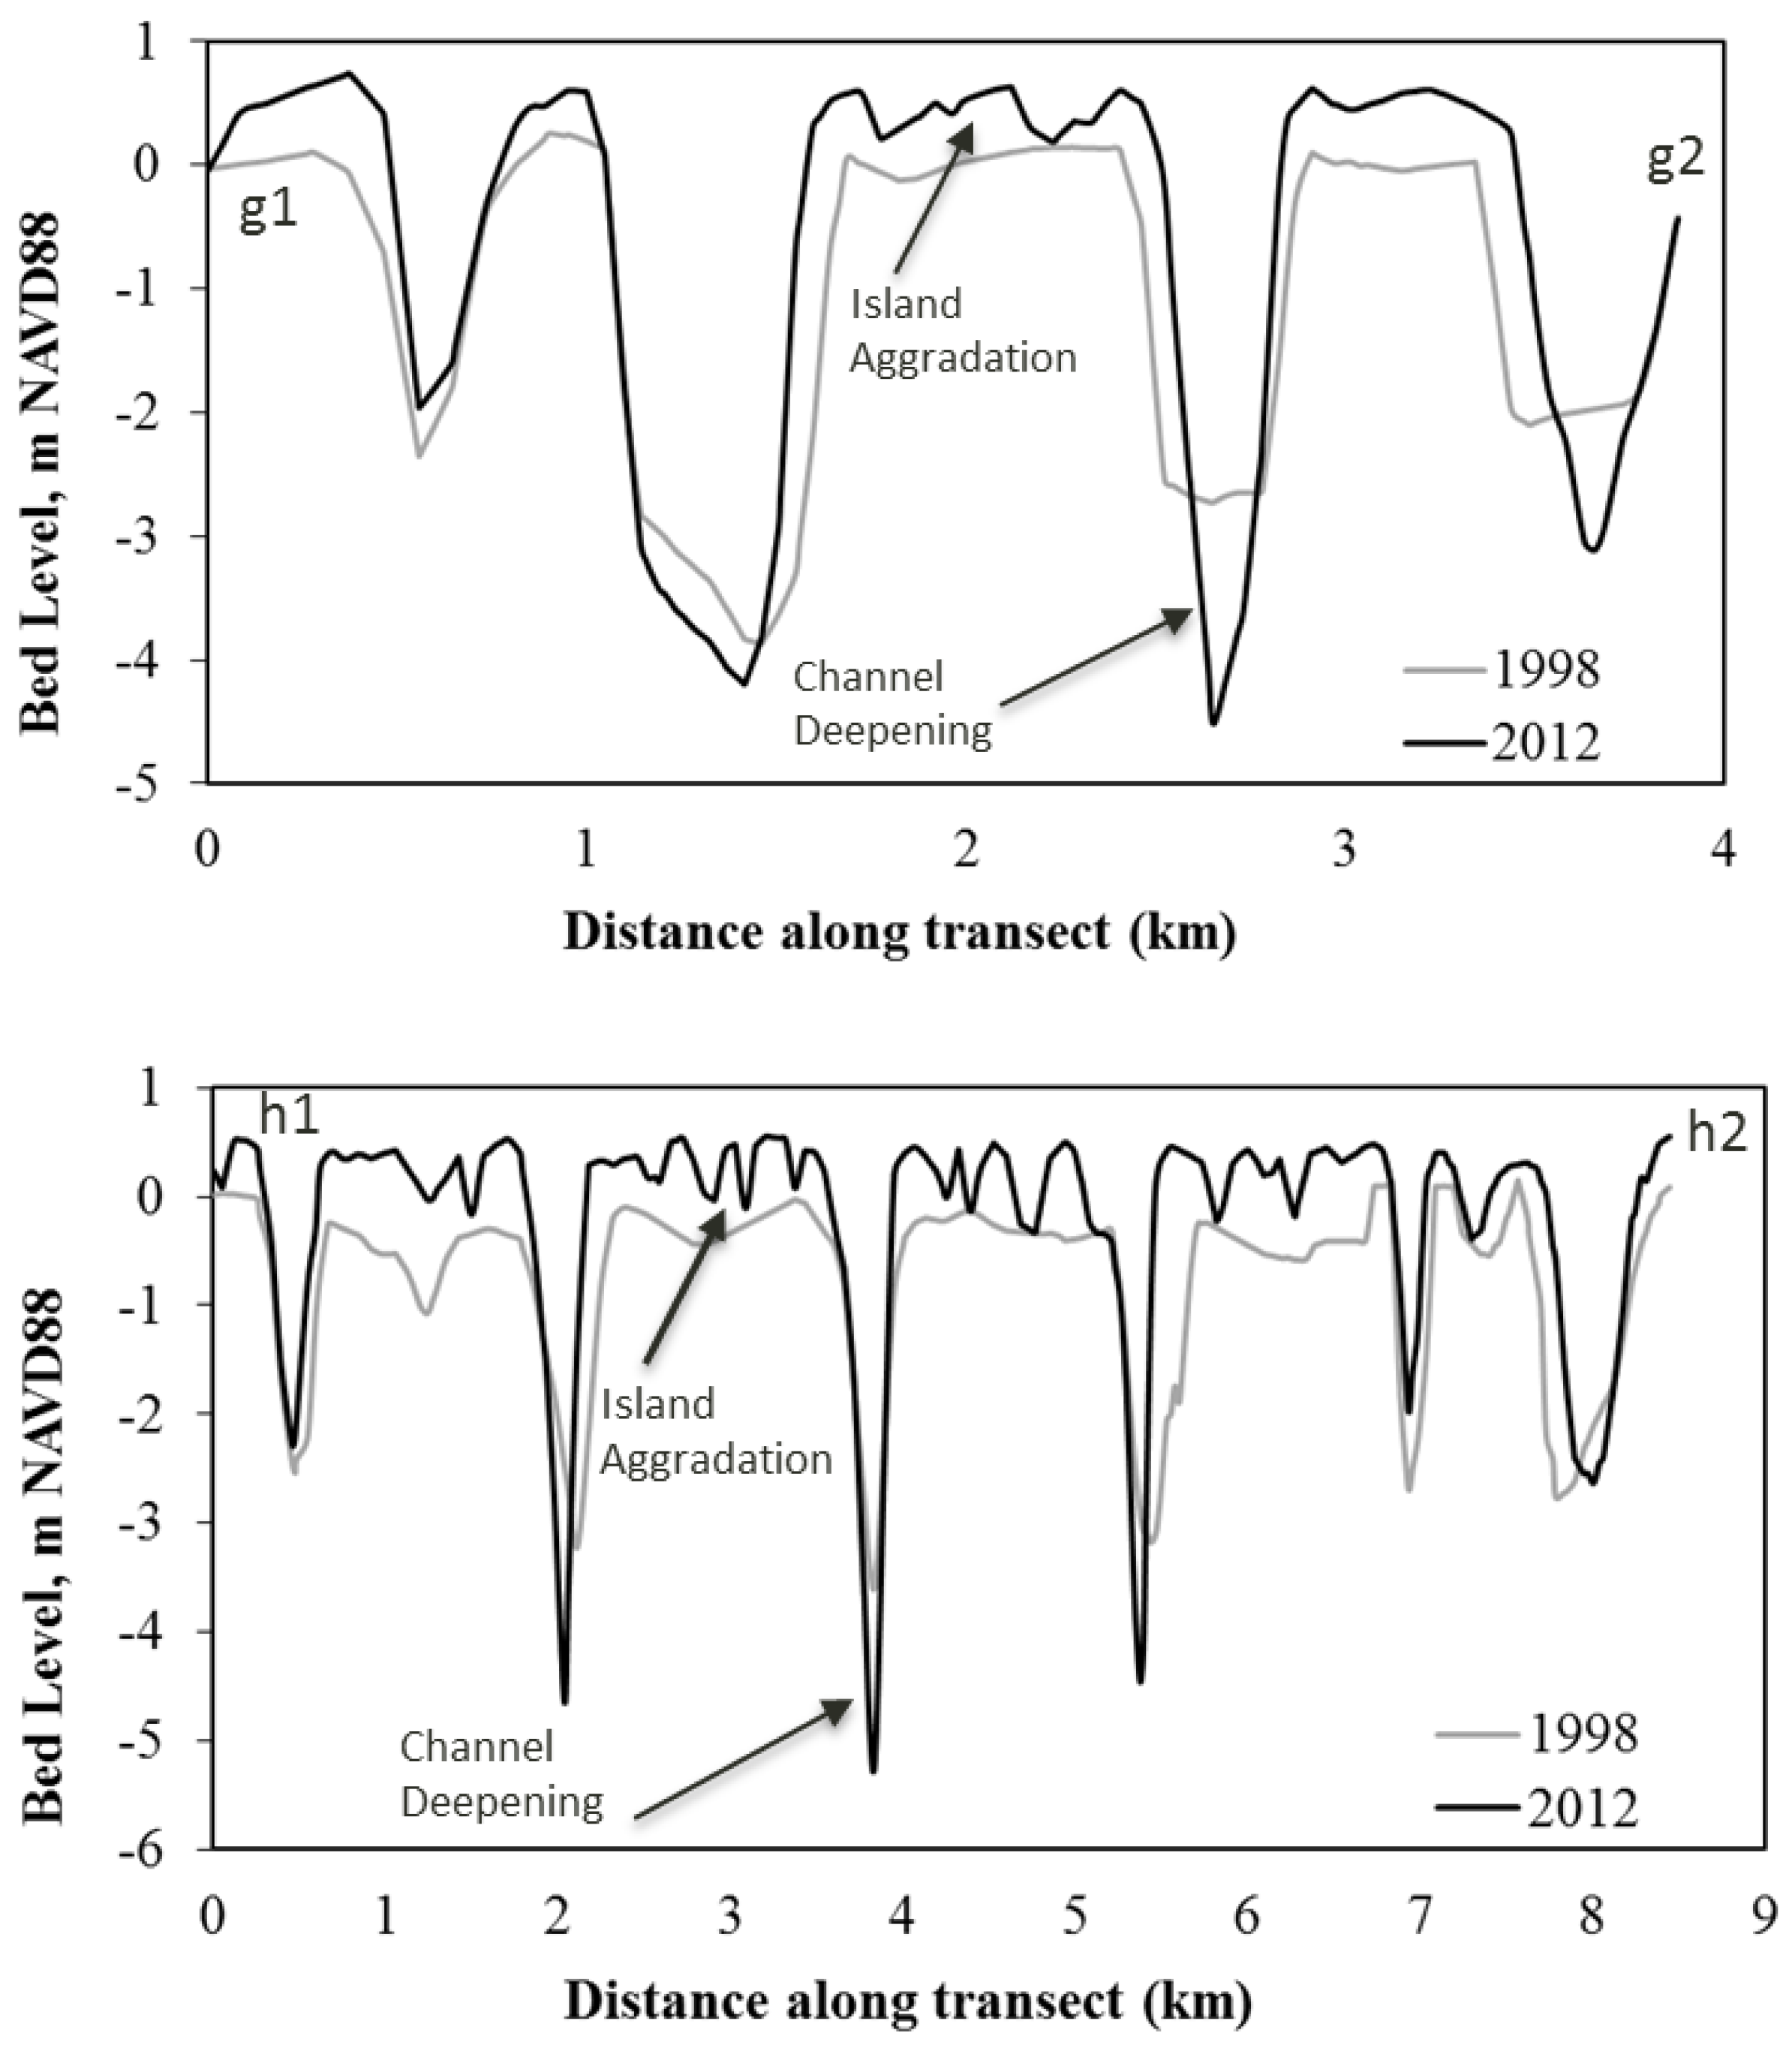
Figure 12g,h shows two cross-section profiles—transects g1–g2 and h1–h2 at radial distances of approximately 4 and 7 km, respectively, from the delta apex, passing through several islands and channels. The transects show that although the islands have aggraded over time, the distributary channels have incised and become narrower due to accretion near the channel banks. Aerial images between 1991 and 2009 showed that some channels narrowed over time, but there was a net widening of channels during this period [41]. The Delft3D model presented herein does not account for channel bank movements caused by significant erosion into the adjacent cells. This might explain why the model did not show widening of the channels, even when significant erosion develops into adjacent cells. However, development of advanced Delft3D schemes addressing bank line migration is in progress [51,52], and can be included in subsequent studies.
4.4. Impact of Distributary Channel Geometry in Water and Sediment Distribution
To investigate the sediment capturing efficiency in each distributary channel, the Sediment Water Ratio (SWR) [53] was calculated for both the coarse and fine sediment with respect to the sediment load and flow at the delta apex during the river flood event (Table 2). This ratio is defined as
It can also be simply defined as the ratio of the average sediment concentration in the distributary channel to the average sediment concentration at the delta apex. The SWR for fine sediment (silt and clay) was close to unity in all the distributary channels.
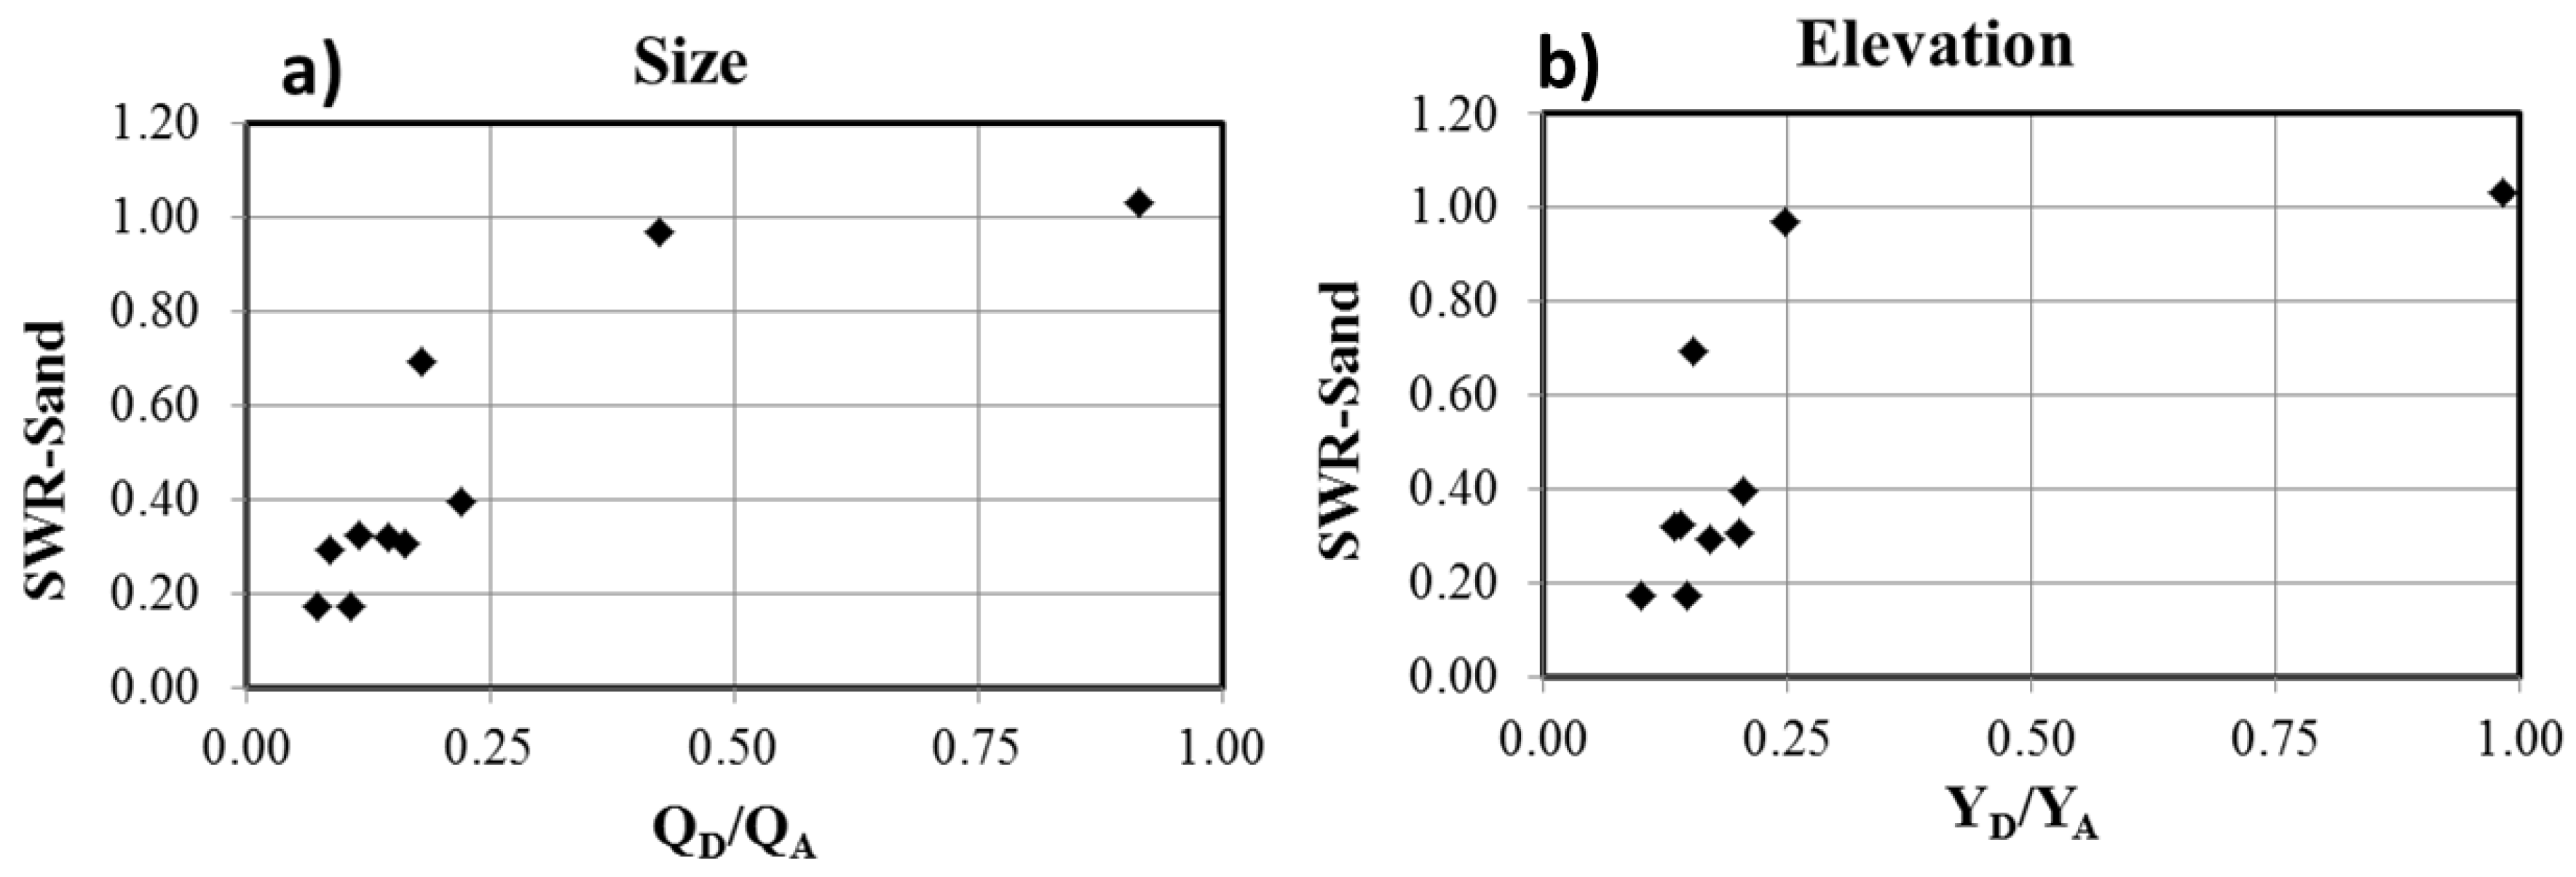
The impact of the distributary channel geometry on the sediment capturing efficiency was investigated by plotting the SWR against the capacity of the channel (ratio of flow at channel (QD) and delta apex (QA)) and depth (ratio of channel depth (YD) and depth at delta apex (YA)), as shown in Figure 13.
4.5. Long Term Flow and Sediment Dynamics in the Channel Networks
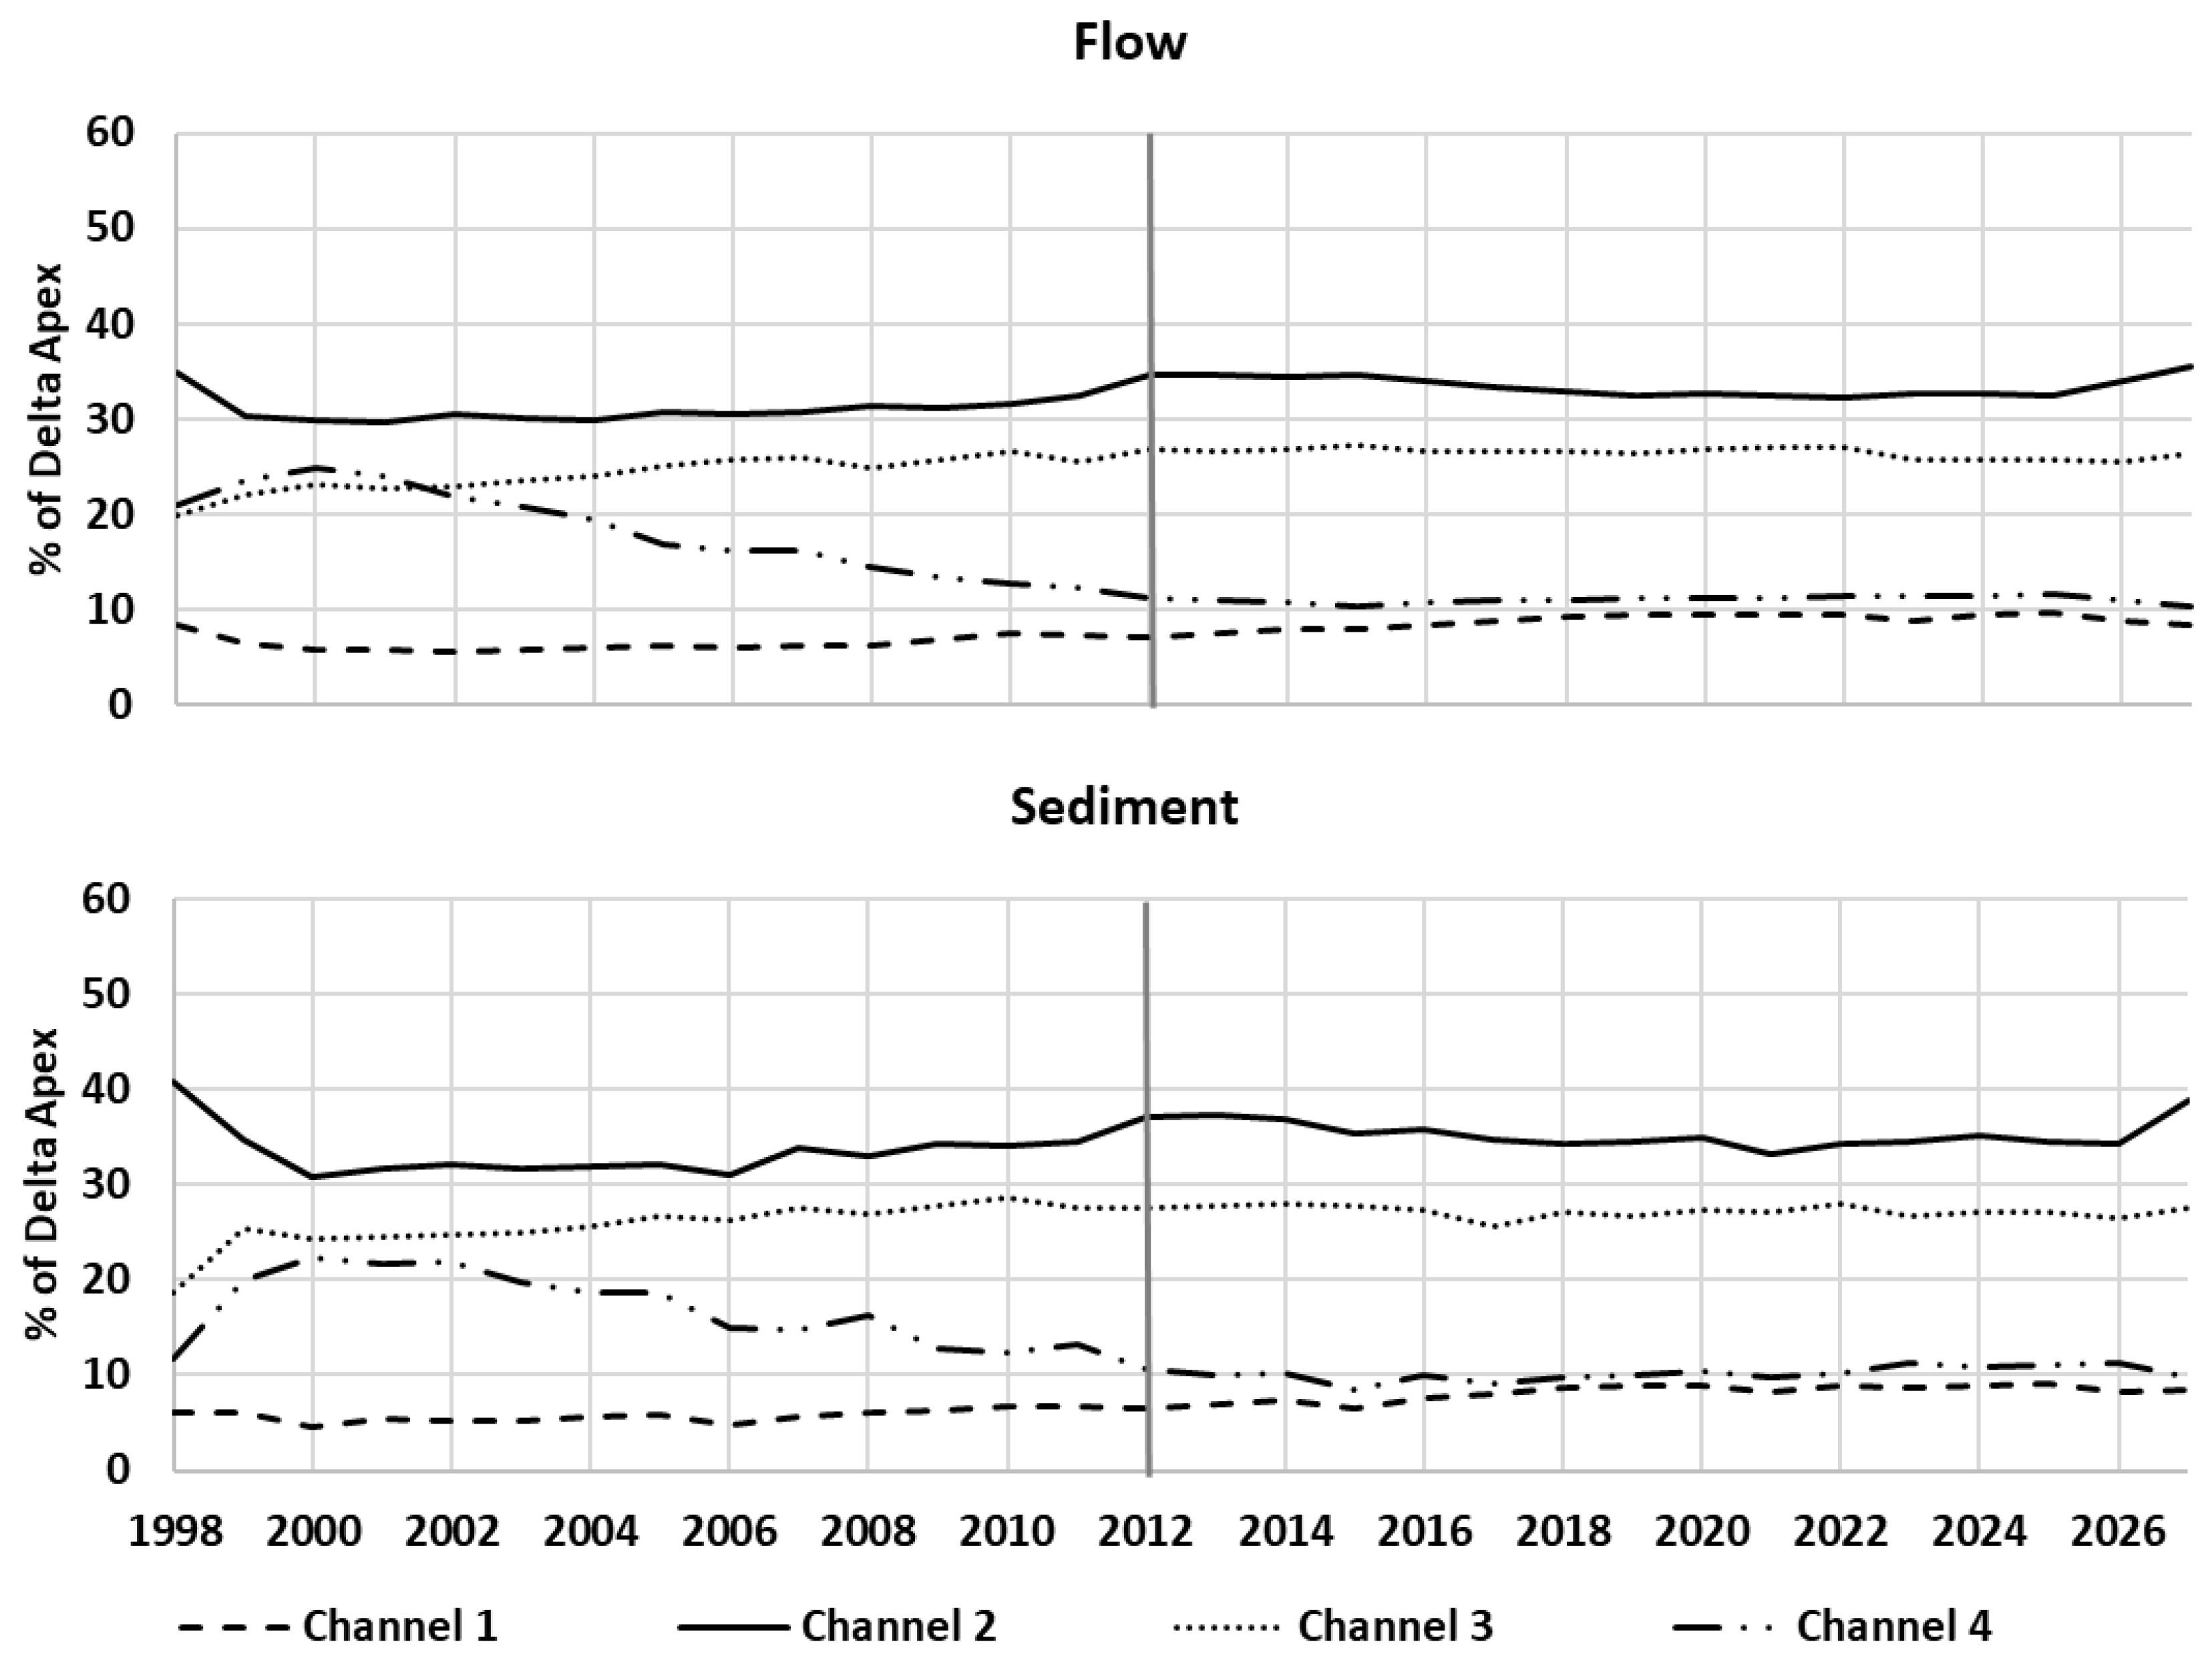
The flow and sediment distribution in the WLD channels were investigated over a 15-year period (1998–2012 hydrographs). Focus was given to the distributary channels 1, 2, 3, and 4 (see Figure 11 for channel location) as the primary distributors of the network. The proportions were calculated by calculating the annual flow and sediment fluxes for the individual channel with respect to the value at the delta apex. The results show an equilibrium flow and sediment distribution for channels 1 and 2 over the 15-year period. For the same period, channel 3 shows a somewhat increasing trend, whereas channel 4 shows a decreasing trend in capturing flow and sediment. To further investigate the long-term dynamics and examine if these trends would continue over time, or if there would be re-distribution of the modeled flow and sediment partitioning among these channels, the numerical simulation was continued for an additional 15 years (2013–2027) while repeating the same hydrographs of 1998–2012 as boundary conditions. The 30-year results show that all four channels approached a state of dynamic equilibrium for flow and sediment distribution in the delta network within the last 15-year period (Figure 14).
Generally, delta bifurcations, which are in equilibrium configuration, do not change over a significant period of morphological time scales [54], where the morphological time scale () is defined as:
W is average width (m), D is average depth (m), and is the sediment transport rate per unit width of the channel upstream of the bifurcation. The morphological time scale ( can be also considered as the duration over which an amount of sediment transported through the cross-section would be sufficient to fill that cross-section. To generalize the morphological time for all distributary channels, a non-dimensional time scale was calculated based on [55].
where T is total time elapsed and is the non-dimensional time.
The WLD bifurcations are considered to be in equilibrium because the change in discharge ratio at the bifurcation is no more than 1% for the non-dimensional time calculated over the last 15 years of the 30-year simulation. Analysis for different flow conditions, such as the usual flow rates and the flow rates reduced by 50%, also shows that the discharge ratio at the bifurcation did not change more than 1% over the non-dimensional timescales in last 15 years (Figure 15). Therefore, when a deltaic channel network has stable bifurcations, the delta system adjusts to change in flow conditions to maintain its equilibrium configuration in the long term.
5. Discussion
The 3D steady-state model shows that there is a large asymmetry in flow and sediment distribution between the eastern side and the western side of the delta. Flow and sediment proportions are much higher in the channels flowing on the eastern side (80%) of the delta compared to the channels on the western side (20%). The length and slope of the channels were key factors controlling the sediment and water distribution. The channels are shorter on the eastern side compared to those on the western side. As a result, the overall landscape slope is steeper on the eastern side, which resulted in more water and sediment being conveyed through this side. Further, the channel depths are different across the distributary channels. The steeper slope of the individual channel allows more flow through the channel with higher stream power. These dynamics cause channel erosion and create a relatively deep distribution channel [56].
As shown in Table 2, the fine sediment concentration of the diverted water in all the channels is similar to the concentration in the upstream delta apex. However, the SWR for sand varies among the channels, and this is mainly attributable to the varying size and depth of these naturally formed channels. Further, as shown in Figure 13, the SWR for sand shows a positive trend with the increase in relative capacity and relative depth of the distributary channel. This shows, as discussed above, that the size and the depth of the distributary channel are factors that influence the sand distribution among the channels and hence also the sand capturing efficiency. It should be noted that the authors did not have access to sediment concentrations in the overbank areas. Hence, we focused our calibration and analysis on the sediment behavior in the distributary channels. In future analysis, including the overbank sediment trend should be incorporated [57].
At the spatial scale of the full delta, it is important for predictive tools to provide a reasonable estimate of the overall size (footprint) of the deltaic growth (shown in Figure 10). This is particularly important for models used to evaluate the viability of restoration projects. For example, in Louisiana, sediment diversions off the Mississippi River are considered as a restoration strategy to create land in the outfall area. Numerical models are used to provide estimates of the footprint of the delta created by these diversions. An analogue such as the Wax Lake Delta studied here presents an opportunity to evaluate the ability of these morphodynamic models to provide reasonable estimates of the deltaic growth. The level of agreement shown in Figure 9 appears to provide confirmation that these models can be used as reliable tools for the analysis.
Further, the proportions of flow and sediment in distributary channels can vary over time in response to deltaic growth and morphologic changes in the distributary channels [58,59]. Thus, spatial distribution of flow and sediment can vary over time, which will affect the overall delta morphology. The frequency or the timeline of the change in flow and sediment dynamics in the channels are still unknown.
There are both local and regional effects that control the balance of water and sediment in the distributary channels and help maintain the dynamic equilibrium of the delta [58,59,60]. The regional effects are largely dependent on the available upstream water and sediment loading and the water surface slope among the channels. During high flow, the delta is often inundated, and flow exchange occurs between channels and islands. As a result, sediment and nutrients are distributed over the entire delta. By comparison, during low discharge, flow is mostly confined in channels and the distribution depends on water surface slope, plus flow direction, i.e., flood versus ebb tide dominance. This toggle between high and low flow periods, along with the associated variability in water and sediment capture, has a stabilizing effect by preventing predominant growth of a given channel [61]. The upstream flow of the WLD is controlled based on the flow split at the old river control structure and has been unaltered since the corps of engineers constructed the channel. Historical data of the distributary channel cross-sections, including satellite images of the WLD, show that the depth and width of the channels have adjusted to maintain the channel carrying capacity, and most bifurcations have been in place and active between 1984 and 2017 (https://earthobservatory.nasa.gov/world-of-change/WaxLake, accessed on 10 May 2021). Hence, the WLD is considered to be in a relative state of dynamic equilibrium.
6. Conclusions
Two numerical models were developed for the Wax Lake Delta, Louisiana, USA; a 3D steady-state hydrodynamic and sediment transport model, and a depth-averaged unsteady morphodynamic model, both of which were calibrated and validated against field observations. The three-dimensional hydrodynamic and sediment transport model was used to provide insights into water and sediment distribution among the interconnected distributary channels under two flow conditions, one high-flow and one low-flow. The 3D model result shows that the length and slope of individual channels were key factors controlling the sediment and water distribution. Therefore, the shorter channels on the eastern side compared to those on the western side, along with the overall landscape slope, resulted in larger water and sediment being conveyed through the eastern side. Further, 47% of the flow exits the system as channelized flow and the remaining 53% crosses over the islands. The significant amount of water flowing as overbank flow provides a significant opportunity for sediment deposition, and offers insight into the ability of the Wax Lake to continue to prograde and grow during the past few decades. The Sediment Water Ratio (SWR) for both sand and fine sediment was also calculated using the 3D model to investigate the sediment capturing efficiency of the distributary channels. The SWR for sand varied among the channels due to varying geometric attributes of the channels, whereas the SWR for fine sediment (silt and clay) was found to be consistent and approximately unity in all the distributary channels. This confirms that the distribution of fine sediment through bifurcating channels is relative to incoming flow and fine material hydrograph at the delta apex.
The approximately circular symmetric depositional pattern of the prototype WLD was well reproduced by the depth-averaged morphodynamic model for the 15-year period from 1998–2012. The model results show an average growth rate of 1.9 km2/year for the 15-year period, which is comparable to estimates of the actual delta growth. Furthermore, longer term flow and sediment distribution analysis in the distributary channels demonstrates that the WLD is in a dynamic equilibrium. The sustained flow and sediment upstream supply, in addition to the directional change of flow and sediment captured among channels for various flow conditions, have a stabilizing effect on the delta morphodynamics and help maintain the long-term equilibrium configuration.
Author Contributions
Conceptualization, E.M.; methodology, E.M., K.S. and A.K.; validation, E.M., K.S. and A.K.; formal analysis, E.M., K.S. and A.K.; investigation, E.M., K.S. and A.K.; data curation, K.S. and A.K.; writing—original draft preparation, E.M., K.S. and A.K.; writing—review and editing, E.M., K.S. and A.K.; visualization, K.S. and A.K.; supervision, E.M.; project administration, E.M.; funding acquisition, E.M. All authors have read and agreed to the published version of the manuscript.
Funding
This research was funded by the National Science Foundation NSF 10-577—FSED Type II: A Delta Dynamics Collaboratory.
Institutional Review Board Statement
Not applicable.
Informed Consent Statement
No applicable.
Data Availability Statement
Not applicable.
Conflicts of Interest
The authors declare no conflict of interest. The funders had no role in the design of the study; in the collection, analyses, or interpretation of data; in the writing of the manuscript, or in the decision to publish the results.
Appendix A
This appendix provides additional comparisons between modeled and measured water level, discharge, and velocities.
Figure A1.
Map showing location of water level, discharge, and velocity measurements.

Figure A2.
Comparison of modeled and measured water level within the Wax Lake Delta—see Figure A1 for locations.
Figure A2.
Comparison of modeled and measured water level within the Wax Lake Delta—see Figure A1 for locations.

Figure A3.
Comparison of modeled and measured discharge at select distributary channel locations—see Figure A1 for locations.
Figure A3.
Comparison of modeled and measured discharge at select distributary channel locations—see Figure A1 for locations.

Figure A4.
Comparison of modeled and measured (ADCP) velocities at select distributary channel locations—see Figure A1 for locations.
Figure A4.
Comparison of modeled and measured (ADCP) velocities at select distributary channel locations—see Figure A1 for locations.

References
- Syvitski, J.P.M.; Kettner, A.J.; Overeem, I.; Hutton, E.W.H.; Hannon, M.T.; Brakenridge, G.R.; Day, J.W.; Vorosmarty, C.J.; Saito, Y.; Giosan, L.; et al. Sinking deltas due to human activities. Nat. Geosci. 2009, 2, 681–686. [Google Scholar] [CrossRef]
- Wright, L.D. Sediment transport and deposition at river mouths: A synthesis. GSA Bull. 1977, 88, 857–868. [Google Scholar] [CrossRef]
- Ericson, J.P.; Vorosmarty, C.; Dingman, S.L.; Ward, L.G.; Meybeck, M. Effective sea-level rise and deltas: Causes of change and human dimension implications. Glob. Planet. Chang. 2006, 50, 63–82. [Google Scholar] [CrossRef]
- Syvitski, J.P.; Saito, Y. Morphodynamics of deltas under the influence of humans. Glob. Planet. Chang. 2007, 57, 261–282. [Google Scholar] [CrossRef]
- Day, J.W., Jr.; Pont, D.; Hensel, P.F.; Ibanez, C. Impacts of sea-level rise on deltas in the Gulf of Mexico and the Medi-terranean: The importance of pulsing events to sustainability. Estuaries 1995, 18, 636–647. [Google Scholar] [CrossRef]
- Allison, M.A.; Meselhe, E.A. The use of large water and sediment diversions in the lower Mississippi River (Louisiana) for coastal restoration. J. Hydrol. 2010, 387, 346–360. [Google Scholar] [CrossRef]
- Gaweesh, A.; Meselhe, E. Evaluation of Sediment Diversion Design Attributes and Their Impact on the Capture Efficiency. J. Hydraul. Eng. 2016, 142, 04016002. [Google Scholar] [CrossRef]
- Hanegan, K. Modeling Evolution of the Wax Lake Delta in Atchafalaya Bay, Louisiana; Delft University of Technology: Delft, The Netherlands, 2011. [Google Scholar]
- Kim, W.; Mohrig, D.; Twilley, R.; Paola, C.; Parker, G. Is It Feasible to Build New Land in the Mississippi River Delta? Eos Trans. Am. Geophys. Union 2009, 90, 373–374. [Google Scholar] [CrossRef]
- Meselhe, E.A.; Sadid, K.M.; Allison, M.A. Riverside morphological response to pulsed sediment diversions. Geomorphology 2016, 270, 184–202. [Google Scholar] [CrossRef] [Green Version]
- Yuill, B.T.; Khadka, A.K.; Pereira, J.; Allison, M.A.; Meselhe, E.A. Morphodynamics of the erosional phase of crevasse-splay evolution and implications for river sediment diversion function. Geomorphology 2016, 259, 12–29. [Google Scholar] [CrossRef]
- Galloway, W. Process framework for describing the morphologic and stratigraphic evolution of deltaic depositional system. AAPG 1975, 31, 127–156. [Google Scholar]
- Orton, G.J.; Reading, H.G. Variability of deltaic processes in terms of sediment supply, with particular emphasis on grain size. Sedimentology 1993, 40, 475–512. [Google Scholar] [CrossRef]
- Caldwell, R.L.; Edmonds, D.A. The effects of sediment properties on deltaic processes and morphologies: A numerical modeling study. J. Geophys. Res. Earth Surf. 2014, 119, 961–982. [Google Scholar] [CrossRef]
- Edmonds, D.A.; Slingerland, R.L. Significant effect of sediment cohesion on delta morphology. Nat. Geosci. 2010, 3, 105–109. [Google Scholar] [CrossRef]
- Geleynse, N.; Storms, J.E.; Walstra, D.-J.R.; Jagers, H.A.; Wang, Z.B.; Stive, M.J. Controls on river delta formation; insights from numerical modelling. Earth Planet. Sci. Lett. 2011, 302, 217–226. [Google Scholar] [CrossRef]
- Liang, M.; Kim, W.; Passalacqua, P. How much subsidence is enough to change the morphology of river deltas? Geophys. Res. Lett. 2016, 43, 10. [Google Scholar] [CrossRef]
- Liang, M.; Van Dyk, C.; Passalacqua, P. Quantifying the patterns and dynamics of river deltas under conditions of steady forcing and relative sea level rise. J. Geophys. Res. Earth Surf. 2016, 121, 465–496. [Google Scholar] [CrossRef]
- Coleman, J.M. Dynamic changes and processes in the Mississippi River delta. GSA Bull. 1988, 100, 999–1015. [Google Scholar] [CrossRef]
- Day, G.; Dietrich, W.E.; Rowland, J.C.; Marshall, A. The depositional web on the floodplain of the Fly River, Papua New Guinea. J. Geophys. Res. Space Phys. 2008, 113. [Google Scholar] [CrossRef] [Green Version]
- Syvitski, J.P.; Kettner, A.J.; Correggiari, A.; Nelson, B.W. Distributary channels and their impact on sediment dispersal. Mar. Geol. 2005, 222–223, 75–94. [Google Scholar] [CrossRef]
- Hiatt, M.; Passalacqua, P. Hydrological connectivity in river deltas: The first-order importance of channel-island exchange. Water Resour. Res. 2015, 51, 2264–2282. [Google Scholar] [CrossRef] [Green Version]
- Edmonds, D.A.; Paola, C.; Hoyal, D.C.J.D.; Sheets, B.A. Quantitative metrics that describe river deltas and their channel networks. J. Geophys. Res. Space Phys. 2011, 116, 4. [Google Scholar] [CrossRef]
- Edmonds, D.A.; Slingerland, R.L. Mechanics of river mouth bar formation: Implications for the morphodynamics of delta distributary networks. J. Geophys. Res. Space Phys. 2007, 112. [Google Scholar] [CrossRef] [Green Version]
- Jerolmack, D.J.; Swenson, J.B. Scaling relationships and evolution of distributary networks on wave-influenced deltas. Geophys. Res. Lett. 2007, 34, 5. [Google Scholar] [CrossRef] [Green Version]
- Tejedor, A.; Longjas, A.; Zaliapin, I.; Foufoula-Georgiou, E. Delta channel networks: 1. A graph-theoretic approach for studying connectivity and steady state transport on deltaic surfaces. Water Resour. Res. 2015, 51, 3998–4018. [Google Scholar] [CrossRef]
- Tejedor, A.; Longjas, A.; Zaliapin, I.; Foufoula-Georgiou, E. Delta channel networks: 2. Metrics of topologic and dynamic complexity for delta comparison, physical inference, and vulnerability assessment. Water Resour. Res. 2015, 51, 4019–4045. [Google Scholar] [CrossRef]
- Roberts, H.H.; Coleman, J.M.; Bentley, S.J.; Walker, N. An Embryonic Major Delta Lobe: A New Generation of Delta Studies in the Atchafalaya-Wax Lake Delta System. AAPG 2003, 53, 690–703. [Google Scholar]
- Roberts, H.H. Evolution of Sedimentary Architecture and Surface Morphology: Atchafalaya and Wax Lake Deltas (1973-1994): ABSTRACT. AAPG Bull. 1997, 81, 47. [Google Scholar] [CrossRef]
- Allen, Y.C.; Couvillion, B.R.; Barras, J.A. Using Multitemporal Remote Sensing Imagery and Inundation Measures to Improve Land Change Estimates in Coastal Wetlands. Chesap. Sci. 2012, 35, 190–200. [Google Scholar] [CrossRef]
- Shaw, J.B.; Estep, J.D.; Whaling, A.R.; Sanks, K.M.; Edmonds, D.A. Measuring subaqueous progradation of the Wax Lake Delta with a model of flow direction divergence. Earth Surf. Dyn. 2018, 6, 1155–1168. [Google Scholar] [CrossRef] [Green Version]
- DuMars, A.J. Distributary Mouth Bar Formation and Channel Bifurcation in the Wax Lake Delta, Atchafalaya Bay, Louisiana; Louisiana State University: Baton Rouge, LA, USA, 2002. [Google Scholar]
- Deltares. Delft3D-FLOW User Manual; Deltares: Delft, The Netherlands, 2014. [Google Scholar]
- Lesser, G.; Roelvink, J.; van Kester, J.; Stelling, G. Development and validation of a three-dimensional morphological model. Coast. Eng. 2004, 51, 883–915. [Google Scholar] [CrossRef]
- Van Rijn, L.C. Unified view of sediment transport by current and waves. II: Suspended transport. J. Hydraul. Eng. 2007, 133, 668–689. [Google Scholar] [CrossRef]
- Van Rijn, L.C. Unified view of sediment transport by current and waves. I: Initiation of motion, bed roughness, and bed-load transport. J. Hydraul. Eng. 2007, 133, 649–667. [Google Scholar] [CrossRef] [Green Version]
- Van Rijn, L.C. Unified view of sediment transport by currents and waves. III: Graded beds. J. Hydraul. Eng. 2007, 133, 761–775. [Google Scholar] [CrossRef] [Green Version]
- Elias, E.; Teske, R.; Van Der Spek, A.; Lazar, M. Modelling tidal-inlet morphodynamics on medium time scales. In The Proceedings of the Coastal Sediments 2015; World Scientific: San Diego, CA, USA, 2015. [Google Scholar] [CrossRef]
- Partheniades, E. Erosion and Deposition of Cohesive Soils. J. Hydraul. Div. 1965, 91, 105–139. [Google Scholar] [CrossRef]
- United States. Army. Corps of Engineers, Mississippi River Commission. Atchafalaya River hydrographic survey, 1998–1999: Old River to Atchafalaya Bay including main channel and distributarie. New Orleans, La.: The District. 1999. Available online: https://www.worldcat.org/title/atchafalaya-river-hydrographic-survey-1998-1999-old-river-to-atchafalaya-bay-including-main-channel-and-distributaries/oclc/45169665 (accessed on 10 May 2021).
- Roberts, H.H.; Walker, N.; Cuningham, R.; Kemp, G.P.; Majersk, S.Y. Evolution of Sedimentary Architecture and Surface Morphology: Atchafalaya and Wax Lake Delta, Louisiana (1973–1994); Gulf Coast Association of Geological Societies Transactions XL VII: 477–484; University of Texas at Austin, University Station: Austin, TX, USA, 1997. [Google Scholar]
- Roberts, H.H.; DeLaune, R.D.; White, J.; Li, C.; Braud, D.; Weeks, E. Delta Development and Coastal Marsh Accretion During Cold Front. Passages and River Floods: Relevance to River Diversions–Final Report; Prepared for Coastal Protection and Restoration Authority; Coastal Studies Institute, Louisiana State University: Baton Rouge, LA, USA, 2016; 132p. [Google Scholar]
- U.S. Army Corps of Engineers (USACE). Atchafalaya River System, 2006 Hydrographic Survey: Old River to Atchafalaya Bay and Distributaries; U.S. Army Corps of Engineers, New Orleans District: New Orleans, LA, USA, 2006.
- Shaw, J.B.; Mohrig, D.; Whitman, S.K. The morphology and evolution of channels on the Wax Lake Delta, Louisiana, USA. J. Geophys. Res. Earth Surf. 2013, 118, 1562–1584. [Google Scholar] [CrossRef]
- Thomas, W.A.; Heath, R.E.; Stewart, J.P.; Clark, D.G. The Atchafalaya River Delta. Report 5, The Atchafalaya River Delta Quasi-Two-Dimensional Model of Delta Growth and Impacts on River Stages; Army Engineer Waterways Experiment Station, Hydraulics Lab: Vicksburg, MS, USA, 1988. [Google Scholar]
- Ranasinghe, R.; Swinkels, C.; Luijendijk, A.; Roelvink, D.; Bosboom, J.; Stive, M.; Walstra, D. Morphodynamic upscaling with the MORFAC approach: Dependencies and sensitivities. Coast. Eng. 2011, 58, 806–811. [Google Scholar] [CrossRef]
- McCorquodale, J.A.; Amini, S.; Teran, G.; Gurung, T.; Kenny, S.; Gaweesh, A.; Meselhe, E.; Pereira, J. Development and Application of a Regional 3-D Model. for the Lower Mississippi River. Report. Mississippi Hydrodynamic and Delta Management Study; Prepared for and Funded by the Coastal Protection and Restoration Authority: Baton Rouge, LA, USA, 2017.
- van Rijn, L.; Walstra, D.; Grasmeijer, B.; Sutherland, J.; Pan, S.; Sierra, J. The predictability of cross-shore bed evolution of sandy beaches at the time scale of storms and seasons using process-based Profile models. Coast. Eng. 2003, 47, 295–327. [Google Scholar] [CrossRef]
- Sendrowski, A.; Sadid, K.; Meselhe, E.; Wagner, W.; Mohrig, D.; Passalacqua, P. Transfer Entropy as a Tool for Hydrodynamic Model Validation. Entropy 2018, 20, 58. [Google Scholar] [CrossRef] [Green Version]
- Foufoula-Georgiou, E. NCED 2010 Annual Report; National Center for Earth-surface Dynamics Annual Progress Reports; University of Minnesota Twin Cities: Minneapolis, MN, USA, May 2010. [Google Scholar]
- Canestrelli, A.; Spruyt, A.; Jagers, B.; Slingerland, R.; Borsboom, M. A mass-conservative staggered immersed boundary model for solving the shallow water equations on complex geometries. Int. J. Numer. Methods Fluids 2015, 81, 151–177. [Google Scholar] [CrossRef]
- Spruyt, A.; Mosselman, E.; Jagers, B. A new approach to river bank retreat and advance in 2D numerical models of fluvial morphodynamics. In Proceedings of the IAHS Symposium of River, Coastal and Estuarine Morphodynamics, Beijng, China, 6–8 September 2011. [Google Scholar]
- Meselhe, E.A.; Georgiou, I.; Allison, M.A.; McCorquodale, J.A. Numerical modeling of hydrodynamics and sediment transport in lower Mississippi at a proposed delta building diversion. J. Hydrol. 2012, 472–473, 340–354. [Google Scholar] [CrossRef]
- Miori, S.; Repetto, R.; Tubino, M. A one-dimensional model of bifurcations in gravel bed channels with erodible banks. Water Resour. Res. 2006, 42, W11413, pages 1–12. [Google Scholar] [CrossRef]
- Edmonds, D.A.; Slingerland, R.L. Stability of delta distributary networks and their bifurcations. Water Resour. Res. 2008, 44. [Google Scholar] [CrossRef]
- Lane, E.W. Discussion of “The Importance of Fluvial Morphology in Hydraulic Engineering”. J. Hydraul. Div. 1956, 82, 1092–1095. [Google Scholar] [CrossRef]
- Wallace, J.; Stewart, L.; Hawdon, A.; Keen, R.; Karim, F.; Kemei, J. Flood water quality and marine sediment and nutrient loads from the Tully and Murray catchments in north Queensland, Australia. Mar. Freshw. Res. 2009, 60, 1123–1131. [Google Scholar] [CrossRef] [Green Version]
- Nelson, J.M.; Kinzel, P.J.; Thanh, M.D.; Toan, D.D.; Shimizu, Y.; McDonald, R.R. Mechanics of Flow And Sediment Transport In Delta Distributary Channels. In Proceedings of the 2011 EIT International Conference on Water Resources Engineering, Phetchaburi, Thailand, 18–19 August 2011; pp. 8–14. [Google Scholar]
- Shaw, J.B.; Mohrig, D.; Wagner, R.W. Flow patterns and morphology of a prograding river delta. J. Geophys. Res. Earth Surf. 2016, 121, 372–391. [Google Scholar] [CrossRef]
- Bolla Pittaluga, M.; Repetto, R.; Tubino, M. Channel bifurcation in braided rivers: Equilibrium configurations and stability. Water Resour. Res. 2003, 39. [Google Scholar] [CrossRef]
- Edmonds, D.A. Stability of backwater-influenced river bifurcations: A study of the Mississippi-Atchafalaya system. Geophys. Res. Lett. 2012, 39. [Google Scholar] [CrossRef] [Green Version]
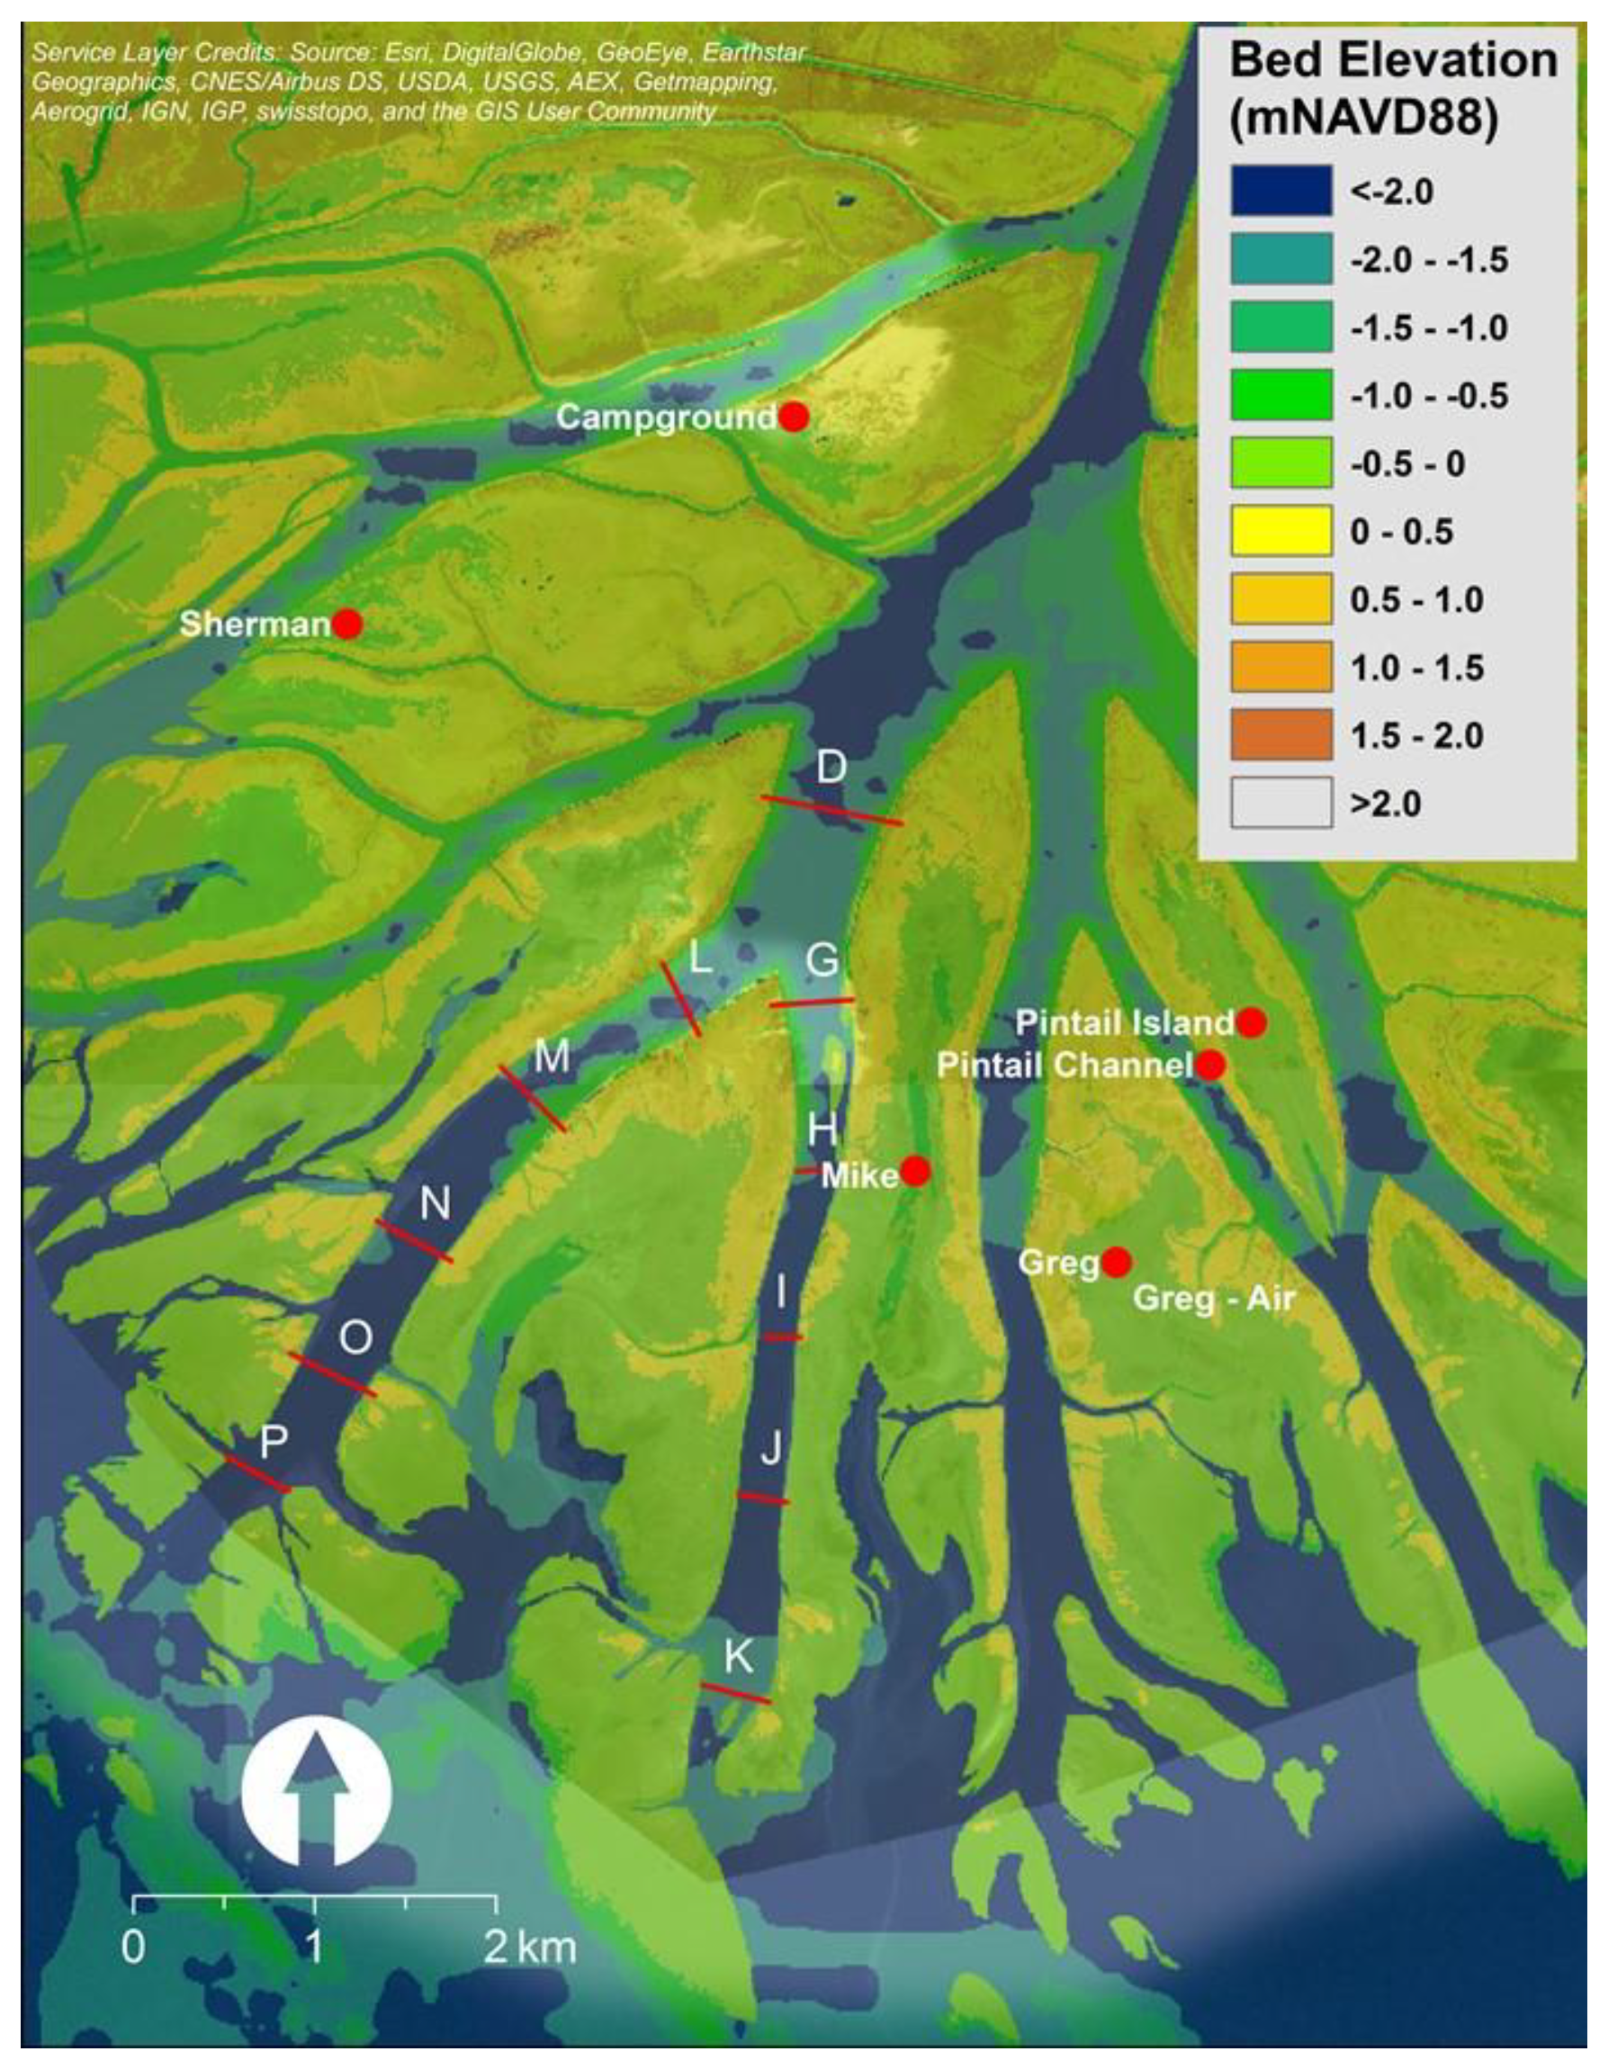
Figure 1.
Map of the study area. Red dots show the stations used to prescribe the model boundary conditions, and the white lines represent transect locations where field measurement were made.
Figure 1.
Map of the study area. Red dots show the stations used to prescribe the model boundary conditions, and the white lines represent transect locations where field measurement were made.

Figure 2.
Assessment of acceleration factor (MORFAC) on morphological changes.

Figure 3.
Calibration results showing comparison of modeled and observed velocities at Greg Pass.

Figure 4.
Calibration results showing comparison of modeled and observed streamwise velocities at Gadwall Pass.
Figure 4.
Calibration results showing comparison of modeled and observed streamwise velocities at Gadwall Pass.

Figure 5.
Validation results showing comparison of modeled and observed streamwise velocities at East Pass.
Figure 5.
Validation results showing comparison of modeled and observed streamwise velocities at East Pass.

Figure 6.
Validation results showing comparison of modeled and observed streamwise velocities at East Pass (further downstream).
Figure 6.
Validation results showing comparison of modeled and observed streamwise velocities at East Pass (further downstream).

Figure 7.
Validation results showing comparison of modeled and observed streamwise velocities upstream of East Pass, Gregg Pass, and Pintail Pass.
Figure 7.
Validation results showing comparison of modeled and observed streamwise velocities upstream of East Pass, Gregg Pass, and Pintail Pass.

Figure 8.
Validation results for total suspended vertical profiles at select transects.

Figure 9.
Land change trends for Wax Lake Delta (in km2). The model predicted delta areas are represented by black circles and the delta growth trend line is represented by black dashed lines. Observed delta area is represented by grey circles and the trend line is represented by solid grey line.
Figure 9.
Land change trends for Wax Lake Delta (in km2). The model predicted delta areas are represented by black circles and the delta growth trend line is represented by black dashed lines. Observed delta area is represented by grey circles and the trend line is represented by solid grey line.

Figure 10.
(a) Simulated topography of the Wax Lake Delta from 1998 to 2012. (b) Simulated cumulative erosion/deposition pattern in the Wax Lake Delta during 1998–2012.
Figure 10.
(a) Simulated topography of the Wax Lake Delta from 1998 to 2012. (b) Simulated cumulative erosion/deposition pattern in the Wax Lake Delta during 1998–2012.

Figure 11.
Simulated distribution of water, total sediment, sand, and fine sediment transport at the channel networks for a river flood event (% are calculated with respect to the value at the delta apex). Text in orange is a naming convention of the channels whereas text in blue color represents percentage values of flow and sediment distribution.

Figure 12.
Simulated morphological changes in the Wax Lake Delta Channels over 15-year period (1998–2012). (a) Aerial map showing location of longitudinal and cross-section transects. (b–f) Longitudinal transects for five distributary channels. Distances are with respect to the delta apex. (g1–g2,h1–h2) Transects passing through islands and channels showing channel incision, channel narrowing due to edge accretion, and island aggradation after 15 years.


Figure 13.
Correlation of SWR-Sand with (a) distributary channel capacity (QD = flow entering distributary channel, QA = flow at delta apex) and (b) elevation (YD = distributary channel depth, YA = delta apex depth).
Figure 13.
Correlation of SWR-Sand with (a) distributary channel capacity (QD = flow entering distributary channel, QA = flow at delta apex) and (b) elevation (YD = distributary channel depth, YA = delta apex depth).

Figure 14.
Flow and sediment (total- fines and sand) distribution in the distributary channels for 30 years. The first 15-year simulation ends in year 2012.
Figure 14.
Flow and sediment (total- fines and sand) distribution in the distributary channels for 30 years. The first 15-year simulation ends in year 2012.

Figure 15.
The percent change in discharge ratio at the bifurcation downstream of the Wax Lake delta apex. Q = the actual flow rates of the WLD from 1998–2012, and Q-half = the flow rates from 1998–2012 are reduced by 50%.
Figure 15.
The percent change in discharge ratio at the bifurcation downstream of the Wax Lake delta apex. Q = the actual flow rates of the WLD from 1998–2012, and Q-half = the flow rates from 1998–2012 are reduced by 50%.


Table 1.
The calibrated values of sediment properties.
| Coarse Sediment | |||
|---|---|---|---|
| Class | D50 (mm) | Suspended Load Factor | Bed Load Factor |
| Sand | 100 (80–150) * | 1.0 (0.5–2.0) | 1.0 (0.5–2.0) |
| Fine Sediment | |||
| Class | Settling Velocity (mm/s) | Critical Shear Stress (Pa) | Erosion Rate (km/m2/s) |
| Silt | 0.1 (1.0–0.001) | 1.3 (1.0–1.5) | 1 × 10⁻⁴ (1 × 10⁻³–1 × 10⁻⁵) |
| Clay | 0.001 (0.1–0.0001) | 1.3 (1.0–1.5) | 1 × 10⁻⁴ (1 × 10⁻³–1 × 10⁻⁵) |
* Range of values tested for model sensitivity are presented in parenthesis.
Table 2.
Flow and sediment distribution in the WLD channels during river flood.
| Channels | Flow (m3/s) | Sand (M.tons/d) | Fines (M.tons/d) | SWR (Sand) | SWR (Fines) |
|---|---|---|---|---|---|
| Delta Apex | 3900 | 188,670 | 15,330 | ||
| A | 330 | 14,670 | 380 | 0.3 | 0.97 |
| B | 3570 | 176,380 | 14,480 | 1.03 | 1.02 |
| 1 (Mallard) | 450 | 21,050 | 570 | 0.32 | 1.02 |
| 2 | 1650 | 82,000 | 6290 | 0.97 | 1.03 |
| 3 | 700 | 33,340 | 1910 | 0.7 | 1.01 |
| 4 (East) | 570 | 25,480 | 710 | 0.32 | 0.98 |
| 5 (Gadwall) | 860 | 40,860 | 1340 | 0.39 | 1.03 |
| 6 (Main) | 630 | 29,340 | 760 | 0.31 | 1.02 |
| 7 (Gregg) | 420 | 18,860 | 290 | 0.2 | 0.99 |
| 8 (Pintail) | 280 | 12,570 | 190 | 0.2 | 0.99 |
Publisher’s Note: MDPI stays neutral with regard to jurisdictional claims in published maps and institutional affiliations. |
© 2021 by the authors. Licensee MDPI, Basel, Switzerland. This article is an open access article distributed under the terms and conditions of the Creative Commons Attribution (CC BY) license (https://creativecommons.org/licenses/by/4.0/).
Share and Cite
MDPI and ACS Style
Meselhe, E.; Sadid, K.; Khadka, A. Sediment Distribution, Retention and Morphodynamic Analysis of a River-Dominated Deltaic System. Water 2021, 13, 1341. https://doi.org/10.3390/w13101341
AMA Style
Meselhe E, Sadid K, Khadka A. Sediment Distribution, Retention and Morphodynamic Analysis of a River-Dominated Deltaic System. Water. 2021; 13(10):1341. https://doi.org/10.3390/w13101341
Chicago/Turabian StyleMeselhe, Ehab, Kazi Sadid, and Ashok Khadka. 2021. "Sediment Distribution, Retention and Morphodynamic Analysis of a River-Dominated Deltaic System" Water 13, no. 10: 1341. https://doi.org/10.3390/w13101341
Note that from the first issue of 2016, this journal uses article numbers instead of page numbers. See further details here.