
Sediment Nutrient Flux Rates in a Shallow, Turbid Lake Are More Dependent on Water Quality Than Lake Depth


1
Department of Biology, Tennessee Technological University, Cookeville, TN 38505, USA
2
Tennessee Department of Environment and Conservation, Memphis Environmental Field Office, Barlett, TN 38133, USA
3
USDA-ARS National Sedimentation Laboratory, Oxford, MS 38655, USA
*
Author to whom correspondence should be addressed.
Water 2021, 13(10), 1344; https://doi.org/10.3390/w13101344
Submission received: 18 March 2021
/
Revised: 1 May 2021
/
Accepted: 5 May 2021
/
Published: 12 May 2021
(This article belongs to the Special Issue Water Quality and Ecological Aspects of Aquatic Ecosystems Influenced by Agricultural Activity)
Abstract
:The bottom sediments of shallow lakes are an important nutrient sink; however, turbidity may alter the influence of water depth on sediment nutrient uptake by reducing light and associated oxic processes, or altering nutrient availability. This study assessed the relative influence of water quality vs. water depth on sediment nutrient uptake rates in a shallow agricultural lake during spring, when sediment and nutrient loading are highest. Nitrate and soluble reactive phosphorus (SRP) flux rates were measured from sediment cores collected across a depth and spatial gradient, and correlated to water quality. Overlying water depth and distance to shore did not influence rates. Both nitrate and SRP sediment uptake rates increased with greater Secchi depth and higher water temperature, and nitrate and SRP rates increased with lower water total N and total P, respectively. The importance of water temperature on N and P cycling was confirmed in an additional experiment; however, different patterns of nitrate reduction and denitrification suggest that alternative N2 production pathways may be important. These results suggest that water quality and temperature can be key drivers of sediment nutrient flux in a shallow, eutrophic, turbid lake, and water depth manipulation may be less important for maximizing spring runoff nutrient retention than altering water quality entering the lake.
1. Introduction
Anthropogenic activities have altered almost every major aquatic ecosystem around the world, including dramatically increasing pollutants from the landscape to receiving waters [1]. Agriculture, specifically, is responsible for biodiversity loss and the degradation of land and freshwater resources [2], and nutrient runoff from crop fertilizer is the largest nutrient source into surface waters globally [3]. These inputs can increase surface water productivity and accelerate lake and stream eutrophication, which can degrade water quality, aquatic habitat and communities, and recreational activities [4,5]. Excess nutrients can also fuel the growth of heterotrophic microbiota that further increases the system’s oxygen (O2) demand and exacerbate hypoxia [6,7]. These effects occur locally in agroecosystems, but nutrients can also be transported hundreds of kilometers downstream and affect coastal environments. Understanding the conditions that control nutrient removal pathways in water bodies that directly receive runoff is crucial to minimizing downstream fluxes.
The Mississippi River Basin covers approximately 40% of the United States and accounts for 90% of the freshwater inflow to the Gulf of Mexico [8]. The Mississippi and Ohio–Tennessee river basins have severe local and regional water quality problems and contribute a significant portion of the nitrogen (N) and phosphorus (P) loading to the Northern Gulf of Mexico. These nutrients have caused seasonal hypoxia (dissolved oxygen (DO) < 2 mg/L) in the lower water column that has negatively impacted the health of the Gulf of Mexico ecosystem [9,10]. Within the original alluvial plain of the Lower Mississippi River Basin, over 80% of the land known as the “Delta” is used for row crop agriculture, which has placed numerous stressors onto local freshwater systems [11]. Lakes and streams in the Delta suffer most from excessive sediment, nutrients, and pesticides associated with agricultural runoff [11]. Oxbow lakes in the Delta undergo natural depth reduction due to sedimentation from the surrounding watershed and often turn into slow-moving, wetland-type bodies of water over the course of centuries [12,13,14,15]. Many Delta oxbow lakes are equipped with water control weirs that can directly control lake depth, and lakes are connected to the larger regional rivers through small inflow and outflow channels. Therefore, these lakes are more indicative of bayou systems with fluctuating water depths whose hydrology depends both on precipitation and local irrigation practices. Delta lakes are extremely slow-flowing, creating a system of connected shallow lakes, streams, and wetlands channeling water across the large, flat alluvial plain and therefore have the potential to greatly influence nutrient removal rates.
Shallow lake sediments can be both sinks and sources of nutrients depending on system hydrology as well as spatial and temporal variation in physicochemical sediment characteristics [16,17,18,19]. Nutrient retention can occur through burial in sediments in mineral form during sedimentation, microbial, algae, or plant uptake, or permanent loss through denitrification [20]. Denitrification is the anoxic process whereby bacteria produce nitrogen gas (N2), or nitrous oxide gas (N2O), by using NO3− or NO2− as terminal electron acceptors for respiration when oxygen availability is low [21,22]. This process permanently removes nitrogen from the aquatic environment into the atmosphere, so is often emphasized in N pollution remediation. Agricultural lake sediments can be hotspots for denitrification due to high organic matter accumulation, high NO3− in the overlying water column, and predominant low O2 conditions at the water–sediment interface [23,24]. Sediment deposition can also benefit downstream water quality by reducing the concentration of suspended solids and turbidity of surface waters, which in turn retains P and other nutrients sorbed to suspended sediments [25]. Slow-flowing lakes produce a longer water residence time that allows excess particles to settle and nutrients to be retained or removed from the system before transport downstream to alter coastal and open ocean environments [22,26,27]. Research regarding sediment P dynamics has been a special emphasis as it is considered a global issue affecting eutrophication [28,29,30,31]. Multiple factors can influence nutrient removal rates, including the aforementioned conditions, as well as redox potential, pH, and temperature [24]. As a result, understanding lake sediment nutrient retention is fundamental to understanding their potential for nutrient runoff mitigation, as well as the eutrophication potential of these lakes receiving agricultural runoff.
This study investigated whether physicochemical or hydrological factors are more strongly correlated to sediment nutrient flux rates within an agriculturally influenced shallow lake in the Mississippi River alluvial valley. Roundaway Lake was used as a model system as it is representative of the hundreds of shallow, eutrophic, turbid lakes scattered throughout the Mississippi Delta region. Specifically, our goal was to assess the relative importance of water depth and water quality in promoting nutrient removal by lake sediments, as water levels in these lakes are not directly tied to precipitation and fluctuate with irrigation withdrawal and return flow. Here, water quality includes chemical and physical aspects, including nutrients, turbidity, and temperature. Our objectives were to determine whether sediment N and P flux rates (1) differed spatially in the lake relative to both upstream to downstream, and near shore to mid-lake location (i.e., with water depth); and (2) were correlated with varying water quality that occurs as spring pollutant pulses enter the lake and are processed over time. We conducted this study during spring, when water levels, nutrient, and sediment inputs are typically greatest due to precipitation runoff. This timing allowed for the greatest variation in lake depth and is a time of highest nutrient transport to downstream systems. We hypothesized that high turbidity would limit oxygen near sediments, leading to greater phosphate release, but potentially higher nitrate uptake. Less light reaching sediments will also create similar microbial autotrophic conditions throughout the lake regardless of depth, reducing the influence of depth on nutrient removal, and increasing the influence of water quality. This information can be used to ascertain if actively managing water quality or water quantity would be more effective at decreasing nutrient transport from agricultural landscapes during periods of high pollutant loading.
2. Materials and Methods
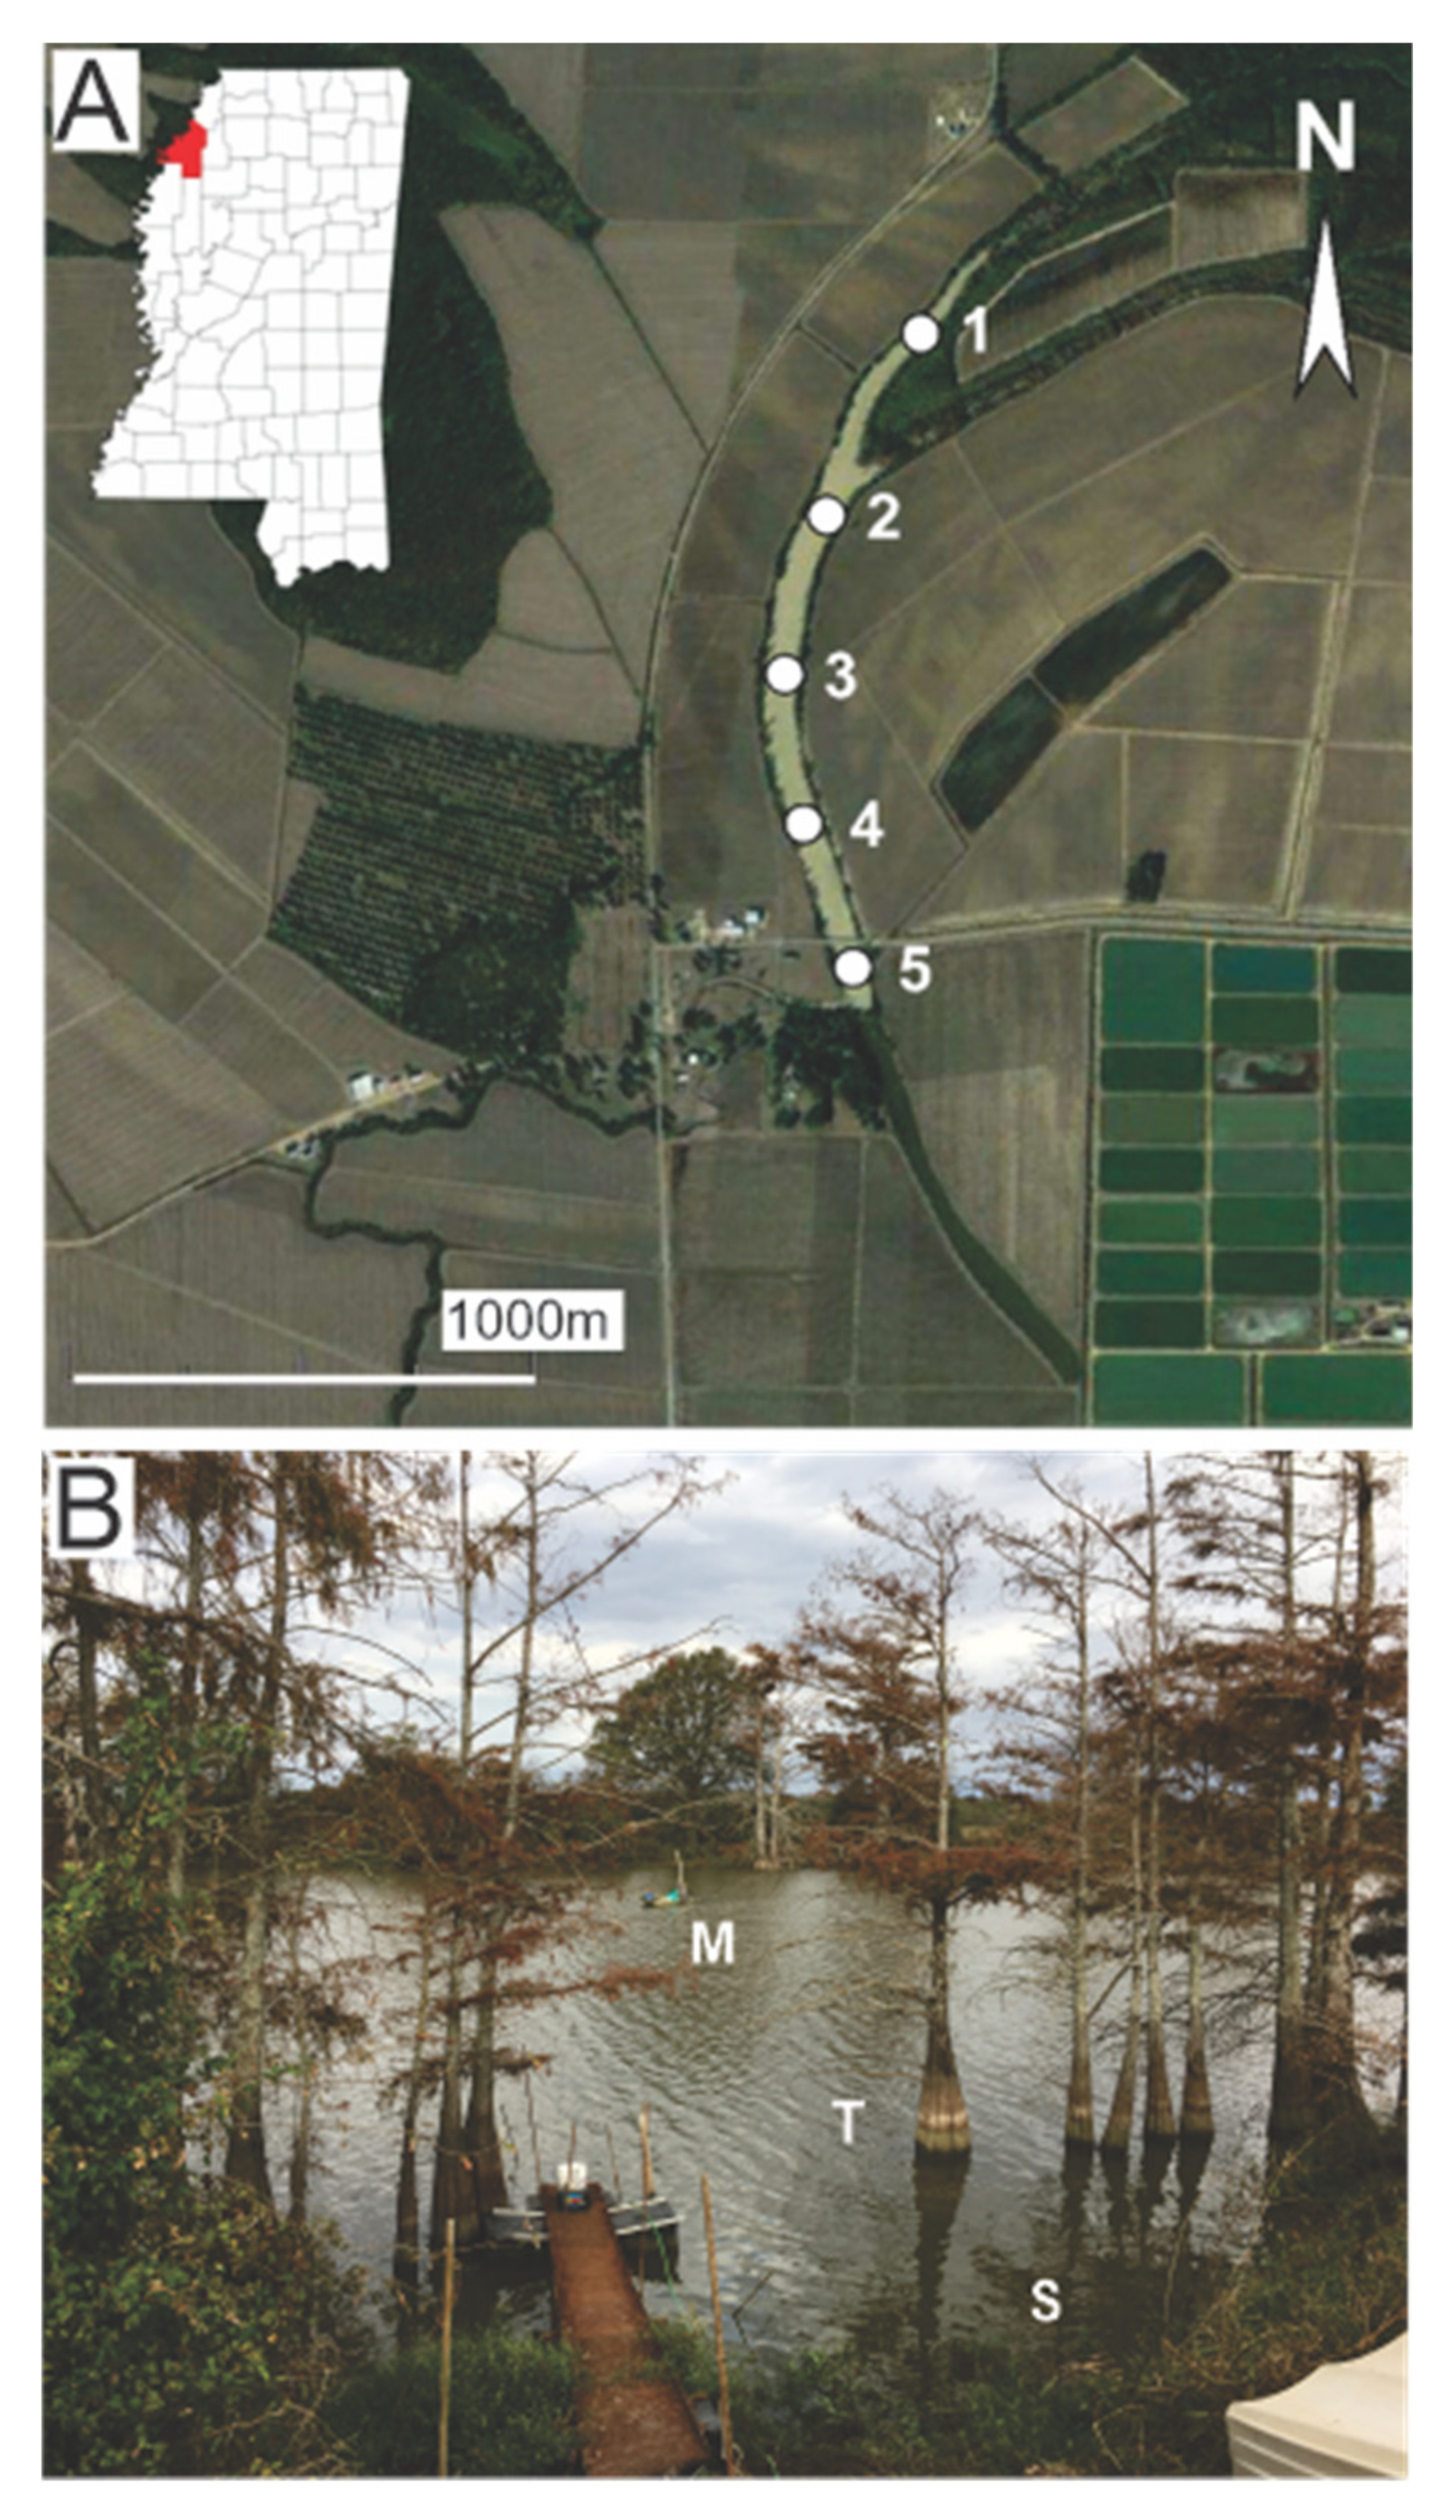
Field sampling was conducted in Roundaway Lake, Coahoma County, Mississippi (34°01′06.2′′ N 90°35′41.4′′ W). The lake has an approximate volume of 2.1 to 2.2 million m3, and the lake surface area is approximately 1.6 km2. A bathymetry map is provided as supplemental information (Figure S1). Roundaway Lake has a general U-shaped bottom morphology, with the greatest depth at mid-lake and a relatively steep sloping bottom towards the bank. The upstream and downstream sections are shallower than the middle section. The lake is considered a riverine oxbow, as it has inflow field drainage ditches to the north, and drains to the southwest into the Sunflower River (Figure 1A). Roundaway Lake is one of hundreds of oxbow lakes scattered throughout Northwestern Mississippi in the Mississippi Delta. The Mississippi Delta is a flat, lowland floodplain encompassing approximately 18,000 km2 of alluvial deposits, framed by the Mississippi River on the western boundary and the steep topography of the Bluff Hills on the eastern boundary [32]. As alluvial floodplain deposits are naturally rich in P and organic materials, the Delta has been converted over time to meet intense agricultural and flood control demands [11]. Today, approximately two-thirds of the region is cultivated in row crops, of which two-thirds is irrigated [33], often using both surface water and groundwater. Excess sediment, nutrients, and other contaminants in agricultural runoff have transformed much of the regional lakes and rivers into turbid, hypereutrophic ecosystems.
2.1. Field Sampling
2.1.1. Water Quality
Samples were collected during the spring and early summer months (April, May, and June) of 2017 to capture peak N inputs from fertilizer application and runoff, providing an estimate of the maximum potential flux rates. Five sites were established in the lake and distributed evenly from upstream (north end) to downstream to assess longitudinal sediment uptake variation (Figure 1A). Physicochemical parameters, sediment cores, and core incubation water were collected at each site.
Physicochemical parameters were collected in the middle of the lake at each site and measured at the top, middle, and bottom of the water column to characterize potential vertical variation. pH, temperature, conductivity, dissolved oxygen (DO), and oxidation-reduction potential (ORP) were collected via a water quality multiprobe (YSI 560 multimeter, Yellow Springs Instruments, Yellow Springs, OH). As a surrogate for suspended sediment, or mineral turbidity, depth of Secchi-disc visibility was measured to assess water clarity. Duplicate 250 mL water samples were collected at each depth and directly stored on ice in a cooler to assess primary producer biomass, organic matter content, and nutrients. In the laboratory, one bottle was frozen until it was used for total nitrogen (TN) and total phosphorus (TP) analysis. The second bottle was used for ash-free dry mass (AFDM) and chlorophyll a (chl-a) analysis. A 50 mL sample was filtered onto 0.7 µm pore size glass fiber filters for each AFDM and chl-a. Ashed and pre-weighed filters were used for AFDM. After filtration, AFDM filters were dried at 60 °C for 24 h, and then ashed at 500 °C for one hour. AFDM was estimated by subtracting the ash-free weight from the dry weight. Chlorophyll a filters were immediately frozen after filtration at −80 °C until analysis. Chlorophyll a was extracted from the filters using the hot ethanol extraction technique [34] and analyzed using the non-acidification technique [35] with a Tecan infinite M200Pro fluorometer (Tecan Life Science, Männedorf, Switzerland).
The filtrate from the filtered samples was analyzed for nitrate (NO3−) and soluble reactive phosphorus (SRP). Nitrate was measured using the second-derivative ultraviolet spectrophotometric method [36] and SRP was analyzed using the ascorbic acid colorimetric method [37,38]. Unfiltered samples were analyzed for TN and TP using the persulfate digestion method [39], and then analyzed for NO3− and SRP as described above.
2.1.2. Sediment Cores
Three sediment cores were collected at each site along a gradient of depth and distances from shore to measure sediment nutrient flux. Transects alternated between the east and west shores for adjacent sites. One core was taken in the middle of the lake at the deepest point, one core was taken along the bald cypress (Taxodium distichum (L.) Rich.) trees lining the edges of the lake (closest to mid-lake), and a third core was taken near the shore (Figure 1B). Cores were collected near bald cypress trees as sediment organic matter content may be higher than mid-lake sediment due to tree debris input, senesced leaf litter, and/or trapping of organic matter from fields by tree roots. Water depth and distance to shore was recorded for each core. Cores were collected with a hand corer within a clear acrylic tube that measured 30.48 cm long and 7.62 cm in diameter. Fifteen sediment cores were collected at each sampling event. Cores were placed on ice in a cooler in the field for transport to the laboratory for incubations. Water for core incubations was collected from the middle of the lake at each site to incubate them in water near where they were collected. Site incubation water consisted of a 26.5 L integrated water sample using a Kemmerer sampler to collect water from the surface, middle, and bottom of the water column. Water was filtered on site through a 1 µm pore size canister filter to remove large particles and sediment.
2.2. Sediment Core Incubations
Laboratory sediment core incubations took place over 48 h, starting immediately upon arrival at Tennessee Technological University (TTU), Cookeville, TN, USA. Incubations were conducted in 0.53 m3 tanks filled with water maintained at the average lake temperature during sampling. Each core was sealed with a 3D printed plastic core top that was outfitted with inflow (1.0 mm tubing) and outflow (1.25 mm tubing) ports, and a cone-shaped underside to reduce the buildup of air bubbles during incubation. The incubation setup was adapted from Nifong et al. [40] using the same core and pump components (Figure S2). The incubation water was also maintained at the ambient lake temperature and aerated. Bubblers were removed 15 min prior to core outflow sample collection and peristaltic pumps continuously pumped water over the top of the cores at 2 mL per minute. The flow rate produced a water residence time above the sediment of approximately six hours. In addition to the sediment cores, one control core containing only incubation water was analyzed per site to account for nutrient changes in the water column.
Core outflow sampling began after a 36-hour acclimation period. One 15 mL water sample was filtered and collected from each core outflow and inflow source and frozen. These samples were analyzed for NO3− and SRP using the methods stated previously. Nutrient flux rates determined from nutrient concentrations were measured for each core outflow and inflow source, and were calculated using the following equation from Spier et al. [41]:
where [Core]out and [Core]in are the sediment core outflows and inflows of NO3− and SRP concentrations (mg/L). [Ctrl]out and [Ctrl]in are from the control, sediment-free core. Qcore and Qctrl are the measured flow rates of the inflow water sources through each core (L/h), and A is the core surface area (m2). This equation yields an aerial flux estimation for nutrient concentrations for each individual core. A positive flux indicates a net gain in the water, or release of NO3− or SRP from sediments, whereas a negative flux suggests a net loss from the water, or removal of NO3− or SRP into core sediments.
Once incubations were completed, cores were processed for sediment organic matter (AFDM) and algal chl-a content. April sediment chl-a was not measured. The top 5 cm of sediment from each core was removed and collected in a beaker. Deionized water was added to bring the slurry to 500 mL and the sediment and water was homogenized with a hand blender. Two subsamples were collected from each core: a 25 mL sample for AFDM, and a 20 mL sample for chl-a analysis. The AFDM sample was poured into pre-weighed aluminum tins and AFDM determined as previously described. Chlorophyll a samples were filtered onto 125 mm diameter glass fiber filters and frozen at −80 °C until analysis. Samples were analyzed as described above.
2.3. Temperature Experiment
Water temperature is often associated with ecosystem metabolism rates and varies consistently within and across the spring to summer in Delta lakes (e.g., Figure S3, Roundaway Lake; R. Lizotte, USDA ARS, unpublished data). Therefore, an additional incubation experiment was conducted in October 2017 to investigate the effect of temperature on sediment nutrient retention. Sediment denitrification and O2 demand were also measured to further assess nitrogen removal pathways. Twenty-seven sediment cores were collected at the same depth (1.25 m) within five meters of site 3 and placed on ice. Approximately 950 L of lake water was collected from site 3 for core flow-through incubations.
In the TTU laboratory, sediment cores were divided into one of three tanks of different temperature, 10 °C, 20 °C (ambient lake temperature), and 30 °C, which span the typical range of water temperatures in the lake (Figure S3). Nine sediment cores and 3 control cores were added to each tank. All cores were incubated for at least 48 h prior to the start of the experiment to allow microbiota to adjust to the new temperature [42,43]. During this time, lake water maintained at the treatment temperature was continuously pumped through the cores as described above. Treatment water was aerated to provide a similar starting DO concentration, and background nitrate concentrations were increased by 2 mg/L to ensure nitrate availability was not limiting nitrogen uptake or denitrification [41].
Samples from cores were collected 24 h after the start of the incubation. Nitrate and SRP samples were collected as described previously. Duplicate samples for O2 and N2 gas were collected in 12 mL exetainer vials. Vials were filled from the bottom and allowed to overflow to at least 36 mL to ensure minimal atmospheric contact, immediately preserved with 156 µL of zinc chloride, and capped. Exetainers were refrigerated upside down, submerged in water and shipped to the USDA-ARS National Sedimentation Laboratory in Oxford, MS, USA for analysis. Samples were measured for dissolved N2, O2, and Argon (Ar) concentrations using a membrane inlet mass spectrometer (MIMS). N2 fluxes from core sediments were determined from changes in N2:Ar ratios to estimate denitrification rates [44]. All incubations were conducted in the dark to prevent photosynthesis and associated production of O2 bubbles, which may confound dissolved N2 gas measurements in closed-core systems [44]. Sediment N2 and O2 flux rates were calculated using Equation (1). Following incubations, cores were processed for AFDM and chl-a as described previously.
2.4. Data Analysis
Principal component analysis (PCA) was used to visualize differences in water quality among sites and months. A three-way analysis of variance (ANOVA) was used to test for differences in ambient NO3− and SRP sediment uptake rates among longitudinal position (site), depth habitat (mid-lake, bald cypress tree line, shore) and month. The model also included interactions between month/site, and month/habitat to assess whether spatial relationships changed over time. A Tukey post hoc test was used to determine pairwise differences in significant variables. The PCA and ANOVAs were performed using JMP 10.0 software (SAS Institute Inc., Cary, NC, USA).
A general linear mixed model approach with Akaike information criterion corrected for small sample size (AICc) model selection was used to assess relationships among sediment nutrient flux and environmental variables including water quality parameters (Table S1), water depth above core, core distance to shore, and month, with site treated as a random effect. The average value of variables collected at the surface, mid, and bottom of the lake were used in the model. Only models that retained a wi (AICc weight) value greater than 0.1 (at least a 10% likelihood of being the best approximating model) are reported. The relative importance of each variable in predicting nutrient retention was calculated by summing the wis of each model that retained the given variable. Following model selection, a final model was run using only the variables in the highest-ranked model, and restricted maximum likelihood (REML) parameter estimation was used instead of maximum likelihood (ML). The marginal and conditional R2 values for each mixed model was calculated [45]. The marginal R2 values refer to the fixed effects, and the conditional R2 is referring to the fixed effects plus the random effects. Regression models were conducted in R version 4.0.2 [46], using the nlme package [47] and the MuMIn package [48] was used for AIC model selection.
Non-parametric Kruskal–Wallis tests were used to test for differences in sediment nutrient flux, sediment O2 demand, and denitrification rates among temperature treatments in the October experiment because data did not meet ANOVA assumptions. Multiple comparison Dunn’s tests were performed following significant Kruskal–Wallis tests to determine which temperature treatments differed. These tests were performed using the FSA package in R [49]. All test results were considered significant at α = 0.05 level.
3. Results
3.1. Depth and Water Quality Variability
Lake depth was stable during the study with a maximum depth of 1.4 m in April and 1.2 m in June (at site 3), resulting in individual sites varying only an average of 20 cm across the three months. Cores were collected from depths ranging from 0.3 to 1.4 m; with a mean core depth of 0.53 m for shallow cores, 0.92 m for bald cypress tree edge cores, and 1.09 m for mid-lake cores.
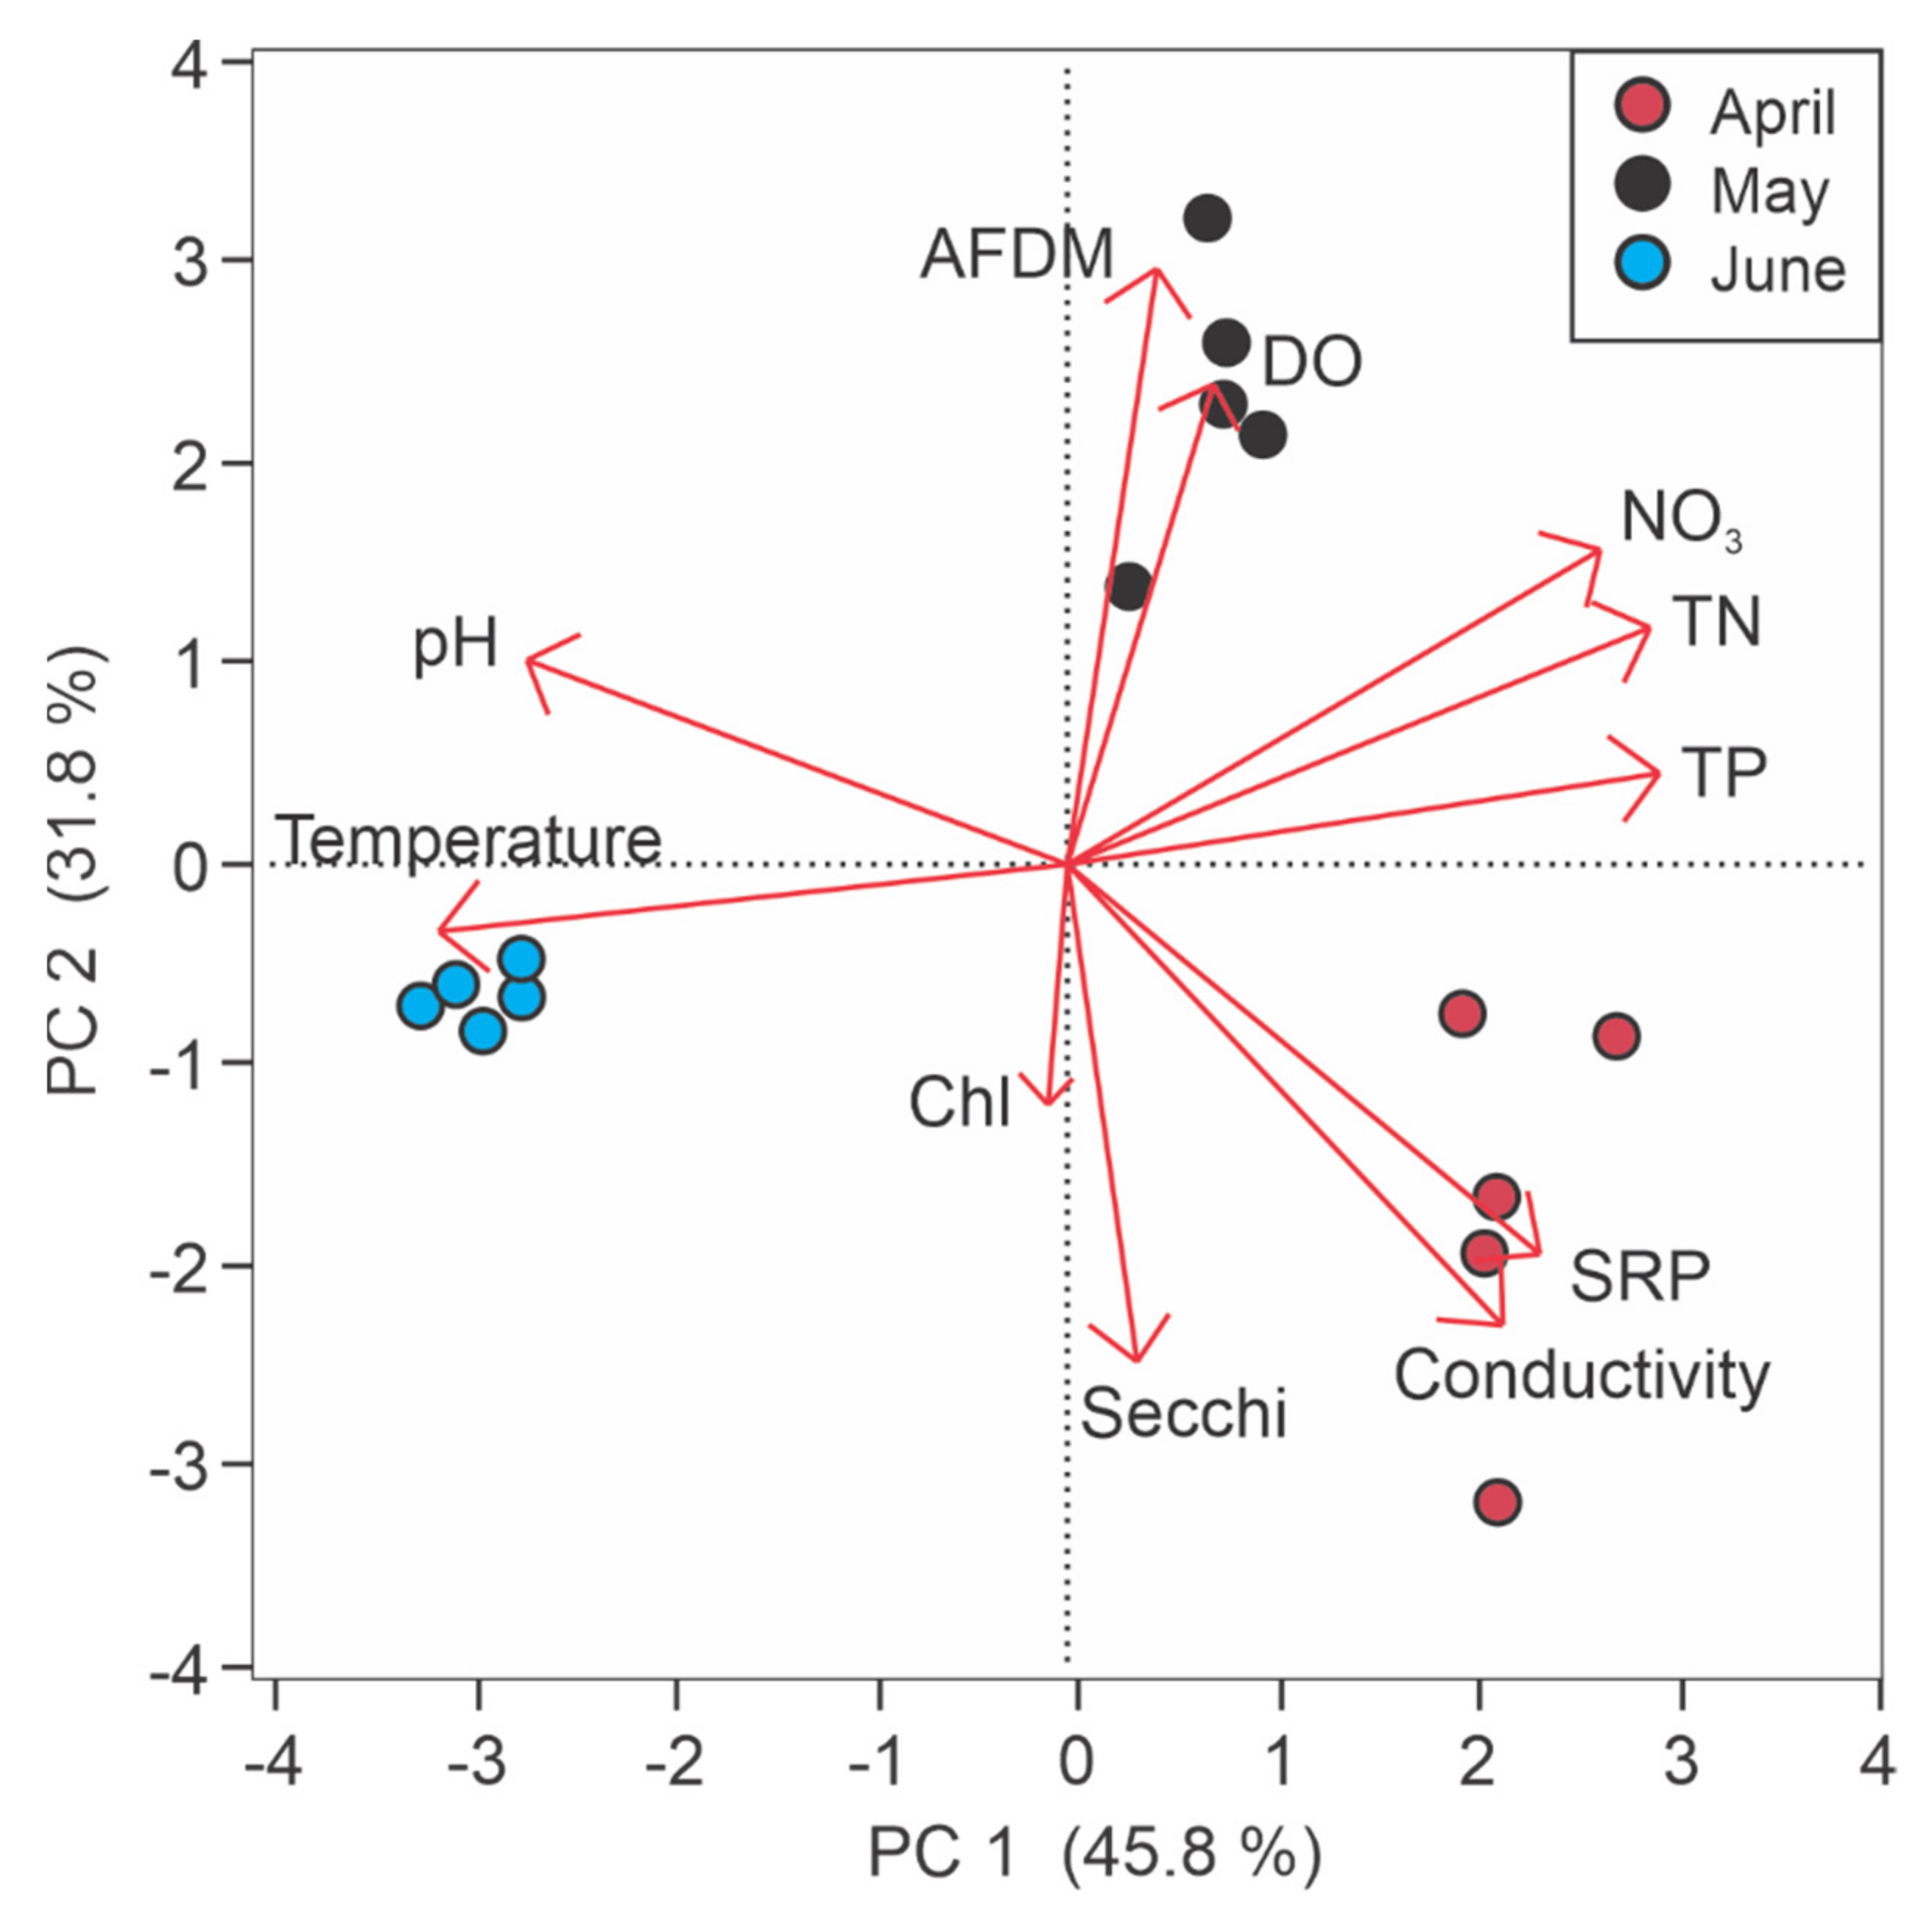
Water quality differed more among months than among sites, with variation among sites greatest in early spring (April), and sites became most similar in June (Figure 2). The water column became more well mixed from April to June, and was consistently more stratified upstream than downstream (Table S1). Even when stratification was found, differences between surface and bottom water values were not largely different for most parameters, including DO (Table S1).
Water quality was indicative of a eutrophic lake across the sampling period. Early spring (April) lake water was clearer (i.e., average Secchi depth = 7 cm), and had higher SRP, conductivity, and phytoplankton biomass. Water became slightly more turbid and had more organic matter in May (mean Secchi depth = 6 cm), but also had higher DO concentrations. TN was highest in May (2693 µg/L) and lowest in June (2040 µg/L). April had the highest mean TP concentration (667 µg/L) and June had the lowest (505 µg/L). Mean dissolved nitrate was highest in May (1573 µg/L) and lowest in June (675 µg/L). Mean SRP was highest in April (159 µg/L), but dropped considerably in May (77 µg/L) and even further in June (63 µg/L). Water temperature increased from 20 to 21 °C in April to > 26 °C in June. Mean pH was the lowest in April at 7.3 and the highest in June at 7.8. Dissolved oxygen concentrations ranged from a mean of 4.9 mg/L in April to a high of 5.7 mg/L in May. However, these measurements were collected within the first few hours following sunrise and represent the lower range of diel DO swings. Mean water column chl-a concentrations were consistently low with mean values across sites at 10, 11, and 9 µg/L for April, May, and June, respectively. Mean water AFDM concentrations were the highest in May (0.36 g/L) and the lower in April (0.15 g/L) and June (0.17 g/L).
3.2. Nutrient Flux Rates
3.2.1. Spatial Variation in Sediment Flux Rates
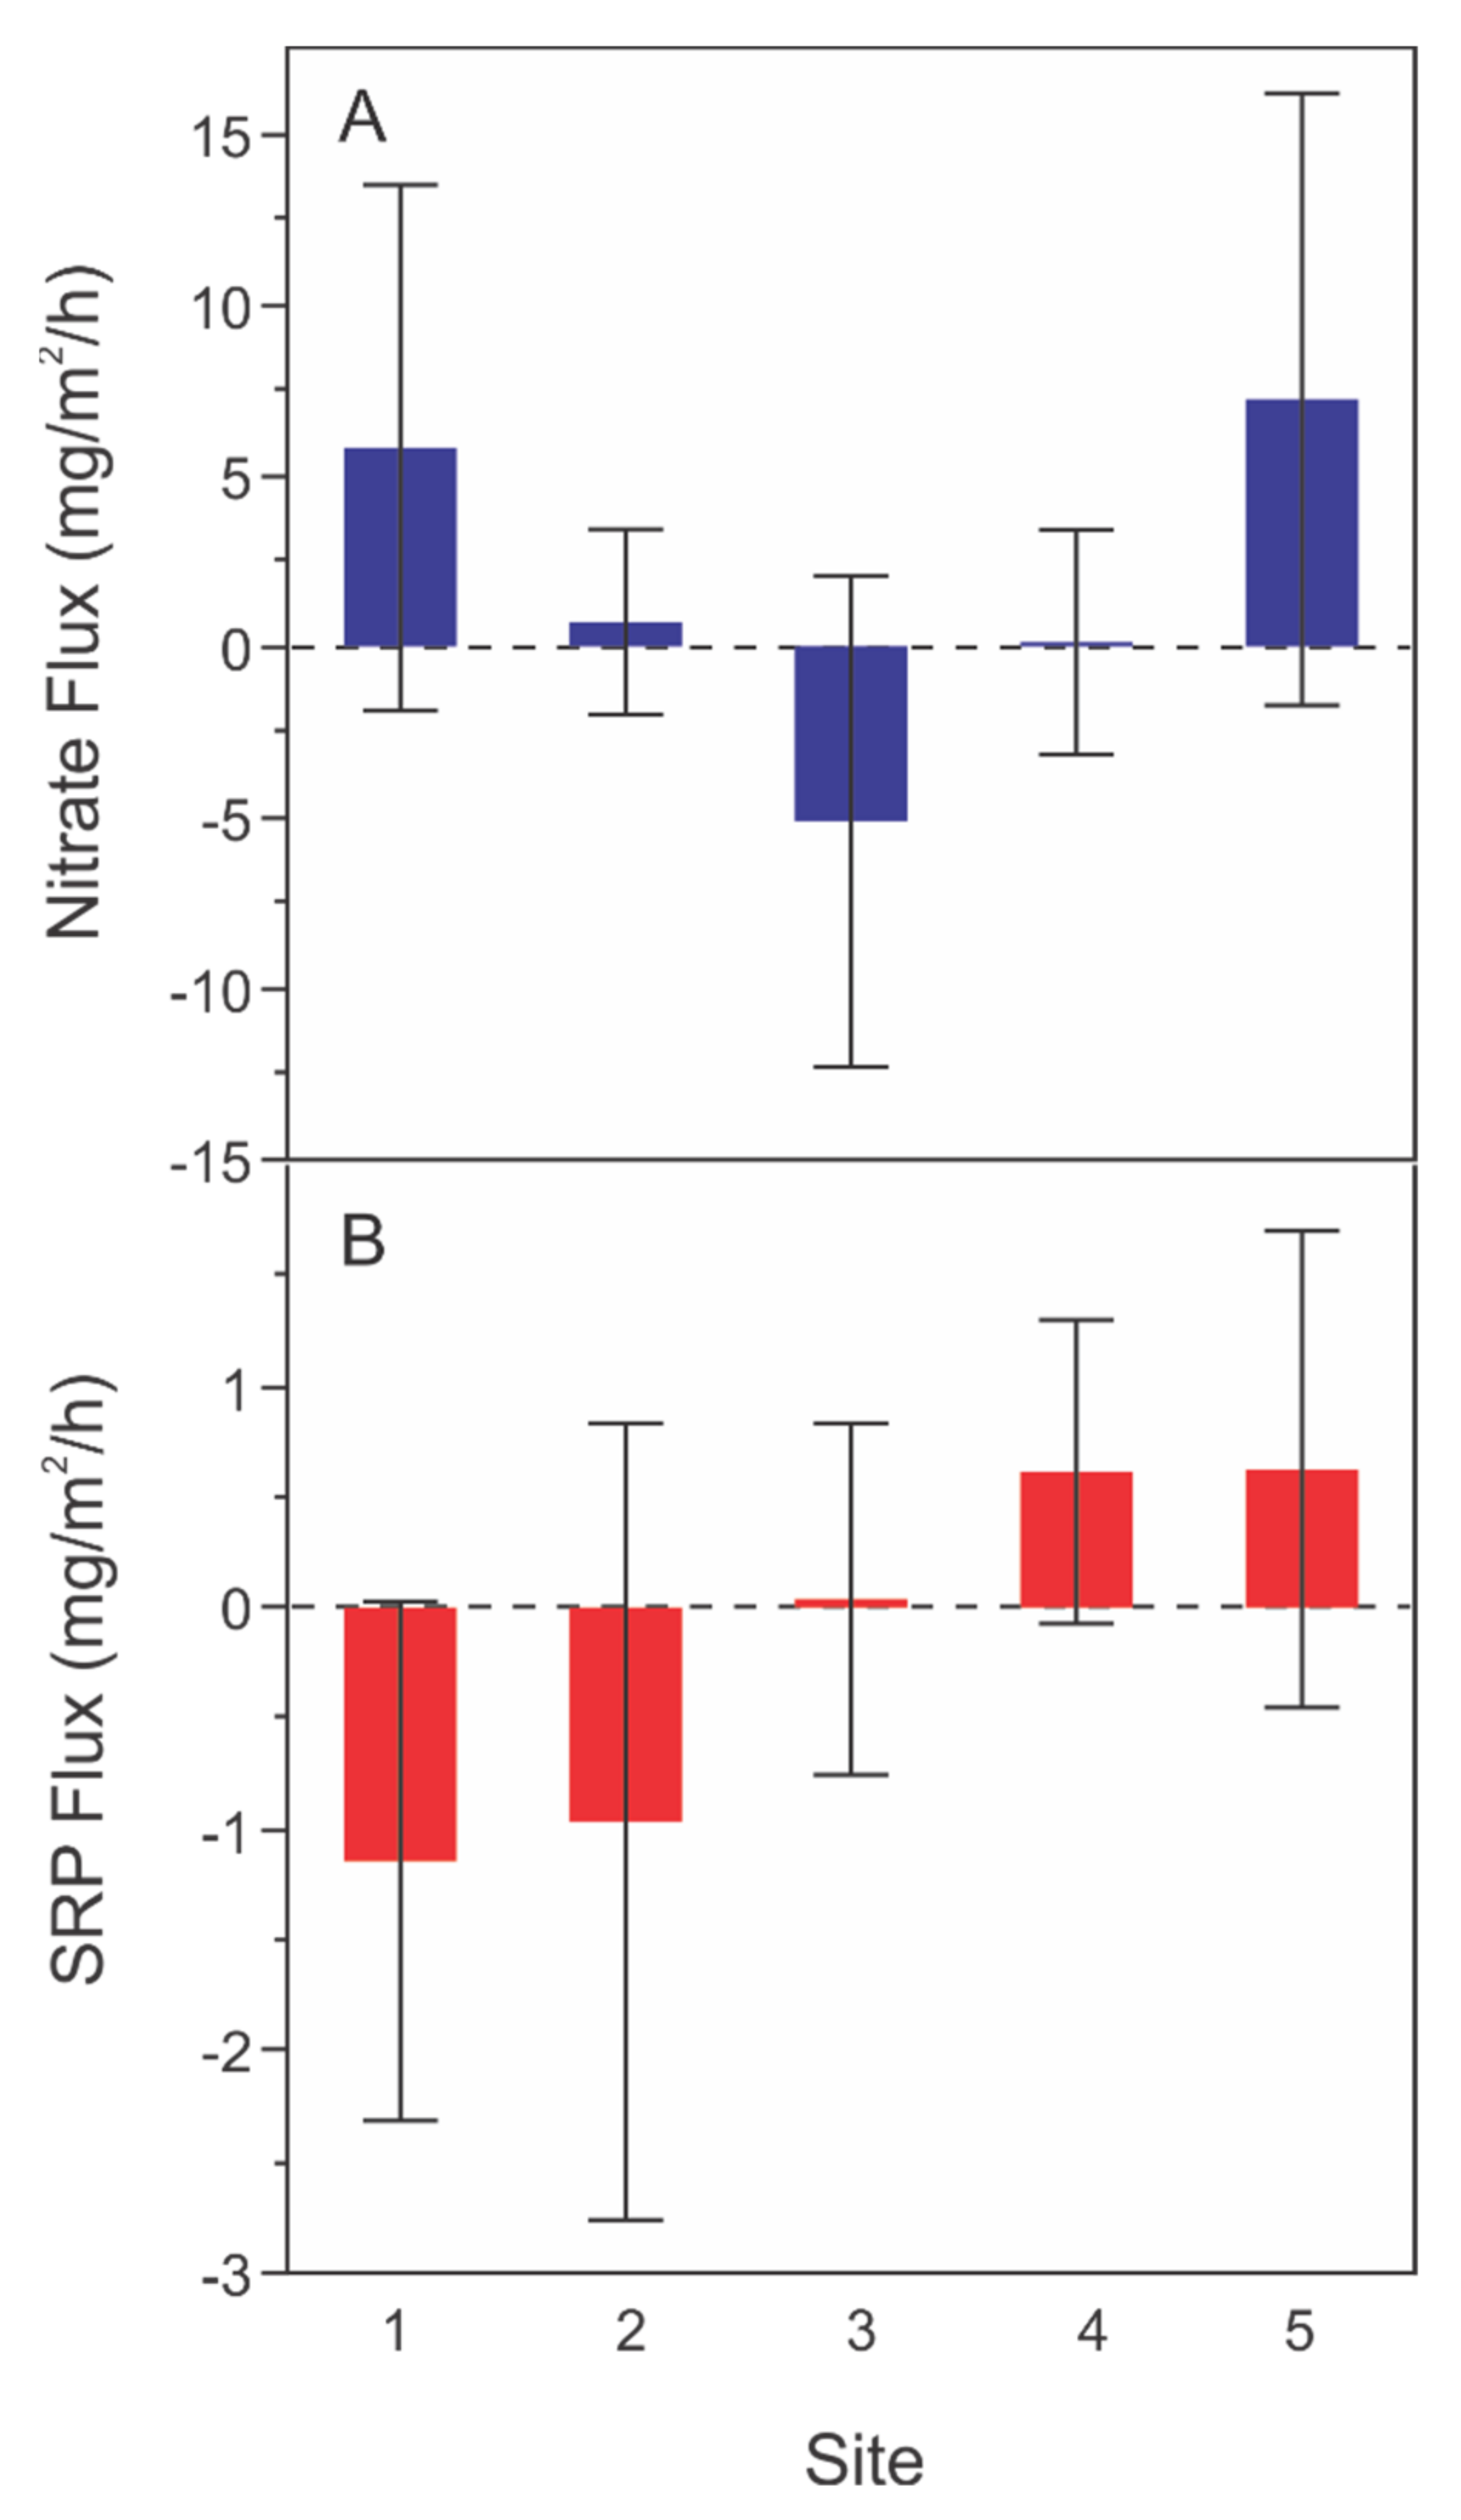
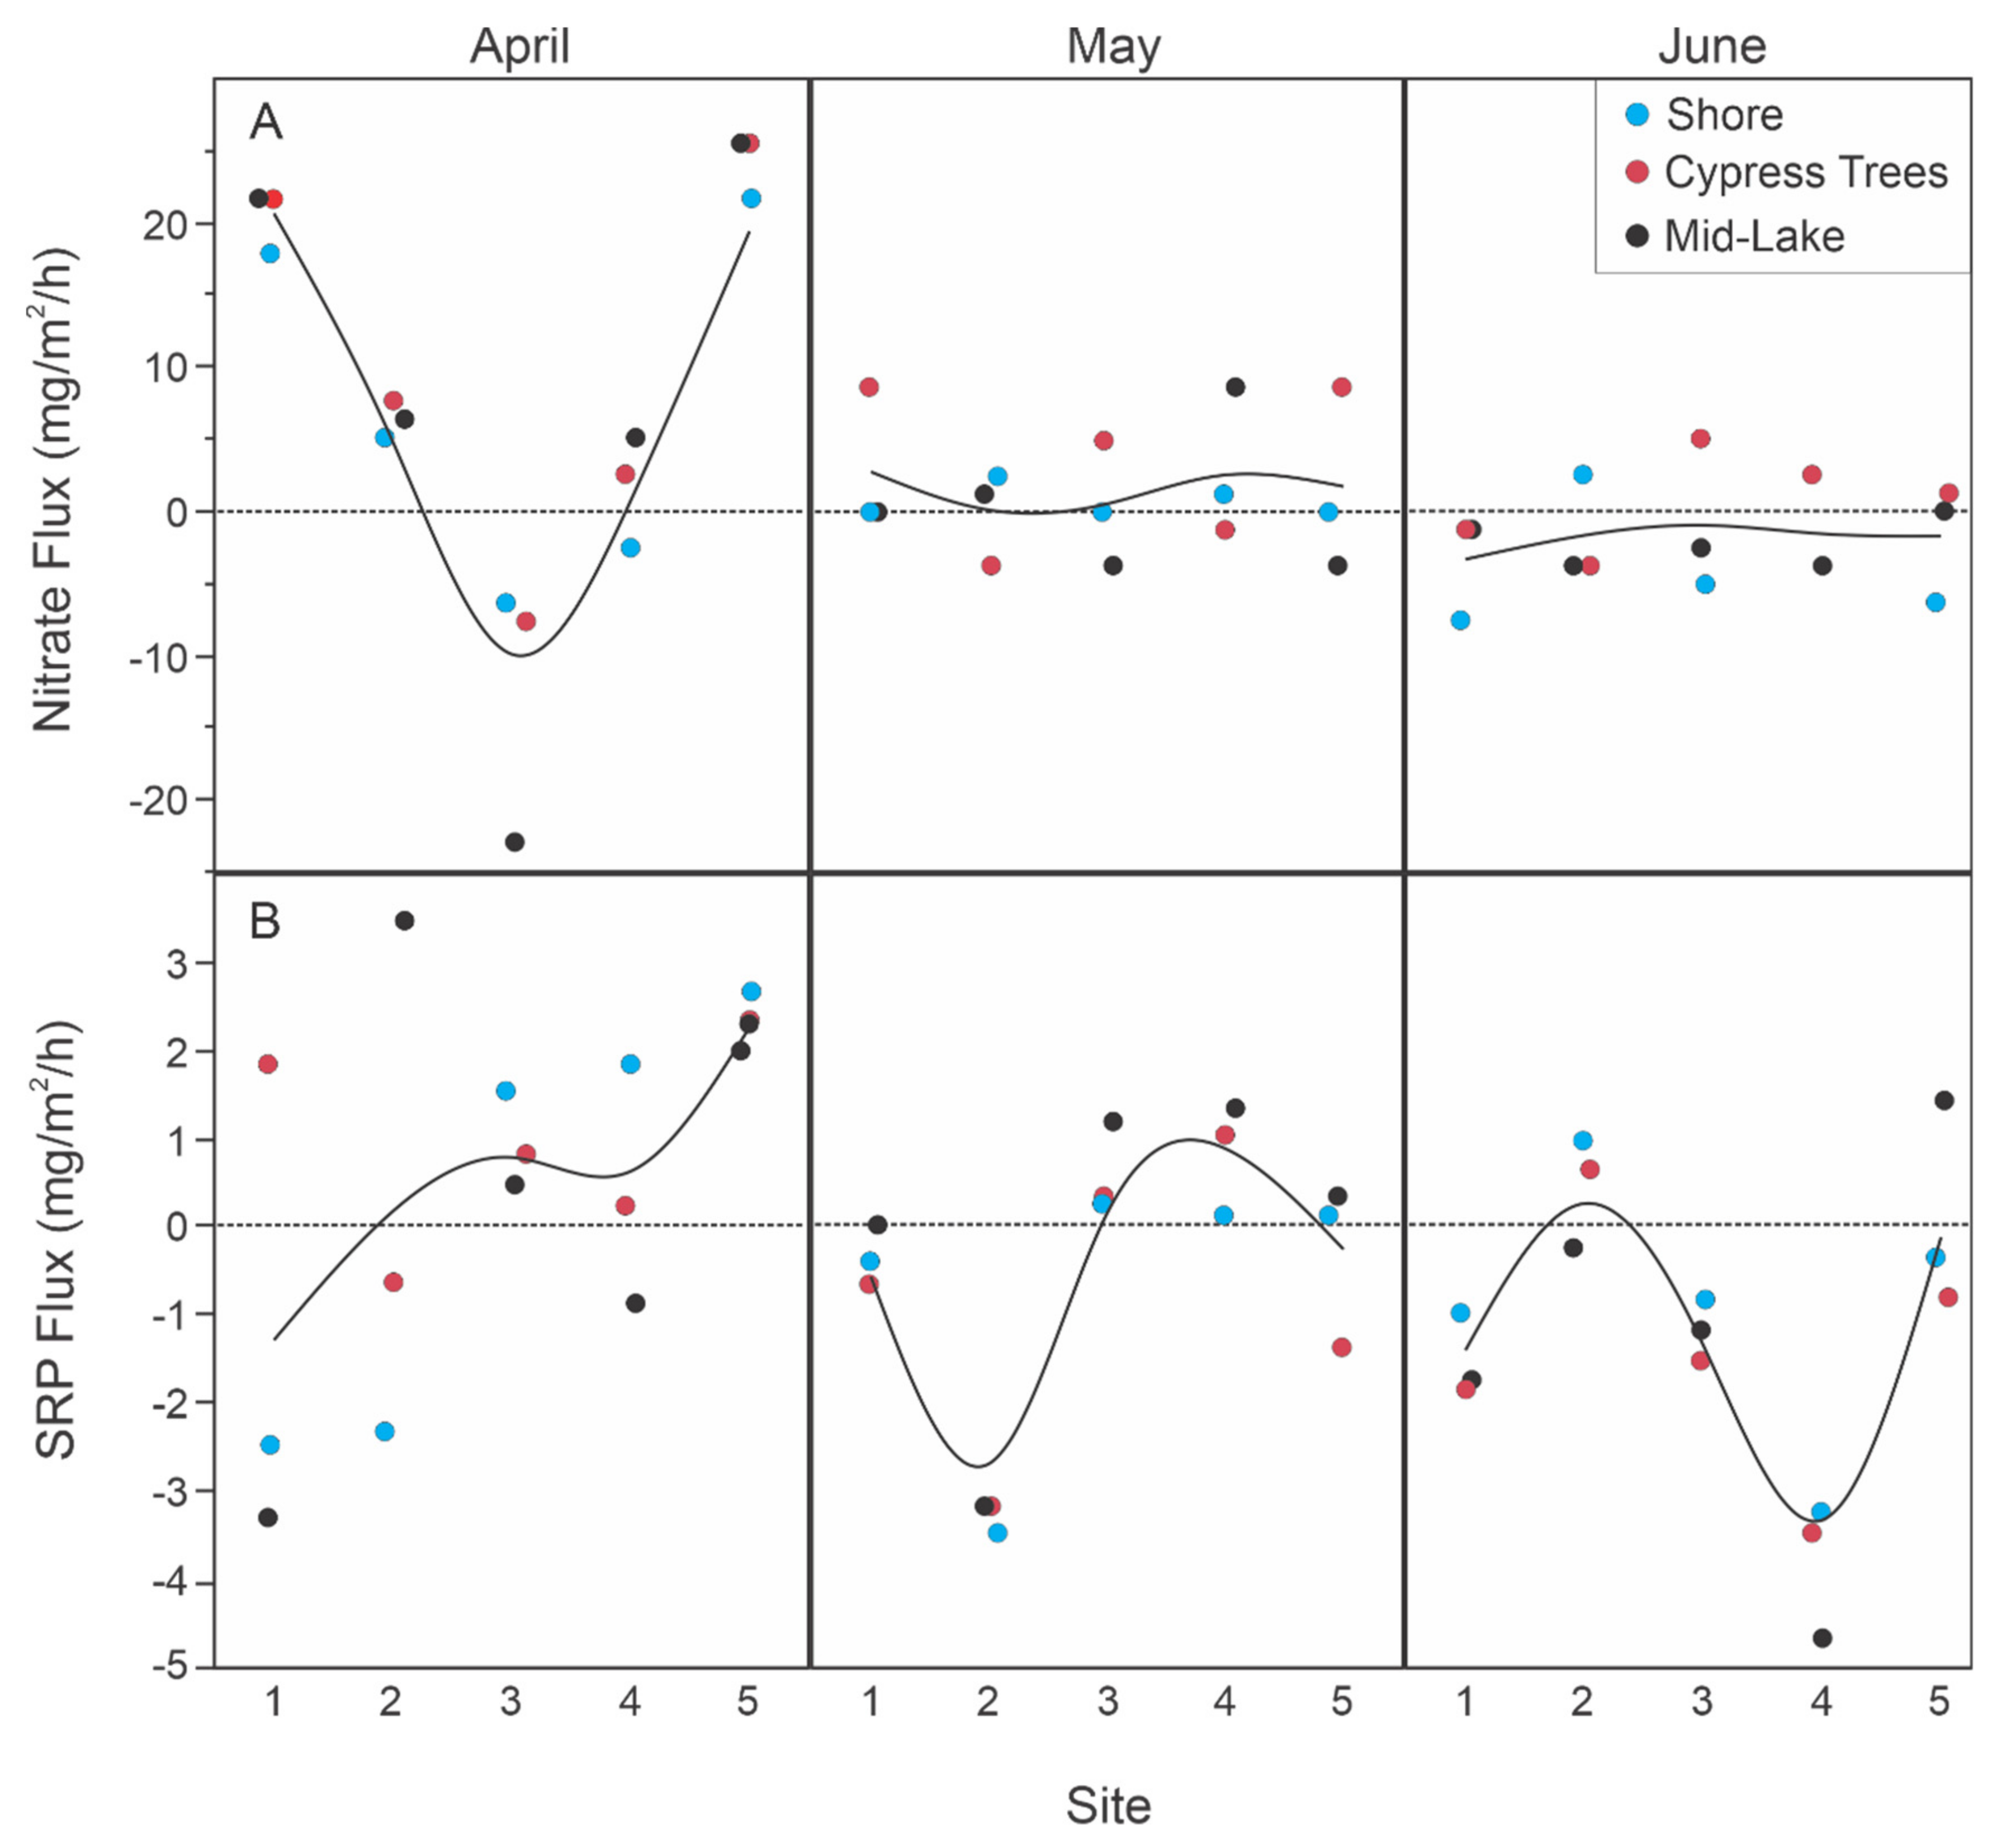
Sediment core nutrient flux in Roundaway Lake differed over space and time, with some areas removing NO3− and SRP (negative flux rates from the water) and some areas releasing it (positive flux rates into the water) during the same sampling period. There was a significant month by site interaction for both NO3− (p < 0.001) and SRP (p < 0.001) fluxes that did not allow a robust assessment of differences among sites (Table 1). However, there were discernable spatial and temporal trends in the data. Across all months and depth habitats, average NO3− flux into the sediments was greatest at mid-lake, site 3, switching to an average release from sediments in both upstream and downstream directions (Figure 3A, Table S2). SRP was generally moving into the sediments at the upstream sites with gradual shift to sediments releasing SRP with distance downstream (Figure 3B). However, because 95% confidence interval included zero, it is not clear that any site was consistently retaining or releasing nutrients throughout the study, and uptake had considerable variation from month to month in the spring. Ambient NO3− and SRP flux rates were substantially more variable in April, both within and among sites (Figure 4). During April, sediments released NO3− at the most upstream and downstream locations but removed NO3− at the mid-lake site. The most extreme NO3− flux rates were recorded in April, where rates ranged from −25.5 mg/m2/h at site 3, to 22.9 mg/m2/h at site 5, with an average flux rate of 5.5 mg/m2/h from sediments across all sites. Nitrate flux rates became similar across sites in May and June, with no distinct longitudinal trends. May flux rates ranged from −3.7 to 8.7 mg/m2/h with a mean of 1.6 mg/m2/h leaving sediments, and June rates ranged from −7.6 to 5.0 mg/m2/h with an average rate of −1.8 mg/m2/h, going into sediments (Figure 4A). Sediment NO3− flux rates did not differ significantly among depth habitats (Table 1).
Sediment SRP flux rates also had the most spatial variation in April, and a general trend of releasing more P into the water from upstream to downstream (Figure 4B). Sediments generally released P in April and retained P in May and June. April SRP flux rates ranged from −3.5 to 3.3 mg/m2/h with a mean of 0.3 mg/m2/h, May flux rates ranged from −3.7 to 1.3 mg/m2/h with a mean of −0.5 mg/m2/h in May, and June rates ranged from −1.9 to 1.4 mg/m2/h with a mean of −0.3 mg/m2/h. SRP flux rates did not differ among depth habitats (Table 1).
3.2.2. Water Quality and Sediment Nutrient Flux Rates
Specific water quality relationships with sediment NO3− and SRP flux rates were further investigated using linear mixed model regression. An integrated measure of water quality was used in the model, taking the average of the top, mid, and bottom measurements (Table S1). This integrated approach produced a stronger correlation (higher marginal and conditional R2 values) to sediment nutrient uptake than using measurements taken near the sediment.
Sediment NO3− flux was better correlated to water quality than SRP flux (Table 2). The most parsimonious linear mixed model for predicting NO3− flux rates into sediments (i.e., negative core flux rates) included decreasing Secchi depth, increasing temperature, month, decreasing DO, and decreasing TN (marginal R2 = 0.57, conditional R2 = 0.82, Table 2). Secchi depth, month and temperature were included in all models (relative importance = 1.00, Table 3), while core depth and distance to shore each had low relative importance (<0.20). The top-ranked model for SRP sediment flux included deceasing sediment AFDM, TP, and Secchi depth, and increasing temperature (marginal R2 = 0.38 and conditional R2 = 0.38, Table 2). Sediment AFDM, TP, and Secchi depth had the highest relative importance values at 0.77, 0.77, and 0.59, respectively, with temperature (0.44) and month (0.42) also included in a large number of higher-ranked models (Table 2 and Table 3). The low relative importance value of core depth and distance from shore, and equal marginal and conditional R2, suggests that core location in Roundaway Lake did not strongly influence SRP uptake.
3.3. Temperature Experiment
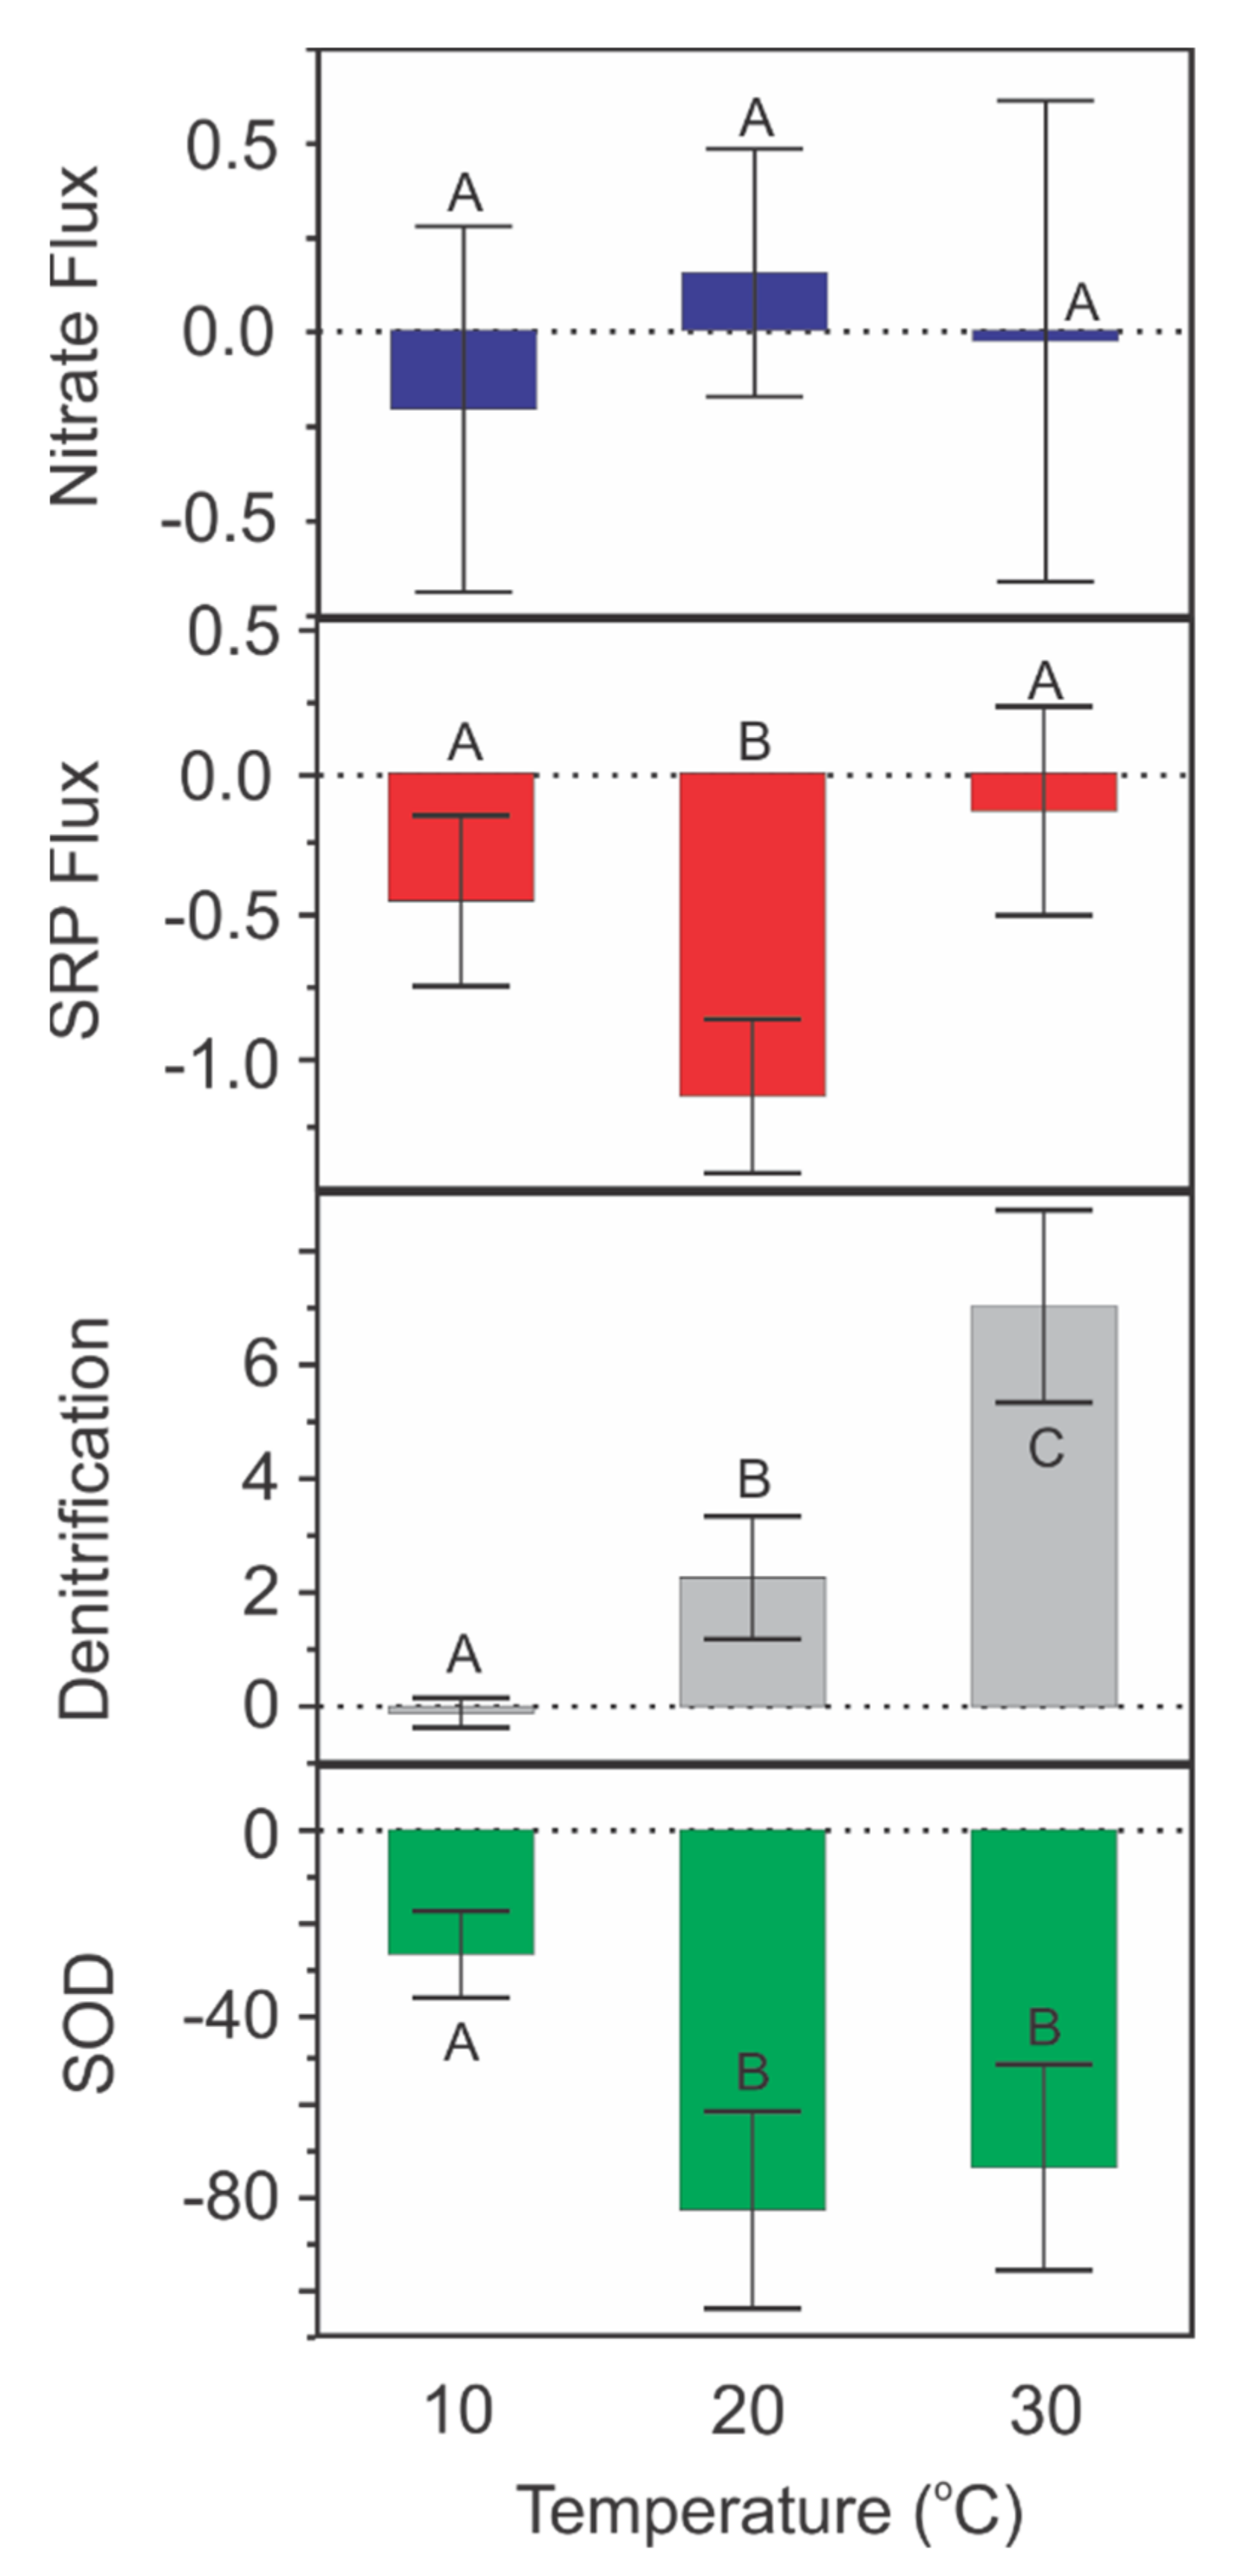
Nitrate flux was low across all temperatures and was not significantly different among treatments (chi-squared = 0.78, df = 2, p = 0.676). There was not a definitive NO3− flux into or out of sediments at any temperature, as 95% CI overlap zero (Figure 5, Table S3). Overall, flux rates into the sediments were approximately an order of magnitude greater than in the spring. Temperature significantly affected SRP (chi-squared = 14.64, df = 2, p < 0.001) flux rates. SRP flux rates into sediments were highest at the ambient lake temperature (20 °C) and decreased at both lower (by an average of 0.25 mg/m2/h, 36%) and higher (by an average of 0.57 mg/m2/h, 81%) temperatures. Denitrification rates (N2 flux from the sediments) were consistently greater with increasing temperature (chi-squared = 20.43, df = 2, p < 0.001). Rates were not different from 0 mg/m2/h at 10 °C, but increased by an average of 4.4 mg/m2/h (217%) from 20 to 30 °C. Sediment O2 demand (negative O2 flux into sediments) also varied across temperatures (chi-squared = 12.54, df = 2, p = 0.002, Figure 4). O2 demand did not change when the temperature was increased to 30 °C, but decreased by 50.7 mg/m2/h (66%) when the temperature was lowered by 10 °C.
4. Discussion
4.1. Sediment Flux Trends
Water quality had a stronger influence on sediment nutrient flux than did water depth above the sediment during this study despite the persistently high turbidity and nutrient conditions. We hypothesized that sediment nutrient flux would increase over the spring as waters warmed and nutrient concentrations remained near saturating levels. Overall, sediments trended from a net release of NO3− and SRP in April towards a net uptake in June, but this temporal trend varied by site, with the mid-lake site being the most consistent. At any given time, the lake was both releasing and removing nutrients at different locations. Whether there was a net uptake or net release of nutrients depended more on the overlying water quality, rather than water depth above the sediment. Although water quality was indicative of a turbid, eutrophic system, spatial and temporal variations in the overlying water were enough to influence sediment nutrient uptake. Flux rates were well correlated with water clarity, nutrient content, and water temperature, all of which are highly influenced by spring runoff in the region [50]. Isolating the effect of water temperature found that it was an important driver of both N and P cycling, but it was only one of several significant variables regulating sediment nutrient removal.
We also hypothesized that sediment NO3− uptake would be higher in deeper water, and SRP uptake would be higher in shallower water. This hypothesis was based on predictions from previous studies that O2 availability would be lower in deeper water sediments where light and primary production is excluded, as low redox potential can increase NO3− loss through denitrification and increase SRP release from bound sediments [18,29,51]. We found no differences in sediment nutrient flux based on water depth, and similar flux rates were observed from shore to mid-lake. O2 concentrations in the bottom of the water column varied less than 3 mg/L across all depths and months, and there was no correlation between depth and O2.
The maximum spring NO3− uptake rates in Roundaway Lake were within the range of typical rates in U.S. agricultural aquatic ecosystems, e.g., ~110 mg/m2/h in midwestern streams [52], and 1.8 to 5.8 mg/m2/h in wetlands [53]. However, rates were lower than soils taken from regional agricultural drainage ditches, which reached up to 50 mg/m2/h [43]. However, May and June uptake rates were similar to the lower end of this range. It was predicted that significant nutrient consumption could occur in Roundaway Lake due to long water residence times and increased time for biological uptake [54], but changes in water quality were likely more frequent than lake water residence time. This paired water quality and quantity change makes portioning out the influence of residence time difficult. In a sediment core study from Mississippi Delta agricultural ditches, nitrate uptake saturation occurred at 8 mg/L NO3−; however, these cores were highly vegetated unlike the bare sediments of Roundaway Lake. Measured NO3− in this study did not exceed 1.8 mg/L, thus net uptake of nitrate in Roundaway Lake was expected. Maximum SRP uptake rates in this study (4.0 mg/m2/h) matched maximum rates reported by Hill [55] from natural baseflow conditions in agricultural streams (3.2 mg/m2/h), and were marginally higher than maximum SRP rates reported by Munn and Meyer [56] in a forested stream (1.3 mg/m2/h).
4.2. Water Quality and Sediment Nutrient Flux
Despite relatively stable water quality over the three sampling months, water quality was well correlated to NO3− sediment flux and moderately correlated to SRP sediment flux. These relationships suggest that small changes in water chemistry can impact nutrient uptake in heavily impacted shallow lakes. Spring water conditions in Roundaway Lake, as well as most surface waters in the region, are characterized by high suspended sediment and nutrient concentrations, and low DO, as lakes are surrounded by row crop agricultural fields, and water quality in spring is dictated by runoff [50,57]. Water conditions during this study followed this pattern with Secchi depth ranging from only 5 cm to 7 cm, TN and TP ranging from 1.95 to 2.85 mg/L, and 0.46 to 0.74 mg/L, respectively. Dissolved oxygen (1.6 mg/L range) and water temperature (6 °C range) were also relatively consistent
Sediment nutrient flux was better correlated to water column TN and TP, than to NO3− and SRP. Total nutrients can be a better indicator of nutrient availability than dissolved N and P due to potentially high remineralization rates [58], and a stronger total vs. dissolved nutrient relationship has been observed in stream algae [59]. However, this relationship has not previously been reported for heterotrophic microorganism uptake. The negative TN and TP correlation to greater NO3− and SRP uptake in Roundaway Lake suggests that sediment uptake rates were exceeding remineralization rates over the few hours of core incubations, resulting in a net removal of N and P from the water column over time. This is supported at a whole-lake scale by the lower water TN and TP from April to June. On average NO3− was 49% of TN and SRP was 16% of TP, suggesting that there was a large storage of N and P available for continued remineralization. Total N and TP concentrations were always relatively high in this study, which may be related to relatively low nitrate uptake velocity into sediments that can occur in agricultural aquatic ecosystems [60]. However, NO3− saturation of N uptake in Mississippi Delta sediments can be high and exceed 8 mg/L [41]. Thus, although both NO3− and TN were high, they are still not likely saturating heterotrophic microbial N uptake in Roundaway Lake.
In addition to nutrients, increasing water temperature, lower Secchi depth, and lower DO were strongly correlated to NO3− flux. Water temperature is directly related to metabolic activity and many studies have linked increasing temperature with nutrient uptake [61,62]. Lower light, and thus lower O2 production by primary producers leads to an environment more favorable to denitrification, suggesting that NO3− transformation into N2 gas could be an important pathway in these sediments. The fall temperature experiment supported increasing denitrification rates and greater sediment O2 demand with higher temperatures. However, NO3− flux rates into the sediments were low across all temperature treatments and NO3− removal did not increase with lower O2 or higher temperatures. This disconnect could potentially be caused by increased coupled nitrification-denitrification [63], resulting in a short NO3− residence time, or other N2 production pathways such as anaerobic ammonia oxidation (anammox). For example, Lotti et al. [64] found that anammox bacteria activity increased by ~50% from 20 to 30 °C, and by ~80% from 10 to 30 °C in batch culture. This pathway can also be stimulated by increased ammonia, which can be released from lake sediments at higher temperatures, with the same higher temperatures and low DO environments increasing the potential for release of P [65]. SRP uptake was greatest at ambient temperature but decreased at 30 °C. McDowell et al. [66] found a similar decrease in P uptake in agricultural stream sediments, which they found was caused by lower microbial uptake. Sediment microbial uptake is likely an important pathway of P removal in eutrophic lake sediments [67]. Additionally, the strong redox gradients at the water–sediment interface and potentially high iron and sulfate found in Delta soils [68] suggests that other microbial-mediated P release pathways may be occurring. For example, cable bacteria and Beggiatoacaea bacteria are known mediators of P release from sediments through the enhanced formation of iron and sulfur oxides [69].
4.3. Water Depth, Spatial Location, and Sediment Nutrient Flux
Lake depth only varied by 1.4 m during the study period, so a robust assessment at a single location was not possible. Nevertheless, sediment nutrient flux did not differ significantly among cores collected from different depths, i.e., shore to mid-lake (1.1 m range). Sediment P flux was highly corelated to sediment AFDM in Roundaway Lake, and AFDM was on average 23% greater in the mid-lake vs. near shore cores. This could be indirectly due to both greater water depths above mid-lake cores and the relatively high sedimentation rate, ~2 cm/y, which deposits both sediment and organic matter [70]. This suggests that organic matter deposition from the water column may exceed that related to cypress trees. This organic matter could be driving O2 demand with the sediments and contributing to nutrient flux rates [71].
High turbidity may also indirectly contribute to sediment nutrient flux. Spears et al. [68] found that more TP was released from sediments in a eutrophic shallow lake in the absence of light, but there was no effect of light on TN release. Benthic algae can create oxic layers above the sediment that can reduce P flux into the water [72]. In Roundaway Lake, light was attenuated before reaching the bottom in almost every core location, and although benthic chlorophyll was measured on sediments, previous studies in area lakes [73], and an absence of light at the sediment, suggest that this chlorophyll is from settled phytoplankton rather than growing benthic algae. Thus, heterotrophs likely dominated the active microbial communities. Spatial variation in uptake was dominated by an upstream to downstream gradient rather than shore to mid-lake, and variability among sites was much greater than among depths at each site. Therefore, sediment fluxes were paired with the changes in water quality as water slowly flowed through the lake, although N and P flux had different spatial patterns. Phosphorus was removed close to the water source, whereas N was transported further downstream before maximum removal rates occurred.
4.4. Season as A Controlling Variable
The time of year and seasonality can have varying effects on nutrient fluxes. For example, Jin et al. [31] observed seasonal changes in sediment P cycling, but Shaughnessey et al. [18] did not observe seasonal influences on sediment N fluxes. The relationship between nutrient removal and temperature has long been established due to increased biologic activity at warmer temperatures, which, in turn, increases total nutrient retention, specifically through denitrification [65,66]. Biological N removal can be most efficient between 20 and 25 °C in wetlands [74], which are similar to water temperatures observed in this study. Given that the greatest nutrient uptake rates were observed in June, it appears sediment microbial communities associated with N processing pathways may be well adapted to warmer conditions. The month sampled was included as an important factor in sediment uptake models, and there was a visible trend of increasing sediment nutrient uptake from April to June. However, flux rates were only marginally significant based solely on month, suggesting that direct seasonal influences are only part of the suite of regulating variables. The results of this study are best applied to the spring/early summer timeframe when field runoff, and accompanying nutrients and suspended sediment, are high. This is typical for agriculturally influenced watersheds in the region, and is when a large percentage of yearly nutrient loads are delivered [50,68]. Therefore, although nutrient loading may be highest in early spring, sediments are likely only removing a marginal amount of this load during spring.
5. Conclusions
Reducing and/or slowing agricultural pollutant movement through watersheds are essential to improving both local and downstream ecosystems. This study demonstrated that nutrient retention in shallow lake sediments can be complex in agricultural landscapes. Increasing spring and early summer water column temperature coupled with increasing suspended sediment (decreasing water clarity) increased benthic sediment nutrient retention. This finding highlights the tradeoff of implementing agricultural conservation practices to control upland erosion. Our results indicated a potential negative feedback loop with decreasing sedimentation, and lower water temperature in shallow lake systems in the Lower Mississippi alluvial plain. However, best management practices that reduce sediments also reduce nutrient inputs, so any increase in sediment nutrient reduction rates due to more turbid, warmer water is likely more than offset by lower initial water nutrient concentrations. Since this work was limited to the spring runoff season, these relationships may not be directly scalable to seasons when nutrient and sediment concentrations decrease. However, as more of the watershed is put into production to meet growing food demands, lakes in this region, and worldwide, are predicted to receive more sediment and nutrient runoff. Thus, many lakes in heavily agricultural watersheds may be shifting toward a longer-lasting turbid, eutrophic state. This work suggests that small changes in water quality can increase sediment nutrient uptake, even in turbid eutrophic waters. Because the region has numerous shallow riverine lake systems, widespread adoption of conservation practices to control upland erosion may expand the role of upland lakes as nutrient sinks to help mitigate nutrient export to the Gulf of Mexico.
Supplementary Materials
The following are available online at https://www.mdpi.com/article/10.3390/w13101344/s1, Figure S1: Bathymetry of Roundaway Lake: the x axis is west longitude and the y axis is north latitude; color legend depicts watershed elevation in meters above mean sea level; and black and white legend depicts distance in meters, Figure S2: Flow-through sediment core incubation setup used in this study. Cores and source water were maintained at ambient lake temperature using controlled-temperature water bath tanks, Figure S3: Monthly water temperature and dissolved oxygen at the bottom of water column. for Roundaway Lake at site 3, Table S1: Water quality parameters by month, depth, and site, Table S2: Nutrient and gas flux rates for the field collected cores, Table S3: Nutrient and gas flux rates for the laboratory temperature experiment.
Author Contributions
Conceptualization, J.L.E., J.N.M., J.M.T. and R.E.L.J.; methodology, J.L.E., J.N.M. and J.M.T.; formal analysis, J.L.E. and J.N.M.; investigation, J.L.E. and J.N.M.; writing—original draft preparation, J.L.E., J.N.M., J.M.T. and R.E.L.J.; writing—review and editing, J.L.E., J.N.M., J.M.T. and R.E.L.J.; project administration, J.N.M. All authors have read and agreed to the published version of the manuscript.
Funding
This research was funded by the USDA Agricultural Research Service, Tennessee Tech Department of Biology, and the Tennessee Tech Center for the Management, Utilization, and Protection of Water Resources.
Institutional Review Board Statement
Not applicable.
Informed Consent Statement
Not applicable.
Data Availability Statement
Data are available in the online Supplementary Materials or by request from the authors.
Acknowledgments
Ashlee Nichols, Phillip Kacmar, Aden Blackburn, Sam Day, Thomas Flanagan, Allison Litmer, Savannah Fernholz, Isabel Papraniku, Juju Wellemeyer and Spencer Womble provided assistance with sample collection and analysis. Mention of trade names or commercial products in this article is solely for the purpose of providing specific information and does not imply recommendation or endorsement by the USDA. The USDA is an equal opportunity employer and provider.
Conflicts of Interest
The authors declare no conflict of interest.
References
- Smith, V.H. Eutrophication of freshwater and coastal marine ecosystems: A global problem. Environ. Sci. Pollut. Res. 2003, 10, 126–139. [Google Scholar] [CrossRef] [PubMed]
- Foley, J.A.; Ramankutty, N.; Brauman, K.A.; Cassidy, E.S. Solutions for a cultivated planet. Nature 2011, 478, 337–342. [Google Scholar] [CrossRef] [PubMed] [Green Version]
- Galloway, J.; Cowling, E. Reactive nitrogen and the world: 200 years of change. AMBIO J. Hum. Environ 2002, 31, 64–71. [Google Scholar] [CrossRef] [PubMed]
- Daniel, T.C.; Sharpley, A.N.; Lemunyon, J.L. Agricultural Phosphorus and Eutrophication: A Symposium Overview. J. Environ. Qual. 1998, 27, 251–257. [Google Scholar] [CrossRef] [Green Version]
- Bennett, E.; Carpenter, S.; Caraco, N. Human Impact on Erodable Phosphorus and Eutrophication: A Global Perspective. Bioscience 2001, 51, 227–234. [Google Scholar] [CrossRef]
- Berggren, M.; Laudon, H.; Jonsson, A.; Jansson, M. Nutrient constraints on metabolism affect the temperature regulation of aquatic bacterial growth efficiency. Microb. Ecol. 2010, 60, 894–902. [Google Scholar] [CrossRef]
- Hessen, D.O.; Anderson, T.R. Excess carbon in aquatic organisms and ecosystems: Physiological, ecological, and evolutionary implications. Limnol. Oceanogr. 2008, 53, 1685–1696. [Google Scholar] [CrossRef]
- Rabalais, N.N.; Turner, R.E.; Dortch, Q.; Wiseman, W.J., Jr.; Gupta, B.K.S. Nutrient changes in the Mississippi river and system responses on the adjacent continental shelf. Estuaries 1996, 19, 386–407. [Google Scholar] [CrossRef]
- Mitsch, W.J.; Day, J.W.; Gilliam, J.W.; Groffman, P.M.; Hey, D.L.; Randall, G.W.; Wang, N. Reducing nitrogen loading to the Gulf of Mexico from the Mississippi River Basin: Strategies to counter a persistent ecological problem. Bioscience 2001, 51, 373–388. [Google Scholar] [CrossRef]
- Turner, R.E.; Rabalais, N.N.; Justic, D. Gulf of Mexico hypoxia: Alternate states and a legacy. Environ. Sci. Technol. 2008, 42, 2323–2327. [Google Scholar] [CrossRef]
- Killgore, K.J.; Hoover, J.J.; Murphy, C.E.; Parrish, K.D.; Johnson, D.R.; Myers, K.F. Restoration of Delta Streams: A Case History and Conceptual Model; Engineer Research and Development Center Vicksburg, Mississippi Coastal and Hydraulics Lab: Vicksburg, MS, USA, 2008. [Google Scholar]
- Fisk, H.N. Geological Investigation of the Alluvial Valley of the Lower Mississippi River, War Department, Corps of Engineers; US Army, Mississippi River Commission: Vicksburg, MS, USA, 1944. [Google Scholar]
- Saucier, R. Geomorphology and Quaternary Geologic History of the Lower Mississippi River Valley; U.S. Army Engineers Waterways Experiment, Mississippi River Commission: Vicksburg, MS, USA, 1994. [Google Scholar]
- Hudson, P.F.; Kessel, R.H. Channel migration and meander-bend curvature in the lower Mississippi River prior to major human modification. Geology 2000, 28, 531–534. [Google Scholar] [CrossRef]
- Wren, D.G.; Davidson, G.R.; Walker, W.G.; Galicki, S.J. The evolution of an oxbow lake in the Mississippi alluvial floodplain. J. Soil Water Conserv. 2008, 63, 129–135. [Google Scholar] [CrossRef]
- Wondim, Y.K.; Mosa, H.M. Spatial variation of sediment physicochemical characteristics of Lake Tana, Ethiopia. J. Environ. Earth Sci. 2015, 5, 95–109. [Google Scholar]
- Janssen, A.B.G.; van Wijk, D.; van Gervena, L.P.A.; Bakker, E.S.; Brederveld, R.J.; DeAngelis, D.L.; Janse, J.H.; Mooij, W.M. Success of lake restoration depends on spatial aspects of nutrient loading and hydrology. Sci. Total Environ. 2019, 679, 249–259. [Google Scholar] [CrossRef]
- Shaughnessy, A.R.; Sloan, J.J.; Corcoran, M.J.; Hasenmueller, E.A. Sediments in agricultural reservoirs act as sinks and sources for nutrients over various timescales. Water Resour. Res. 2019, 55, 5985–6000. [Google Scholar] [CrossRef]
- Wang, Y.; Kong, X.; Peng, Z.; Zhang, H.; Liu, G.; Hu, W.; Zhou, X. Retention of nitrogen and phosphorus in Lake Chaohu, China: Implications for eutrophication management. Environ. Sci. Poll. Res. 2020, 27, 41488–41502. [Google Scholar] [CrossRef]
- Harrison, J.A.; Maranger, R.J.; Alexander, R.B.; Giblin, A.E.; Jacinthe, P.A.; Mayorga, E.; Seitzinger, S.; Sobota, D.; Wollheim, W. The regional and global significance of nitrogen removal in lakes and reservoirs. Biogeochemistry 2009, 93, 143–157. [Google Scholar] [CrossRef]
- Knowles, R. Denitrification. Microbiol. Rev. 1982, 46, 43. [Google Scholar] [CrossRef]
- Saunders, D.L.; Kalff, J. Nitrogen retention in wetlands, lakes and rivers. Hydrobiologia 2001, 443, 205–212. [Google Scholar] [CrossRef]
- Seitzinger, S.P. Denitrification in freshwater and coastal marine ecosystems: Ecological and geochemical significance. Limnol. Oceanogr. 1988, 33, 702–724. [Google Scholar] [CrossRef]
- Seitzinger, S.P. Denitrification in Aquatic Sediments. In Denitrification in Soil and Sediment; Springer: Boston, MA, USA, 1990; pp. 301–322. [Google Scholar]
- Stall, J.B. Effects of sediment on water quality. J. Environ. Qual. 1972, 1, 353–360. [Google Scholar] [CrossRef]
- Nichols, D.S. Capacity of natural wetlands to remove nutrients from wastewater. J. Water Pollut. Control Fed. 1983, 55, 495–505. [Google Scholar]
- Hammer, D.A.; Knight, R.L. Designing constructed wetlands for nitrogen removal. Water Sci. Technol. 1994, 29, 15–27. [Google Scholar] [CrossRef]
- Huang, L.; Li, Z.; Bai, X.; Li, R.; Wu, H.; Wei, D.; Yu, L. Laboratory study of phosphorus retention and release by eutrophic lake sediments: Modeling and implications for P release assessments. Ecol. Eng. 2016, 95, 438–446. [Google Scholar] [CrossRef]
- Orihel, D.M.; Baulch, H.M.; Casson, N.J.; North, R.L.; Parsons, C.T.; Seckar, D.C.M.; Venkiteswaran, J.J. Internal phosphorus loading in Canadian fresh waters: A critical review and data analysis. Can. J. Fish. Aquat. Sci. 2017, 74, 2005–2029. [Google Scholar] [CrossRef] [Green Version]
- Randall, M.C.; Carling, G.T.; Dastrup, D.B.; Miller, T.; Nelson, S.T.; Rey, K.A.; Hansen, N.C.; Bickmore, B.R.; Aanderud, Z.T. Sediment potentially controls in-lake phosphorus cycling and harmful cyanobacteria in shallow, eutrophic Utah Lake. PLoS ONE 2019, 14, e0212238. [Google Scholar] [CrossRef]
- Jin, G.; Onodera, S.; Saito, M.; Shimizu, Y. Sediment phosphorus cycling in a nutrient-rich embayment in relation to sediment phosphorus pool and release. Limnology 2020, 21, 415–425. [Google Scholar] [CrossRef]
- Saikku, M. This Delta, This Land: An Environmental History of the Yazoo-Mississippi Floodplain; University of Georgia Press: Athens, GA, USA, 2005. [Google Scholar]
- Shields, D.F., Jr.; Lizotte, R.E.; Knight, S.S. Spatial and temporal water quality variability in aquatic habitats of a cultivated floodplain. River Res. Appl. 2013, 29, 313–329. [Google Scholar] [CrossRef]
- Sartory, D.P.; Grobbelaar, J.U. Extraction of chlorophyll a from freshwater phytoplankton for spectrophotometric analysis. Hydrobiologia 1984, 114, 177–187. [Google Scholar] [CrossRef]
- Welschmeyer, N.A. Fluorometric analysis of chlorophyll a in the presence of chlorophyll b and pheopigments. Limnol. Oceanogr. 1994, 39, 1985–1992. [Google Scholar] [CrossRef]
- Crumpton, W.G.; Isenhart, T.M.; Mitchell, P.D. Nitrate and organic N analyses with second-derivative spectroscopy. Limnol. Oceanogr. 1992, 37, 907–913. [Google Scholar] [CrossRef] [Green Version]
- Murphy, J.; Riley, J.P. A modified single solution method for the determination of phosphate in natural waters. Anal. Chim. Acta. 1962, 27, 31–36. [Google Scholar] [CrossRef]
- Stainton, M.; Capel, M.; Armstrong, F. The Chemical Analysis of Fresh Water, 2nd ed.; Department of the Environment (Canada): Winnipeg, MB, Canada, 1977. [Google Scholar]
- American Public Health Association. Standard Methods of Water and Wastewater, 21st ed.; American Public Health Association: Washington, DC, USA, 2005. [Google Scholar]
- Nifong, R.L.; Taylor, J.M.; Moore, M.T. Mulch-derived organic carbon stimulates high denitrification fluxes from agricultural ditch sediments. J. Environ. Qual. 2019, 48, 476–484. [Google Scholar] [CrossRef] [Green Version]
- Speir, S.L.; Taylor, J.M.; Scott, J.T. Seasonal Differences in Relationships between Nitrate Concentration and Denitrification Rates in Ditch Sediments Vegetated with Rice Cutgrass. J. Environ. Qual. 2017, 46, 1500–1509. [Google Scholar] [CrossRef]
- Holtan-Hartwig, L.; Dörsch, P.; Bakken, L.R. Low temperature control of soil denitrifying communities: Kinetics of N2O production and reduction. Soil Biol. Biochem. 2002, 34, 1797–1806. [Google Scholar] [CrossRef]
- Rysgaard, S.; Glud, R.N.; Risgaard-Petersen, N.; Dalsgaard, T. Denitrification and anammox activity in Arctic marine sediments. Limnol. Oceanogr. 2004, 49, 1493–1502. [Google Scholar] [CrossRef]
- Kana, T.M.; Darkangelo, C.; Hunt, M.D.; Oldham, J.B.; Bennett, G.E.; Cornwell, J.C. Membrane Inlet Mass Spectrometer for Rapid High-Precision Determination of N2, O2, and Ar in Environmental Water Samples. Anal. Chem. 1994, 66, 4166–4170. [Google Scholar] [CrossRef]
- Nakagawa, S.; Schielzeth, H. A general and simple method for obtaining R2 from generalized linear mixed-effects models. Methods Ecol. Evol. 2013, 4, 133–142. [Google Scholar] [CrossRef]
- R Core Team. R: A Language and Environment for Statistical Computing; R Foundation for Statistical Computing: Vienna, Austria, 2017. [Google Scholar]
- Pinheiro, J.; Bates, D.; Deb-Roy, S.; Sarkar, D.; Heisterkamp, S.; van Willigen, D.; Matintainer, R. Package ‘nlme’. Linear Nonlinear Mixed Effects Models; R Core Team: Vienna, Austria, 2021; p. 3. [Google Scholar]
- Bartoń, K. MuMIn: Multi-Model Inference; R Package Version 1.42.1; R Core Team: Vienna, Austria, 2018. [Google Scholar]
- Ogle, D.; Ogle, M.D. Package ‘FSA’. CRAN Repos 2017, 1–206. [Google Scholar]
- Locke, M.A.; Lizotte, R.E.; Yasarer LM, W.; Bingner, R.L.; Moore, M.T. Moore. Surface runoff in Beasley Lake watershed: Effect of land management practices in a Lower Mississippi River Basin watershed. J. Soil Water Conserv. 2020, 75, 278–290. [Google Scholar] [CrossRef]
- Kõiv, T.; Nõges, T.; Laas, A. Phosphorus retention as a function of external loading, hydraulic turnover time, area and relative depth in 54 lakes and reservoirs. Hydrobiologia 2011, 660, 105–115. [Google Scholar] [CrossRef]
- Arango, C.P.; Tank, J.L.; Johnson, L.T.; Hamilton, S.K. Assimilatory uptake rather than nitrification and denitrification determines nitrogen removal patterns in streams of varying land use. Limnol. Oceanogr. 2008, 53, 2558–2572. [Google Scholar] [CrossRef] [Green Version]
- Mitsch, W.J.; Zhang, L.; Anderson, C.J.; Altor, A.E.; Hernandez, M.E. Creating riverine wetlands: Ecological succession, nutrient retention, and pulsing effects. Ecol. Eng. 2005, 25, 510–527. [Google Scholar] [CrossRef]
- Bernot, M.J.; Dodds, W.K. Nitrogen retention, removal, and saturation in lotic ecosystems. Ecosystems 2005, 8, 442–453. [Google Scholar] [CrossRef]
- Hill, A.R. Phosphorus and major cation mass balance for two rivers during low summer flows. Freshw. Biol. 1982, 12, 293–304. [Google Scholar] [CrossRef]
- Munn, N.L.; Meyer, J.L. Habitat-specific solute retention in two small streams: An intersite comparison. Ecology 1990, 71, 2351–2357. [Google Scholar] [CrossRef]
- Lizotte, R.E.; Locke, M.A. Assessment of runoff water quality for an integrated best management practice system in an agricultural watershed. J. Soil Water Conserv. 2018, 73, 247–256. [Google Scholar] [CrossRef] [Green Version]
- Dodds, W.K. Misuse of inorganic N and soluble reactive P concentrations to indicate nutrient status of surface waters. J. North Am. Benthol. Soc. 2003, 22, 171–181. [Google Scholar] [CrossRef] [Green Version]
- Dodds, W.K.; Smith, V.H.; Lohman, K. Nitrogen and phosphorus relationships to benthic algal biomass in temperate streams. Can. J. Fish. Aquat. Sci. 2002, 59, 865–874. [Google Scholar] [CrossRef] [Green Version]
- Hall, R.O., Jr.; Tank, J.L.; Sobota, D.J.; Mulholland, P.J.; O’Brien, J.M.; Dodds, W.K.; Arangob, C.P. Nitrate removal in stream ecosystems measured by 15N addition experiments: Total uptake. Limnol. Oceanogr. 2009, 54, 653–665. [Google Scholar] [CrossRef] [Green Version]
- Spieles, D.J.; Mitsch, W.J. The effects of season and hydrologic and chemical loading on nitrate retention in constructed wetlands: A comparison of low- and high-nutrient riverine systems. Ecol. Eng. 1999, 14, 77–91. [Google Scholar] [CrossRef]
- Haggard, B.E.; Storm, D.E.; Stanley, E.H. Effect of a point source input on stream nutrient retention. J. Am. Water Resour. Assoc. 2001, 37, 1291–1299. [Google Scholar] [CrossRef]
- Marchant, H.K.; Holtappels, M.; Lavik, G.; Ahmerkamp, S.; Winter, C.; Kuypers, M.M. Coupled nitrification–denitrification leads to extensive N loss in subtidal permeable sediments. Limnol. Oceanogr. 2016, 61, 1033–1048. [Google Scholar] [CrossRef] [Green Version]
- Lotti, T.; Kleerebezem, R.; van Loosdrecht, M.C.M. Effect of temperature change on anammox activity. Biotechnol. Bioeng. 2015, 112, 98–103. [Google Scholar] [CrossRef]
- Wu, Y.; Wen, Y.; Zhou, J.; Wu, Y. Phosphorus release from lake sediments: Effects of pH, temperature and dissolved oxygen. KSCE J. Civ. Eng. 2014, 18, 323–329. [Google Scholar] [CrossRef]
- McDowell, R.W.; Elkin, K.R.; Kleinman, P.J. Temperature and nitrogen effects on phosphorus uptake by agricultural stream-bed sediments. J. Environ. Qual. 2017, 46, 295–301. [Google Scholar] [CrossRef]
- Spears, B.M.; Carvalho, L.; Perkins, R.; Paterson, D.M. Effects of light on sediment nutrient flux and water column nutrient stoichiometry in a shallow lake. Water Res. 2008, 42, 977–986. [Google Scholar] [CrossRef]
- Pettry, D.E.; Switzer, R.E. Sharkey Soils in Mississippi. Mississippi State: Office of Agricultural Communications (Publications Section); Division of Agriculture, Forestry, and Veterinary Medicine, Mississippi State University: Starkville, MS, USA, 1996; Volume 1057. [Google Scholar]
- Hermans, M.; Risgaard-Petersen, N.; Meysman, F.J.; Slomp, C.P. Biogeochemical impact of cable bacteria on coastal Black Sea sediment. Biogeosciences 2020, 17, 5919–5938. [Google Scholar] [CrossRef]
- Wren, D.G.; Davidson, G.R. Using lake sedimentation rates to quantify the effectiveness of erosion control in watersheds. J. Soil Water Conserv. 2011, 66, 313–322. [Google Scholar] [CrossRef]
- Van Luijn, F.; Boers, P.C.M.; Lijklema, L.; Sweerts, J.P. Nitrogen fluxes and processes in sandy and muddy sediments from a shallow eutrophic lake. Water Res. 1999, 33, 33–42. [Google Scholar] [CrossRef]
- Zhang, X.; Liu, Z.; Gulati, R.D.; Jeppesen, E. The effect of benthic algae on phosphorus exchange between sediment and overlying water in shallow lakes: A microcosm study using 32 P as a tracer. Hydrobiologia 2013, 710, 109–116. [Google Scholar] [CrossRef]
- Wren, D.G.; Taylor, J.M.; Rigby, J.R.; Locke, M.A.; Yasarer, L.M. Short term sediment accumulation rates reveal seasonal time lags between sediment delivery and deposition in an oxbow lake. Agric. Ecosyst. Environ. 2019, 281, 92–99. [Google Scholar] [CrossRef]
- Aryal, N.; Reba, M.L.; Straitt, N.; Teague, T.G.; Bouldin, J.; Dabney, S. Impact of cover crop and season on nutrients and sediment in runoff water measured at the edge of fields in the Mississippi Delta of Arkansas. J. Soil Water Conserv. 2018, 73, 24–34. [Google Scholar] [CrossRef]
Figure 1.
(A) Five sample sites (filled circles) established longitudinally from north (upstream) to south (downstream) within Roundaway Lake, Coahoma County, Mississippi, USA. (B) Photograph of Roundaway Lake site 3 showing the bald cypress (Taxodium distichum (L.) Rich.) tree line and relative spacing of mid-lake (M), tree line (T), and shore (S) sediment samples.

Figure 2.
Water quality differences among sampling months (April, May, June) in Roundaway Lake, MS. Circles represent sites and colors represent months, with closer sites being more similar in water quality. Arrows denote the variable loadings and strengths (arrow length) relative to each principal component. The principal component analysis shows water quality segregated more by month than by location in the lake, and differences are driven mainly by temperature, nutrients, water clarity, dissolved oxygen (DO), and suspended organic matter (ash-free dry mass, AFDM).

Figure 3.
Sediment core (A) nitrate and (B) soluble reactive phosphate (SRP) flux rates by site for all months and depth habitats combined at each site. Negative values indicate a movement of nitrate or SRP from the water to the sediments and positive values indicate nitrate or SRP release from the sediments into the water. Bars are the means across depths and months, and error bars are 95% confidence intervals.

Figure 4.
Sediment core (A) nitrate and (B) soluble reactive phosphate (SRP) flux rates by site across months in Roundaway Lake, MS. Points are coded by depth habitat (mid-lake, green circles; edge of bald cypress (Taxodium distichum (L.) Rich.) trees, red circles; or near shore, blue circles). Negative values indicate a movement of nitrate or SRP from the water to the sediments and positive values indicate a nitrate or SRP release from the sediments into the water.

Figure 5.
Nutrient flux vs. water temperature for nitrate (Nitrate flux, mg/m2/h), soluble reactive phosphorus (SRP flux, mg/m2/h), denitrification (mg/m2/h), and sediment oxygen demand (SOD, mg/m2/h) in sediments from Roundaway Lake, MS. Negative nitrate and SRP fluxes indicate nutrient uptake by sediments. Bars are the means and error bars are 95% CIs. Different letters indicate temperature treatments that are significantly different.


Table 1.
Spatial assessment of sediment nitrate and soluble reactive phosphorus (SRP)h uptake rates comparing sites, depth habitat (mid-lake, bald cypress (Taxodium distichum (L.) Rich.) tree edge, shore), and month. Significant p-values are in italics.
Table 1.
Spatial assessment of sediment nitrate and soluble reactive phosphorus (SRP)h uptake rates comparing sites, depth habitat (mid-lake, bald cypress (Taxodium distichum (L.) Rich.) tree edge, shore), and month. Significant p-values are in italics.
| Nitrate Flux | |||||
|---|---|---|---|---|---|
| Variation | df | Type II Sums of Squares | Mean Square | F Statistic | p |
| Site | 4 | 496.8 | 124.2 | 8.15 | <0.001 |
| Habitat | 2 | 68.4 | 34.2 | 2.24 | 0.130 |
| Month | 2 | 744.4 | 372.2 | 24.41 | <0.001 |
| Site × Month | 8 | 1128.9 | 141.1 | 9.26 | <0.001 |
| Habitat × Month | 4 | 28.3 | 7.1 | 0.46 | 0.761 |
| Residuals | 21 | 335.4 | 15.2 | ||
| SRP Flux | |||||
| Variation | df | Type II Sums of Squares | Mean Square | F Statistic | p |
| Site | 4 | 25.8 | 6.45 | 3.61 | 0.019 |
| Habitat | 2 | 0.1 | 0.05 | 0.03 | 0.973 |
| Month | 2 | 16.1 | 3.07 | 1.76 | 0.201 |
| Site × Month | 8 | 40.3 | 5.04 | 2.82 | 0.024 |
| Habitat × Month | 4 | 3.4 | 0.86 | 0.48 | 0.751 |
| Residuals | 21 | 42.9 | 1.79 | ||
Table 2.
Linear mixed model regression results of nitrate and soluble reactive phosphorus (SRP) flux rates vs. integrated water chemistry in Roundaway Lake, MS.
Table 2.
Linear mixed model regression results of nitrate and soluble reactive phosphorus (SRP) flux rates vs. integrated water chemistry in Roundaway Lake, MS.
| Model Parameters | AICc | Δi | wi | K | R2 Marginal | R2 Conditional | |
|---|---|---|---|---|---|---|---|
| Core Nitrate Flux | DO, Month, Temp, TN, TP, Secchi | 297.1 | 0 | 0.313 | 10 | 0.57 | 0.82 |
| DO, Month, PO4, Secchi, Temp, TN | 297.9 | 0.79 | 0.211 | 10 | 0.53 | 0.84 | |
| AFDM (water), DO, Month, Secchi, Temp, TN | 297.9 | 0.82 | 0.208 | 10 | 0.55 | 0.85 | |
| Core SRP Flux | AFDM (sediment), DO, Secchi, Temp, TP | 168.0 | 0 | 0.103 | 8 | 0.38 | 0.38 |
Table 3.
Relative importance of each model parameter on sediment nitrate and soluble reactive phosphorus flux rates. These values are the cumulative Akaike information criterion for small sample size (AICc) weights for each variable. Parameters that increase with increasing sediment nutrient uptake (negative flux rates) are in italics.
| Model Parameter | Sediment Nitrate | Sediment SRP |
|---|---|---|
| Month | 1.00 | 0.42 |
| Distance to Shore | 0.19 | 0.17 |
| Nitrate | 0.18 | 0.28 |
| Phosphate | 0.35 | 0.27 |
| Total Nitrogen | 0.86 | 0.30 |
| Total Phosphorus | 0.37 | 0.77 |
| Water Depth | 0.20 | 0.18 |
| Temperature | 1.00 | 0.44 |
| Dissolved Oxygen | 0.95 | 0.27 |
| Secchi Depth | 1.00 | 0.59 |
| pH | 0.24 | 0.39 |
| Sediment AFDM | 0.14 | 0.77 |
| Water AFDM | 0.33 | 0.24 |
Publisher’s Note: MDPI stays neutral with regard to jurisdictional claims in published maps and institutional affiliations. |
© 2021 by the authors. Licensee MDPI, Basel, Switzerland. This article is an open access article distributed under the terms and conditions of the Creative Commons Attribution (CC BY) license (https://creativecommons.org/licenses/by/4.0/).
Share and Cite
MDPI and ACS Style
Evans, J.L.; Murdock, J.N.; Taylor, J.M.; Lizotte, R.E., Jr. Sediment Nutrient Flux Rates in a Shallow, Turbid Lake Are More Dependent on Water Quality Than Lake Depth. Water 2021, 13, 1344. https://doi.org/10.3390/w13101344
AMA Style
Evans JL, Murdock JN, Taylor JM, Lizotte RE Jr. Sediment Nutrient Flux Rates in a Shallow, Turbid Lake Are More Dependent on Water Quality Than Lake Depth. Water. 2021; 13(10):1344. https://doi.org/10.3390/w13101344
Chicago/Turabian StyleEvans, Jordan L., Justin N. Murdock, Jason M. Taylor, and Richard E. Lizotte, Jr. 2021. "Sediment Nutrient Flux Rates in a Shallow, Turbid Lake Are More Dependent on Water Quality Than Lake Depth" Water 13, no. 10: 1344. https://doi.org/10.3390/w13101344
Note that from the first issue of 2016, this journal uses article numbers instead of page numbers. See further details here.