Article

Effects of Prometryn Exposure Scenarios on Microcystis aeruginosa Growth and Water Qualities in Incubator Experiments

Numerical Simulation Group for Water Environment, Key Laboratory of Pollution Processes and Environmental Criteria of the Ministry of Education, Tianjin Key Laboratory of Remediation and Pollution Control for Urban Ecological Environment, College of Environmental Science and Engineering, Nankai University, Tianjin 300350, China
*
Author to whom correspondence should be addressed.
Water 2021, 13(10), 1346; https://doi.org/10.3390/w13101346
Submission received: 7 April 2021 / Revised: 3 May 2021 / Accepted: 5 May 2021 / Published: 12 May 2021
(This article belongs to the Section Water Quality and Contamination)

Abstract

:
Although multiple herbicide exposures are more prospective to occur in water, many previous studies were carried out as single herbicide exposure. To investigate the toxic effect of prometryn on cyanobacteria and water qualities, single and double prometryn exposures (at different growth phases) on Microcystis aeruginosa growth and concentrations of nutrients were compared after a 44-day experiment. Results indicated that under single exposure, maximum inhibition rates were 4.7–12.0% higher than those under double exposures. Correspondingly, the maximum Microcystis aeruginosa densities and growth rates under single exposure were 10.3–21.1% and 19.5–37.7% lower than those under double exposures (p < 0.05), respectively. These findings revealed that repeated prometryn exposures resulted in a reduction in biological effects, because the time of application and the concentration injected during the first application were both significant factors in the biological effects of prometryn. Prometryn exposure scenarios did not have a significant effect on nutrient or nutrient consumption concentrations (p > 0.05). In general, the pattern of nutrient limitation showed a shift from phosphorus to nitrogen limitation. The quantified relationships between Microcystis aeruginosa growth rates and consumed nutrients were studied. Based on the above findings, we believe that a high-dose and single prometryn exposure is a more effective exposure pattern for limiting cyanobacteria growth.

1. Introduction

As reported by Kniss [1], with a steady, linear trend, the intensity of herbicide use has increased over the last 25 years. Through rainfall erosion, surface runoff, soil leaching, and so on, herbicides can enter the aquatic ecosystem [2]. Herbicide toxicity has been reported in aquatic organisms, such as microalgae [2]. Microalgae are organisms of ecological importance in the aquatic food chain, so the structure and function of the entire aquatic ecosystem can be affected by ecosystem toxic stress caused by herbicides [3,4]. In addition, environmentally exposed herbicides are harmful to human health [5], and have raised public concern about the pollution of aquatic systems [6].
Prometryn is a selective herbicide of s-triazine family, mainly used in various crops, including cotton, celery, and dill, to control annual grasses and broadleaf weeds [7]. The extensive use of prometryn results in its widespread distribution in the environment. In many parts of the world, prometryn can be found in natural water bodies [8]. Prometryn in water is quite stable with a long half-life time (above 390 d) and difficult to degrade [9,10]. Microalgae may be affected for a long time [2]. Prometryn can also bioaccumulate in the food web and be transported to long distances, making it a persistent pollutant in the environment [8]. Therefore, it is impossible to ignore the biological effects of prometryn. Prometryn has been banned in several countries and regions. However, it is still being widely used in China, South Africa, and many other countries [11].
Algal cells are ubiquitous in water, and are sensitive to pollutants [12]. They are frequently used to detect the effects of herbicide concentrations in water samples [13]. As one of the algal bloom-forming species [14], Microcystis aeruginosa (M. aeruginosa) is a common cyanobacterium in eutrophic water bodies in China [15], and is widely used in biological experiments [16].
Many mathematical equations are used in related research to systematically investigate the process of microbial growth [17,18,19]. The logistic equation can be used to derive the equations for cyanobacterium growth rates (specific growth rates), prometryn inhibition rates on cyanobacterium growth [20], and consumption of nutrients [17].
For single and multiple pollutant exposures, a variety of studies have been published [21]. Repeated exposures can generally increase [22,23], attenuate [24], or make no difference [25] compared to a single exposure to the biological effects of a pollutant. While the literature is sparse on studies evaluating the effect of prometryn exposure scenarios on M. aeruginosa growth or concentrations of nutrients, or its effect on the sensitivity of M. aeruginosa to prometryn.
Against the above background, single and double prometryn exposures were performed out in M. aeruginosa culture experiments, to examine whether prometryn exposure scenarios at different growth phases (single or double exposures resulting in the same target concentrations) could affect M. aeruginosa growth and concentrations of nutrients, and affect the toxic effects of prometryn on M. aeruginosa. The modified logistic equation is used to describe the growth of M. aeruginosa. Based on the modified Logistic equation, the equations of M. aeruginosa growth rate, specific growth rate, and inhibition rate [26] are used to reveal the effects of prometryn exposure scenarios on M. aeruginosa growth.

2. Materials and Methods

2.1. Experimental Materials

M. aeruginosa was purchased from the Freshwater Algae Culture Collection of the Institution of Hydrobiology (FACHB-905), the Chinese Academy of Sciences (No. 7 Donghu South Road, Wuchang District, Wuhan, Hubei Province, China).
Prometryn (purity ≥ 99.0%) was obtained from Shanghai Aladdin Biochemical Technology Company Limited (No. 196 Xinjinqiao Road, Pudong New District, Shanghai, China).
Before the experiments, the M. aeruginosa was pre-cultured as follows: M. aeruginosa was cultivated in illumination for 15 days. The M-II culture medium [27] was prepared in deionized water with 100 mg L−1 NaNO3, 10 mg L−1 K2HPO4, 75 mg L−1 MgSO4•7H2O, 40 mg L−1 CaCl2•2H2O, 20 mg L−1 Na2CO3, 6 mg L−1 Fe•citrate•xH2O, and 1 mg L−1 Na2EDTA•2H2O. The initial pH value was adjusted to 8.0 using 0.5 mol L−1 HCl and 0.5 mol L−1 NaOH. M. aeruginosa was grown under experimental conditions with supplementary heating and artificial light (day/night: 28/20 °C, 12 h/12 h). To prevent bacterial contamination, the culture flasks and media were sterilized by autoclaving at 121 °C and 150 kPa for 30 min before use. The medium containing M. aeruginosa was collected and subsequently centrifuged for 15 min at 3000 r min−1. After removal of the supernatant, the residues were washed with 15 mg L−1 NaHCO3 solution and then centrifuged. After repeating the above procedure twice, the M. aeruginosa obtained via this procedure was cultivated in M-II culture medium without nitrogen or phosphorus under the above-mentioned conditions for three days, defined as starvation cultivation, M. aeruginosa would deplete the intracellular polyphosphate stores [28].

2.2. Experimental Methods

The flasks named CK were used as the blank control only with the M-II culture medium (consumed nutrients in treatments with M. aeruginosa are calculated by subtracting the values of concentrations of nutrients from CK). The flasks named M0 with culture medium and M. aeruginosa were also prepared. The initial M. aeruginosa density was 50 × 103 cells mL−1 [29]. Three types of exposure levels (50, 100, and 200 μg L−1) were used to test the biological effects of prometryn exposure scenarios. The choice of prometryn concentrations was motivated by a previous study [26], where we observed that 50–200 μg L−1 of prometryn is unable to fully inhibit M. aeruginosa growth. For single exposure treatments (S50, S100, and S200), prometryn (50, 100, and 200 μg L−1) was dosed to the medium on Day 0; for double exposure treatments (D25, D50, and D100), prometryn (25, 50, and 100 μg L−1) was added to the medium on Day 0 (the beginning of the lag phase) and 12 (the beginning of the exponential phase).
The final volume of the culture medium was 400 mL (1 L flasks). Flasks were shaken and their positions were randomly altered three times a day. All treatments were prepared in triplicate.

2.3. Monitoring Indicators and Methods

The experiment was carried out in the laboratory of Nankai University’s School of Environmental Science and Engineering. Water sampling started one day after M. aeruginosa addition. Filtered water samples through 0.45-μm membrane filters were used for the determination of ammonia nitrogen (NH4+-N), total dissolved nitrogen (TDN), orthophosphate (PO43−-P), and total dissolved phosphorus (TDP). Before being analyzed, TDN and TDP samples were autoclave digested. NH4+-N was analyzed using the phenol-hypochlorite method [30]. TDN was analyzed using the procedure of alkaline potassium persulfate digestion with ultra-violet light spectroscopy [31]. Concentrations of PO43−-P and TDP were determined via the persulfate digestion and ammonium molybdate spectrophotometric method [30].
During the experimental period (44-day), M. aeruginosa cell densities (N) were counted using a haemacytometer under a microscope [28,32]. Counting was performed five times per sample. We monitored the cell density regularly until no M. aeruginosa cell growth was observed. Growth rates [33] and specific growth rates [34] were calculated as: μ c = (N2N1)/(t2t1) and μ c = (lnN2 − lnN1)/(t2t1), respectively. Where N1 and N2 are the cell densities on Days t1 and t2, respectively. In the present study, the inhibition rate was defined as the ratio of the difference between the density of cyanobacteria in treatments without and with prometryn to the density of cyanobacteria in the treatment without prometryn, calculated as I = [(NM − NP)/NM] * 100, where NM and NP are the densities of cells in treatments without and with prometryn. Concentrations of nutrients (NH4+-N, TDN, PO43−-P, and TDP) and M. aeruginosa densities were alternately measured every 2 days.

2.4. Statistical Analysis

The modified logistic equation was fitted to the experimental data using Origin 9.0. Student’s t-tests evaluated the significance of the distinction between parameters affected by the scenario of prometryn exposure (single or double exposures). One-way analysis of variance was used to determine the significance of the differences among parameters affected by prometryn exposure concentrations (50, 100, or 200 μg L−1) (ANOVA). Differences were regarded as significant when p < 0.05. All statistical analyses were carried out with SPSS 17.0.

3. Theoretical Background

The logistic equation has been shown to accurately describe algae growth [17,35,36,37]. However, the original form of the logistic equation does not satisfy the initial condition, i.e., N = N0 when t = 0. Therefore, Huang et al. [26] proposed a modified logistic equation to meet the initial condition, as shown in Equation (1):
N = N m a x 1 + e a r t + N 0 N m a x 1 + e a
where N (×103 cells mL−1) is the cyanobacteria density at any time, N0 (×103 cells mL−1) is the initial cyanobacteria density at Day 0 (50 × 103 cells mL−1 in the present study), Nmax (×103 cells mL−1) is the maximum cyanobacteria density, r (d−1) is the intrinsic growth rate, t (d) is time, a (-) is a constant. Nmax, a, and r can be obtained by fitting Equation (1) to experimental data.
Based on Equation (1), as reported by Huang et al. [26], the growth rate ( μ c ), specific growth rate ( μ c ), and the inhibition rate (I) of cyanobacteria can be determined as follows:
μ c = N m a x r e a r t ( 1 + e a r t ) 2
μ c = N m a x r e a r t ( 1 + e a ) ( 1 + e a r t ) [ ( N 0 + N 0 e a N m a x ) e a r t + N 0 + N 0 e a + N m a x e a ]
I = N m a x 0 1 + e a 0 r 0 t + N 0 0 N m a x 0 1 + e a 0 N m a x n 1 + e a n r n t N 0 n + N m a x n 1 + e a n N m a x 0 1 + e a 0 r 0 t + N 0 0 N m a x 0 1 + e a 0 × 100 %
where I (%) is the inhibition rate, Nmax−n (×103 cells mL−1), an (-), rn (d−1) and N0−n represent Nmax, a, r and N0 of experimental treatments with prometryn in the modified Logistic equation, and Nmax−0 (×103 cells mL−1), a0 (-), r0 (d−1) and N0−0 represent Nmax, a, r and N0 of experimental treatments without prometryn in the corresponding modified logistic equation. The growth rate reaches its maximal value μ c max = rNmax/4 (×103 cells (mL d)−1) when N = Nmax/2 [35,36].
Monod function has been widely used to model relationships between specific growth rates of cyanobacteria (microalgae) and limiting substrate concentrations [38,39]. As shown in Equation (5):
μ c = μ m C K c + C
where C (mg L−1) is the concentration of a rate-limiting nutrient, μm (d−1) is the maximum specific growth rate and Kc (mg L−1) is the half-saturation coefficient.
As mentioned before, the modified logistic equation can describe the specific growth rate of cyanobacteria. Therefore, the combination of the modified logistic equation and Monod equation was studied. According to Equations (3) and (5), concentrations of nutrients can be described by Equation (6):
C = K c N m a x r e a r t ( 1 + e a ) μ m ( 1 + e a r t ) [ ( N 0 + N 0 e a N m a x ) e a r t + N 0 + N 0 e a + N m a x e a ] N m a x r e a r t ( 1 + e a )
in which values of μm, Kc, a, r and Nmax are given in Table 1.
The logistic equation can be used to simulate consumed nutrients versus incubation time [17], and the equation can be written as follows:
Δ C = Δ C m a x 1 + e a Δ C r Δ C t
in which t (d) is the incubation time, ΔC (mg L−1) is the concentration of consumed nutrients at time t, ΔCmax (mg L−1) is the maximum concentration of consumed nutrients, rΔC (d−1) is the consumed rate constant and aΔC (-) is a constant.
According to Equations (1) and (7), cyanobacteria densities can be expressed through Equation (8) as a function of concentrations of consumed nutrients. Based on Equations (2) and (7), the equation of growth rates with respect to concentrations of consumed nutrients can be developed (Equation (9)). Besides, based on Equations (3) and (7), the equation of specific growth rates as a function of concentrations of consumed nutrients can be written as follows (Equation (10)):
N = N m a x 1 + e a r ( a Δ c ln ( Δ C m a x Δ C ) + l n Δ ) / r Δ c + N 0 N m a x 1 + e a
μ c = N m a x r e a r ( a Δ c ln ( Δ C m a x Δ C ) + l n Δ ) / r Δ c ( 1 + e a r ( a Δ c ln ( Δ C m a x Δ C ) + l n Δ ) / r Δ c ) 2
μ c = N m a x r e a r ( a Δ c ln ( Δ C m a x Δ C ) + l n Δ ) / r Δ c ( 1 + e a ) ( 1 + e a r ( a Δ c ln ( Δ C m a x Δ C ) + l n Δ ) / r Δ c ) [ ( N 0 + N 0 e a N m a x ) e a r ( a Δ c ln ( Δ C m a x Δ C ) + l n Δ ) / r Δ c + N 0 + N 0 e a + N m a x e a ]
where the parameters in Equations (8)–(10) are the same as those in Equations (1) and (7).

4. Results and Discussion

The kinetics of M. aeruginosa growth process (i.e., densities, growth rates, specific growth rates, and inhibition rates), concentrations of nutrients, and concentrations of consumed nutrients are computed from the 10th day onwards, because relative algae density counting errors are relatively large when algae densities are low at the start of the experiment [20].

4.1. M. aeruginosa Growth Kinetics

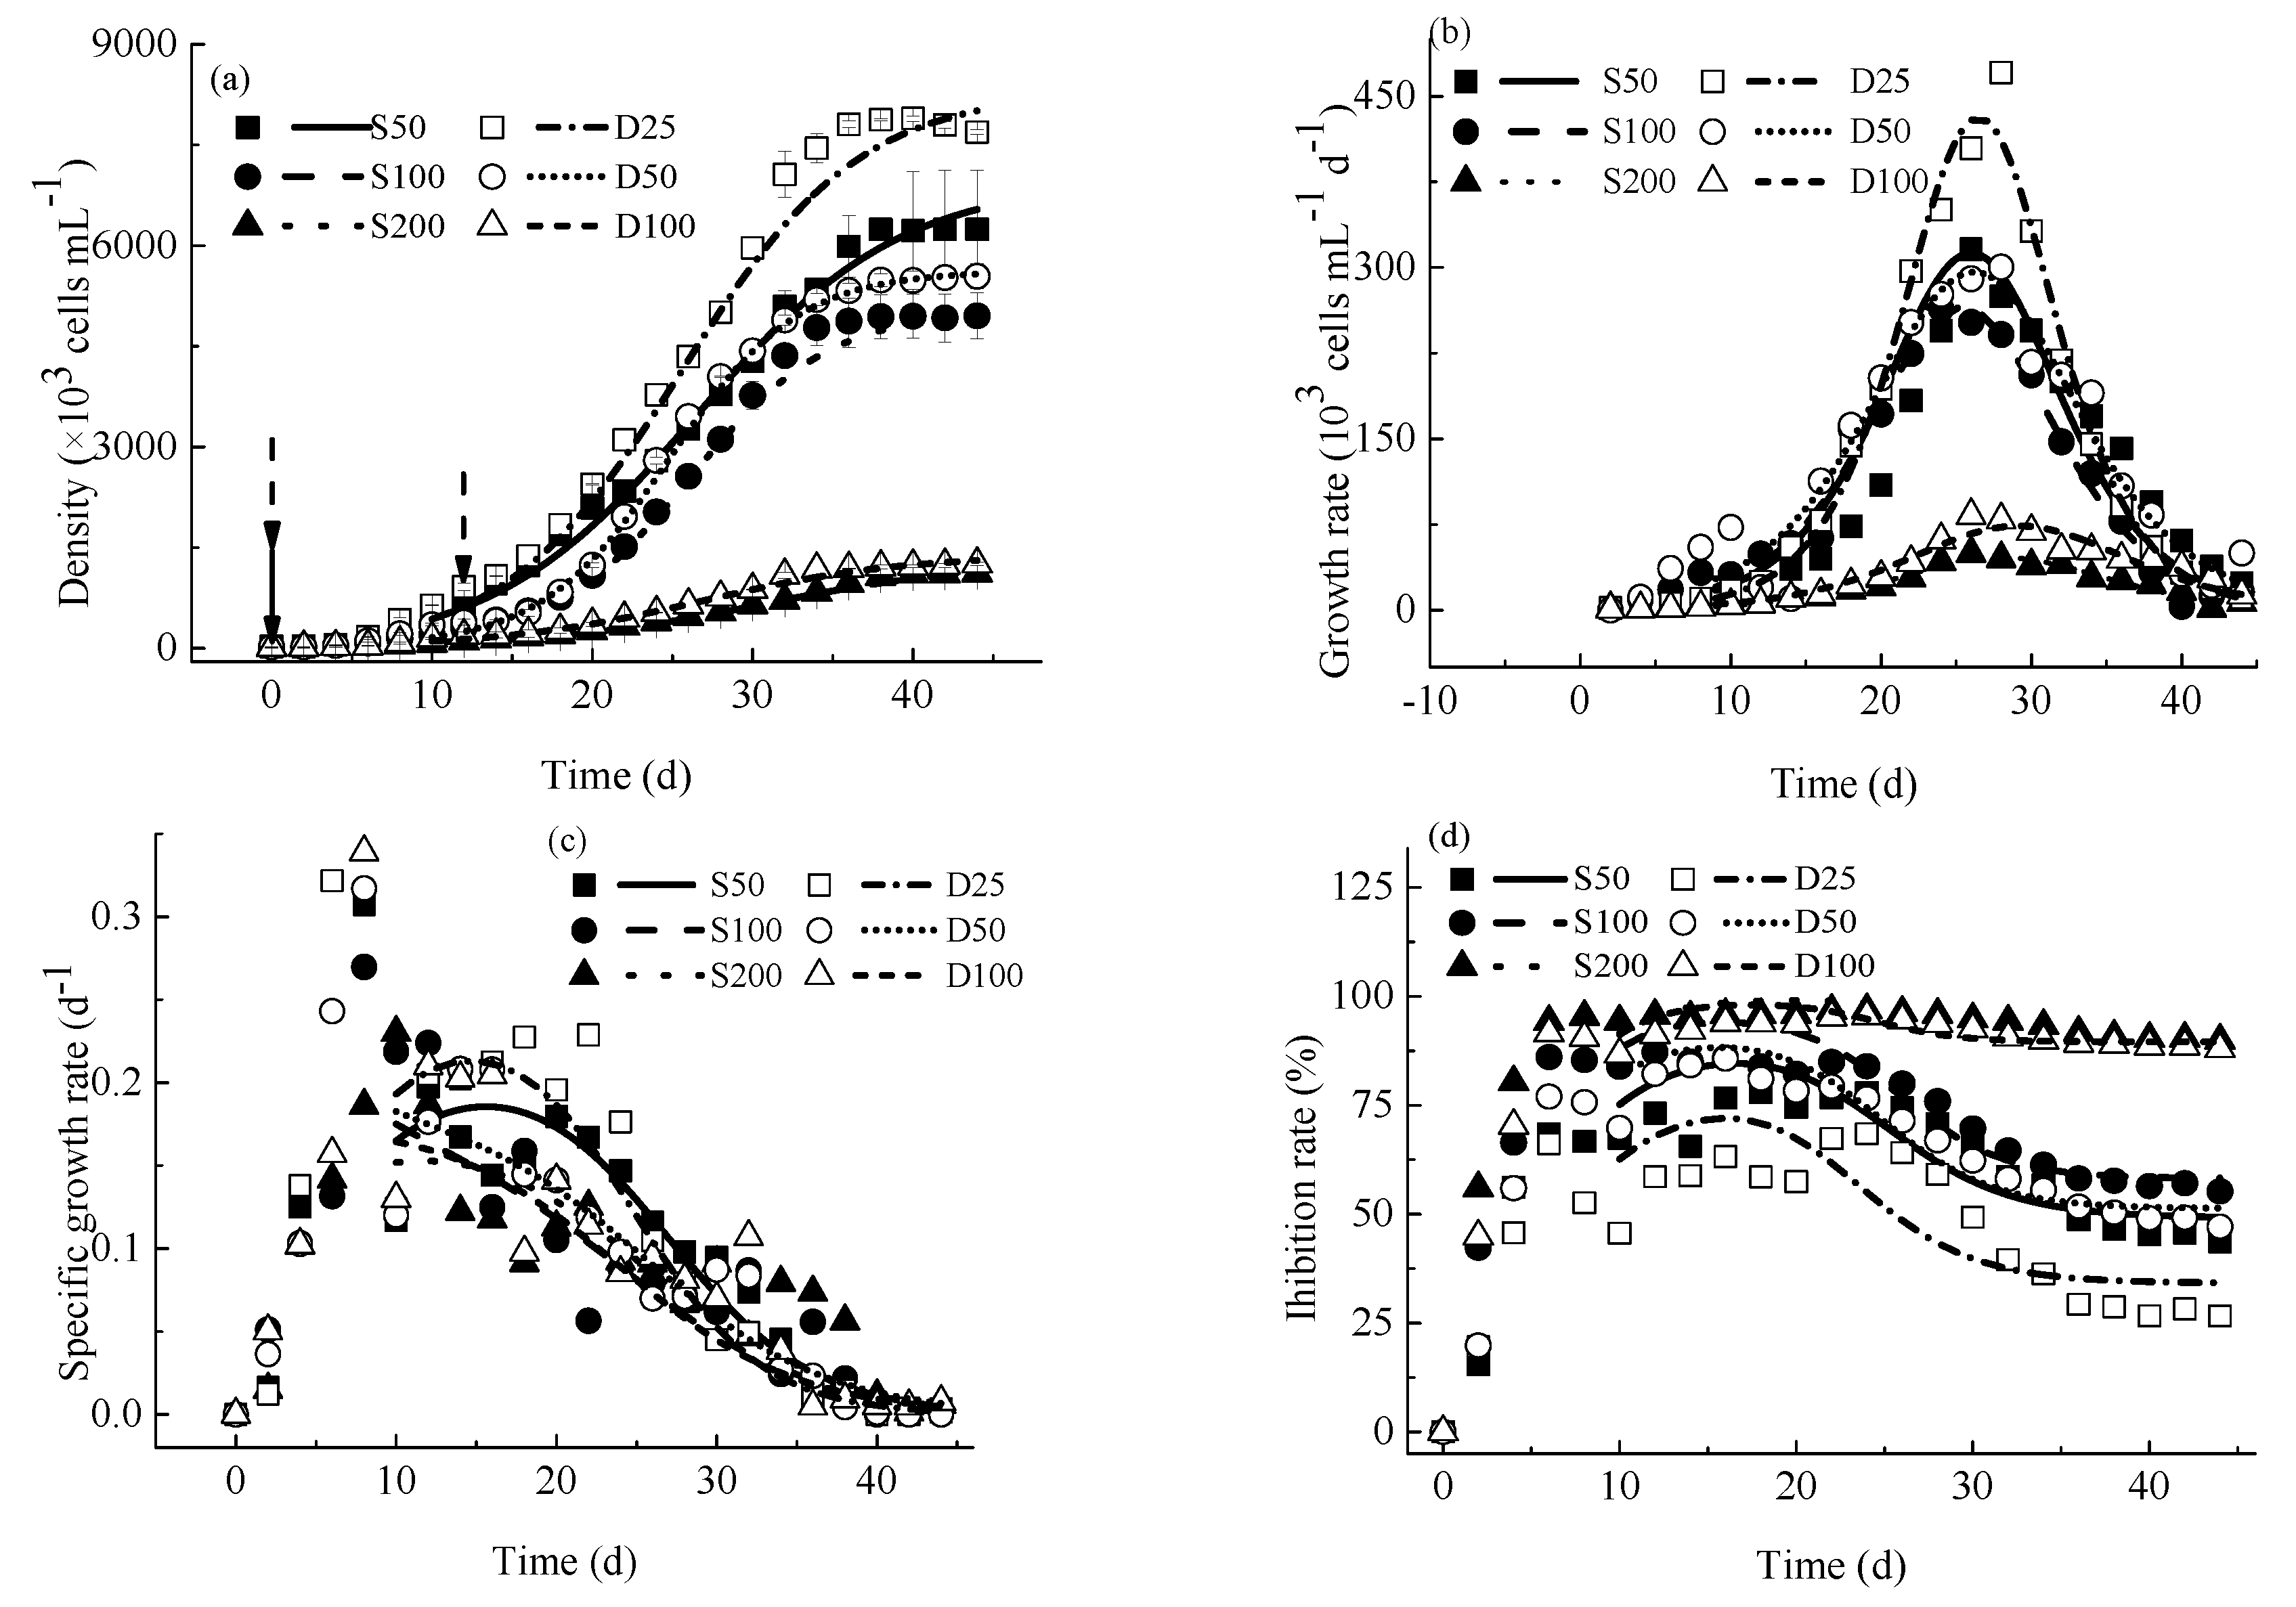
4.1.1. Variations of M. aeruginosa Densities

In the present study, variations of M. aeruginosa growth with time are shown in Figure 1a. In the lag phase, M. aeruginosa cell densities increased slowly. As time went by, the density of M. aeruginosa increased very rapidly in the exponential phase. Accompanied by a continuous reduction of concentrations of nutrients in culture solutions, the growth process of M. aeruginosa is gradually restricted by nitrogen and phosphorus nutrients, and finally, the M. aeruginosa growth reached the stationary phase. This was consistent with the study of Kong et al. [31], during which similar variations of M. aeruginosa growth in their 37-day experiment were observed. Equation (1) can describe the variation of M. aeruginosa growth with time with good accuracy (R2 = 0.966–0.998), and this is in agreement with the reported results [19].
Kooijman et al. [40] found that the maximum biomass and growth rate in the growth curve are manifested by the effect of a toxic agent on the growth of microalgae. Figure 1a and Table 1 showed that for the same prometryn concentration (50, 100, or 200 μg L−1, the rest is the same), the maximum M. aeruginosa densities (Nmax) in treatments under single exposure were 10.3–21.1% lower than those under double exposures, and the average M. aeruginosa densities (Nave) in treatments under single exposure were 18.3–26.9% lower than those under double exposures. Significant effects of prometryn exposure scenarios on Nmax and Nave are observed (Student’s t-test, df = 4, t = 7.352–11.496, p < 0.05), indicating that prometryn exposure scenarios can affect M. aeruginosa growth significantly. This could be because single-exposure prometryn injection concentrations are higher than double-exposure prometryn injection concentrations during the first application, and the time of application affects prometryn biological effects [23]. Taking into account the fact that the algae populations are most sensitive during the lag phase [41], it is understandable that the injected concentrations of prometryn are crucial in impacting M. aeruginosa growth at the beginning of the experiment.
From Table 1, for the same prometryn exposure scenario (single or double exposures, the rest is the same), the Nmax and Nave decreased with increasing concentrations of prometryn. Nmax and Nave in treatments with 200 μg L−1 prometryn are 76.0–79.5% lower than those with 100 μg L−1 prometryn, and 82.3–84.5% lower than those with 50 μg L−1 prometryn (ANOVA, p < 0.05). This indicates that the concentration of prometryn has a significant effect on M. aeruginosa cell densities.

4.1.2. Growth Rates

As shown in Figure 1b, M. aeruginosa growth rates in different treatments all increased with time before they reach their maximal values and then all decreased, which was inconsistent with McGaughy et al.’s study [42]. Equation (2) matches the measured data well (R2 = 0.572–0.910).
From Table 1, prometryn exposure scenarios have a significant impact on the maximum growth rate (μcmax) and average growth rate (μcave) of M. aeruginosa (Student’s t-test, df = 4, t = 3.698–10.685, p < 0.05). Under the same prometryn concentration, μcmax in S50, S100, and S200 were 37.7, 19.5, and 26.1% lower than those in D25, D50, and D100 respectively, and μcave in S50, S100, and S200 were 23.3, 15.3, and 16.0% lower than those in D25, D50, and D100, respectively.
Moreover, the concentration of prometryn has a significant effect on M. aeruginosa growth rate. Under the same exposure scenario, μcmax and μcave in treatments with 200 μg L−1 prometryn are 77.5–85.9% and 82.2–86.1% lower than those with 100 and 50 μg L−1 prometryn (ANOVA, p < 0.05), respectively. This is in line with Kong et al.’s study that μcmax shows a decrease with increasing prometryn concentrations [20], which corresponds to the inhibitory effect of prometryn on M. aeruginosa growth.

4.1.3. Specific Growth Rates

As shown in Figure 1c, the specific growth rates of M. aeruginosa increased firstly before reaching peak values and then decreased to almost 0 d−1. Equation (3) can describe variations of specific growth rates with time (R2 = 0.491 − 0.776).
Prometryn exposure scenarios have no significant effect on the μm or μcave of M. aeruginosa (Student’s t-test, df = 4, t = 1.385–4.470, p > 0.05). In addition, the concentration of prometryn also has no significant effect on M. aeruginosa specific growth rate. This is because the growth rate divided by algal density is the specific growth rate.

4.1.4. Inhibition Rates

Variations of inhibition rates of prometryn on M. aeruginosa with time are illustrated in Figure 1d. Inhibition rates increased rapidly in the first several days, and then gradually decreased due to potential adaptation of M. aeruginosa [43]. It should be noted that at the beginning of the experiment (0 d) and the beginning of the exponential phase of M. aeruginosa growth (12 d), the prometryn was injected under double exposures. Prometryn’s second exposure has no observable effect on the inhibition rate, probably because the time of application is very important regarding prometryn’s biological effects [23,44]. Variations in inhibition rates over time can be described reasonably by Equation (4) (R2 = 0.603–0.918) [26].
The maximum inhibition rates (Imax) of prometryn on M. aeruginosa were significantly affected by an exposure scenario, the Imax under single exposure are 4.7–12.0% higher than those under double exposures (Student’s t-test, df = 4, t = 205.232–899.000, p < 0.05). Under single exposure, average inhibition rates (Iave) are 3.9–25.9% greater than those under double exposure. A significant effect of exposure scenario on Iave was only observed between S50 and D25 (Student’s t-test, df = 4, t = 74.648, p < 0.05).
Our findings contradict those of Gao et al. [45], who discovered increased toxicity to the M. aeruginosa by low-dose and repeated exposures to the allelochemical N-phenyl-1-naphthylamine. It was possibly because the time of exposure in our study is completely different from their research. In Gao et al.’s study [45], the allelochemical N-phenyl-1-naphthylamine was exposed to algae 10 times in 9 days, while our exposure happened at different M. aeruginosa growth periods.
The concentration of prometryn has a significant effect on inhibition rates. In treatment with 200 μg L−1 prometryn, the Imax and Iave were higher than those in treatments with 100 and 50 μg L−1 prometryn (ANOVA, p < 0.05). This is following the published study that found significant differences between treatments with 50, 100, and 200 μg L−1 prometryn in inhibition rates [20].

4.2. Nutrients Kinetics

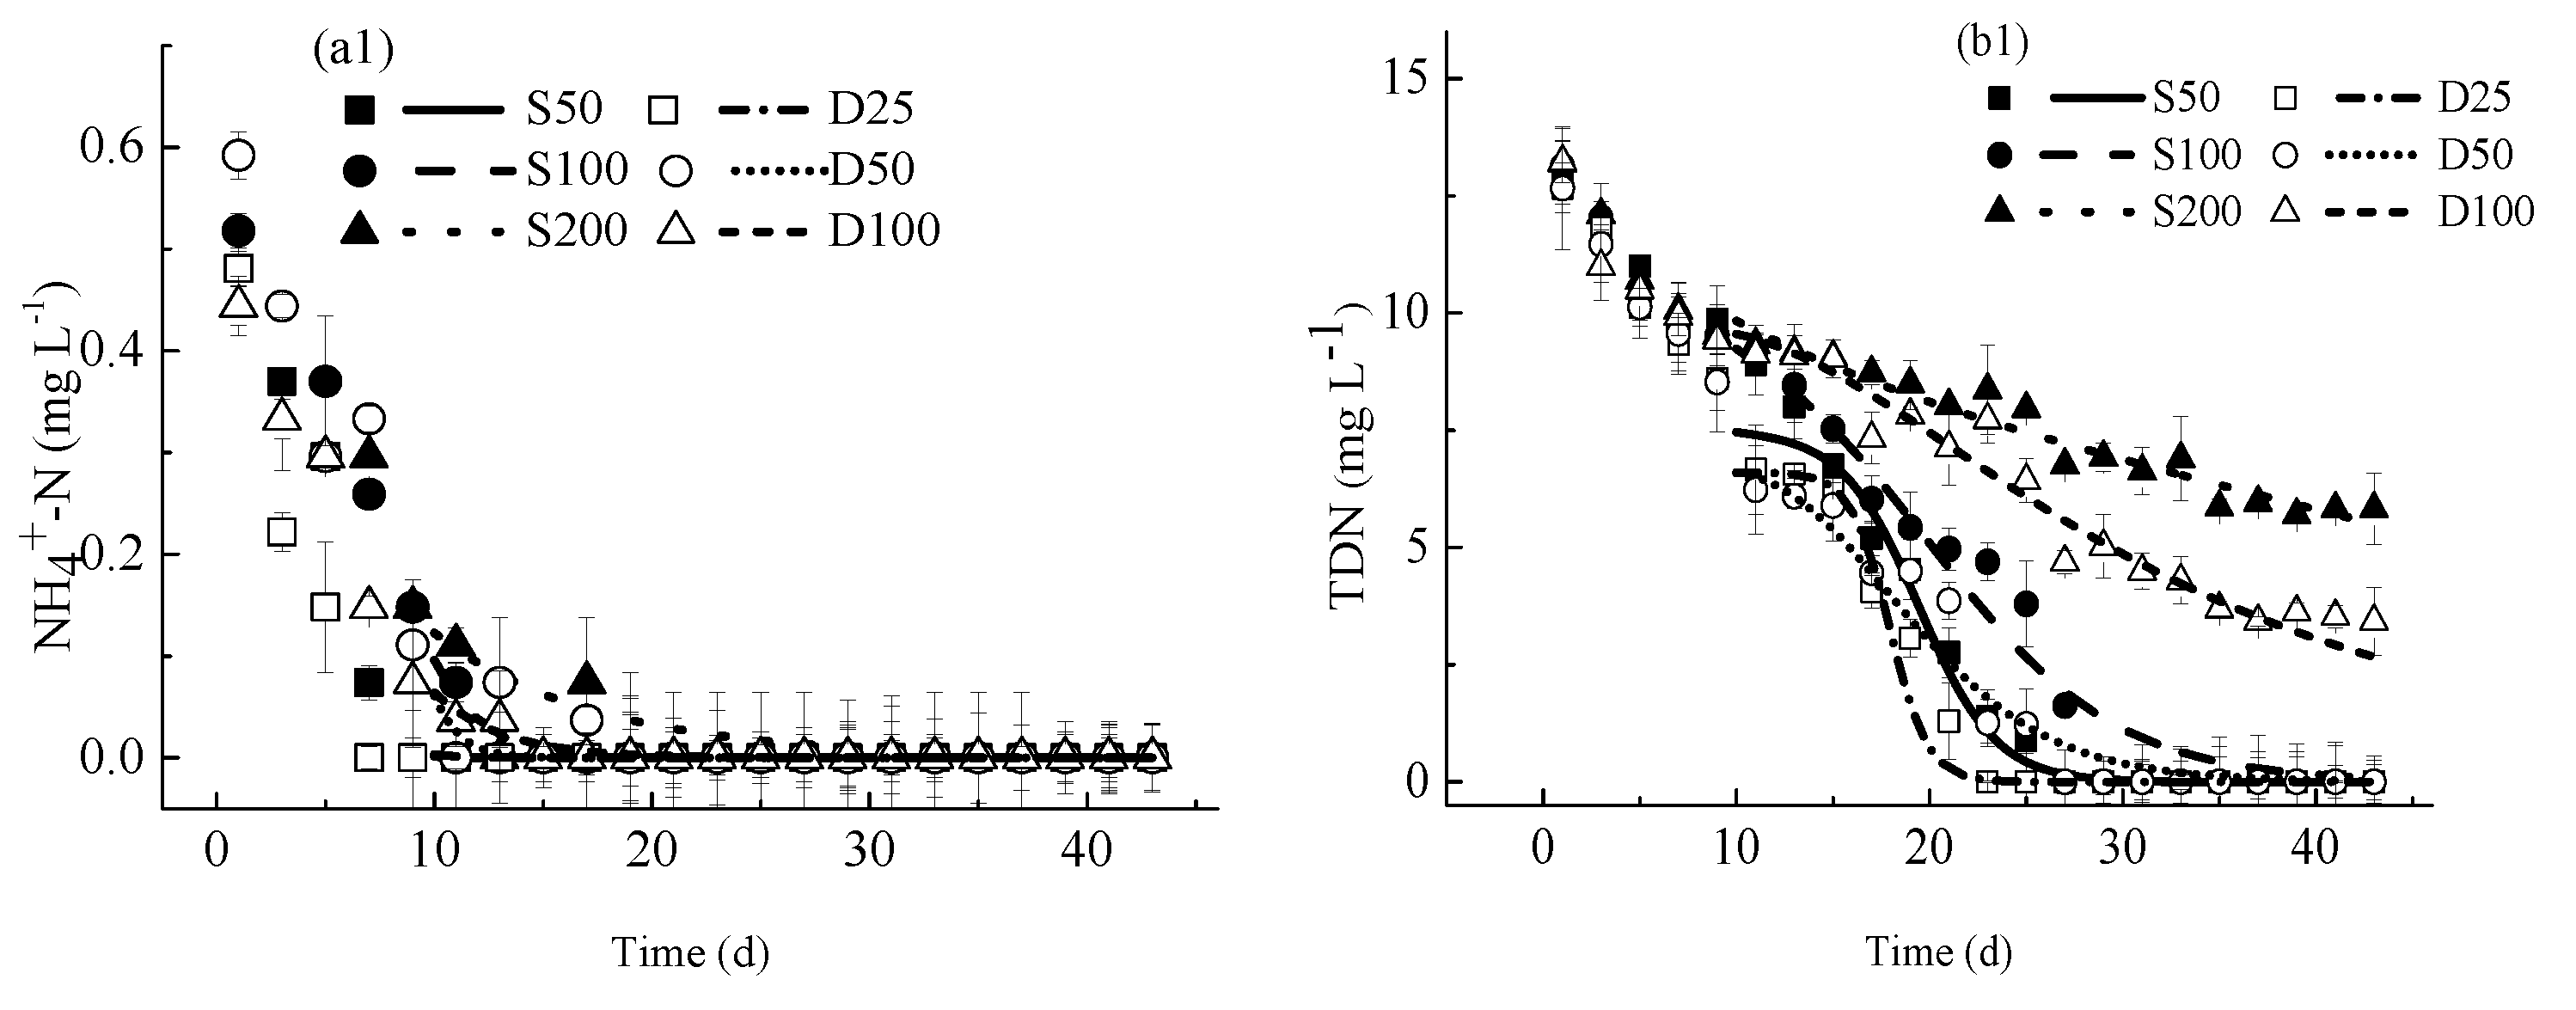
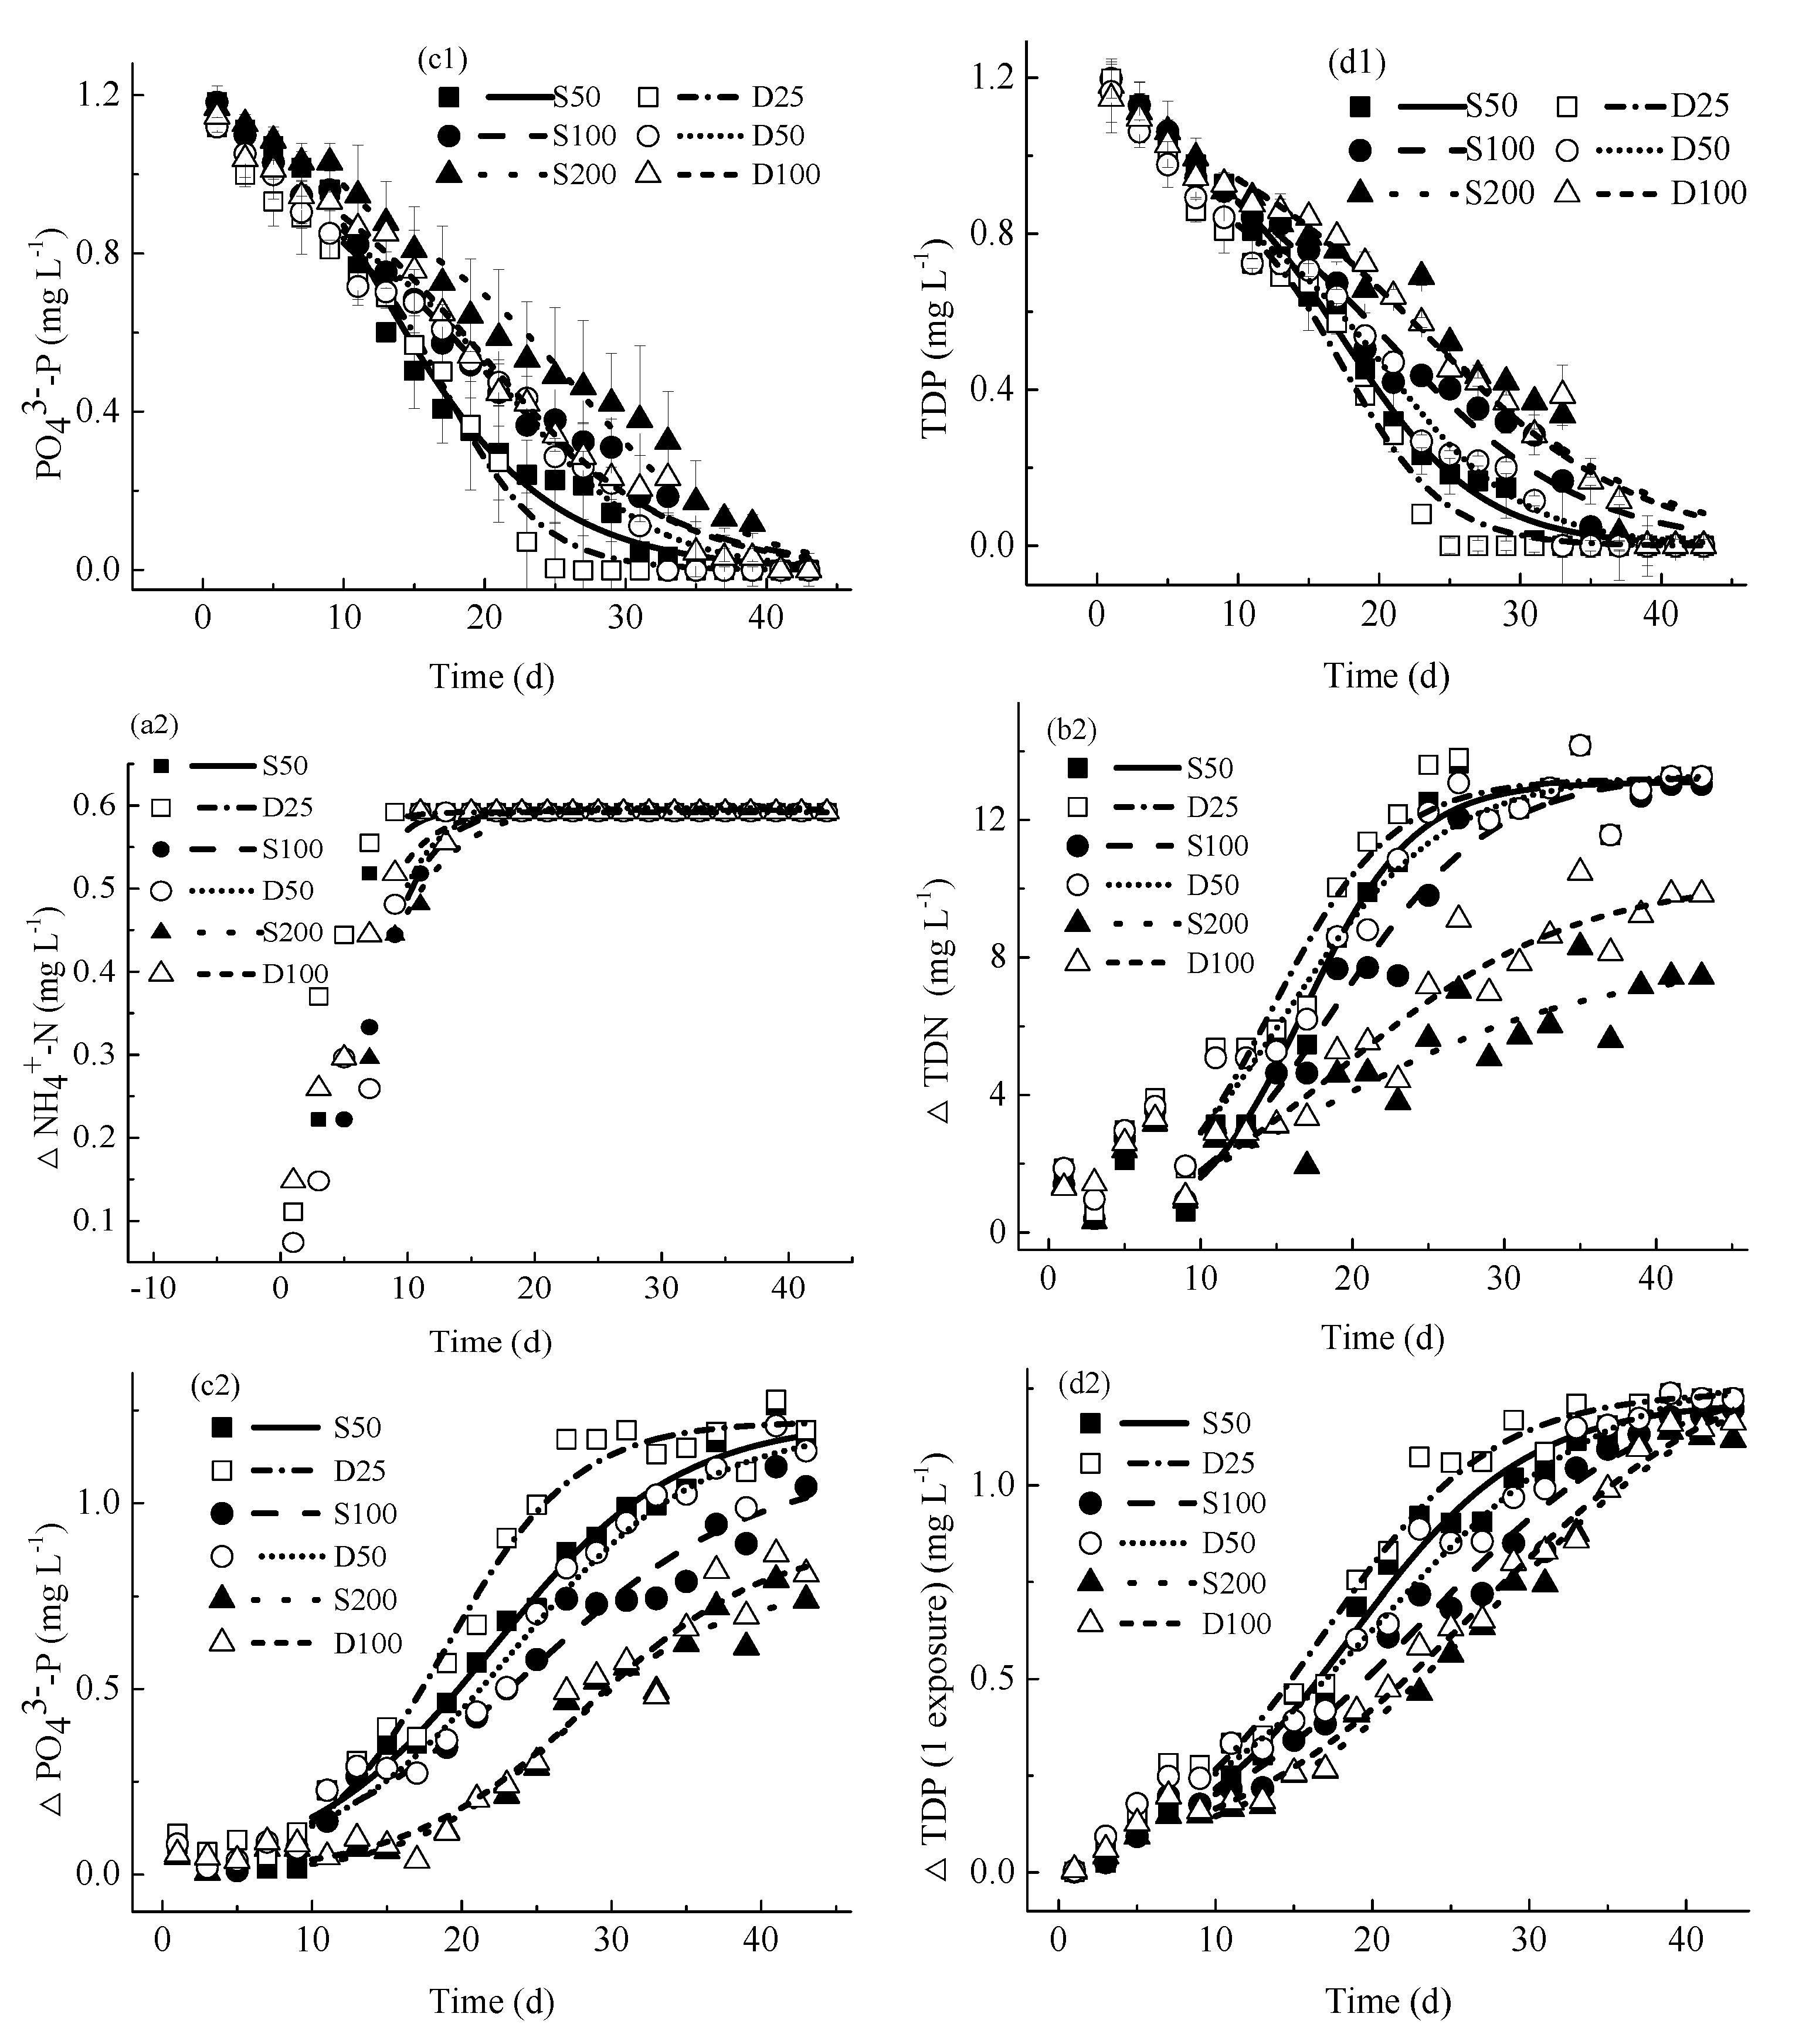
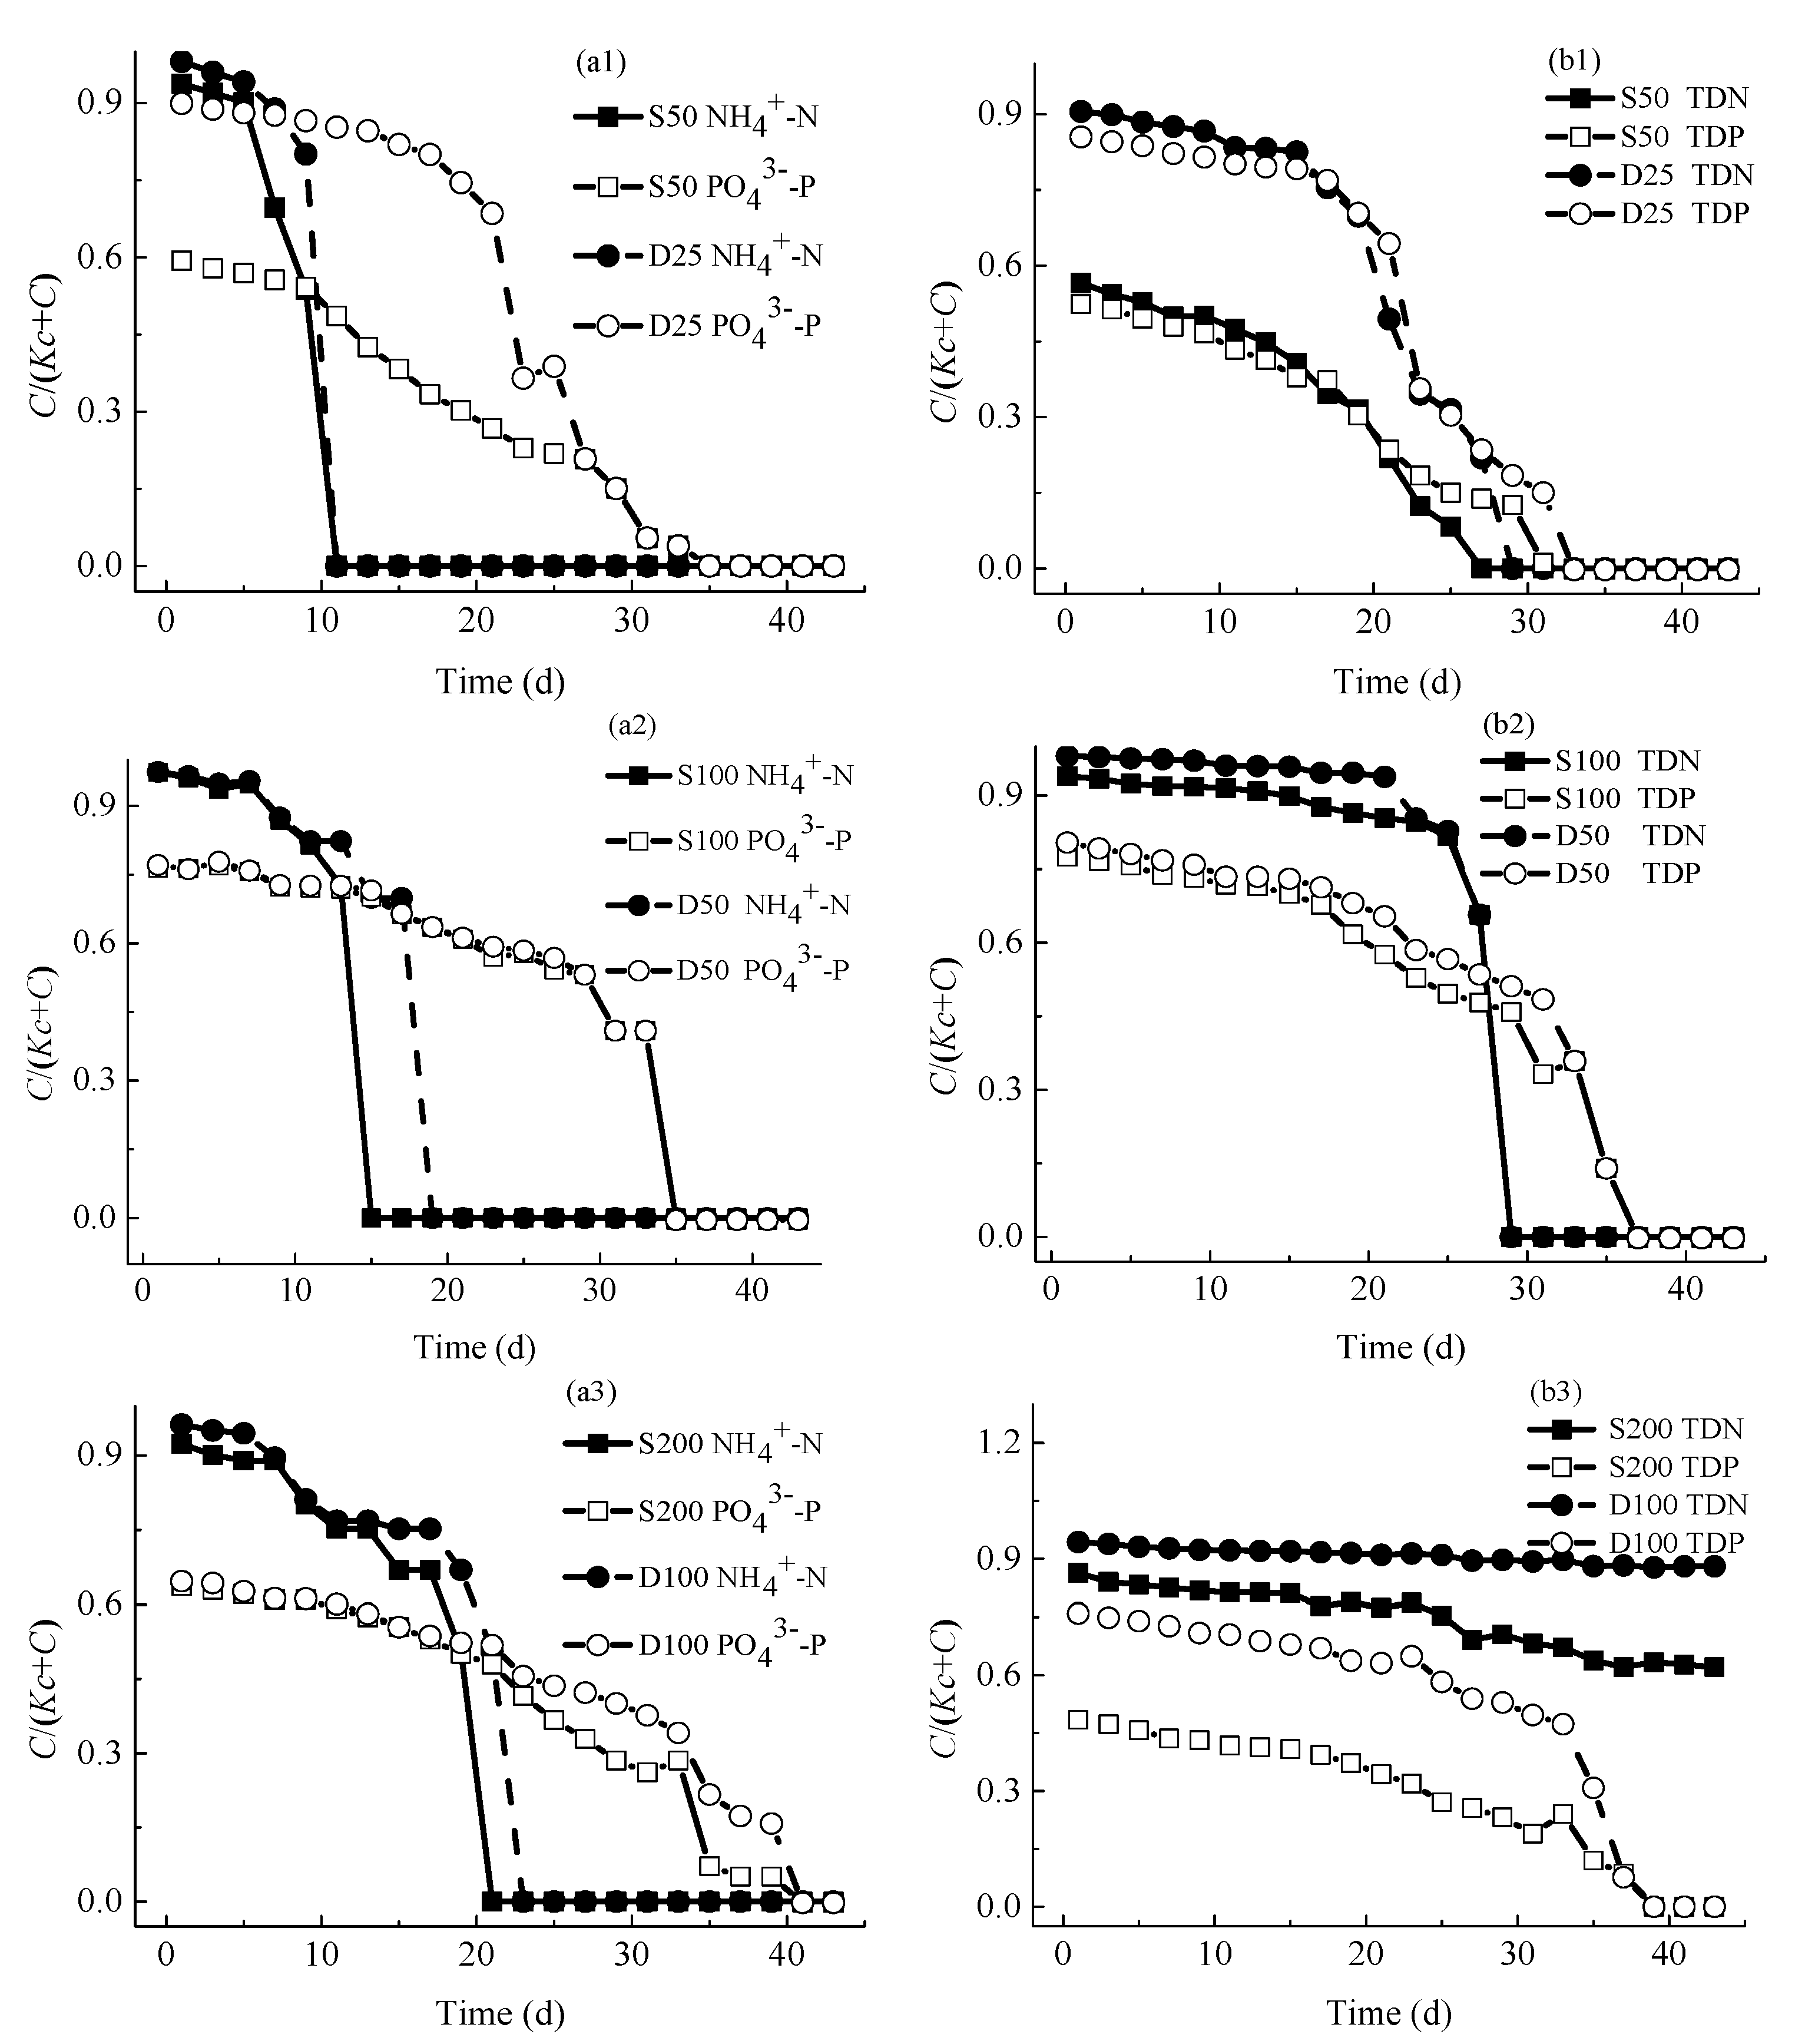
4.2.1. Concentrations of Nutrients

Variations of concentrations of nutrients with time are shown in Figure 2a1–d1. It can be observed that NH4+-N concentrations decreased very rapidly until they are close to the detection level because they are assimilated and utilized by M. aeruginosa. It should be noted that we did not add any NH4+-N to the culture medium throughout the experiment, but we did detect the presence of NH4+-N as shown in Figure 2a1, which could be because, as described in Kong et al.’s study, commercial medium contains some ammonia [20]. The concentrations of TDN, PO43−-P, and TDP have decreased monotonously over time before reaching their minimum values and have remained at relatively low levels.
We put forward a novel equation (i.e., Equation (6)) based on the modified logistic and Monod equations to describe the variations in nutrient concentrations over time. As shown in Figure 2a1–d1 and Table 1, computed concentrations of nutrients agree well with the measured ones (R2 = 0.920–0.999). Those findings indicated that Equation (6) can be used in the present study to predict the concentration of nutrients.
Results indicate that under the same prometryn concentration, the mean nutrient concentrations under double prometryn exposures were higher than those under single prometryn exposure (Student’s t-test, df = 4, t = 1.004–5.000, p > 0.05). It can be explained by the fact that prometryn exposure scenarios have a significant impact on cyanobacteria densities (as discussed in Section 4.1.1), which can have an indirect effect on concentrations of nutrients.
The average concentrations of nutrients rose as prometryn concentrations rose, because prometryn has a negatively indirect effect on nutrient use [20]. For the same prometryn scenario, average TDN concentrations in treatments received 200 μg L−1 prometryn are significantly higher than those with 100 and 50 μg L−1 prometryn (ANOVA, p < 0.05). On the contrary, there is no significant difference among NH4+-N, PO43−-P or TDP concentrations in treatments with different prometryn concentrations (ANOVA, p > 0.05). Few articles are found providing direct information about this and we encourage further study on this.

4.2.2. Concentrations of Consumed Nutrients

As shown in Figure 2a2–d2, the consumed NH4+-N, TDN, PO43−-P, and TDP concentrations increase with time until they reach their respective peak values, and then generally remain stable. Moreover, this tendency conforms to variations of concentrations of nutrients in Figure 2a1–d1. Equation (7) could well describe changes in concentrations of consumed nutrients over time (R2 = 0.795–0.996), which was in line with Huang et al.’s study [26].
Table 1 shows that the mean concentrations of consumed nutrients under single exposure of prometryn (ΔCave) with the same prometryn concentration were lower than those under double exposure in most cases (Student’s t-test, df = 4, t = 0.359–2.028, p > 0.05). No trend between single and double exposures was observed in terms of ΔCmax.
For the same scenario of prometryn exposure, mean concentrations of consumed nutrients decreased with increasing concentrations of prometryn. Mean concentrations of consumed TDN in 200 μg L−1 prometryn treatments were significantly lower than those in 100 and 50 μg L−1 prometryn treatments (ANOVA, p < 0.05), which was in corresponding to the TDN concentrations. In treatments with different prometryn concentrations, however, there is no significant difference in mean concentrations of consumed NH4+-N, PO43−-P or TDP (ANOVA, p > 0.05). No trend is observed in terms of the indirect effects of prometryn concentrations on ΔCmax.

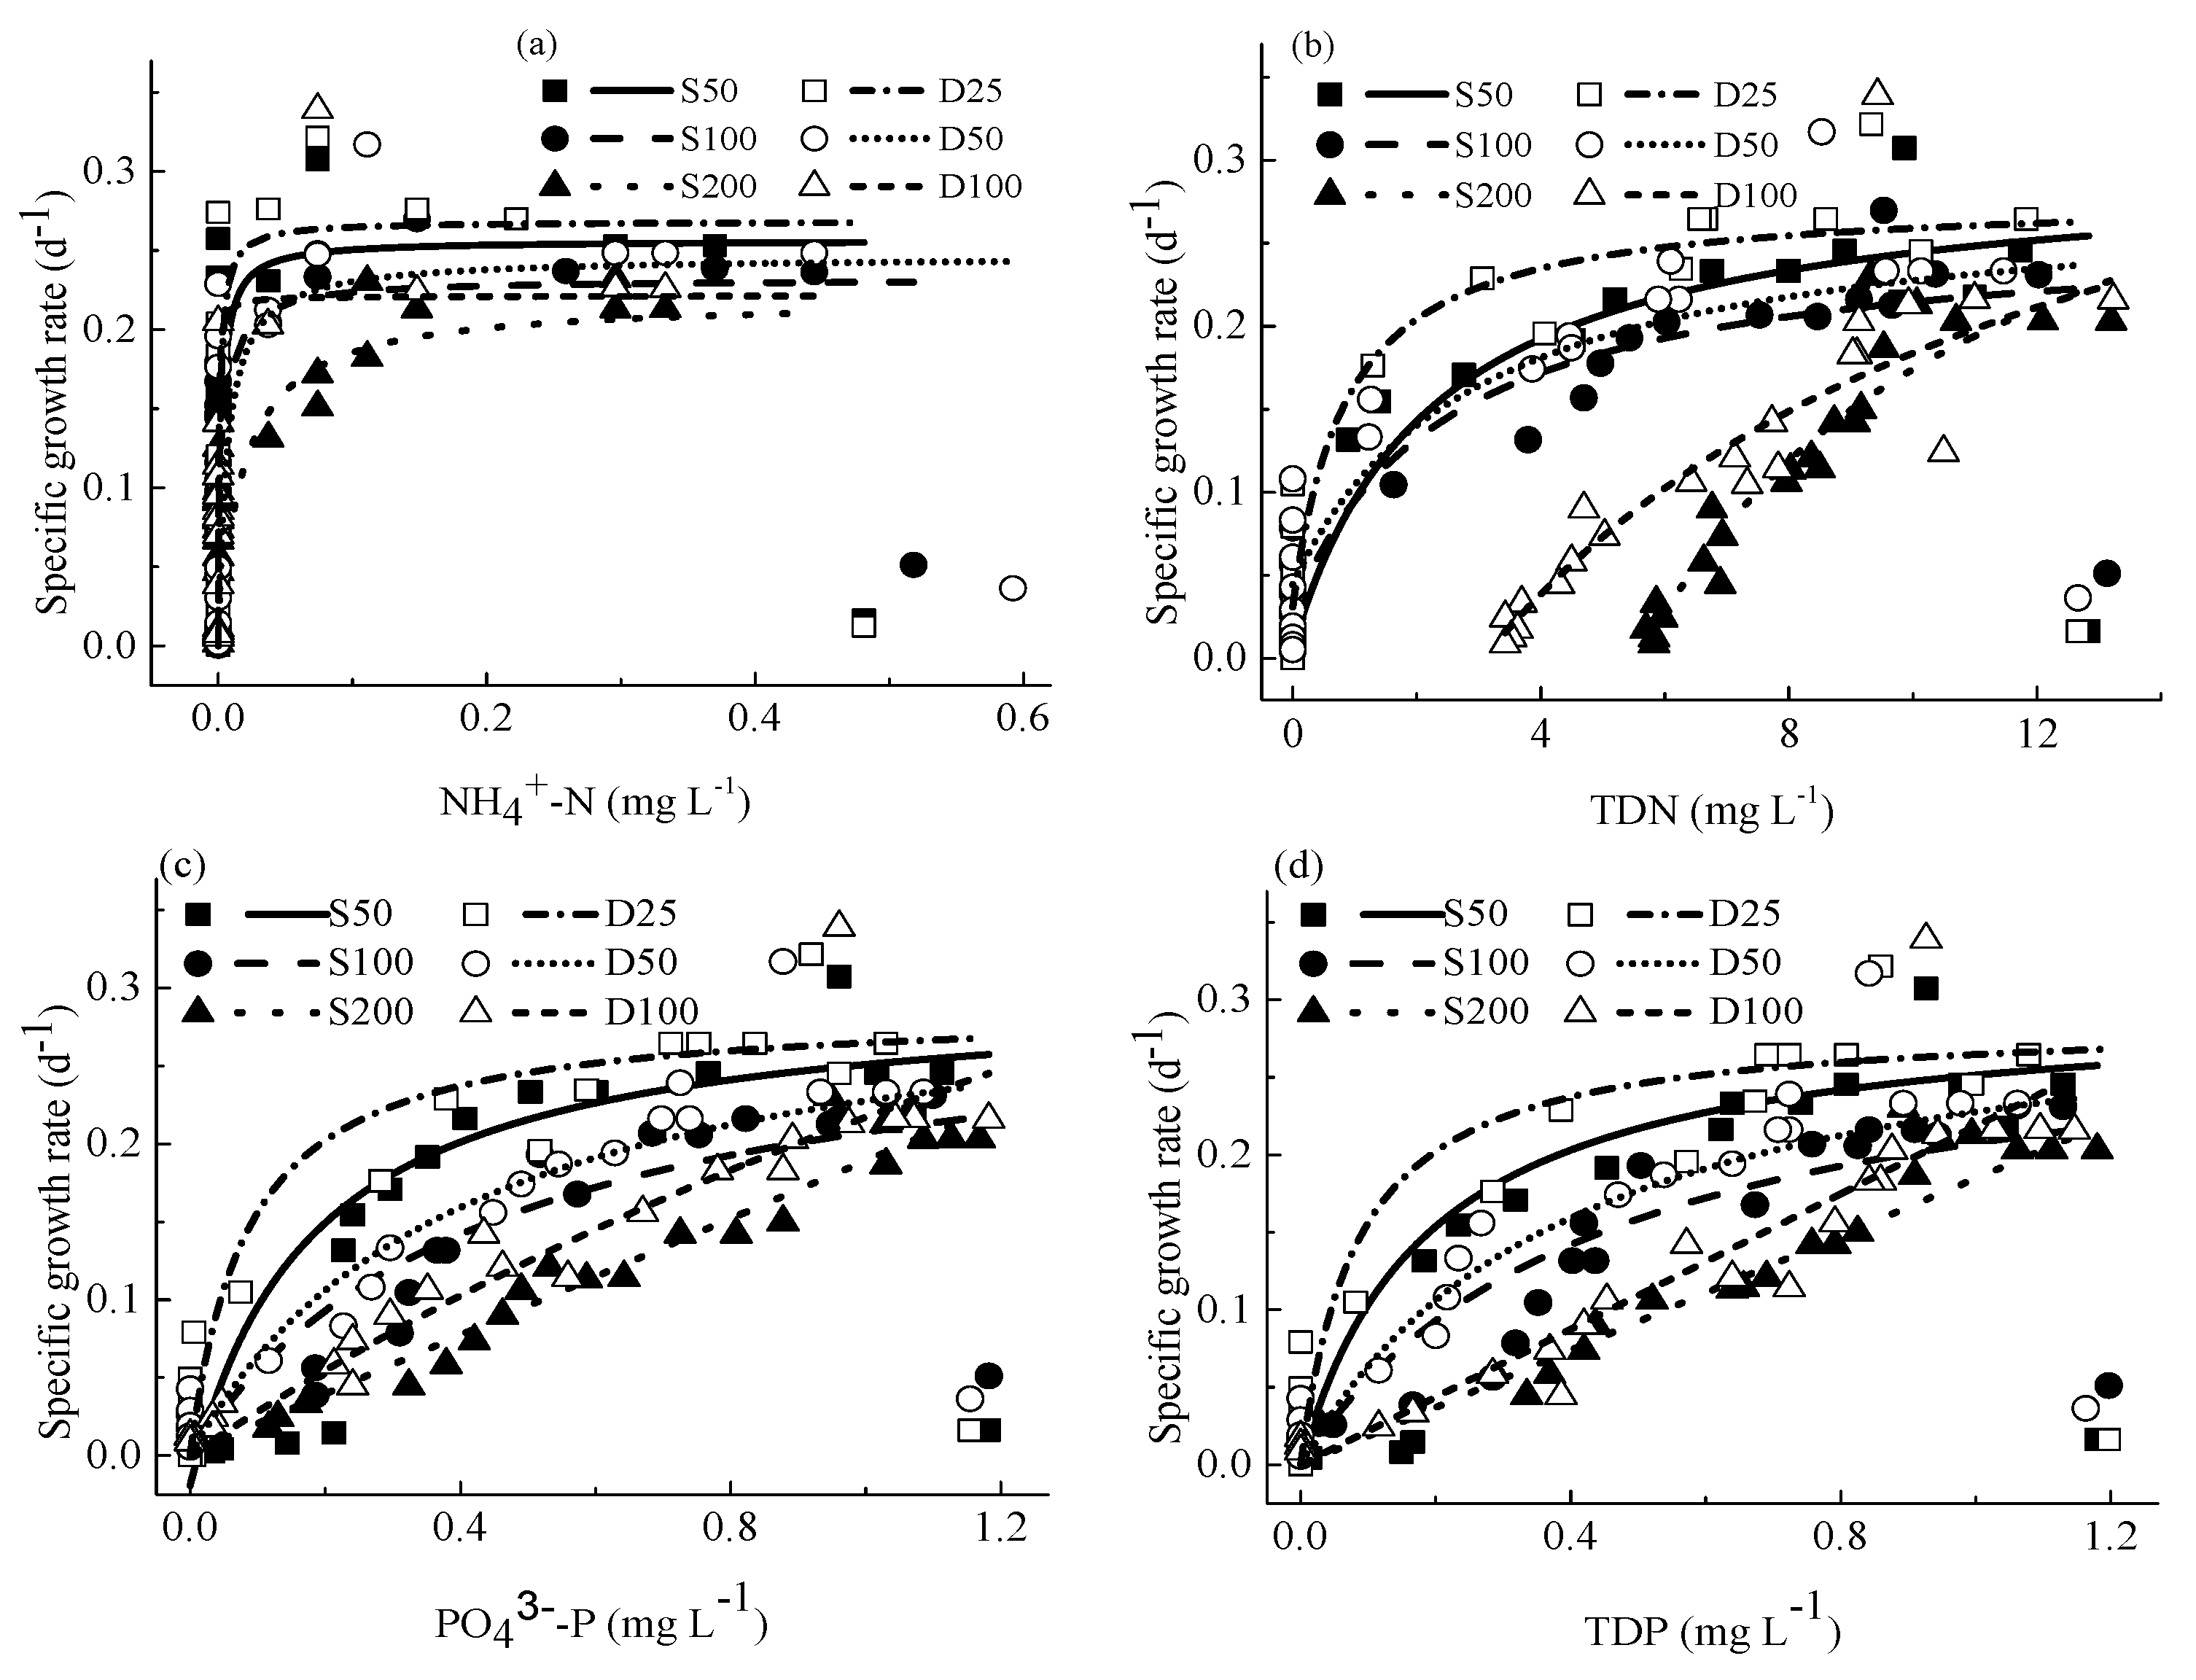
4.3. The Relationship between Specific Growth Rates and Concentrations of Nutrients

To study cyanobacteria bloom, both the Logistic equation and Monod equation are essential. The relationship between specific growth rate and concentrations of nutrients can be described by the Monod equation [46]. While time is an implicit variable in the Monod equation, so it is difficult to apply the Monod equation to obtain parameters directly for cyanobacterial growth [26]. Based on Kong et al.’s study [20], the combination of modified logistic and Monod equation (datasets of the specific growth rates computed by modified logistic equation were used, instead of using measured specific growth rates) is conducted in this paper. Figure 3 and Table 1 indicate that reasonably good results are obtained by joint application of modified logistic and Monod equations (R2 = 0.457–0.970).
The half-saturation constant (Kc) of the Monod equation is frequently referred to as the substrate affinity constant [47]. As shown in Table 1, Kc is higher in single prometryn exposure than in double exposures, suggesting a lower affinity of cyanobacteria to single prometryn exposure medium. To some extent, this can be used to explain the effect of prometryn exposure scenarios on the growth of cyanobacteria.

4.4. Relationship between M. aeruginosa Growth and Concentrations of Consumed Nutrients

Previous studies indicated that higher algae densities correspond to larger concentrations of consumed nutrients [48]. Ruiz et al. further pointed out that the density of algae is proportional to the number of nutrients consumed, but there was no development of the model of algae growth indexes and nutrients consumed [49]. Wu et al. used the exponential equation and linear equation to describe the relationship between cyanobacteria densities and consumed PO43−-P concentrations, between cyanobacteria densities and consumed NH4+-N concentrations, respectively [28]. Kong et al. developed an equation according to the logistic equation to describe the relationship between densities of cyanobacteria and concentrations of consumed nutrients (ΔNH4+-N and ΔPO43−-P) [20]. In this study, based on the modified logistic equation, we put forward equations about relationships between M. aeruginosa densities, growth rates, specific growth rates, and concentrations of consumed nutrients.

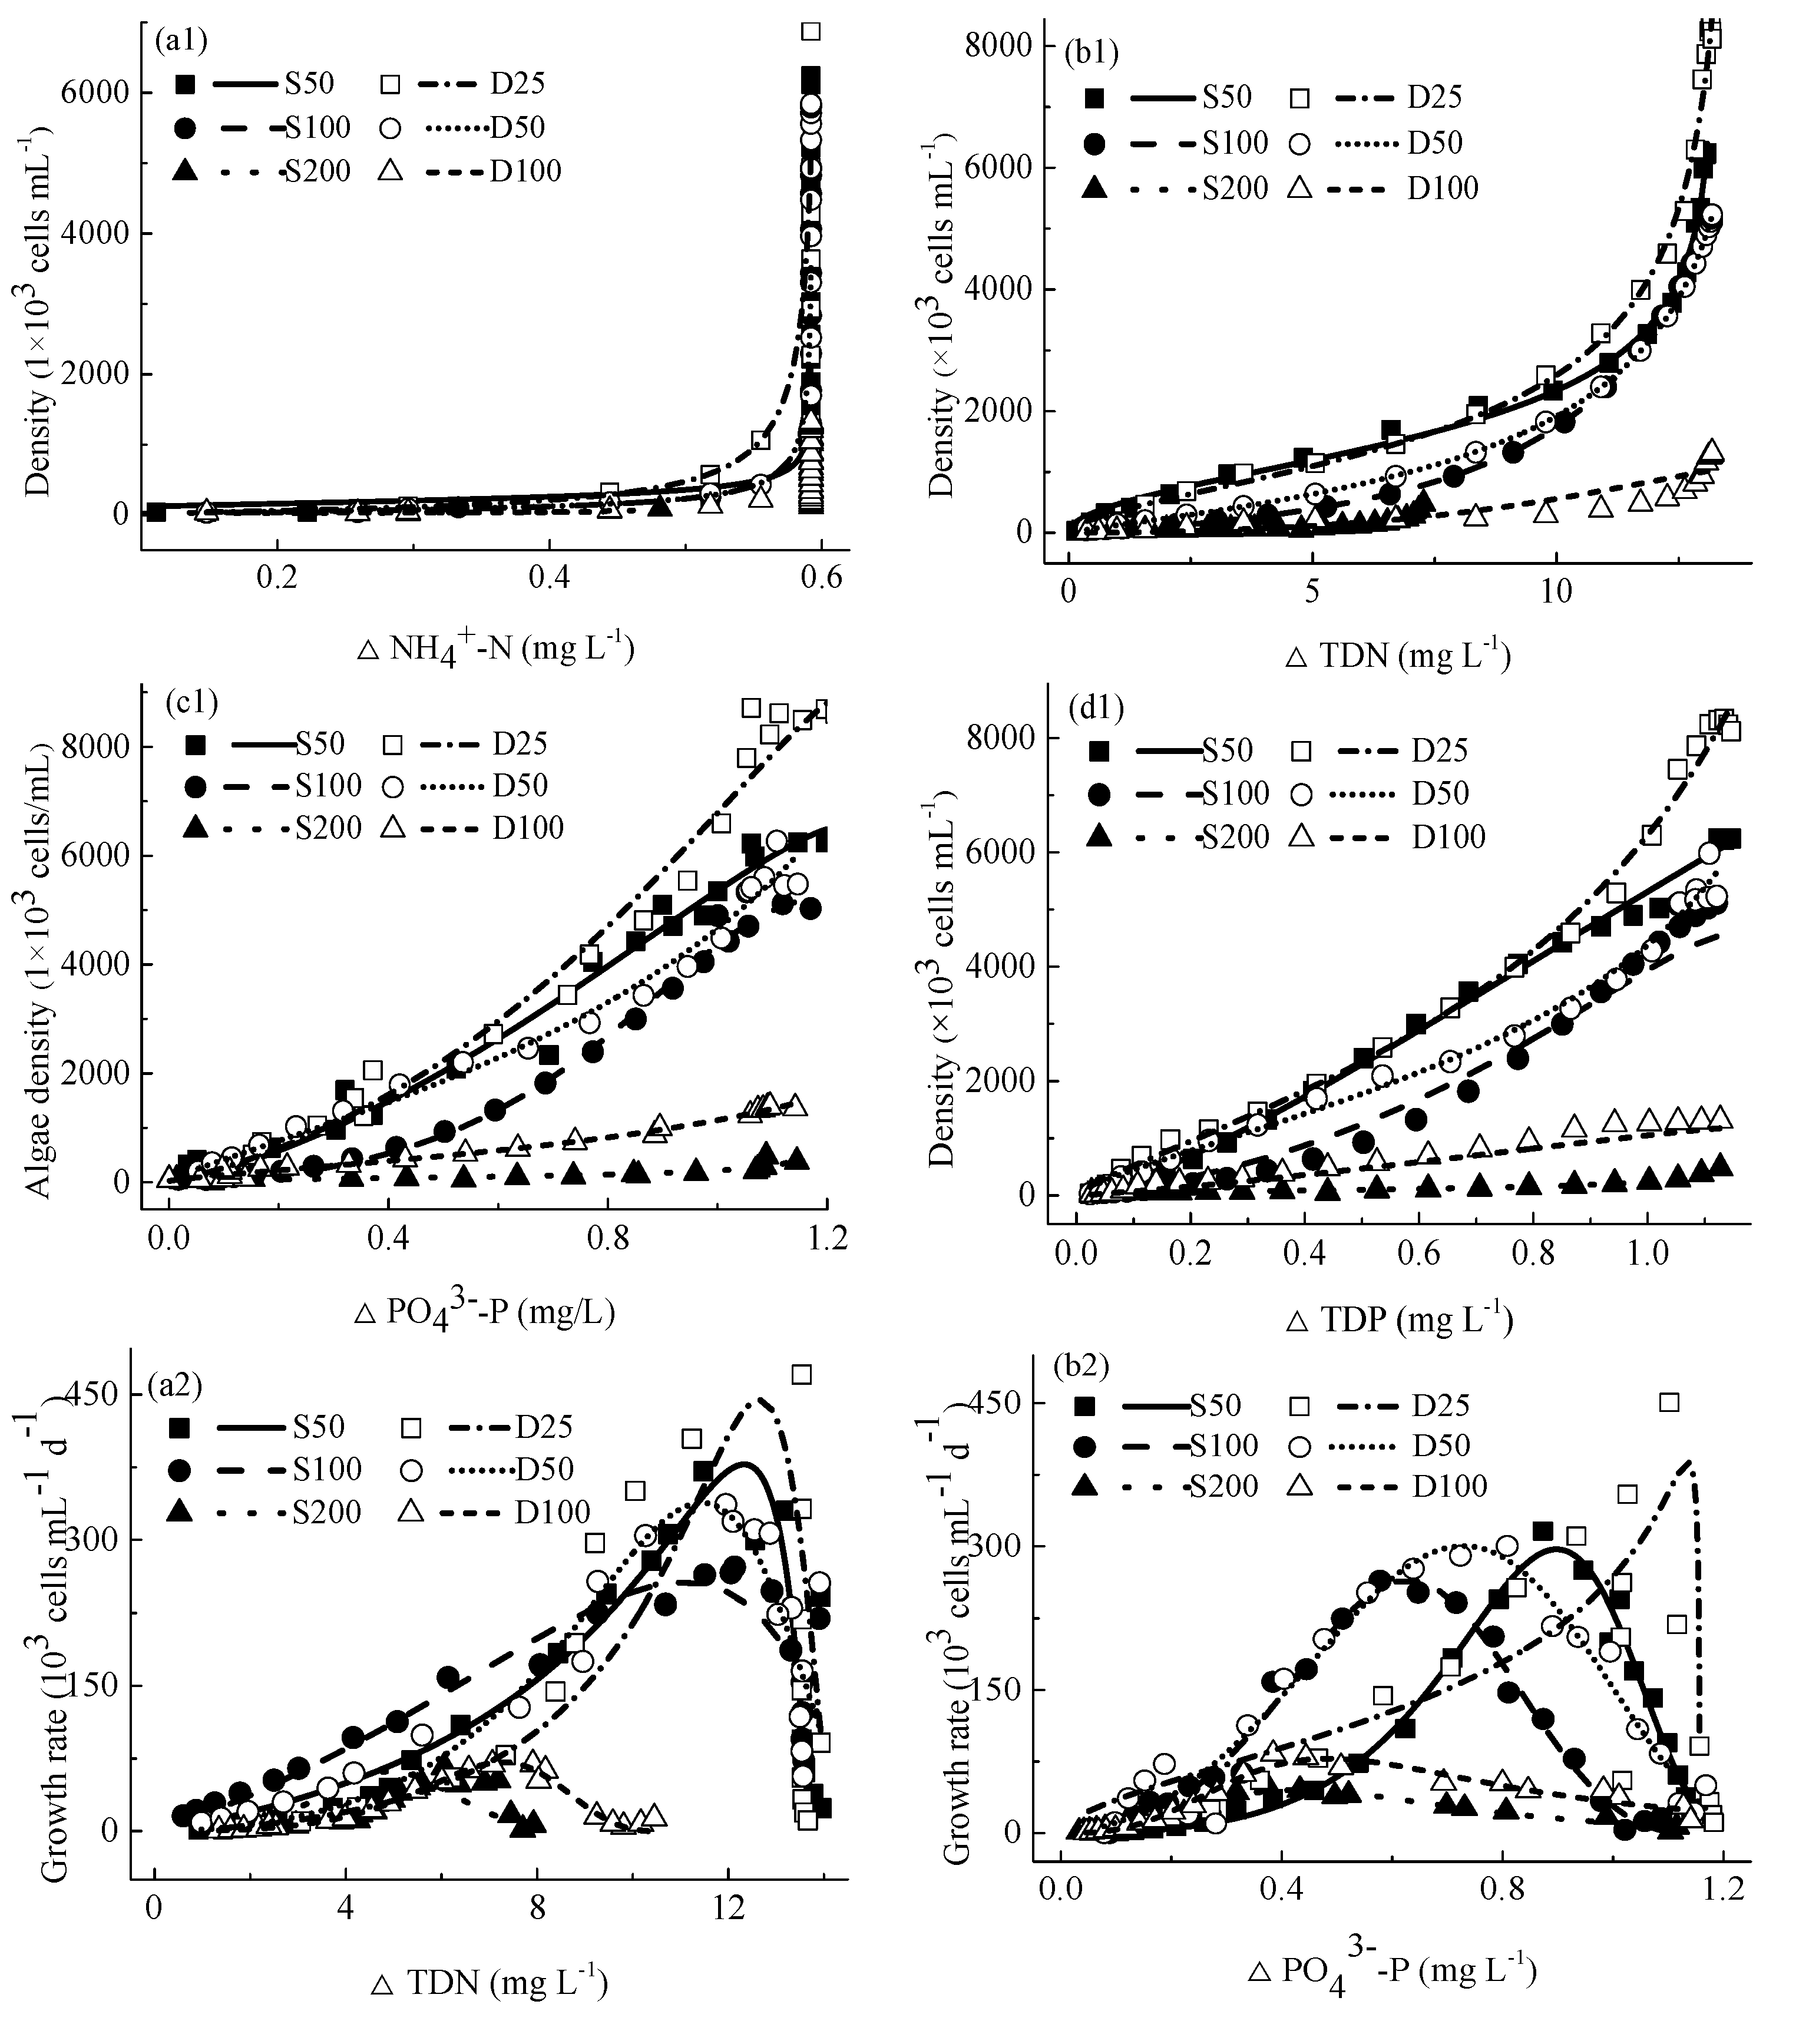
4.4.1. Relationship between M. aeruginosa Densities and Concentrations of Consumed Nutrients

To explore the interaction between M. aeruginosa density and concentrations of consumed nutrients, M. aeruginosa densities as an equation (R2 = 0.562–0.997) of concentrations of consumed nutrients are displayed in Figure 4a1–d1.
As shown in Figure 4a1–d1, M. aeruginosa densities increased gradually with increasing concentrations of consumed nutrients (ΔNH4+-N, ΔTDN, ΔPO43−-P and ΔTDP) in the first part of the fitting curves, then increased rapidly in most cases. This phenomenon conforms to the study of Cerucci et al. and they believed that M. aeruginosa can take up and store nutrients at a higher rate than necessary for growth when the excess nutrient is available in the environment, and the stored nutrients can be used to support M. aeruginosa growth when low nutrients availability in water [50].
Due to very low NH4+-N concentrations, they are used up when M. aeruginosa densities are very low. Therefore, as shown in Figure 4a1, the final part of the relationship between M. aeruginosa densities and concentrations of consumed NH4+-N was close to a straight line.
As shown in Figure 4a1–d1, under the same prometryn concentration, higher Nmax values are observed in treatments receiving double prometryn exposures, in comparison with those under single prometryn exposure. Additionally, when M. aeruginosa densities reached the Nmax, the corresponding concentrations of consumed nutrients were quite close in treatments receiving single and double prometryn exposures in general (except that when their densities reached to Nmax, the corresponding concentrations of consumed TDN in D100 are higher than those in S200).
For the same prometryn exposure scenario, the Nmax was highest in treatments with 50 μg L−1 prometryn and the lowest in treatments with 200 μg L−1 prometryn. Generally, the corresponding concentrations of consumed nutrients were close in treatments under different prometryn concentrations when their densities reached the Nmax (except that when their densities reach the Nmax, the corresponding concentrations of consumed TDN in S200 are much lower than others).

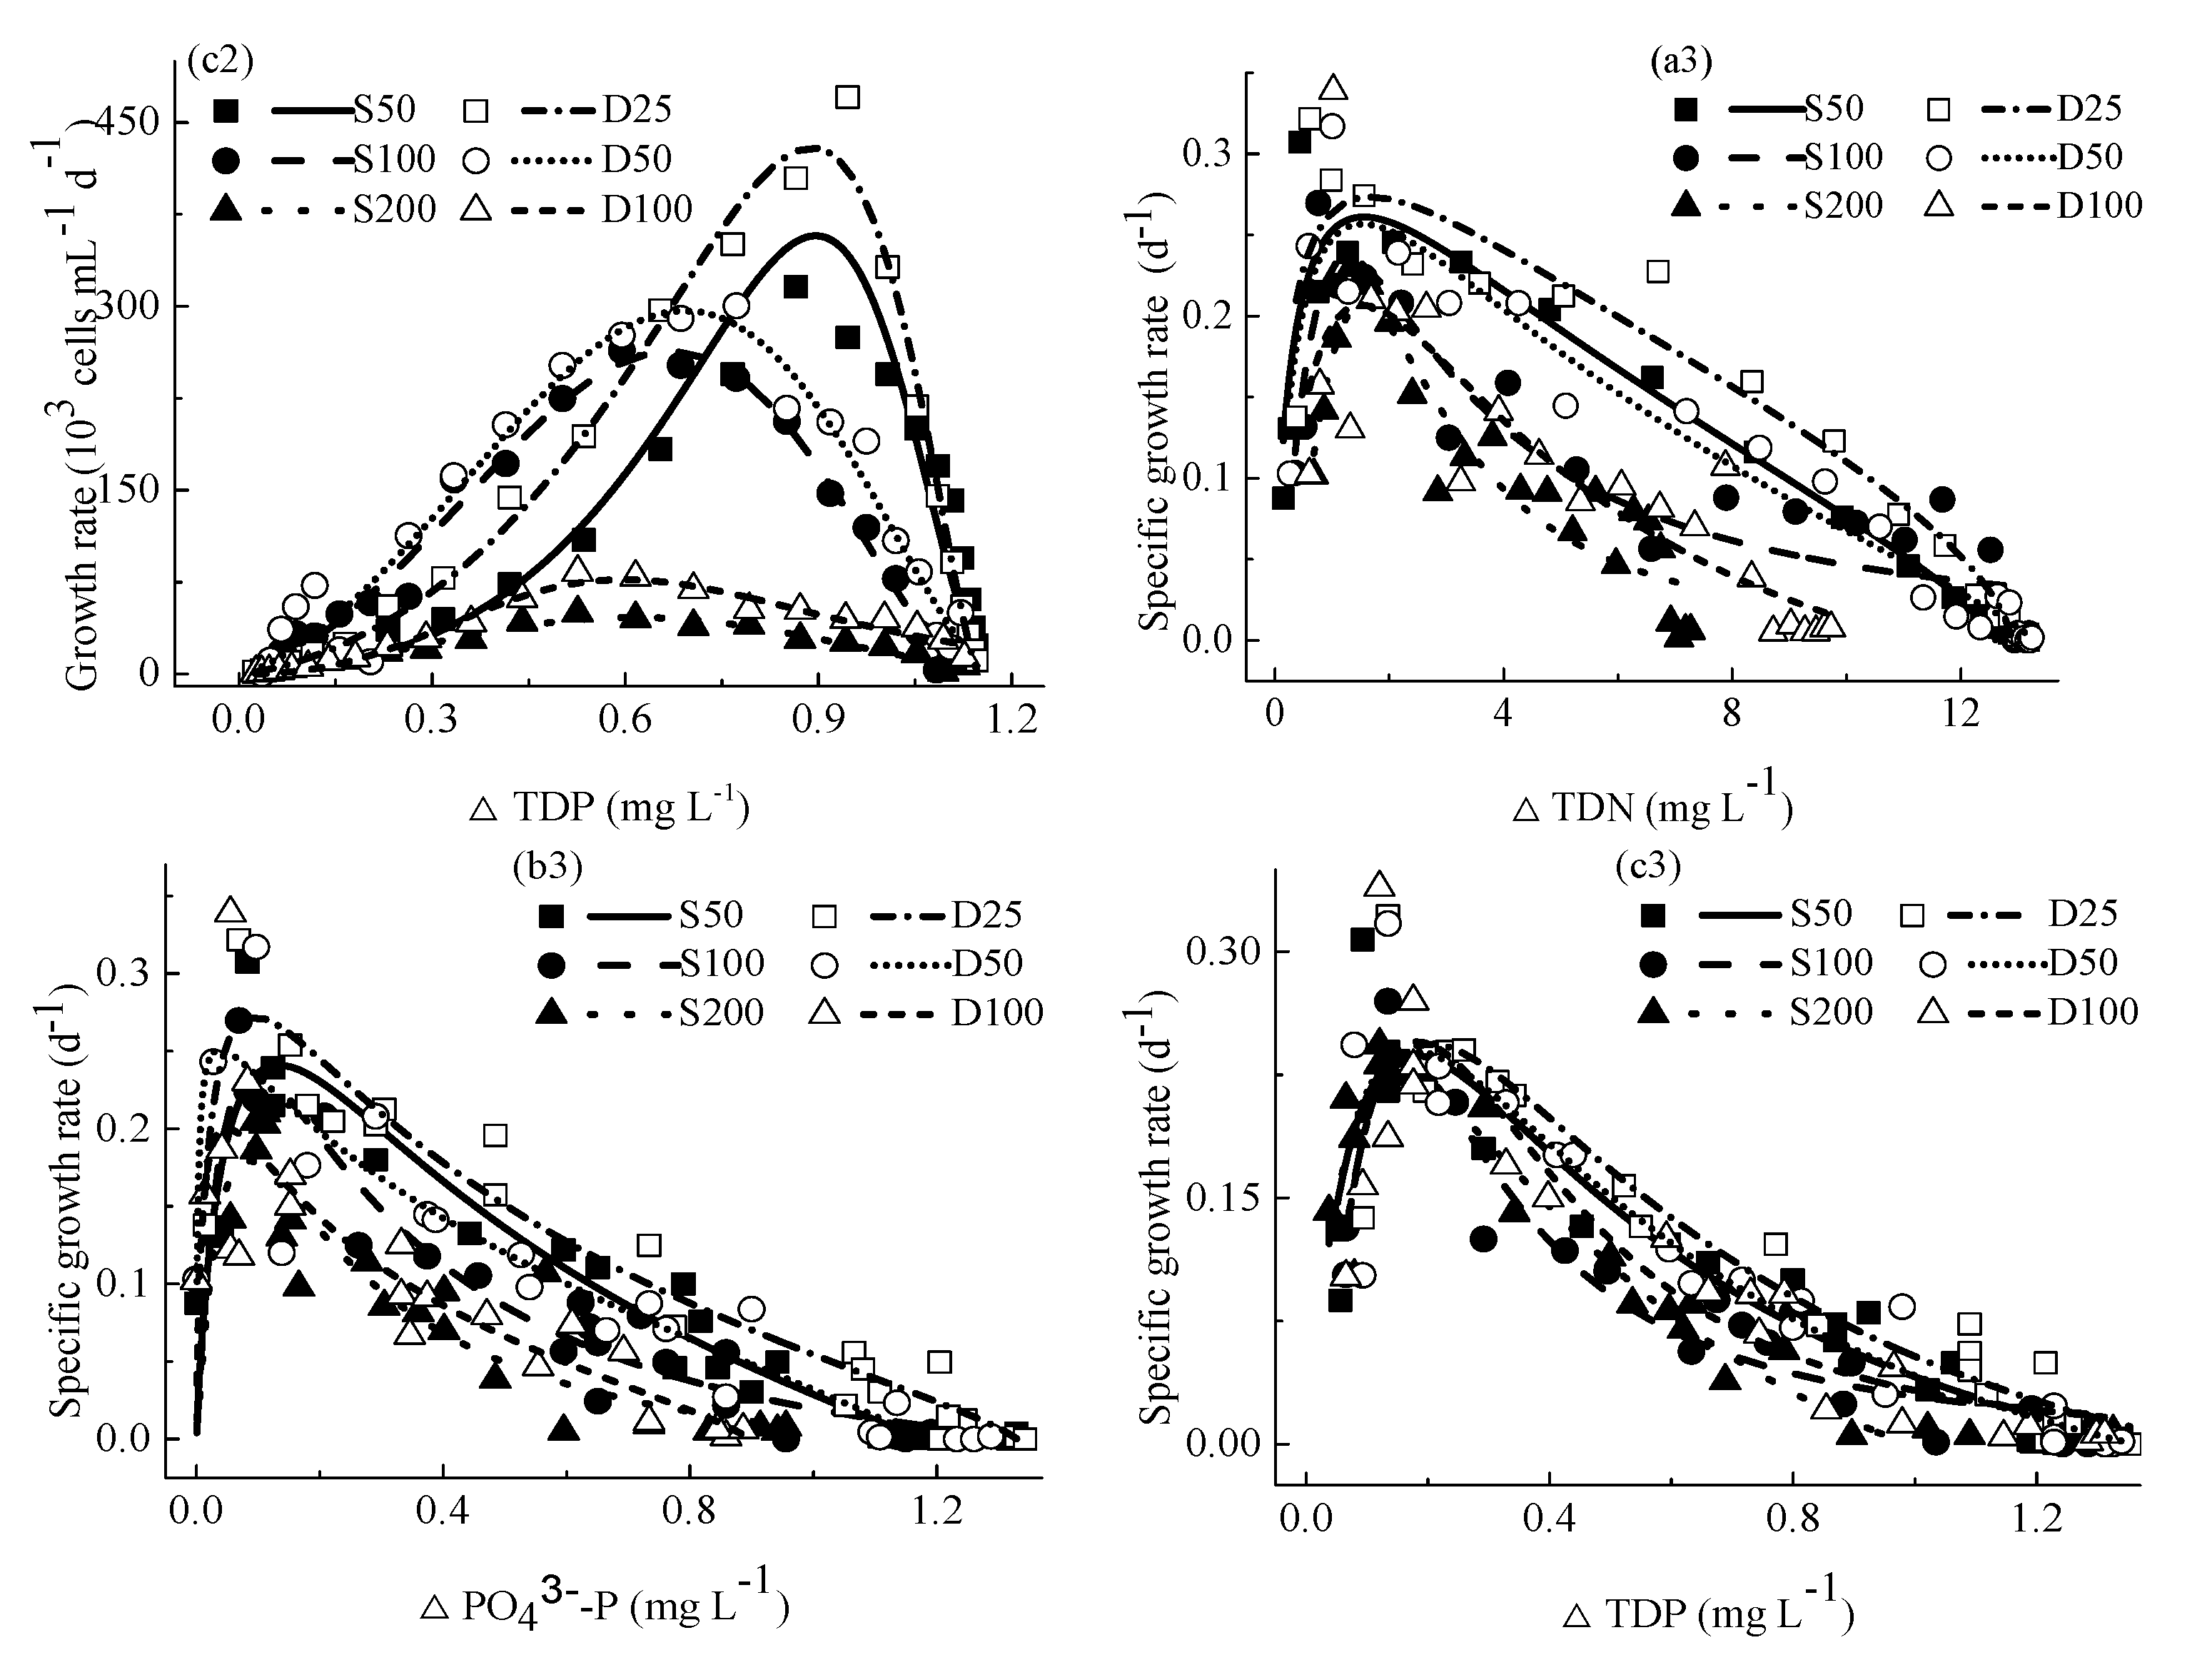
4.4.2. Relationship between M. aeruginosa Growth Rates and Concentrations of Consumed Nutrients

The relationship between M. aeruginosa growth rates and concentrations of consumed nutrients is shown in Figure 4a2–c2. M. aeruginosa growth rates increased with increasing concentrations of consumed nutrients firstly and then decreased with increasing concentrations of consumed nutrients. Equation (9) can be used to describe the relationship between M. aeruginosa growth rates and concentrations of consumed nutrients well in the present experiment (R2 = 0.373–0.927). As aforementioned, the amounts of NH4+-N are quite low, as a consequence, NH4+-N was used up quickly, and the relationship between consumed NH4+-N concentrations and M. aeruginosa growth rates was unable to render in this study.
In general, the fitting curves of the relationship between M. aeruginosa growth rates and concentrations of consumed nutrients in treatments with different prometryn exposure scenarios are intersected (Figure 4a2–c2). Under the same prometryn concentration, higher μcmax were observed in treatments receiving double exposures, as compared with those receiving a single exposure.
For the same prometryn exposure scenario, the μcmax is the highest in treatments with 50 μg L−1 prometryn and the lowest in treatments with 200 μg L−1 prometryn. In general, when their growth rates reach the μcmax, the corresponding concentrations of consumed nutrients are the highest in treatments with 50 μg L−1 prometryn and the lowest in treatments with 200 μg L−1 prometryn.

4.4.3. Relationship between M. aeruginosa Specific Growth Rates and Concentrations of Consumed Nutrients

As shown in Figure 4a3–c3, with increasing concentrations of consumed nutrients, M. aeruginosa specific growth rate increased firstly and then followed by a decrease. In the present study, Equation (10) can be used to describe the relationship between M. aeruginosa specific growth rate and concentrations of consumed nutrients (R2 = 0.375–0.826).
In general, as shown in Figure 4a3–c3, fitting curves of the relationship between M. aeruginosa specific growth rates and concentrations of consumed nutrients are intersected under different prometryn exposure scenarios. The specific growth rate is also not affected by concentrations of prometryn. This is because the specific growth rate is defined as the growth rate relative to the algae density [51].

4.5. Discussion on Limiting Nutrients of M. aeruginosa Growth

Nutrient limits for algae can be expressed by the term C/(Kc + C), according to Li et al. [52], where Kc is the half-saturation coefficient and C is the rate-limiting concentration of nutrients. In our study, concentrations of nutrients are directly affected by the consumption by M. aeruginosa and indirectly influenced by prometryn. The C/(Kc + C) of NH4+-N, TDN, PO43–-P and TDP decreased with time until they approached 0, which may be because they were primarily affected by M. aeruginosa’s nutrient utilization in the experimental range.
During the experimental period, lower values of C/(Kc + C) are observed in a single exposure of prometryn, in comparison with those under double exposures (Figure 5). Results showed that single exposure of prometryn may lead to a greater limitation of nutrients. This corresponds to the results of M. aeruginosa densities and growth rates (as shown in Figure 1), suggesting that the stronger the nutrient limit is, the lower the M. aeruginosa density and growth rate are. This can also explain the effects of prometryn exposure scenarios on M. aeruginosa growth to some extent.
A common phenomenon in natural water bodies is the shift of nutrient restrictions [52]. The pattern of nutrient limitation also shows a transformation in this study. As shown in Figure 5, in most cases, C/(Kc + C) of nitrogen nutrients (NH4+-N and TDN) are higher than those of phosphorus nutrients (PO43−-P and TDP) at the start of the experiment, and lower than C/(Kc + C) of phosphorus nutrients at the end of this experiment, indicating that the limiting nutrients are shifted from phosphorus to nitrogen during the experiment. This may be caused by the utilization of nitrogen and phosphorus nutrients by M. aeruginosa. But the nitrogen limitation is not clear in some cases (e.g., S200 or D100). The above shift is the same for different prometryn exposure schemes. This is because the scenarios of prometryn exposure do not change the proportion of nitrogen and phosphorus nutrients, different scenarios of prometryn exposure do not change the nutrient limitation shift, as expected.

5. Conclusions

In this study, the effects of prometryn on M. aeruginosa growth and water qualities were investigated under single and double exposures (at different growth phases of M. aeruginosa). The main findings are as follows:
Experimental results indicated that prometryn exposures scenarios affect M. aeruginosa densities, growth rates, and inhibition rates significantly. Under single exposure, Nmax and μcmax were significantly lower than those under double exposure. The single-exposure Imax was greater than the double-exposure Imax. Based on the results of this study, it is suggested that high-dosage and single exposure of prometryn have a stronger deleterious impact on M. aeruginosa than low-dosage and repeated exposures, which are further related to the exposure time and the prometryn concentrations injected during the first application. Furthermore, the lower affinity of M. aeruginosa for the medium with single prometryn exposure is another explanation concerning the effect of prometryn exposure scenarios on its growth.
The developed Equation (6) can be used to predict variations in nutrient concentrations over time (R2 = 0.920–0.999). In double exposures, mean concentrations of nutrients and mean concentrations of consumed nutrients were lower and higher, respectively, than those in single exposure, but the differences are not statistically significant.
Based on the modified logistic equation, equations were developed to describe respectively relationships between M. aeruginosa growth rates and concentrations of consumed nutrients, and specific growth rates and concentrations of consumed nutrients. These quantified relationships provide a solid foundation for future research.
Single exposure of prometryn leads to a stronger nutrient limit on M. aeruginosa, compared with those under double exposures. This can also explain the effects of prometryn exposure scenarios on M. aeruginosa growth. The limiting nutrients were moved from phosphorus to nitrogen nutrients throughout the experimental range.
This work is done in the cultural environment, considering a more complicated water environment would be interesting in future studies. Despite the limitations, the differences in algae growth and nutrient concentrations induced by various prometryn exposure scenarios are still of practical application.

Author Contributions

Conceptualization, S.H. and Z.Y.; data curation, Z.Y. and S.H.; formal analysis, Z.Y.; funding acquisition, S.H.; investigation, Z.Y., X.H. and X.L.; methodology, S.H. and Z.Y.; project administration, S.H.; resources, S.H.; software, Z.Y. and S.H.; supervision, S.H.; validation, Z.Y.; visualization, Z.Y.; writing—original draft, Z.Y.; writing—review and editing, S.H., W.A. and Z.K. All authors have read and agreed to the published version of the manuscript.

Funding

The study is financially supported by the National Natural Science Foundation of China (11672139, 51861135314, 41911530081), the Natural Science Foundation of Tianjin (18YFZCSF00510) and the China–Poland Science and Technology Cooperation Committee Regular Meeting Exchange Program (37-14).

Institutional Review Board Statement

Not applicable.

Informed Consent Statement

Not applicable.

Data Availability Statement

The data presented in this study are available from the corresponding author upon reasonable request.

Conflicts of Interest

The authors declare no conflict of interest.

References

  1. Kniss, A.R. Long-term trends in the intensity and relative toxicity of herbicide use. Nat. Commut. 2017, 8, 14865. [Google Scholar] [CrossRef] [Green Version]
  2. Starr, A.V.; Bargu, S.; Maiti, K.; Delaune, R.D. the effect of atrazine on Louisiana Gulf Coast Estuarine phytoplankton. Arch. Environ. Contam. Toxicol. 2017, 72, 178–188. [Google Scholar] [CrossRef]
  3. Carlisle, S.M.; Trevors, J.T. Glyphosate in the environment. Water Air Soil Pollut. 1998, 39, 409–420. [Google Scholar]
  4. Masiá, A.; Campo, J.; Navarro-Ortega, A.; Barcelo, D.; Pico, Y. Pesticide monitoring in the basin of Llobregat River (Catalonia, Spain) and comparison with historical data. Sci. Total Environ. 2015, 503–504, 58–68. [Google Scholar] [CrossRef] [PubMed]
  5. Cypel, Y.S.; Hines, S.E.; Davey, V.J.; Eber, S.M.; Schneiderman, A. Spirometric pulmonary restriction in herbicide-exposed U.S. Vietnam war veterans. Int. J. Environ. Res. Public Health 2019, 16, 3131. [Google Scholar] [CrossRef] [PubMed] [Green Version]
  6. Ma, J.; Tong, S.; Wang, P.; Chen, J. Toxicity of seven herbicides to the three cyanobacteria Anabaena flos-aquae, Microcystis flos-aquae and Mirocystis aeruginosa. Int. J. Environ. Res. 2010, 4, 347–352. [Google Scholar]
  7. Kamrin, M.A. Pesticide Profiles; Lewis Publishers/CRC Press: Boca Raton, FL, USA, 1997; 676p. [Google Scholar]
  8. Vryzas, Z.; Alexoudis, C.; Vassiliou, G.; Galanis, K.; Papadopoulou-Mourkidou, E. Determination and aquatic risk assessment of pesticide residues in riparian drainage canals in northeastern Greece. Ecotoxicol. Environ. Saf. 2011, 74, 174–181. [Google Scholar] [CrossRef] [PubMed]
  9. Erickson, W.; Turner, L. Prometryn Analysis of Risks to Endangered and Threatened Salmon and Steelhead; United States Environmental Protection Agency: Washington, DC, USA, 2002; p. 71.
  10. Zhao, Q.; Zhu, L. Effect of humic acid on prometryn bioaccumulation and the induction of oxidative stress in zebrafish (Danio rerio). RSC Adv. 2016, 6, 16790–16797. [Google Scholar] [CrossRef]
  11. Zhou, J.; Hu, F.; Jiao, J.; Liu, M.; Li, H. Effects of bacterial-feeding nematodes and prometryne-degrading bacteria on the dissipation of prometryne in contaminated soil. J. Soils Sediments 2012, 12, 576–585. [Google Scholar] [CrossRef]
  12. Tan, X.; Dai, K.W.; Parajuli, K.; Hang, X.; Duan, Z.; Hu, Y. Effects of phenolic pollution on interspecific competition between Microcystis aeruginosa and Chlorella pyrenoidosa and their photosynthetic responses. Int. J. Environ. Res. Public Health 2019, 16, 3947. [Google Scholar] [CrossRef] [Green Version]
  13. Bengtson-Nash, S.M.; Quayle, P.A.; Schreiber, U.; Muller, J.F. The selection of a model microalgal species as biomaterial for a novel aquatic phytotoxicity assay. Aquat. Toxicol. 2005, 72, 315–326. [Google Scholar] [CrossRef] [PubMed]
  14. Nguyen, Q.V.; Tran, T.H.; Pham, T.N.; Thuoc, D.V.; Cao, V.D.; Boo, K.H. Inhibitory effects of Bidens pilosa plant extracts on the growth of the bloom-forming alga Microcystis aeruginosa. Water Air Soil Pollut. 2019, 230, 1–16. [Google Scholar] [CrossRef]
  15. Zhang, P.; Zhai, C.; Chen, R.; Liu, C.; Xue, R.; Jiang, J. The dynamics of the water bloom-forming Microcystis aeruginosa and its relationship with biotic and abiotic factors in Lake Taihu, China. Ecol. Eng. 2012, 47, 274–277. [Google Scholar] [CrossRef]
  16. Chalifour, A.; Leblanc, A.; Sleno, L.; Juneau, P. Sensitivity of Scenedesmus obliquus and Microcystis aeruginosa to atrazine: Effects of acclimation and mixed cultures, and their removal ability. Ecotoxicology 2016, 25, 1822–1831. [Google Scholar] [CrossRef] [PubMed]
  17. Goudar, C.T.; Joeris, K.; Konstantinov, K.B.; Piret, J.M. Logistic equations effectively model mammalian cell batch and fed-batch kinetics by logically constraining the fit. Biotechnol. Prog. 2005, 21, 1109–1118. [Google Scholar] [CrossRef] [PubMed]
  18. Surendhiran, D.; Vijay, M.; Sivaprakash, B.; Sirajunnisa, A. Kinetic modeling of microalgae growth and lipid synthesis for biodiesel production. 3 Biotech 2015, 5, 663–669. [Google Scholar] [CrossRef] [PubMed] [Green Version]
  19. Samkhaniyani, F.; Najafpour, G.D.; Ardestani, F. Evaluation of effective nutritional parameters for Scenedesmus sp. microalgae culturing in a photobioreactor for biodiesel production. Int. J. Environ. Sci. Technol. 2017, 14, 1–10. [Google Scholar] [CrossRef]
  20. Kong, W.W.; Huang, S.L.; Shi, F.F.; Zhou, J.G.; Feng, Y.B.; Xiao, Y. Study on Microcystis aeruginosa growth in incubator experiments by combination of Logistic and Monod functions. Algal Res. 2018, 35, 602–612. [Google Scholar] [CrossRef]
  21. Gutting, B.W.; Rukhin, A.; Marchette, D.; Mackie, R.S.; Thran, B. Dose-response modeling for inhalational anthrax in rabbits following single or double exposures. Risk Anal. 2016, 36, 2031–2038. [Google Scholar] [CrossRef] [PubMed]
  22. Lovelace, M.L.; Talbert, R.E.; Scherder, E.F.; Hoagland, R.E. Effects of double applications of simulated quinclorac drift rates on tomato. Weed Sci. 2007, 55, 169–177. [Google Scholar] [CrossRef]
  23. Schrübbers, L.C.; Valverde, B.E.; Strobel, B.W.; Cedergreen, N. Glyphosate accumulation, translocation, and biological effects in Coffea Arabica after single and double exposures. Eur. J. Agron. 2016, 74, 133–143. [Google Scholar] [CrossRef]
  24. Waizenegger, J.; Braeuning, A.; Templin, M.; Lampen, A.; Hessel-Pras, S. Structure-dependent induction of apoptosis by hepatotoxic pyrrolizidine alkaloids in the human hepatoma cell line HepaRG: Single versus repeated exposure. Food Chem. Toxicol. 2018, 114, 215–226. [Google Scholar] [CrossRef] [PubMed]
  25. Arito, H.; Tsuruta, H.; Oguri, M. Changes in sleep and wakefulness following single and repeated exposures to toluene vapor in rats. Arch. Toxicol. 1998, 62, 76–80. [Google Scholar] [CrossRef] [PubMed]
  26. Huang, S.L.; Kong, W.W.; Yang, Z.J.; Yu, H.; Li, F.Y. Combination of logistic and modified monod functions to study Microcystis aeruginosa growth stimulated by fish feed. Ecotoxicol. Environ. Saf. 2019, 167, 146–160. [Google Scholar] [CrossRef] [PubMed]
  27. Yao, B.; Xi, B.; Hu, C.; Huo, S.; Su, J.; Liu, H. A model and experimental study of phosphate uptake kinetics in algae: Considering surface adsorption and P-stress. J. Environ. Sci. 2011, 23, 189–198. [Google Scholar] [CrossRef]
  28. Wu, M.; Huang, S.L.; Zang, C.J.; Du, S.L. Release of nutrient from fish feed and effects on Microcystis aeruginosa growth. Aquac. Res. 2012, 43, 1460–1470. [Google Scholar] [CrossRef]
  29. Endo, H.; Yoshimura, T.; Kataoka, T.; Suzuki, K. Effects of CO2 and iron availability on phytoplankton and eubacterial community compositions in the northwest subarctic Pacific. J. Exp. Mar. Biol. Ecol. 2013, 439, 160–175. [Google Scholar] [CrossRef] [Green Version]
  30. Wetzel, R.G.; Likens, G.E. Composition and Biomass of Phytoplanton. Limnological Analyses; Springer: New York, NY, USA, 2000. [Google Scholar]
  31. Kong, W.; Huang, S.; Yang, Z.; Shi, F.; Feng, Y.; Khatoon, Z. Fish feed quality is a key factor in impacting aquaculture water environment: Evidence from incubator experiments. Sci. Rep. 2020, 10, 187. [Google Scholar] [CrossRef] [Green Version]
  32. Vörös, L.; Padisák., J. Phytoplankton biomass and chlorophyll-a in some shallow lakes in central Europe. Hydrobiologia 1991, 215, 111–119. [Google Scholar] [CrossRef]
  33. Hecky, R.E. Nutrient limitation of phytoplankton in freshwater and marine environments: A review of recent evidence on the effects of enrichment. Limnol. Oceanogr. 1988, 33, 796–822. [Google Scholar] [CrossRef] [Green Version]
  34. Baxter, L.; Brain, R.; Prosser, R.; Solomon, K.; Hanson, M. Sensitivity of a green alga to atrazine is not enhanced by previous acute exposure. Environ. Pollut. 2013, 181, 325–328. [Google Scholar] [CrossRef]
  35. Li, X.; Hu, H.Y.; Gan, K.; Sun, Y.X. Effects of different nitrogen and phosphorus concentrations on the growth, nutrient uptake, and lipid accumulation of a freshwater microalga Scenedesmus sp. Bioresour. Technol. 2010, 101, 5494–5500. [Google Scholar]
  36. Qiao, Z.; Yu, H. Effects of stationary phase elongation and initial nitrogen and phosphorus concentrations on the growth and lipid-producing potential of Chlorella sp. HQ. J. Appl. Phycol. 2014, 26, 141–149. [Google Scholar]
  37. Zhang, H.; Huang, F.; Li, F.; Gu, Z.; Chen, R.; Zhang, Y. An improved logistic model illustrating Microcystis aeruginosa growth under different turbulent mixing conditions. Water 2019, 11, 669. [Google Scholar] [CrossRef] [Green Version]
  38. Fussmann, G.F.; Ellner, S.P.; Shertzer, K.W.; Hairston, N.G. Crossing the Hopf bifurcation in a live predator-preysystem. Science 2000, 290, 1358–1360. [Google Scholar] [CrossRef] [Green Version]
  39. Sunda, W.G.; Shertzer, K.W.; Hardison, D.R. Ammonium uptake and growth models in marine diatoms: Monod and Droop revisited. Mar. Ecol. Prog. Ser. 2009, 386, 29–41. [Google Scholar] [CrossRef] [Green Version]
  40. Kooijman, S.A.L.M.; Hanstveit, A.O.; Oldersma, H. Parametric analyses of population growth in bio-assays. Water Res. 1983, 17, 527–538. [Google Scholar] [CrossRef]
  41. Tian, F.; Zhou, J.; Sun, Z.; Cai, Z.; Xu, N.; An, M.; Duan, S. Inhibitory effects of Chinese traditional herbs and herb-modified clays on the growth of harmful algae, Phaeocystis globosa and Prorocentrum donghaiense. Harmful Algae 2014, 37, 153–159. [Google Scholar] [CrossRef]
  42. McGaughy, K.; Hajer, A.A.; Drabold, E.; Bayless, D.; Reza, M.T. Algal remediation of wastewater produced from hydrothermally treated septage. Sustainability 2019, 11, 3454. [Google Scholar] [CrossRef] [Green Version]
  43. Liebig, M.; Schmidt, G.; Bontje, D.; Kooi, B.W.; Streck, G. Direct and indirect effects of pollutants on algae and algivorous ciliates in an aquatic indoor microcosm. Aquat. Toxicol. 2008, 88, 102–110. [Google Scholar] [CrossRef] [PubMed]
  44. Ni, L.; Jie, X.; Wang, P.; Li, S.; Wang, G.; Li, Y.; Li, Y. Effect of linoleic acid sustained-release microspheres on Microcystis aeruginosa antioxidant enzymes activity and microcystins production and release. Chemosphere 2018, 121, 110–116. [Google Scholar] [CrossRef]
  45. Gao, Y.N.; Ge, F.J.; Zhang, L.P.; He, Y.; Lu, Z.; Zhang, Y.Y.; Liu, B.; Zhou, Q.H.; Wu, Z.B. Enhanced toxicity to the cyanobacterium Microcystis aeruginosa by low-dosage repeated exposure to the allelochemical N-phenyl-1-naphthylamine. Chemosphere 2017, 174, 732–738. [Google Scholar] [CrossRef]
  46. Lee, E.; Jalalizadeh, M.; Zhang, Q. Growth kinetic models for microalgae cultivation: A review. Algal Res. 2015, 12, 497–512. [Google Scholar] [CrossRef]
  47. Zhu, J.; He, Y.; Wang, J.; Qiao, Z.; Wang, Y.; Li, Z.; Huang, M. Impact of aeration disturbances on endogenous phosphorus fractions and their algae growth potential from malodorous river sediment. Environ. Sci. Pollut. Res. 2017, 24, 8062–8070. [Google Scholar] [CrossRef]
  48. Liu, X.; Zhan, M.; Ma, Y. Relationship between algal growth and nutritious materials absorbability in the three-gorges valley. Huanjing Kexue 2005, 26, 95–99. (In Chinese) [Google Scholar] [PubMed]
  49. Ruiz, J.; Arbib, Z.; Alvarez-Diaz, P.D.; Garrido-Pérez, C.; Barragán, J.; Perales, J.A. Photobiotreatment model (PhBT): A kinetic model for microalgae biomass growth and nutrient removal in wastewater. Environ. Technol. 2013, 34, 979–991. [Google Scholar] [CrossRef] [PubMed]
  50. Cerucci, M.; Jaligama, G.K.; Ambrose, R.B.J. Comparison of the monod and droop methods for dynamic water quality simulations. J. Environ. Eng. 2010, 136, 1009–1019. [Google Scholar] [CrossRef] [Green Version]
  51. Coveney, M.F.; Wetzel, R.G. Biomass, production, and specific growth rate of bacterioplankton and coupling to phytoplankton in an oligotrophic lake. Limnol. Oceanogr. 1995, 40, 1187–1200. [Google Scholar] [CrossRef]
  52. Li, Y.; Liu, Y.; Zhao, L.; Hastings, A.; Guo, H. Exploring change of internal nutrients cycling in a shallow lake: A dynamic nutrient driven phytoplankton model. Ecol. Model. 2015, 313, 137–148. [Google Scholar] [CrossRef]
Figure 1. Variations of M. aeruginosa densities (a), growth rates (b), specific growth rates (c), and inhibition rates (d) with time. Dots-measured values, lines-fitted values. Solid arrow-the time at which prometryn single exposure carried out, dotted arrows-the time at which prometryn double exposures carried out.
Water 13 01346 g001
Figure 2. Variations of concentrations of nutrients (a1d1) and concentrations of consumed nutrients (a2d2) with time. Dots–measured values, lines–fitted values.
Water 13 01346 g002aWater 13 01346 g002b
Figure 3. Fitting curves of Monod equation to the datasets of computed specific growth rates by modified logistic equation and concentrations of nutrients: (a), NH4+-N concentrations; (b), TDN concentrations; (c), PO43−-P concentrations; (d), TDP concentrations.
Water 13 01346 g003
Figure 4. The relationship between M. aeruginosa densities (a1d1), growth rate (a2c2), specific growth rates (a3c3) and concentrations of consumed nutrients.
Water 13 01346 g004aWater 13 01346 g004b
Figure 5. Variations of C/(Kc + C) with time: (a1a3), NH4+-N and PO43−-P; (b1b3), TDN and TDP.
Water 13 01346 g005
Table 1. Parameters of M. aeruginosa growth, concentrations of nutrients, and concentrations of consumed nutrients.
ParametersS50D25S100D50S200D100
Parameters of the modified Logistic equation describing M. aeruginosa growth
a4.004.645.245.364.864.80
r0.150.190.240.260.200.20
Nmax6982.698853.655110.505857.161234.291376.31
Nave2973.944070.762289.052802.67470.08640.82
R20.9950.9940.9970.9990.9950.992
μcmax261.85420.55306.63380.7261.7168.82
μcave141.09183.85112.08132.3625.0729.83
Imax69.3961.9385.0179.0296.3792.02
Iave62.3450.0273.8567.5093.4991.67
μcave0.110.110.100.110.090.10
Parameters of the Monod equation
NH4+-N
μm0.320.340.330.330.320.33
Kc2.85 × 10−31.24 × 10−34.86 × 10−23.27 × 10−21.19 × 10−13.63 × 10⁻²
R20.4570.5410.6220.5380.6970.550
TDN
μm0.300.320.280.320.280.29
Kc0.980.733.301.178.237.82
R20.9620.9700.9500.8960.8860.939
PO43−-P
μm0.310.320.330.330.330.33
Kc0.550.270.660.292.221.20
R20.8780.9590.9060.9500.8340.879
TDP
μm0.320.320.310.320.320.30
Kc0.640.280.680.672.121.90
R20.9270.9530.9080.9450.8480.863
Parameters of the Logistic equation describing concentrations of consumed nutrients
ΔNH4+-N
aΔC2.301.812.462.781.411.55
rΔC0.540.660.400.460.270.37
ΔCmax0.600.590.600.590.600.59
R20.9790.9790.9960.9600.9630.984
ΔCave0.540.550.510.510.520.53
ΔTDN
aΔC3.282.752.832.311.872.17
rΔC0.200.190.140.150.080.09
ΔCmax13.6513.6214.4313.889.4912.06
R20.9490.9340.9480.9390.7950.893
ΔCave8.549.157.978.074.585.01
ΔPO43−-P
aΔC2.583.412.702.973.603.52
rΔC0.130.190.110.120.120.10
ΔCmax1.321.321.261.421.111.45
R20.9390.9850.9370.9850.9720.976
ΔCave0.710.770.560.630.470.50
ΔTDP
aΔC2.783.012.742.763.193.03
rΔC0.150.170.110.110.100.12
ΔCmax1.311.331.491.531.721.43
R20.9670.9850.9760.9890.9740.979
ΔCave0.750.800.670.700.570.65
a (-), a constant; r (d−1), the intrinsic growth rate; Nmax (×103 cells mL−1), the maximum algae density; Nave (×103 cells mL−1), the average algae density; R2, correlation coefficient; μcmax (×103 cells (mL d)−1), the maximum growth rate; μcave (×103 cells (mL d)−1), the average growth rate; Imax (%), the maximum inhibition rate; Iave (%), the average inhibition rate; μcave (d−1), the average specific growth rate; μm (d−1), the maximum specific growth rate; Kc, the half-saturation coefficient; aΔC (-), a constant; rΔC (d−1), the consumed rate constant; ΔCmax (mg L−1), the maximum concentrations of consumed nutrients; ΔCave (mg L−1), and the average concentrations of consumed nutrients.
Publisher’s Note: MDPI stays neutral with regard to jurisdictional claims in published maps and institutional affiliations.

