
Epiphytic Diatom-Based Biomonitoring in Mediterranean Ponds: Traditional Microscopy versus Metabarcoding Approaches
by
 ,
,
María Borrego-Ramos
1,2,* ,
,
Eloy Bécares
1,2,
Pedro García
3,
Alejandro Nistal
2 and
Saúl Blanco
1,2 1
Diatom Lab, Institute of Environment, Natural Resources and Biodiversity, University of León, 24007 León, Spain
2
Department of Biodiversity and Environmental Management, Faculty of Biological and Environmental Sciences, University of León, 24007 León, Spain
3
Department of Molecular Biology, Faculty of Biological and Environmental Sciences, University of León, 24007 León, Spain
*
Author to whom correspondence should be addressed.
Water 2021, 13(10), 1351; https://doi.org/10.3390/w13101351
Submission received: 18 March 2021
/
Revised: 7 May 2021
/
Accepted: 11 May 2021
/
Published: 13 May 2021
(This article belongs to the Special Issue Advances in Mountain and Mediterranean Wetlands Conservation)
Abstract
:Benthic diatoms have traditionally been used as bioindicators of aquatic ecosystems. Because diatom-based monitoring of water quality is required by European legislation, molecular-based methods had emerged as useful alternatives to classical methods based on morphological identification using light microscopy. The aim of this study was to test the reliability of DNA metabarcoding combined with High-Throughput Sequencing (HTS) techniques in the bioassessment of the trophic status of 22 Mediterranean shallow ponds in NW Spain. For each pond, the Trophic Diatom Index (TDI) was calculated from inventories obtained by identification using light microscopy (LM) followed by high-throughput sequencing (HTS) at the molecular level. Ponds were subsequently classified into five water quality classes. The results showed a good correspondence between both methods, especially after applying a correction factor that depended on the biovolume of the cells. This correspondence led to the assignment to the same quality class in 59% of the ponds. The determination and quantification of valves or DNA sequences was one of the main pitfalls, which mainly included those related to the variability in the relative abundances of some species. Accordingly, ponds with similar relative abundances for the dominant species were assigned to the same quality class. Moreover, other difficulties leading the discrepancies were the misidentification of some species due to the presence of semi-cryptic taxa, the incompleteness of the reference database and the bioinformatic protocol. Thus, the validation of DNA-based methods for the identification of freshwater diatoms represents an important goal, as an alternative to using traditional methods in Mediterranean shallow ponds.
1. Introduction
Benthic diatoms are well-known bioindicators of water quality that are used in many aquatic ecosystems due to their sensitivity to changes in the environment, particularly those affecting water chemical conditions. Diatom-based methods are routinely used in water biomonitoring, and thus differentindices have been historically developed to classify the ecological status of waterbodies. Traditionally, these methods are based on morphological identifications at the species level (e.g., Pollution Sensitivity Index [1,2]).
In recent times, many studies have shown the advantages of DNA barcoding combined with High-Throughput Sequencing (HTS) methods, compared to conventional approaches [3,4,5,6,7], and thus DNA-based monitoring has been postulated as a promising tool in recent years for the assessment of aquatic ecosystems [8,9,10,11,12]. The development of high-throughput techniques have made this process quicker and easier, and now there are studies available evaluating its application in the biomonitoring of rivers [8,9,10,11,13,14,15] and large lakes [16].
However, shallow lakes, to the best of our knowledge, still remain unstudied. Shallow lakes, especially those in the Mediterranean region, are characterised by their shallow average depth and their small area, with different degrees of temporality. Despite their important role in the environment—providing habitat for animals and plants, diversifying the landscape or acting as water reserves—they have suffered an increasing pressure in terms of nutrients and organic pollution. Human activity, including changes in soil uses and high-intensity farmland, has contributed substantially to the degradation of these habitats. Products derived from agricultural and livestock activities (especially fertilisers and pesticides) are the main pollutants in these types of habitats. These lakes have been extensively studied from the perspective of their ecological quality using diatoms [17,18,19,20] and recently [21] applied molecular techniques under a metacommunity framework. However, metabarcoding techniques have not been applied to date together with Next-Generation Sequencing (NGS) to test their validity in water quality assessment in shallow lakes. Thus, in this study, as in previous studies [22,23,24,25,26], the use of epiphytic diatoms for biomonitoring purpose is evidenced in shallow lakes, where macrophytes may be the only available substratum to be found in virtually any system. Our study specifically addresses the question of whether there are differences between the ecological classifications of shallow lakes based on the diatom data acquired by the DNA barcoding and light microscopic identification of diatoms.
In this study, the aim was to compare the differences between diatom species inventories obtained by classical (light microscopy) and molecular (metabarcoding of diatom rbcL DNA) methods in a set of 22 Mediterranean shallow ponds in the Duero river basin (NW Spain). Thus, the reliability of molecular-based methods for the assessment of water quality in this system was tested.
2. Materials and Methods
2.1. Study Area
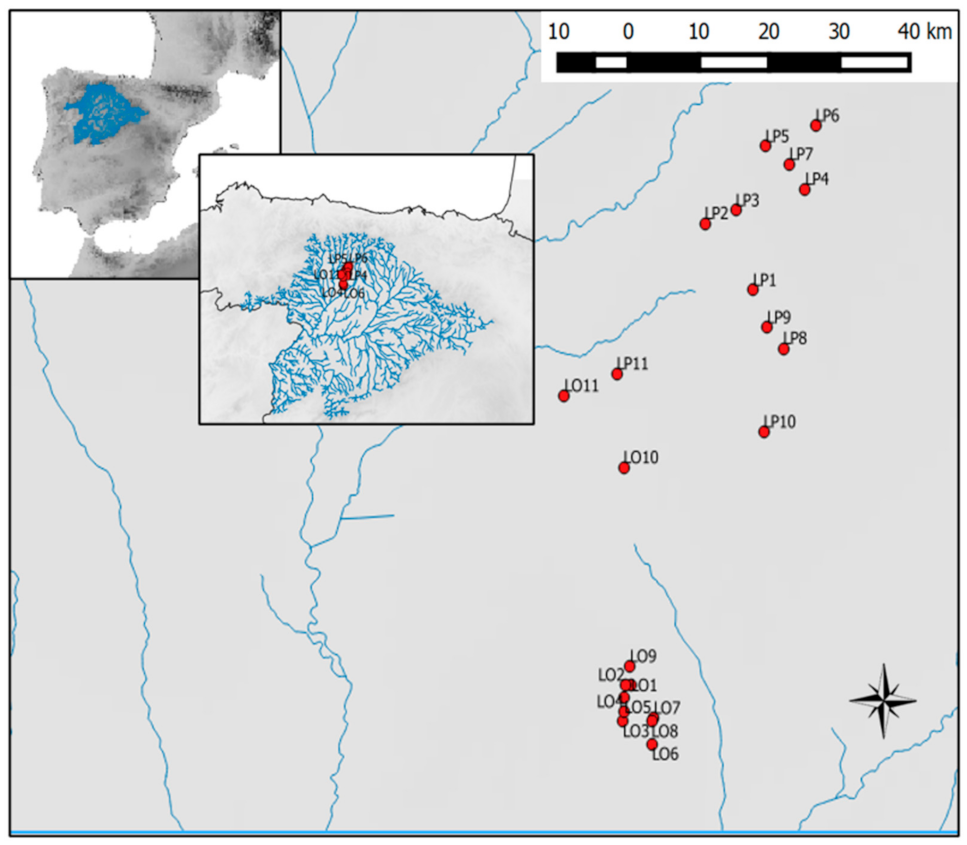
The study area (Figure 1, Table 1) is located in the northwest of the Iberian Peninsula within the Duero river basin, with an area of 97,000 km2, of which 81% is in Spanish territory. Samples were obtained from shallow ponds situated 800 m above sea level (ASL) on the western side of this basin. The study site is mainly affected by agricultural intensification, turning to irrigated crops in recent decades.
2.2. Diatom Sampling
Diatoms were collected from the submerged stems of Schoenoplectus lacustris (L.) Palla, in July 2018 from 22 shallow ponds. In each pond, at least 10–12 stems that were randomly distributed throughout the pond surface were chosen and cut at 10 cm below the water surface, according to recommendations from previous studies [18,27]. The stems of each pond were placed together in a 1 L plastic bottle filled to 0.5 L with distilled water. The attached diatoms were dislodged by shaking for two minutes [28,29,30]. Subsamples for microscope analysis were preserved in 4% v/v formaldehyde, whereas subsamples for molecular analysis were preserved with ethanol (70% v/v final concentration) and stored in the dark. Simultaneously, water samples were taken in order to determine the trophic conditions in each system, and thus total nitrogen (mg L−1) and total phosphorus (µg L−1) levels were determined following standard methods [31].
2.3. Morphological Analysis
Samples for light microscopy (LM) analysis were treated with hydrogen peroxide and hydrochloric acid, according to standard methods [32]. Cleaned frustules were mounted on permanent slides using Naphrax, and at least 400 valves were identified and counted from each sample using a light microscope (Olympus BX60, Olympus Optical Co, Tokyo, Japan) at a magnification of 1000×, following the procedure for European diatom floras [33,34,35,36,37].
2.4. DNA Extraction, PCR Amplification and Sequencing Data Processing
DNA was extracted from a subsample of 2 mL which was centrifuged for 30 min at 11,000 g. Supernatant was removed and material in the pellet was resuspended in 200 µL of nuclease-free water. The Power Soil DNA Isolation Kit® (Mo Bio Laboratories, Carlsbad, CA, USA) was used for extraction, following the manufacturer’s recommendations. The gene marker rbcL was amplified by PCR using the primers proposed by [16,38], an equimolar mix of three PCR primers, one forward (Diat_rbcL_708F_1 (AGGTGAAGTAAAAGGTTCWTACTTAAA), Diat_rbcL_708F_2 (AGGTGAAGTTAAAGGTTCWTAYTTAAA) and Diat_rbcL_708F_3 (AGGTGAAACTAAAGGTTCWTACTTAAA)), and two reverse (Diat_rbcL_R3_1 (CCTTCTAATTTACCWACWACTG) and Diat_rbcL_R3_2 (CCTTCTAATTTACCWACAACAG)), including Illumina adapters P5 (CTTTCCCTACACGACGCTCTTCCGATCT) and P7 (GGAGTTCAGACGTGTGCTCTTCCGATC). For each DNA sample, six PCR replicates were carried out on 10–20 ng/μL of extracted DNA in a mixture (50 µL final volume) containing 2 U of Platinum II Taq Hot-Start DNA Polymerase (Invitrogen, Grand Island, NY, USA), 10 μL of 5× Platinum II PCR Buffer, 0.5 μM of each primer, 5 μL of dNTP mix (2 mM each), 10 μL of Platinum GC Enhancer and 9.6 μL of nuclease-free water. PCR conditions included an initial denaturalisation step at 94 °C for 4 min followed by 40 cycles of denaturalisation at 94 °C for 30 s, annealing at 55 °C for 30 s and extension at 68 °C for 30 s, and a final extension step at 68 °C for 10 min. After PCR, the amplification of the rbcL was confirmed by 1.5% agarose gel electrophoresis stained with ethidium bromide and visualised with UV light.
The sequencing process was carried out in Sistemas Genómicos SL (Valencia, Spain). Purified DNA from all six PCR replicates was pooled into a single sample and quantified using Qubit 3.0. (Invitrogen, Life Technologies, Grand Island, NY, USA). From each sample, 5 ng of pooled PCR products was subjected to indexing PCR on 50 μL of reaction mixture containing KAPA HiFi Hot Start DNA Polymerase (Kapa Biosystems, Wilmington, DE, USA) and a combination of specific primers to allow multiplexing of all PCR products in the same sequencing run. PCR products were purified with Agencourt AMPure XP beads (Beckman-Coulter, Brea, CA, USA). After that, a 4200 Tape Station (Agilent Technologies, Santa Clara, CA, USA) with a High Sensitivity D1000 Screen Tape was used to determine the quality and quantity of purified amplicons. Finally, rbcL libraries were pooled and paired-end sequenced (2 × 250 bp) on a MiSeq 2500 instrument (Illumina, San Diego, CA, USA) using a Micro MiSeq Reagent Kit v2.
2.5. Bioinformatic Analysis
For the bioinformatic treatment, all of the FASTQ files were treated together, following recommendations by [38] and process optimisation by [9], obtaining taxonomic assignments directly from individual sequence units (ISU). All of the analyses were performed using Mothur software v.1.42.1 [39]. DNA reads were filtered to remove reads with length > 250 bp, those with Phred quality score > 23 over a moving window of 25 bp (allowing up to 1 mismatch in primer sequence), homopolymer > 8 bp and sequences with ambiguous base calls (maxambig = 0). Taxonomic assignment was conducted directly from individual sequence units (ISUs) after removing chimeric DNA sequences using the Uchime algorithm [40] following [9], where those authors demonstrated the effectiveness of this method as an alternative to operational taxonomic unit (OTU) clustering in biomonitoring. The reference database was Diat.barcode v7 [41] (available at https://www6.inrae.fr/carrtel-collection/Barcoding-database/Database-download, accessed on 21 January 2020).
2.6. Ecological Status Class Assignment
With the resulting floristic inventories, water quality was determined for each system by applying the Trophic Diatom Index (TDI) [2], computed using OMNIDIA software v. 6.0.8 [43]. This index was selected on the basis of the diatom taxa that were considered for its calculation. In most ponds, all species were considered for the calculation of TDI scores, and in the least of the cases 83.3% of the species were considered in order to compute the water quality index. Ponds were subsequently classified into five classes: High, Good, Moderate, Bad and Poor status, according to the criteria of the European Water Framework Directive (2000/60/EC).
3. Results
3.1. Morphological Analysis
In total, 116 taxa were identified by LM, including species, subspecies and varieties. The number of species per sample ranged from 6 to 24, with an average of 16 species (Table S1). The most abundant taxa were Achnanthidium minutissimum (Kützing) Czarnecki, Achnanthidium sp. Kützing, Fragilaria tenera (W.Smith) Lange-Bertalot, Ulnaria acus (Kützing) Aboal and Eunotia bilunaris (Ehrenberg) Schaarschmidt.
3.2. HTS Analysis
A total of 4,150,073 reads were obtained by Illumina MiSeq sequencing. After trimming and applying quality filters, 2,699,154 DNA reads were conserved. After taxonomic assignment corresponding to 209,650 ISUs, 159 taxa were successfully determined at species level (50.1% of total reads). The number of species per sample ranged from 43 to 93, with an average of 59 species (Table S1). After applying the biovolume correction factor, the most abundant species were Achnanthidium minutissimum (Kützing) Czarnecki, Ulnaria acus (Kützing) Aboal, Fragilaria sp., Gomphonema saprophilum (Lange-Bertalot and E.Reichardt) Abarca et al. and Nitzschia palea (Kützing) W.Smith.
3.3. Comparison of LM and HTS Inventories
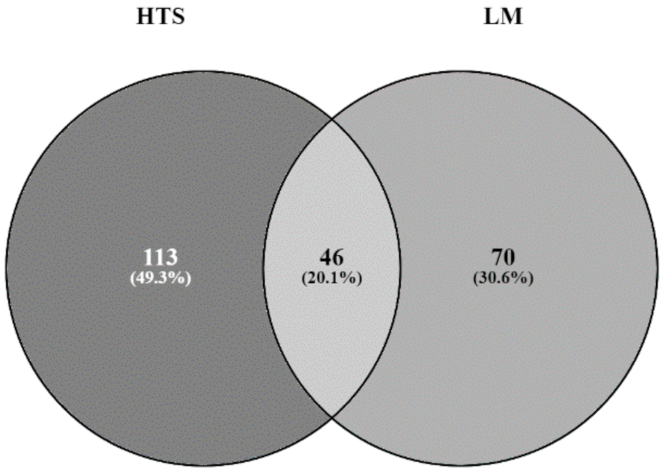
Only 20.1% of the taxa were concordant when comparing both methodologies (Figure 2). The molecular method was unable to detect some species such as Gomphonema exilissimum (Grunow) Lange-Bertalot and E.Reichardt, Nitzschia palea var. debilis (Kützing) Grunow, Ulnaria biceps (Kützing) Compère or Gomphonema pumilum var. rigidum E.Reichardt and Lange-Bertalot. These species could have been misidentified during morphological identification as morphologically similar taxa. The pairwise comparisons of the most abundant species are summarised in Table 2. For instance, Fragilaria nanoides Lange-Bertalot was probably identified as Fragilaria tenera, as deduced from their similar relative abundances (9.1% and 3.9% by LM and HTS, respectively).
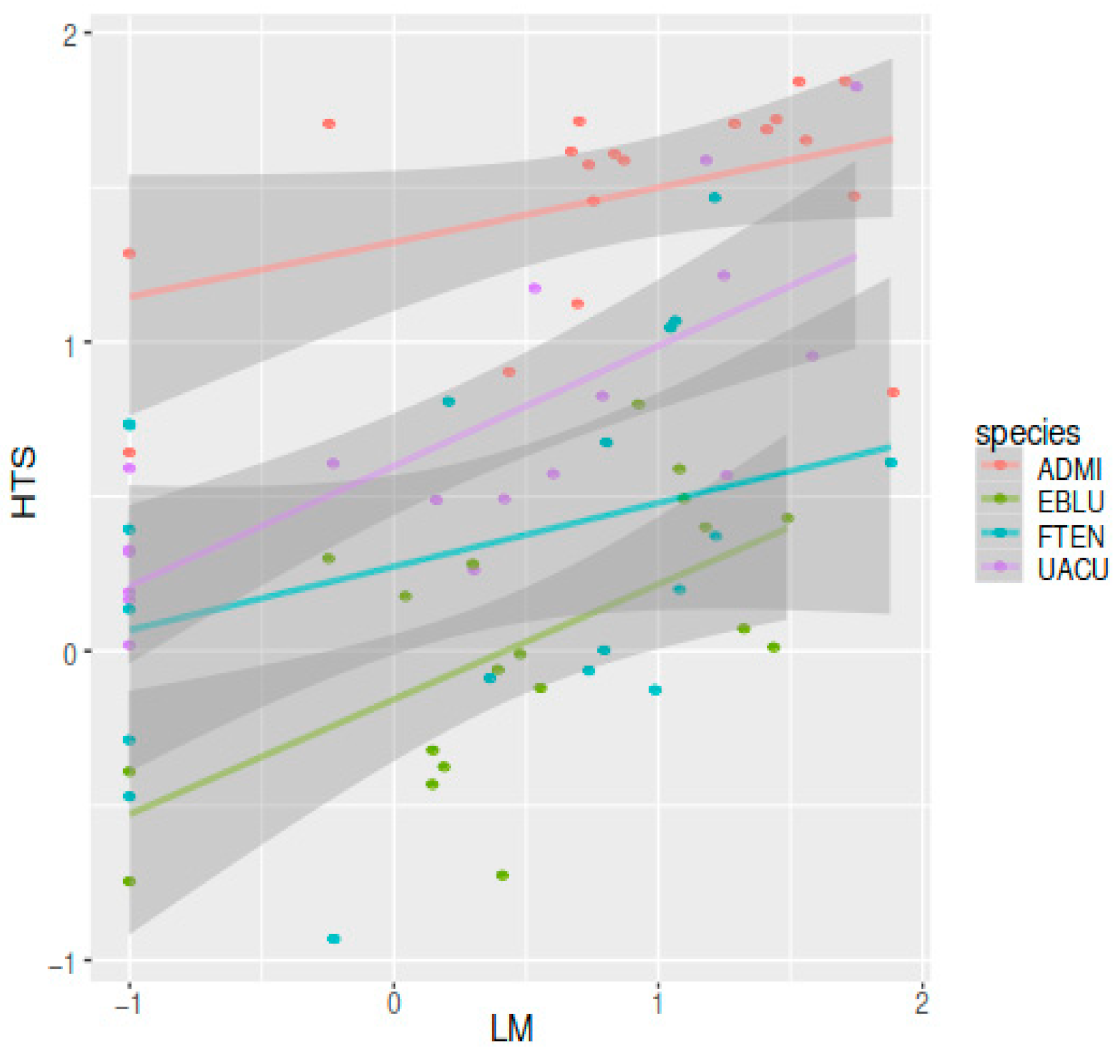
The correlation between relative abundances of valves (LM) and number of reads (HTS) for the most abundant species (Achnanthidium minutissimum, Eunotia bilunaris, Fragilaria tenera and Ulnaria acus) was positive and statistically significant (Figure 3).
Larger diatoms were widely overrepresented in HTS inventories before applying the correction factor. This was the case for Ulnaria acus, which varied from a relative abundance of 15.8% to 10.7% after applying the correction factor, which was a similar value to that identified by LM (8.7%).
Regarding the potential for LM misidentification, Nitzschia gracilis was only identified in three samples by LM, but occurred in many samples according to HTS. In one of the ponds (Linos) a total of 11% of sequences were assigned to Nitzschia palea, but by LM up to 37% of valves were assigned to N. gracilis (not detected by HTS). Similarly, a confusion may have occurred between Fragilaria tenera and F. nanoides, identified only by LM or HTS, respectively. Another case of suspected misidentification affected Gomphonema parvulum sensu stricto; while Gomphonema saprophilum (Lange-Bertalot and Reichardt) Abarca Jahn Zimmermann and Enke was the most abundant species from the Gomphonema parvulum species complex in HTS inventories, Gomphonema parvulum f. parvulum (Kützing) Kützing was dominant in the datasets that were derived from light microscopy.
Overall, HTS was able to resolve a larger species diversity within certain genera. For instance, seven different taxa were identified at species level for Eunotia (Eunotia arcus, E. bilunaris, E. glacialis, E. implicata, E. minor, E. mucophila, Eunotia sp.), whereas only five taxa were identified at species level (Eunotia sp., E. bilunaris, E. implicata, E. minor, E. pseudoflexuosa) by LM. Of particular interest is the case of Eunotia glacialis, a species known to be present in northern Spain (Aboal et al. 2003) and which was actually recorded in all of the studied ponds by HTS but was apparently absent from the studied systems according to the results provided by LM analysis. Conversely, several genera were only detected by LM analysis, such as Fallacia Stickle and Mann, Amphora Ehrenberg ex Kützing, Cocconeis Ehrenberg, Cyclostephanos Round, Epithemia Kützing, Gyrosigma Hassall, Lemnicola Round and Basson, Luticola Mann, Planothidium Round and Bukhtiyarova, Rhoicosphenia Grunow, Tabellaria Ehrenberg ex Kützing. Finally, a number of taxa, such as Achnanthidium digitatum Pinseel, Vanormelingen, Hamilton and Van de Vijver, were not expected in the inventories obtained because, to our knowledge, these have not previously been recorded in Spain and to date are only known from high latitude localities (Pinseel et al., 2017).
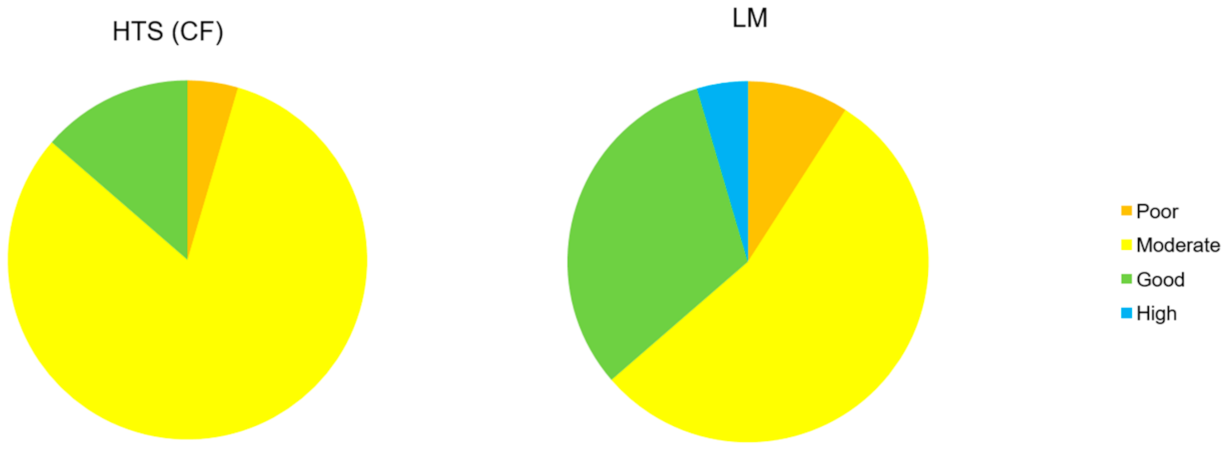
The Trophic Diatom Index scores showed a better correlation between data from LM and from metabarcoding after applying the correction factors for cell size. The percentage of ponds (Figure 4) with a congruent classification according to both methods increased from 45 to 54 after applying the correction factor. None of the ponds was classified as “Bad” quality by molecular and morphologic-based methods, whereas the only pond classified as “Poor” was assigned to the same class by both methods. In the case of ponds classified as “Moderate” or “Good”, 7 ponds out of 22 were incongruently classified (Table 3). Regarding the “High” quality class (blue), only one system reached this quality range by conventional methods, which was underestimated by HTS. For 50% of the systems evaluated, TDI scores obtained by both methods differed by less than 20%.
For instance, the only pond classified as “High” quality by LM (LP04 TRIGO), showed differences regarding the dominant taxa that were found according to the methods that were compared. By light microscopy, the most abundant species were Fagilaria tenera (75.8%), Ulnaria acus (17.6%) and Nitzschia gracilis (3.1%), contrasting with Fragilaria sp. (47.2%), Achnanthidium minutissimum (19.2%) and Ulnaria acus (16.2%) derived from HTS analysis.
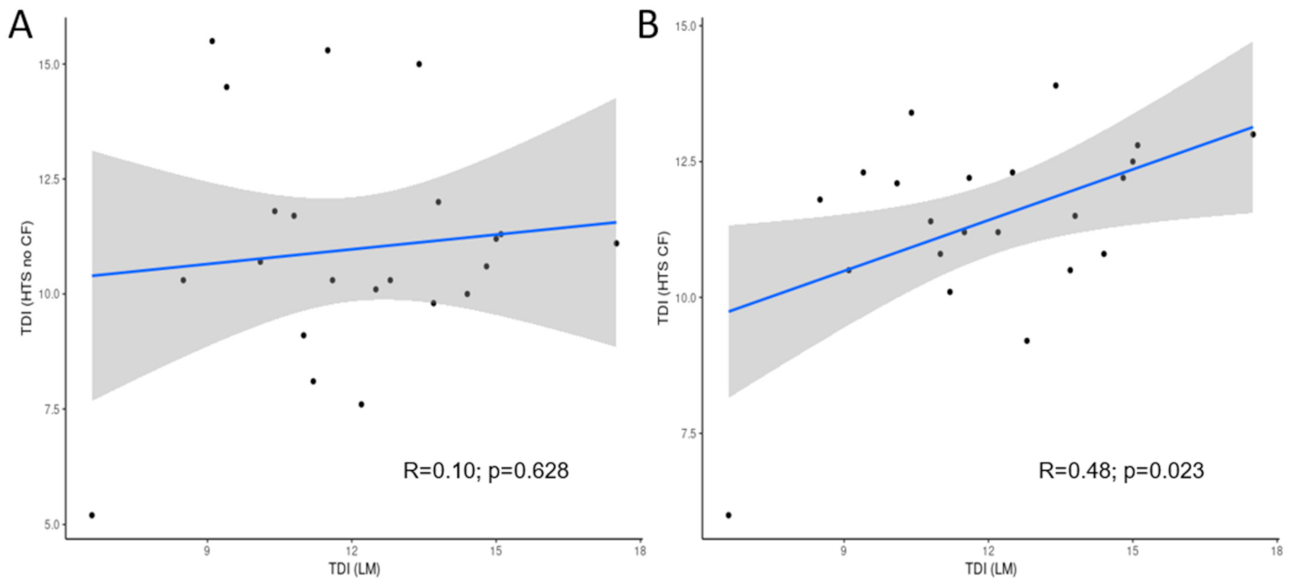
The results of the correlation test (Figure 5) that was performed between index values that were calculated from morphological and molecular inventories showed significant correlation in the case of the TDI only, after applying the correction factor.
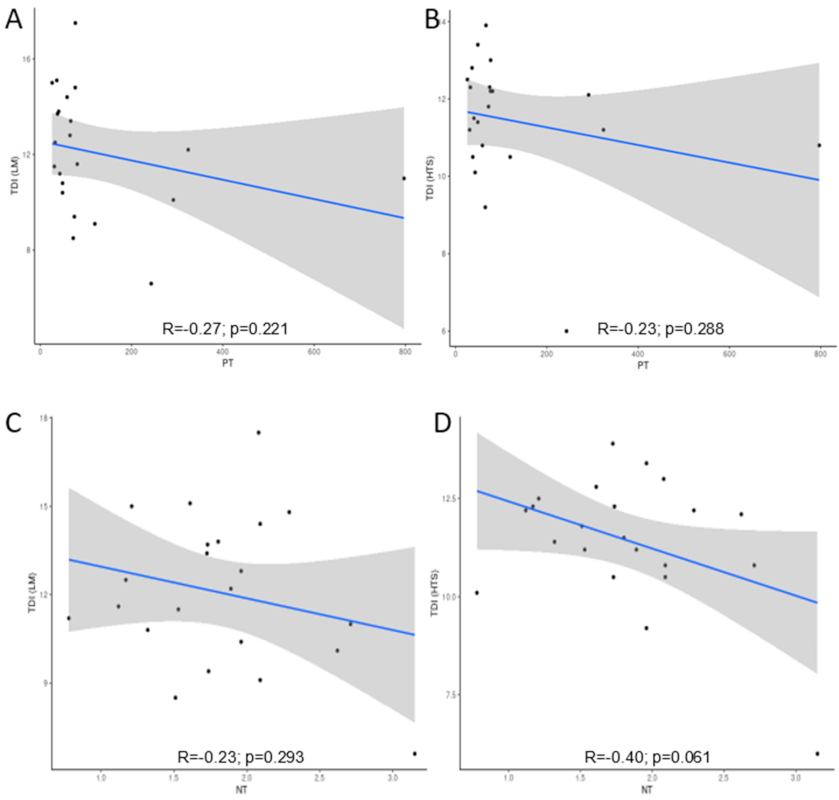
Total phosphorus and total nitrogen were analysed as one of the main indicators of nutrient pollution. Total phosphorus (TP) concentrations, with an average concentration of 122.3 (µg L−1), ranging from 26 to 796.8 µg L−1, correlated with TDI derived from morphological and molecular-based methods. A non-significant negative correlation was observed between total phosphorus and TDI calculated from both morphological (R = −0.27) and molecular (R = −0.23) approaches (Figure 6). Total nitrogen (TN) levels ranged from 0.8 to 3.2 mg L−1 with an average of 1.82 mg L−1. The correlation coefficients to TN and TDI that were calculated from both methods, LM (R = −0.23) and HTS (R = −0.40), were not significant (p > 0.05).
4. Discussion
The comparison of morphological and molecular-based inventories demonstrated a similarity of 20.1% in terms of species number. In fact, the results are comparable with the 15.7% found in [16] and other studies in rivers, ranging from 13 to 26.7% [9,11,15,38].
Comparing the relative abundance of the sequences (HTS inventories) and of the valves (LM inventories), it can be assumed that certain species (identified at the genus level) may have been misidentified under LM. In this regard, molecular methods can give an idea of the total richness within a sample. Notwithstanding, the comparison of inventories obtained both morphologically and by HTS point out some nonconformities in geographical distributions. On the one hand, some taxa found by HTS had not been detected in previous analyses of the diatom assemblages in the study ponds. For instance, Achnanthidium digitatum Pinseel, Vanormelingen, Hamilton and Van de Vijver, has been detected in most samples by HTS methods, and not identified as such under LM. This species had been detected only in arctic and sub-arctic regions [44,45,46]. Similarly, three Fragilaria species (F. aculeopectinalis, F. longipectinalis and F. taeniavaucheriae) were also not identified using light microscopy. In these cases, in which the species are not included in the OMNIDIA database, autoecological ranges need to be defined for an accurate diagnosis of the ecological status.
On the other hand, the appearance of different species between both inventories may be due to misidentification within diatom complexes. Some studies based on phylogenetic analysis have been conducted [4,47,48,49] in order to explain their taxonomy and ecology, and these have indicated that geographical distribution may affect species determination in extremely similar morphological cases. Thus, traditional morphological characteristics are insufficient to distinguish varieties (or even species), whereby the authors in [50] describe pseudo-cryptic species. Since then, several studies have been aimed at providing an accurate identification of semi-cryptic taxa: Gomphonema parvulum (Kützing) Kützing complex [47], Nitzschia palea (Kützing) Smith complex [51], genus Fragilaria [52], Navicula cryptocephala Kützing [53]. In the case of Gomphonema parvulum complex, in their study, [48] elevated G. saprophilum to species rank, suggesting the biogeographic importance in determining this species, and yet this is not so easy to identify by microscopic methods.
In the case of some genera, they are over-represented in terms of species diversity, due to the database that was used for the taxonomic assignment. For instance, genus Eunotia was represented by a greater number of species using HTS, which [54] associated with the pipeline used. Several lightly silicified taxa could not be found by light microscopy because of the oxidant reactives that were used during the permanent slide preparation process [55]. For instance, Fistulifera saprophila, which was actually present in the samples, was not detected by LM in any pond. Our results are in agreement with this point, regarding other studies [10,11]. On the contrary, some other species were not recorded by HTS, probably because of the lack of some taxa in the reference library or because they were not detected by molecular methods; some dead diatom valves can be retained in the collected biofilm growing on the stems, so they could only be detected by LM. Finally, the presence of certain endemic species [38], not included in the reference database, cannot be ruled out.
With respect to the ecological classification according to TDI scores, 59% of ponds were assigned to the same quality class in both methods, with only one class of difference for the others, hence with similar results to studies performed in rivers (57% in [15]; 69.8% in [11]; 64% in [16]). Similarly, the comparison between transformed (applying CF) and untransformed data showed an improvement in the assignment to quality classes derived from morphological data, as also reported by the same authors. In our case, after applying the correction factor, the percentage of congruent water quality classifications increased from 45.4% to 59.0%. The correction factor proposed by [42] and modified by [9] seems to be a good strategy to avoid the bias produced by the difference in the rbcL copy number. This modification substantially improves the assignment to quality classes in the studied ponds, as has already been shown in previous studies [9,11]. Nutrient pollution caused by increasingly growing intensive agriculture is seriously affecting wetlands. As a consequence, high levels of nutrients are released into the water bodies, these having high nitrogen and phosphorus levels that contribute predominantly to this problem [56,57]. The results of the present study show a good correlation with the Trophic Diatom Index, thus highlighting the efficacy of this index, which was initially conceived for deep continental lakes, to monitor nutrient levels in shallow ponds.
As emphasised by many similar studies (e.g., [54]), one of the key steps for the correct application of DNA barcoding for biomonitoring purposes is the bioinformatic protocol. Standardised protocols are needed to reach an agreement about bioinformatic analysis. In our case, the results suggest a moderately poor correspondence in the species composition and abundances between the HTS inventories that were obtained from different bioinformatic treatments starting from the same sequences [21].
Differences in taxonomic assignment methods have been widely discussed in [54], where the strategies of different research groups and different software were compared. Those authors suggested the development of an index based exclusively on the presence or absence of taxa. This strategy gives good results in other taxonomic groups, such as macroinvertebrates (using the IBMWP index, [58]). In the present study, taxonomic assignment was conducted directly with individual sequence units (ISUs), in accordance with previous studies [9,59], where the effectiveness of this method was demonstrated as an alternative to OTU clustering in biomonitoring. Nevertheless, a taxonomy-free analysis seems to be a better approach according to several other authors [10,13,49,60]. Indeed, a taxonomy-free approach based on diatom community samples has already been successfully tested to assess rivers in Portugal [13] and the UK [10]. However, the most reasonable approach seems to be to seek consensus between the equivalence of sequences (HTS) and valve number (LM) [10].
5. Conclusions
Compared to conventional analyses based on morphological characteristics that require more qualified personnel, DNA barcoding combined with High-Throughput Sequencing (HTS) provides an interesting complementary information source for morphological data. Nevertheless, the determination and quantification of valves or DNA sequences was one of the main pitfalls, which mainly included those related to the variability in the relative abundances of some species. Accordingly, ponds with similar relative abundances for the dominant species were assigned to the same quality class. The main difficulties leading the discrepancies were the misidentification of some species due to the presence of semi-cryptic taxa, the incompleteness of the reference database and the bioinformatic protocol.
In the present study, we demonstrated the efficacy of the use of a taxonomic assignment that was conducted directly using individual sequence units (ISUs). As far as these results show, new studies are needed to expand the study zone and the range of trophic statuses to assess how valuable the routine is in the bioassessment of shallow ponds. New studies are needed to establish policies aimed at protecting, conserving and managing these resources. In conclusion, the validation of DNA-based methods for the identification of freshwater diatoms represents an important goal, whereas this information from DNA-based methods is complementary to traditional methods in the monitoring and conservation of Mediterranean shallow ponds.
Supplementary Materials
The following are available online at https://www.mdpi.com/article/10.3390/w13101351/s1. Table S1: Species relative abundance.
Author Contributions
Conceptualisation, E.B. and S.B.; methodology, P.G., A.N. and M.B.-R.; software, M.B.-R.; formal analysis, M.B.-R. and S.B.; writing—original draft preparation, M.B.-R.; writing—review and editing, M.B.-R., E.B., P.G., A.N. and S.B.; supervision, S.B. and M.B.-R.; funding acquisition, S.B. and E.B. All authors have read and agreed to the published version of the manuscript.
Funding
This research was funded by the Spanish Ministry of Economy and Industry, project CGL2017-84176R (METAPONDS) and Fundación Biodiversidad, Ministerio para la Transición Ecológica y el Reto Demográfico project BT-2019.
Institutional Review Board Statement
Not applicable.
Informed Consent Statement
Not applicable.
Data Availability Statement
All Illumina MiSeq raw reads are available on the NCBI Sequence Read Archive with the accession numbers SAMN14535185-SAMN14535228 (project PRJNA623014).
Acknowledgments
We thank all staff at the LIMNO group who helped to collect the samples. Financial support was provided by the project METAPONDS, funded by the Spanish Ministry of Economy and Industry, project CGL2017-84176R, and Fundación Biodiversidad, Ministerio para la Transición Ecológica y el Reto Demográfico (project BT-2019). We also thank the SCAYLE Foundation for their support in bioinformatic analysis. The authors are also thankful to S. Rivera for his kind help with bioinformatics questions.
Conflicts of Interest
The authors declare no conflict of interest.
References
- BARBE J; DES CLERCS S; PHILIPPE M., Etude Des Méthodes Biologiques d’appréciation Quantitative de La Qualité Des Eaux. Available online: https://www.oieau.org/eaudoc/notice/ETUDE-DES-METHODES-BIOLOGIQUES-DAPPRECIATION-QUANTITATIVE-DE-LA-QUALITE-DES-EAUX (accessed on 11 May 2021).
- Kelly, M.G.; Whitton, B.A. The Trophic Diatom Index: A New Index for Monitoring Eutrophication in Rivers. J. Appl. Phycol. 1995, 7, 433–444. [Google Scholar] [CrossRef]
- Kermarrec, L.; Franc, A.; Rimet, F.; Chaumeil, P.; Humbert, J.-F.; Bouchez, A. Next-Generation Sequencing to Inventory Taxonomic Diversity in Eukaryotic Communities: A Test for Freshwater Diatoms. Mol. Ecol. Resour. 2013, 13, 607–619. [Google Scholar] [CrossRef]
- Zimmermann, J.; Glöckner, G.; Jahn, R.; Enke, N.; Gemeinholzer, B. Metabarcoding vs. Morphological Identification to Assess Diatom Diversity in Environmental Studies. Mol. Ecol. Resour. 2015, 15, 526–542. [Google Scholar] [CrossRef]
- Rimet, F.; Abarca, N.; Bouchez, A.; Kusber, W.-H.; Jahn, R.; Kahlert, M.; Keck, F.; Kelly, M.G.; Mann, D.G.; Piuz, A.; et al. The Potential of High-Throughput Sequencing (HTS) of Natural Samples as a Source of Primary Taxonomic Information for Reference Libraries of Diatom Barcodes. Fottea 2018, 18, 37–54. [Google Scholar] [CrossRef] [Green Version]
- An, S.M.; Choi, D.H.; Lee, J.H.; Lee, H.; Noh, J.H. Identification of Benthic Diatoms Isolated from the Eastern Tidal Flats of the Yellow Sea: Comparison between Morphological and Molecular Approaches. PLoS ONE 2017, 12, e0179422. [Google Scholar] [CrossRef] [Green Version]
- Liu, M.; Zhao, Y.; Sun, Y.; Li, Y.; Wu, P.; Zhou, S.; Ren, L. Comparative Study on Diatom Morphology and Molecular Identification in Drowning Cases. Forensic Sci. Int. 2020, 317, 110552. [Google Scholar] [CrossRef] [PubMed]
- Vasselon, V.; Rimet, F.; Domaizon, I.; Monnier, O.; Reyjol, R.; Bouchez, A. Assessing Pollution of Aquatic Environments with Diatoms’ DNA Metabarcoding: Experience and Developments from France Water Framework Directive Networks. Metabarcod. Metagenom. 2019, 3, e39646. [Google Scholar]
- Rivera, S.F.; Vasselon, V.; Bouchez, A.; Rimet, F. Diatom Metabarcoding Applied to Large Scale Monitoring Networks: Optimization of Bioinformatics Strategies Using Mothur Software. Ecol. Indic. 2020, 109, 105775. [Google Scholar] [CrossRef]
- Kelly, M.G.; Juggins, S.; Mann, D.G.; Sato, S.; Glover, R.; Boonham, N.; Sapp, M.; Lewis, E.; Hany, U.; Kille, P.; et al. Development of a Novel Metric for Evaluating Diatom Assemblages in Rivers Using DNA Metabarcoding. Ecol. Indic. 2020, 118, 106725. [Google Scholar] [CrossRef]
- Pérez-Burillo, J.; Trobajo, R.; Vasselon, V.; Rimet, F.; Bouchez, A.; Mann, D.G. Evaluation and Sensitivity Analysis of Diatom DNA Metabarcoding for WFD Bioassessment of Mediterranean Rivers. Sci. Total Environ. 2020, 727, 138445. [Google Scholar] [CrossRef]
- Masouras, A.; Karaouzas, I.; Dimitriou, E.; Tsirtsis, G.; Smeti, E. Benthic Diatoms in River Biomonitoring—Present and Future Perspectives within the Water Framework Directive. Water 2021, 13, 478. [Google Scholar] [CrossRef]
- Feio, M.J.; Serra, S.R.Q.; Mortágua, A.; Bouchez, A.; Rimet, F.; Vasselon, V.; Almeida, S.F.P. A Taxonomy-Free Approach Based on Machine Learning to Assess the Quality of Rivers with Diatoms. Sci. Total Environ. 2020, 722, 137900. [Google Scholar] [CrossRef]
- Visco, J.A.; Apothéloz-Perret-Gentil, L.; Cordonier, A.; Esling, P.; Pillet, L.; Pawlowski, J. Environmental Monitoring: Inferring the Diatom Index from next-Generation Sequencing Data. Environ. Sci. Technol. 2015, 49, 7597–7605. [Google Scholar] [CrossRef]
- Mortágua, A.; Vasselon, V.; Oliveira, R.; Elias, C.; Chardon, C.; Bouchez, A.; Rimet, F.; Feio, M.J.; Almeida, S.F. Applicability of DNA Metabarcoding Approach in the Bioassessment of Portuguese Rivers Using Diatoms. Ecol. Indic. 2019, 106, 105470. [Google Scholar] [CrossRef]
- Rivera, S.F.; Vasselon, V.; Jacquet, S.; Bouchez, A.; Ariztegui, D.; Rimet, F. Metabarcoding of Lake Benthic Diatoms: From Structure Assemblages to Ecological Assessment. Hydrobiologia 2018, 807, 37–51. [Google Scholar] [CrossRef]
- Blanco, S.; Romo, S.; Villena, M.-J.; Martínez, S. Fish Communities and Food Web Interactions in Some Shallow Mediterranean Lakes. Hydrobiologia 2003, 506, 473–480. [Google Scholar] [CrossRef]
- Blanco, S.; Ector, L.; Bécares, E. Epiphytic Diatoms as Water Quality Indicators in Spanish Shallow Lakes. Vie Milieu 2004, 54, 71–80. [Google Scholar]
- Blanco, S.; Cejudo-Figueiras, C.; Álvarez-Blanco, I.; van Donk, E.; Gross, E.M.; Hansson, L.-A.; Irvine, K.; Jeppesen, E.; Kairesalo, T.; Moss, B.; et al. Epiphytic Diatoms along Environmental Gradients in Western European Shallow Lakes. CLEAN Soil Air Water 2014, 42, 229–235. [Google Scholar] [CrossRef]
- Cejudo-Figueiras, C.; Álvarez-Blanco, I.; Bécares, E.; Blanco, S.; Cejudo-Figueiras, C.; Álvarez-Blanco, I.; Bécares, E.; Blanco, S. Epiphytic Diatoms and Water Quality in Shallow Lakes: The Neutral Substrate Hypothesis Revisited. Mar. Freshw. Res. 2011, 61, 1457–1467. [Google Scholar] [CrossRef]
- Nistal, A.; García, P.; García-Girón, J.; Borrego-Ramos, M.; Blanco, S.; Bécares, E. DNA Metabarcoding and Morphological Methods Show Complementary Patterns in the Metacommunity Organization of Lentic Epiphytic Diatoms. In ARPHA Conference Abstracts; Pensoft Publishers: Sofia, Bulgaria, 2021. [Google Scholar]
- Poulíčková, A.; Duchoslav, M.; Dokulil, M. Littoral Diatom Assemblages as Bioindicators of Lake Trophic Status: A Case Study from Perialpine Lakes in Austria. Eur. J. Phycol. 2004, 39, 143–152. [Google Scholar] [CrossRef]
- Bennion, H.; Kelly, M.G.; Juggins, S.; Yallop, M.L.; Burgess, A.; Jamieson, J.; Krokowski, J. Assessment of Ecological Status in UK Lakes Using Benthic Diatoms. Freshw. Sci. 2014, 33, 639–654. [Google Scholar] [CrossRef] [Green Version]
- Cantonati, M.; Spitale, D. The Role of Environmental Variables in Structuring Epiphytic and Epilithic Diatom Assemblages in Springs and Streams of the Dolomiti Bellunesi National Park (South-Eastern Alps). Fundam. Appl. Limnol. 2009, 174, 117–133. [Google Scholar] [CrossRef]
- Wojtal, A.Z.; Sobczyk, Ł. The Influence of Substrates and Physicochemical Factors on the Composition of Diatom Assemblages in Karst Springs and Their Applicability in Water-Quality Assessment. Hydrobiologia 2012, 695, 97–108. [Google Scholar] [CrossRef] [Green Version]
- Winter, J.G.; Duthie, H.C. Stream Epilithic, Epipelic and Epiphytic Diatoms: Habitat Fidelity and Use in Biomonitoring. Aquat. Ecol. 2000, 34, 345–353. [Google Scholar] [CrossRef]
- Bécares, E.; Blanco, S. Método de muestreo de diatomeas epífitas en laguna para la aplicación de la Directiva Marco del Agua. Tecnología del Agua. 2006, 26, 42–47. [Google Scholar]
- Borrego-Ramos, M.; Olenici, A.; Blanco, S. Are Dead Stems Suitable Substrata for Diatom-Based Monitoring in Mediterranean Shallow Ponds? Fundam. Appl. Limnol. 2019, 192, 215–224. [Google Scholar] [CrossRef]
- Riato, L.; Leira, M.; Della Bella, V.; Oberholster, P.J. Development of a Diatom-Based Multimetric Index for Acid Mine Drainage Impacted Depressional Wetlands. Sci. Total Environ. 2018, 612, 214–222. [Google Scholar] [CrossRef] [Green Version]
- Zimba, P.V.; Hopson, M.S. Quantification of Epiphyte Removal Efficiency from Submersed Aquatic Plants. Aquat. Bot. 1997, 58, 173–179. [Google Scholar] [CrossRef]
- American Public Health Association. Standard Methods for the Examination of Water and Wastewater; American Public Health Association: Washington, DC, USA, 1989. [Google Scholar]
- European Committee for Standardization (CEN). EN 13946:2014. Water Quality—Guidance for the Routine Sampling and Preparation of Benthic Diatoms from Rivers and Lakes; European Committee for Standardization: Brussels, Belgium, 2014. [Google Scholar]
- Krammer, K.; Lange-Bertalot, H. Süsswasserflora von Mitteleuropa. Band 2/3. Bacillariophyceae. 3. Teil: Centrales, Fragilariaceae, Eunoticeae; Ettl, H., Gerloff, J., Heynig, H., Mollenhauer, D., Eds.; G. Fischer Verlag: Stuttgart, Germany, 1991. [Google Scholar]
- Krammer, K.; Lange-Bertalot, H. Süsswasserflora von Mitteleuropa. Band 2/4. Bacillariophyceae. 4. Teil: Achnanthaceae Kritische Ergänzungen Zu Navicula (Lineolatae) Und Gomphonema; Ettl, H., Gerloff, J., Heynig, H., Mollenhauer, D., Eds.; G. Fischer Verlag: Stuttgart, Germany, 1991. [Google Scholar]
- Krammer, K.; Lange-Bertalot, H. Süsswasserflora von Mitteleuropa, Band 2/1: Bacillariophyceae 1. Teil: Naviculaceae; Ettl, H., Gerloff, J., Heynig, H., Mollenhauer, D., Eds.; G. Fischer Verlag: Stuttgart, Germany, 1986. [Google Scholar]
- Krammer, K.; Lange-Bertalot, H. Sübwasserflora von Mitteleuropa. Band 2/2. Bacillariophyceae. 2. Teil: Bacillariaceae, Epithemiaceae, Surirellaceae; Ettl, H., Gerloff, J., Heynig, H., Mollenhauer, D., Eds.; G. Fischer Verlag: Stuttgart, Germany, 1986. [Google Scholar]
- Lange-Bertalot, H.; Hofmann, G.; Werum, M.; Cantonati, M. Freshwater Benthic Diatoms of Central Europe: Over 800 Common Species Used in Ecological Assessment; Koeltz Botanical Books: Oberreifenberg, Germany, 2017. [Google Scholar]
- Vasselon, V.; Rimet, F.; Tapolczai, K.; Bouchez, A. Assessing Ecological Status with Diatoms DNA Metabarcoding: Scaling-up on a WFD Monitoring Network (Mayotte Island, France). Ecol. Indic. 2017, 82, 1–12. [Google Scholar] [CrossRef]
- Schloss, P.D.; Westcott, S.L.; Ryabin, T.; Hall, J.R.; Hartmann, M.; Hollister, E.B.; Lesniewski, R.A.; Oakley, B.B.; Parks, D.H.; Robinson, C.J.; et al. Introducing Mothur: Open-Source, Platform-Independent, Community-Supported Software for Describing and Comparing Microbial Communities. Appl. Environ. Microbiol. 2009, 75, 7537–7541. [Google Scholar] [CrossRef] [PubMed] [Green Version]
- Edgar, R.C.; Haas, B.J.; Clemente, J.C.; Quince, C.; Knight, R. UCHIME Improves Sensitivity and Speed of Chimera Detection. Bioinformatics 2011, 27, 2194–2200. [Google Scholar] [CrossRef] [Green Version]
- Rimet, F.; Gusev, E.; Kahlert, M.; Kelly, M.G.; Kulikovskiy, M.; Maltsev, Y.; Mann, D.G.; Pfannkuchen, M.; Trobajo, R.; Vasselon, V.; et al. Diat.Barcode, an Open-Access Curated Barcode Library for Diatoms. Sci. Rep. 2019, 9, 15116. [Google Scholar] [CrossRef] [PubMed] [Green Version]
- Vasselon, V.; Bouchez, A.; Rimet, F.; Jacquet, S.; Trobajo, R.; Corniquel, M.; Tapolczai, K.; Domaizon, I. Avoiding Quantification Bias in Metabarcoding: Application of a Cell Biovolume Correction Factor in Diatom Molecular Biomonitoring. Methods Ecol. Evol. 2018, 9, 1060–1069. [Google Scholar] [CrossRef] [Green Version]
- Lecointe, C.; Coste, M.; Prygiel, J. “Omnidia”: Software for Taxonomy, Calculation of Diatom Indices and Inventories Management. Hydrobiologia 1993, 269, 509–513. [Google Scholar] [CrossRef]
- Pinseel, E.; Vanormelingen, P.; Hamilton, P.B.; Vyverman, W.; Van de Vijver, B.; Kopalova, K. Molecular and Morphological Characterization of the Achnanthidium Minutissimum Complex (Bacillariophyta) in Petuniabukta (Spitsbergen, High Arctic) Including the Description of A. Digitatum sp. nov. Eur. J. Phycol. 2017, 52, 264–280. [Google Scholar] [CrossRef]
- Antoniades, D.; Hamilton, P.B.; Douglas, M.S.V.; Smol, J.P. Volume 17: Diatoms of North America: The Freshwater Floras of Prince Patrick, Ellef Ringnes and Northern Ellesmere Islands from the Canadian Arctic Archipelago; Iconographia Diatomologica. A.R.G.Gantner Verlag KG: Ruggell, Liechtenstein, 2008. [Google Scholar]
- Pla-Rabés, S.; Hamilton, P.B.; Ballesteros, E.; Gavrilo, M.; Friedlander, A.M.; Sala, E. The Structure and Diversity of Freshwater Diatom Assemblages from Franz Josef Land Archipelago: A Northern Outpost for Freshwater Diatoms. PeerJ 2016, 4, e1705. [Google Scholar] [CrossRef] [Green Version]
- Kermarrec, L.; Bouchez, A.; Rimet, F.; Humbert, J.-F. First Evidence of the Existence of Semi-Cryptic Species and of a Phylogeographic Structure in the Gomphonema Parvulum (Kützing) Kützing Complex (Bacillariophyta). Protist 2013, 164, 686–705. [Google Scholar] [CrossRef]
- Abarca, N.; Jahn, R.; Zimmermann, J.; Enke, N. Does the Cosmopolitan Diatom Gomphonema Parvulum (Kützing) Kützing Have a Biogeography? PLoS ONE 2014, 9, e86885. [Google Scholar] [CrossRef]
- Keck, F.; Vasselon, V.; Rimet, F.; Bouchez, A.; Kahlert, M. Boosting DNA Metabarcoding for Biomonitoring with Phylogenetic Estimation of Operational Taxonomic Units’ Ecological Profiles. Mol. Ecol. Resour. 2018, 18, 1299–1309. [Google Scholar] [CrossRef]
- Mann, D.G.; Evans, K.M. 13 Molecular Genetics and the Neglected Art of Diatomics. Unravelling Algae Past Present Future Algal Syst. 2007, 231. [Google Scholar] [CrossRef]
- Trobajo, R.; Mann, D.G.; Clavero, E.; Evans, K.M.; Vanormelingen, P.; McGregor, R.C. The Use of Partial Cox1, RbcL and LSU RDNA Sequences for Phylogenetics and Species Identification within the Nitzschia Palea Species Complex (Bacillariophyceae). Eur. J. Phycol. 2010, 45, 413–425. [Google Scholar] [CrossRef] [Green Version]
- Kahlert, M.; Kelly, M.G.; Mann, D.G.; Rimet, F.; Sato, S.; Bouchez, A.; Keck, F. Connecting the Morphological and Molecular Species Concepts to Facilitate Species Identification within the Genus Fragilaria (Bacillariophyta). J. Phycol. 2019, 55, 948–970. [Google Scholar] [CrossRef] [PubMed]
- Poulíčková, A.; Veselá, J.; Neustupa, J.; Škaloud, P. Pseudocryptic Diversity versus Cosmopolitanism in Diatoms: A Case Study on Navicula Cryptocephala Kütz. (Bacillariophyceae) and Morphologically Similar Taxa. Protist 2010, 161, 353–369. [Google Scholar] [CrossRef] [PubMed]
- Bailet, B.; Apothéloz-Perret-Gentil, L.; Baričević, A.; Chonova, T.; Franc, A.; Frigerio, J.-M.; Kelly, M.; Mora, D.; Pfannkuchen, M.; Proft, S.; et al. Diatom DNA Metabarcoding for Ecological Assessment: Comparison among Bioinformatics Pipelines Used in Six European Countries Reveals the Need for Standardization. Sci. Total Environ. 2020, 745, 140948. [Google Scholar] [CrossRef]
- Zgrundo, A.; Lemke, P.; Pniewski, F.; Cox, E.J.; Latała, A. Morphological and Molecular Phylogenetic Studies on Fistulifera Saprophila. Diatom Res. 2013, 28, 431–443. [Google Scholar] [CrossRef]
- Moss, B. Water Pollution by Agriculture. Philos. Trans. R. Soc. B Biol. Sci. 2008, 363, 659–666. [Google Scholar] [CrossRef] [Green Version]
- Moss, B.; Jeppesen, E.; Søndergaard, M.; Lauridsen, T.L.; Liu, Z. Nitrogen, Macrophytes, Shallow Lakes and Nutrient Limitation: Resolution of a Current Controversy? Hydrobiologia 2013, 710, 3–21. [Google Scholar] [CrossRef]
- Alba Tercedor, J.; Jáimez-Cuéllar, P.; Álvarez, M.; Avilés, J.; Bonada i Caparrós, N.; Casas, J.; Mellado, A.; Ortega, M.; Pardo, I.; Prat i Fornells, N.; et al. Caracterización Del Estado Ecológico de Ríos Mediterráneos Ibéricos Mediante El Índice IBMWP (Antes BMWP’). Limnetica 2002, 21, 175–185. [Google Scholar]
- Tapolczai, K.; Keck, F.; Bouchez, A.; Rimet, F.; Kahlert, M.; Vasselon, V. Diatom DNA Metabarcoding for Biomonitoring: Strategies to Avoid Major Taxonomical and Bioinformatical Biases Limiting Molecular Indices Capacities. Front. Ecol. Evol. 2019, 7, 409. [Google Scholar] [CrossRef] [Green Version]
- Apothéloz-Perret-Gentil, L.; Bouchez, A.; Cordier, T.; Cordonier, A.; Guéguen, J.; Rimet, F.; Vasselon, V.; Pawlowski, J. Monitoring the Ecological Status of Rivers with Diatom EDNA Metabarcoding: A Comparison of Taxonomic Markers and Analytical Approaches for the Inference of a Molecular Diatom Index. Mol. Ecol. 2020. [Google Scholar] [CrossRef]
Figure 1.
Study area showing the location of the 22 studied ponds in the Duero River basin (NW Spain).
Figure 1.
Study area showing the location of the 22 studied ponds in the Duero River basin (NW Spain).

Figure 2.
Venn diagram comparing similarities and differences between inventories obtained by microscopy (LM, light grey circle) and metabarcoding (HTS, dark grey circle) analysis. (Absolute number are number of species).
Figure 2.
Venn diagram comparing similarities and differences between inventories obtained by microscopy (LM, light grey circle) and metabarcoding (HTS, dark grey circle) analysis. (Absolute number are number of species).

Figure 3.
Relationship between the relative abundances obtained with microscopy (LM) and molecular (HTS) methods for the dominant taxa: Achnanthidium minutissimum (ADMI), Eunotia bilunaris (EBLU), Fragilaria tenera (FTEN) and Ulnaria acus (UACU) (note the log scales).
Figure 3.
Relationship between the relative abundances obtained with microscopy (LM) and molecular (HTS) methods for the dominant taxa: Achnanthidium minutissimum (ADMI), Eunotia bilunaris (EBLU), Fragilaria tenera (FTEN) and Ulnaria acus (UACU) (note the log scales).

Figure 4.
Proportion of the quality classes detected by both methods, morphological and molecular.

Figure 5.
Correlation between Trophic Diatom Index (TDI) calculated morphological (LM) and molecular (HTS) methods, (A) before and (B) after applying correction factor. The grey bands represent 95% confidence intervals.
Figure 5.
Correlation between Trophic Diatom Index (TDI) calculated morphological (LM) and molecular (HTS) methods, (A) before and (B) after applying correction factor. The grey bands represent 95% confidence intervals.

Figure 6.
Correlation between Trophic Diatom Index (TDI) calculated from morphological (LM) and molecular (HTS) methods and (A,B) TP (µg L−1) and (C,D) TN (mg L−1). The grey bands are 95% confidence intervals.
Figure 6.
Correlation between Trophic Diatom Index (TDI) calculated from morphological (LM) and molecular (HTS) methods and (A,B) TP (µg L−1) and (C,D) TN (mg L−1). The grey bands are 95% confidence intervals.


Table 1.
Ponds sampled in the Duero River Basin, NW Spain, including code, name, geographical coordinates, area, elevation (m above sea level (ASL)).
Table 1.
Ponds sampled in the Duero River Basin, NW Spain, including code, name, geographical coordinates, area, elevation (m above sea level (ASL)).
| Pond | Code | UTM Zone | UTM N | UTM E | Area (Ha) | Elevation (m ASL) |
|---|---|---|---|---|---|---|
| Linos | LO1 | 30T | 4,685,289.29 | 309,108.76 | 0.69 | 843 |
| Grande | LO2 | 30T | 4,685,301.76 | 308,728.38 | 3.79 | 840 |
| Cifuentes 2 | LO3 | 30T | 4,683,329.74 | 308,606.01 | 0.44 | 841 |
| Cifuentes 1 | LO4 | 30T | 4,683,839.42 | 308,643.42 | 0.69 | 841 |
| La Raya | LO5 | 30T | 4,684,646.4 | 308,709.17 | 0.36 | 842 |
| Amor | LO6 | 30T | 4,682,078.48 | 310,393.97 | 1.21 | 829 |
| Valdecastillo 1 | LO7 | 30T | 4,683,488.1 | 310,502.12 | 0.78 | 829 |
| Valdecastillo 2 | LO8 | 30T | 4,683,321.89 | 310,363.43 | 0.44 | 829 |
| Adobes | LO9 | 30T | 4,686,327.06 | 309,039.06 | 2.14 | 845 |
| Seca | LO10 | 30T | 4,697,167.00 | 308,657.00 | 3.78 | 831 |
| SantasMartas | LO11 | 30T | 4,701,107.00 | 305,033.00 | 0.03 | 834 |
| Mayor | LP1 | 30T | 4,706,991.32 | 316,586.61 | 3.78 | 898 |
| Diel | LP2 | 30T | 4,710,657.68 | 313,622.79 | 1.75 | 889 |
| Cantos | LP3 | 30T | 4,711,368.47 | 315,523.73 | 1.56 | 907 |
| Trigo | LP4 | 30T | 4,712,540.36 | 319,786.92 | 1.10 | 930 |
| Gente | LP5 | 30T | 4,714,890.29 | 317,344.56 | 0.96 | 922 |
| Villaverde | LP6 | 30T | 4,716,025.62 | 320,422.88 | 0.76 | 946 |
| Sentiz | LP7 | 30T | 4,713,904.81 | 318,812.00 | 4.79 | 922 |
| Estorrubio | LP8 | 30T | 4,703,798.94 | 318,434.81 | 0.95 | 895 |
| Redos | LP9 | 30T | 4,704,938.79 | 317,450.21 | 0.95 | 895 |
| Manzana | LP10 | 30T | 4,699,206.44 | 317,237.03 | 0.95 | 879 |
| Carrillón | LP11 | 30T | 4,702,315.00 | 308,237.00 | 0.99 | 844 |
Table 2.
Comparison of relative abundances of dominant diatom taxa assesses by LM and HTS methods in the studied ponds. Diatom species are codified by OMNIDIA codes: Achananthidium minutissimum (ADMI), Achnanthidium sp. (ACHD), Fragilaria tenera (FTEN), Ulnaria acus (UACU), Eunotia bilunaris (EBLU), Gomphonema exilissimum (GEXL), Nitzschia gracilis (NIGR), Nitzschia paleacea (NPAE), Nitzschia paleacea var. debilis (NPAD), Gomphonema parvulum (GPAR), Fragilaria sp (FRAG), Gomphonema saprophilum (GSPP), Nitzschia palea (NPAL), Gomphonema affine (GAFF), Fragilaria nanoides (FNNO), Nitzschia pusilla (NIPU), Nitzschia acidoclinata (NACD), Fragilaria gracilis (FGRA).
| SPECIES | LM | HTS | SPECIES | HTS | LM |
|---|---|---|---|---|---|
| ADMI | 19.66 | 41.98 | ADMI | 41.98 | 19.66 |
| ACHD | 10.96 | 0.26 | UACU | 10.73 | 8.68 |
| FTEN | 9.05 | 0.00 | FRAG | 7.54 | 0.13 |
| UACU | 8.68 | 10.73 | GSPP | 7.41 | 0.00 |
| EBLU | 7.59 | 1.46 | NPAL | 5.90 | 0.46 |
| GEXL | 7.24 | 0.00 | GAFF | 4.07 | 0.00 |
| NIGR | 6.82 | 0.01 | FNNO | 3.97 | 0.00 |
| NPAE | 6.16 | 0.49 | NIPU | 2.46 | 0.00 |
| NPAD | 5.04 | 0.00 | NACD | 2.24 | 0.02 |
| GPAR | 1.78 | 0.00 | FGRA | 1.50 | 0.00 |
Table 3.
Comparison between trophic status classes of morphological (LM) and molecular-based (HTS) inventories.
Table 3.
Comparison between trophic status classes of morphological (LM) and molecular-based (HTS) inventories.
| HTS | LM | ||||
| Poor | Moderate | Good | High | ||
| Poor | 1 | 0 | 0 | 0 | |
| Moderate | 1 | 11 | 6 | 0 | |
| Good | 0 | 1 | 1 | 1 | |
| High | 0 | 0 | 0 | 0 | |
Publisher’s Note: MDPI stays neutral with regard to jurisdictional claims in published maps and institutional affiliations. |
© 2021 by the authors. Licensee MDPI, Basel, Switzerland. This article is an open access article distributed under the terms and conditions of the Creative Commons Attribution (CC BY) license (https://creativecommons.org/licenses/by/4.0/).
Share and Cite
MDPI and ACS Style
Borrego-Ramos, M.; Bécares, E.; García, P.; Nistal, A.; Blanco, S. Epiphytic Diatom-Based Biomonitoring in Mediterranean Ponds: Traditional Microscopy versus Metabarcoding Approaches. Water 2021, 13, 1351. https://doi.org/10.3390/w13101351
AMA Style
Borrego-Ramos M, Bécares E, García P, Nistal A, Blanco S. Epiphytic Diatom-Based Biomonitoring in Mediterranean Ponds: Traditional Microscopy versus Metabarcoding Approaches. Water. 2021; 13(10):1351. https://doi.org/10.3390/w13101351
Chicago/Turabian StyleBorrego-Ramos, María, Eloy Bécares, Pedro García, Alejandro Nistal, and Saúl Blanco. 2021. "Epiphytic Diatom-Based Biomonitoring in Mediterranean Ponds: Traditional Microscopy versus Metabarcoding Approaches" Water 13, no. 10: 1351. https://doi.org/10.3390/w13101351
Note that from the first issue of 2016, this journal uses article numbers instead of page numbers. See further details here.