
Suggested Sampling Methodology for Lake Benthic Macroinvertebrates under the Requirements of the European Water Framework Directive


Department of Zoology, School of Biology, Aristotle University of Thessaloniki, 54124 Thessaloniki, Greece
*
Author to whom correspondence should be addressed.
Water 2021, 13(10), 1353; https://doi.org/10.3390/w13101353
Submission received: 23 March 2021
/
Revised: 26 April 2021
/
Accepted: 10 May 2021
/
Published: 13 May 2021
(This article belongs to the Special Issue The WFD 20 Years After—Ecological Status Assessment and Restoration of Aquatic Ecosystems)
Abstract
:The estimation of the number of samples required for reliably monitoring lakes’ benthic macroinvertebrates is difficult due to the natural variability and cost and time constraints. To determine a statistically robust and effective sampling design, we collected benthic macroinvertebrate samples from 15 Greek natural lakes. We compared the spatial and temporal variability of the benthic macroinvertebrate community composition to identify differences among lakes, between lake zones (sublittoral and profundal) and sampling periods. Furthermore, we examined the sampling precision and determined the number of required samples to attain maximum taxa richness. The diminution of the sampling effort was estimated and the desired precision level, considering different benthic macroinvertebrate abundances, was modelled. No temporal or spatial variation between lake zones was observed in communities’ compositions. The precision of our sampling design was adequate, and rarefaction curves revealed an adequate taxa richness (>70%). The developed model could be applied to assess the required sampling effort in lakes within the Mediterranean ecoregion with similar benthic macroinvertebrate abundances.
1. Introduction
The implementation of the European Water Framework Directive (WFD) [1] requires the use of different Biological Quality Elements (BQEs), including phytoplankton, macrophytes, fish, phytobenthos, and benthic macroinvertebrates, to assess the ecological quality of surface water bodies. Among these, benthic macroinvertebrates have been widely used as biological indicators for more than a century, as they meet the requirements of an effective ecological indicator due to their ability to respond to different pressures by changing their abundance, taxonomic richness, community composition, and biological traits [2]. These responses should be included and monitored in the framework of monitoring programs implemented by all European Member States (MSs). To fulfill the WFD objectives, the sampling effort to acquire biological data should be sufficient and feasible. Particularly, the number of samples should be representative and precise [3]; otherwise, it may influence the biomonitoring results. Thus, a sampling campaign needs to be designed with additional requirements for evaluating uncertainty [3]. At the same time, it should be cost and time effective [4].
Lake monitoring efforts usually focus on how benthic communities respond to different stressors in different lake zones [5]. The outcome could further use to develop ecological quality indices (i.e., [6,7,8,9,10]). Thus, monitoring assessment tools based on littoral benthic fauna is mainly related to the impacts of anthropogenic shoreline alterations (e.g., [6,7,8]), whereas sublittoral and profundal benthos is related to eutrophication (e.g., [5,9,10]). The developed indices are mainly expressed in numerical terms via metrics derived from raw abundance data [11] or encompassing, directly or indirectly, taxa richness [12]. Even if the sampling error is minimized as the number of samples increases, these indices display sample dependency [13]. The number of samples depends on having an appropriate spatial sampling scale and adequate sample size [13]. In biomonitoring programs, though, assessing the benthic macroinvertebrate sampling effort is often neglected [12].
The design of a sampling campaign should overcome the spatial and temporal variation in benthic macroinvertebrate community composition [14,15,16,17,18] that is affected by, among other factors, pollution and habitat characteristics, such as the water depth and substratum type [19,20]. Conventionally, lake benthic macroinvertebrate communities can differ among habitats and sites within or among lakes [19]. Moreover, several studies have shown that the number of sampling sites reflects the habitat heterogeneity and the cost and time constraints included in the sampling effort (e.g., [4,11,15]). An increase in the number of samples is usually associated with a low standard error and high sampling precision [21]. Studies based on only a few sites may fail to estimate the species distribution variability [13,16,22] and dissimilarities in assemblages [23]. Ideally, to achieve an accurate dataset, an appropriate number of sites should be sampled, which, in most cases, is high. In practice, this cannot be achieved as most of the routine monitoring programs are constrained in terms of time and budget regarding field sample collection and taxonomical processing of macroinvertebrates. An optimal sampling design should fit within such restrictions [24], as inadequate sampling is likely to lead to an invalid and low quality assessment and subsequent incorrect or limited management measures [12].
Several statistical approaches have been applied so far to estimate an adequate sampling effort [4]. Generally, a sufficient number of samples depends on the mean abundance, the degree of aggregation, and the desired precision [25]. The degree of aggregation, per se, further depends on the size of the sampler [26]. In the case of any sampler, the number of replicates affects the accuracy and precision of the statistics [25]. Three replicates are usually considered the minimum sample size to perform statistical analysis [27]. Taylor’s law has been widely applied to optimize the sampling design and statistical interpretation of population data [28,29], using a power function between variance and mean data [26,30,31].
To the best of our knowledge, studies on the assessment of the optimal sampling effort of benthic macroinvertebrates in lakes, from the perspective of the WFD, have been narrowed in the Northern and Central Baltic ecoregions, with their majority focusing on the littoral benthic macroinvertebrates (e.g., [13,15,25]). Considering the natural Greek lakes, such research is entirely lacking for all the BQEs, apart from fish [32]. Thus, in the present study, we developed a model to estimate the optimal sampling effort required for routine monitoring of benthic macroinvertebrates in 15 natural lakes under the requirements of the WFD. We evaluated the minimum number of samples for the desired level of precision concerning a given benthic abundance. The precision and the sampling effort of benthic assemblages were examined in the sublittoral and profundal zones as well as in both zones simultaneously. Since the selected natural lakes represent the most frequent lake types present in Greece and also in most Mediterranean countries, the constructed model could (a) be further applied within the ecoregion’s lakes with similar mean benthic macroinvertebrate abundances and a desirable precision level and (b) contribute to the establishment of routine monitoring programs in compliance with the objectives of the WFD.
2. Materials and Methods
2.1. Study Area
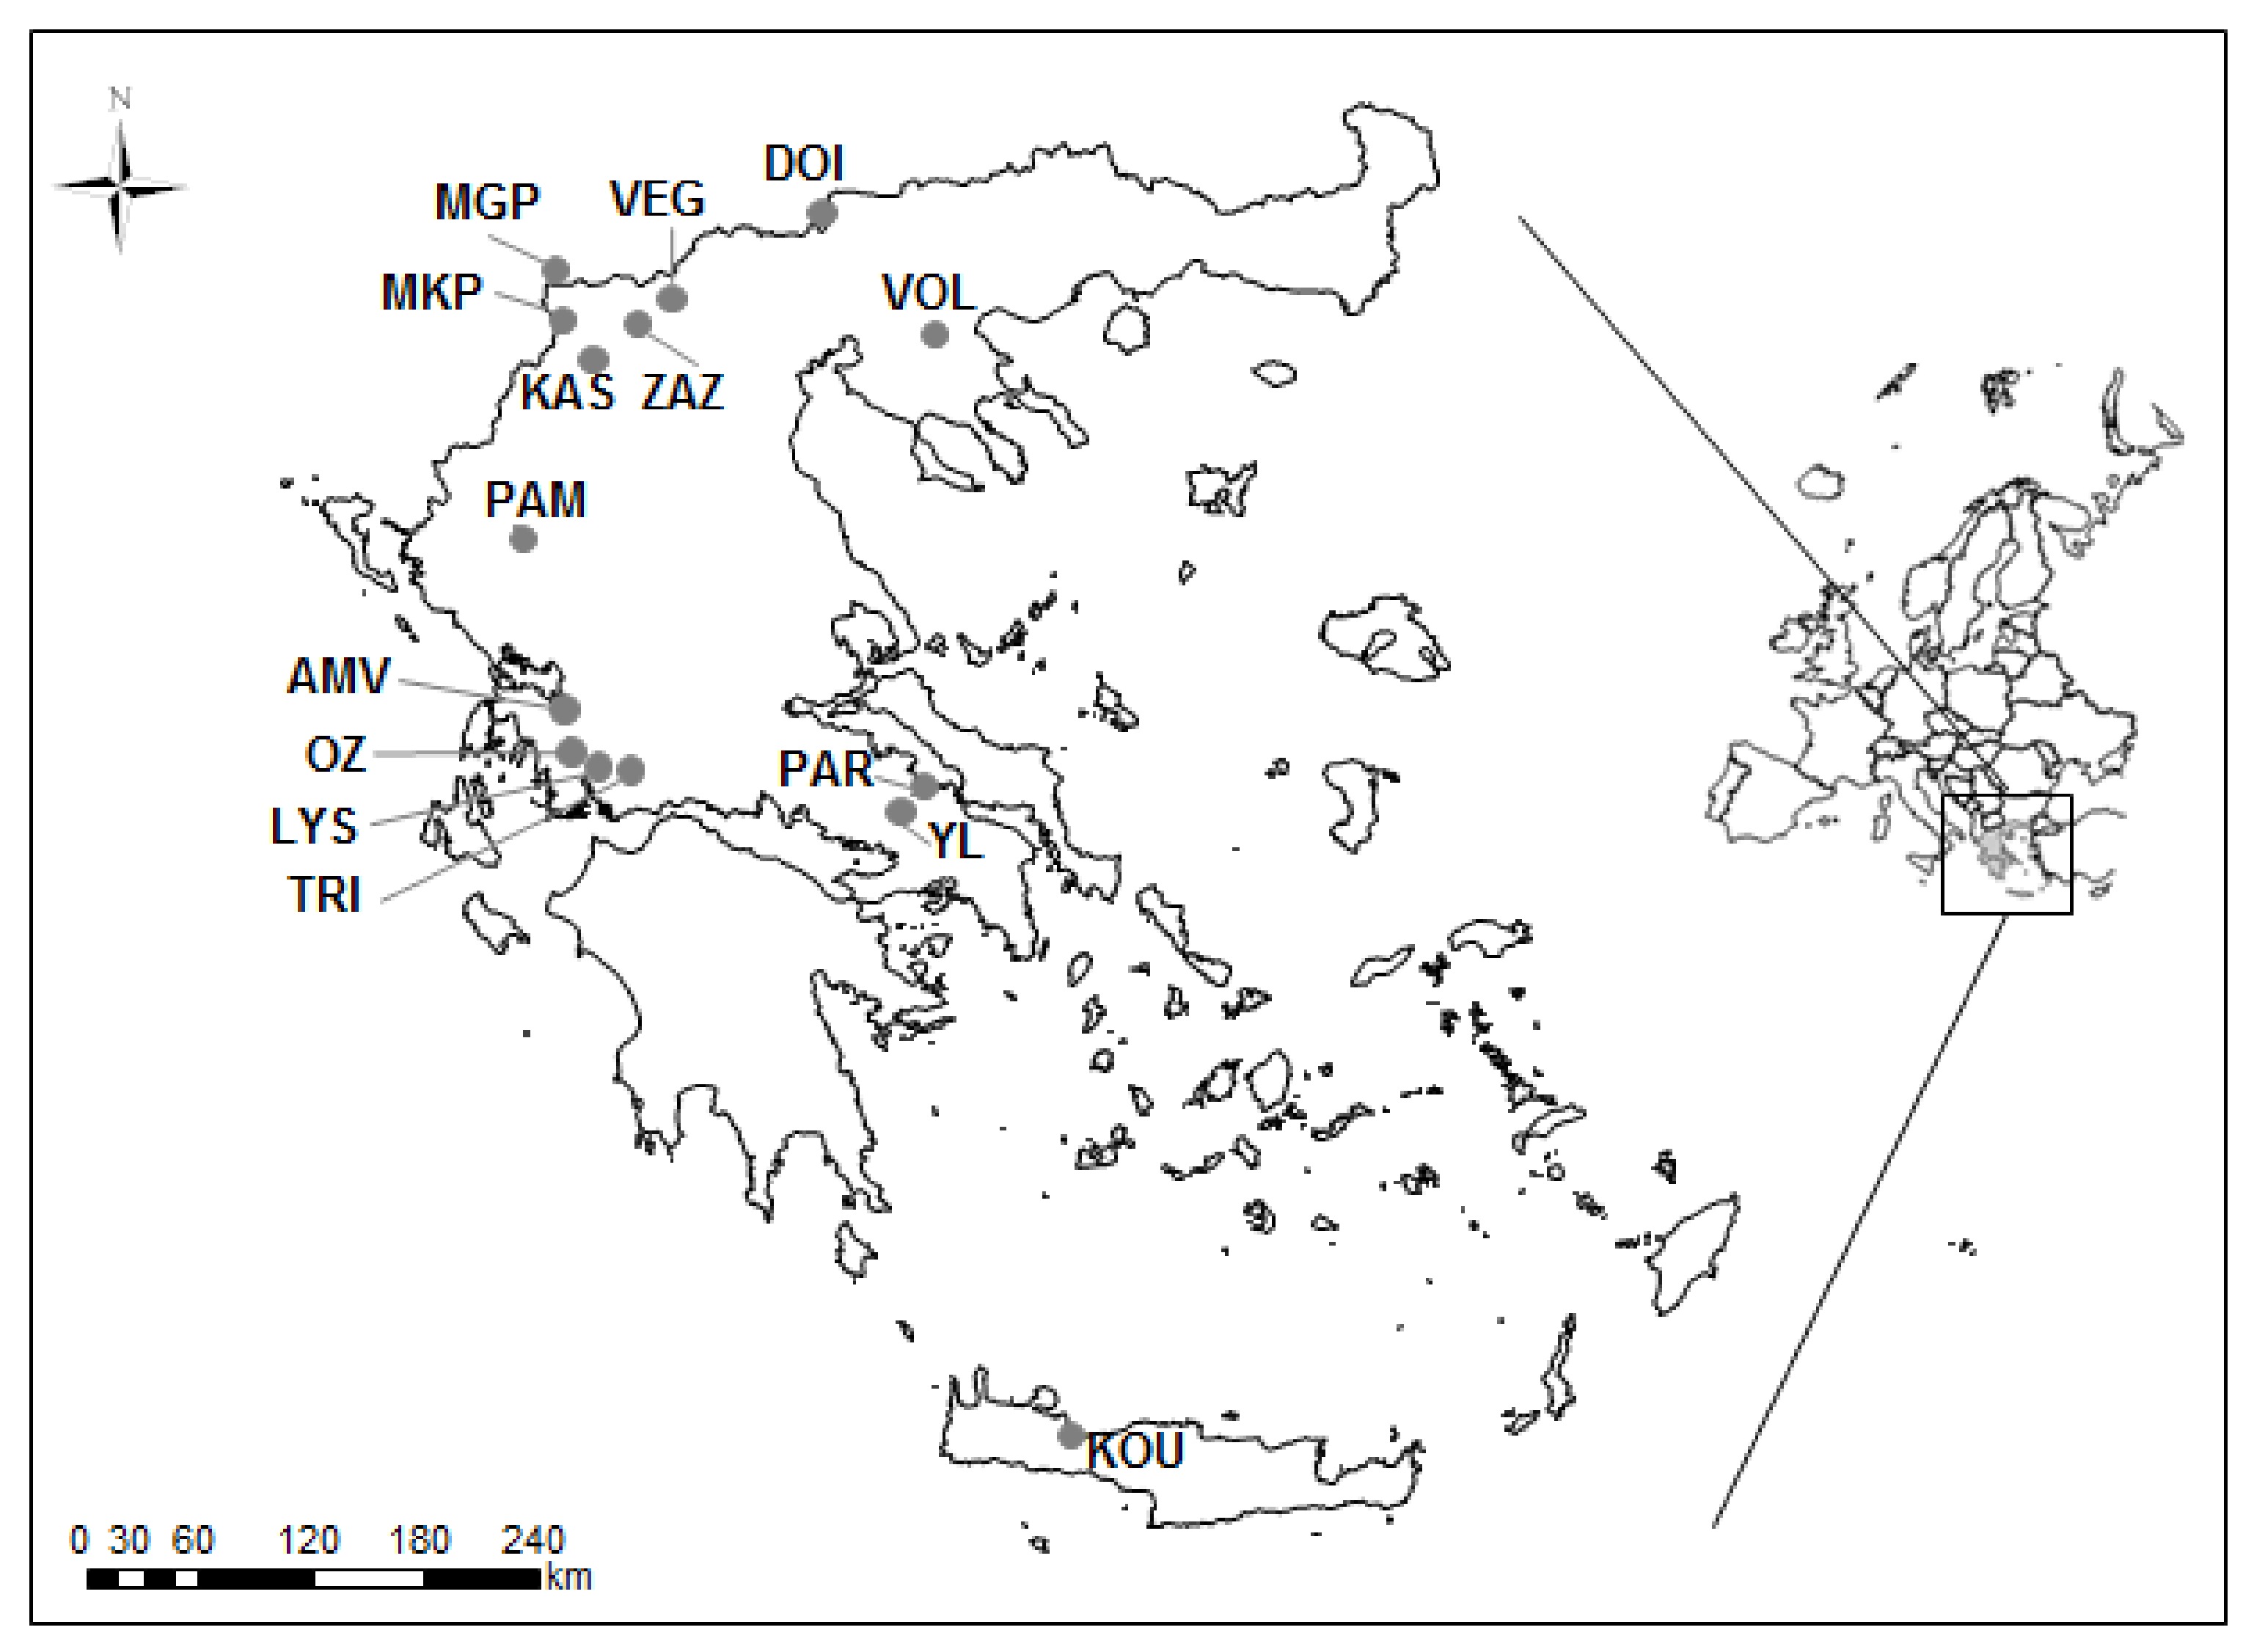
The Greek National Monitoring Network comprises 24 natural lakes (lake area > 0.5 km2). Among them, we collected benthic macroinvertebrate samples from 15 lakes (63% of the total number) (Figure 1); three of them are transboundary (Doirani, Megali Prespa, Mikri Prespa). We examined two types of natural lakes according to the Hellenic typology [33]: GR-SNL—shallow natural lakes (mean depth: 3–9 m, n = 8, 100% of the total number) and GR-DNL—deep natural lakes (mean depth >9 m, n = 7, 100% of the total number), which are located at altitudes ranging from 16 to 853 m.a.s.l. and differ in their limnological characteristics (Table 1). The total phosphorus concentrations varied among lakes, ranging from 7 μg/L in Lake Kourna to 670 μg/L in Lake Zazari (Table 1). Regarding land uses in their catchment area (Corine Land Cover 2018), artificial surfaces cover generally in low percentages the catchment, while agricultural areas seemed to be the major cover in many lakes (Table 1).
2.2. Sampling Design and Sample Processing
An adequate inventory for monitoring benthic macroinvertebrates in lakes requires biannual samplings [35]. Thus, we initially sampled in the mid-spring of 2014, before the monomictic lakes underwent the summer thermal stratification [35]. This sampling period is also recommended by the National Monitoring Program [36]. Additional samplings were conducted in autumn, when a lower water level was recorded due to intense evaporation [37,38,39]. Generally, it is suggested that winter samplings should be avoided to prevent sampling under extreme conditions [40]. In each lake, the soft sediments from the sublittoral and profundal zones were sampled using an Ekman-Birge grab (sampled area 225 cm2), suitable for sampling both shallow and deep water bodies [41]. Three replicates were collected at each site to provide a measure of site variability [35]. The sampled substrate was composed of clay, silt, or sand fractions. The number of sampling sites was dependent on the maximum depth and each lake’s specific characteristics (e.g., slope, substrate), following a constant sampling strategy from the sublittoral (i.e., started at depth > 2 m and extended until macrophyte growth is not possible anymore and the profundal zone starts) and profundal zones (Table 2).
Sediment samples were sieved with a 500 μm sieve. All benthic macroinvertebrates were sorted and identified at the lowest possible taxonomic level (genus or species); taxa abundances are expressed as ind/m2. Samples from the profundal and sublittoral zones were kept separate, and the mean abundance of the two sampling periods was calculated per lake zone.
2.3. Spatial and Temporal Variability
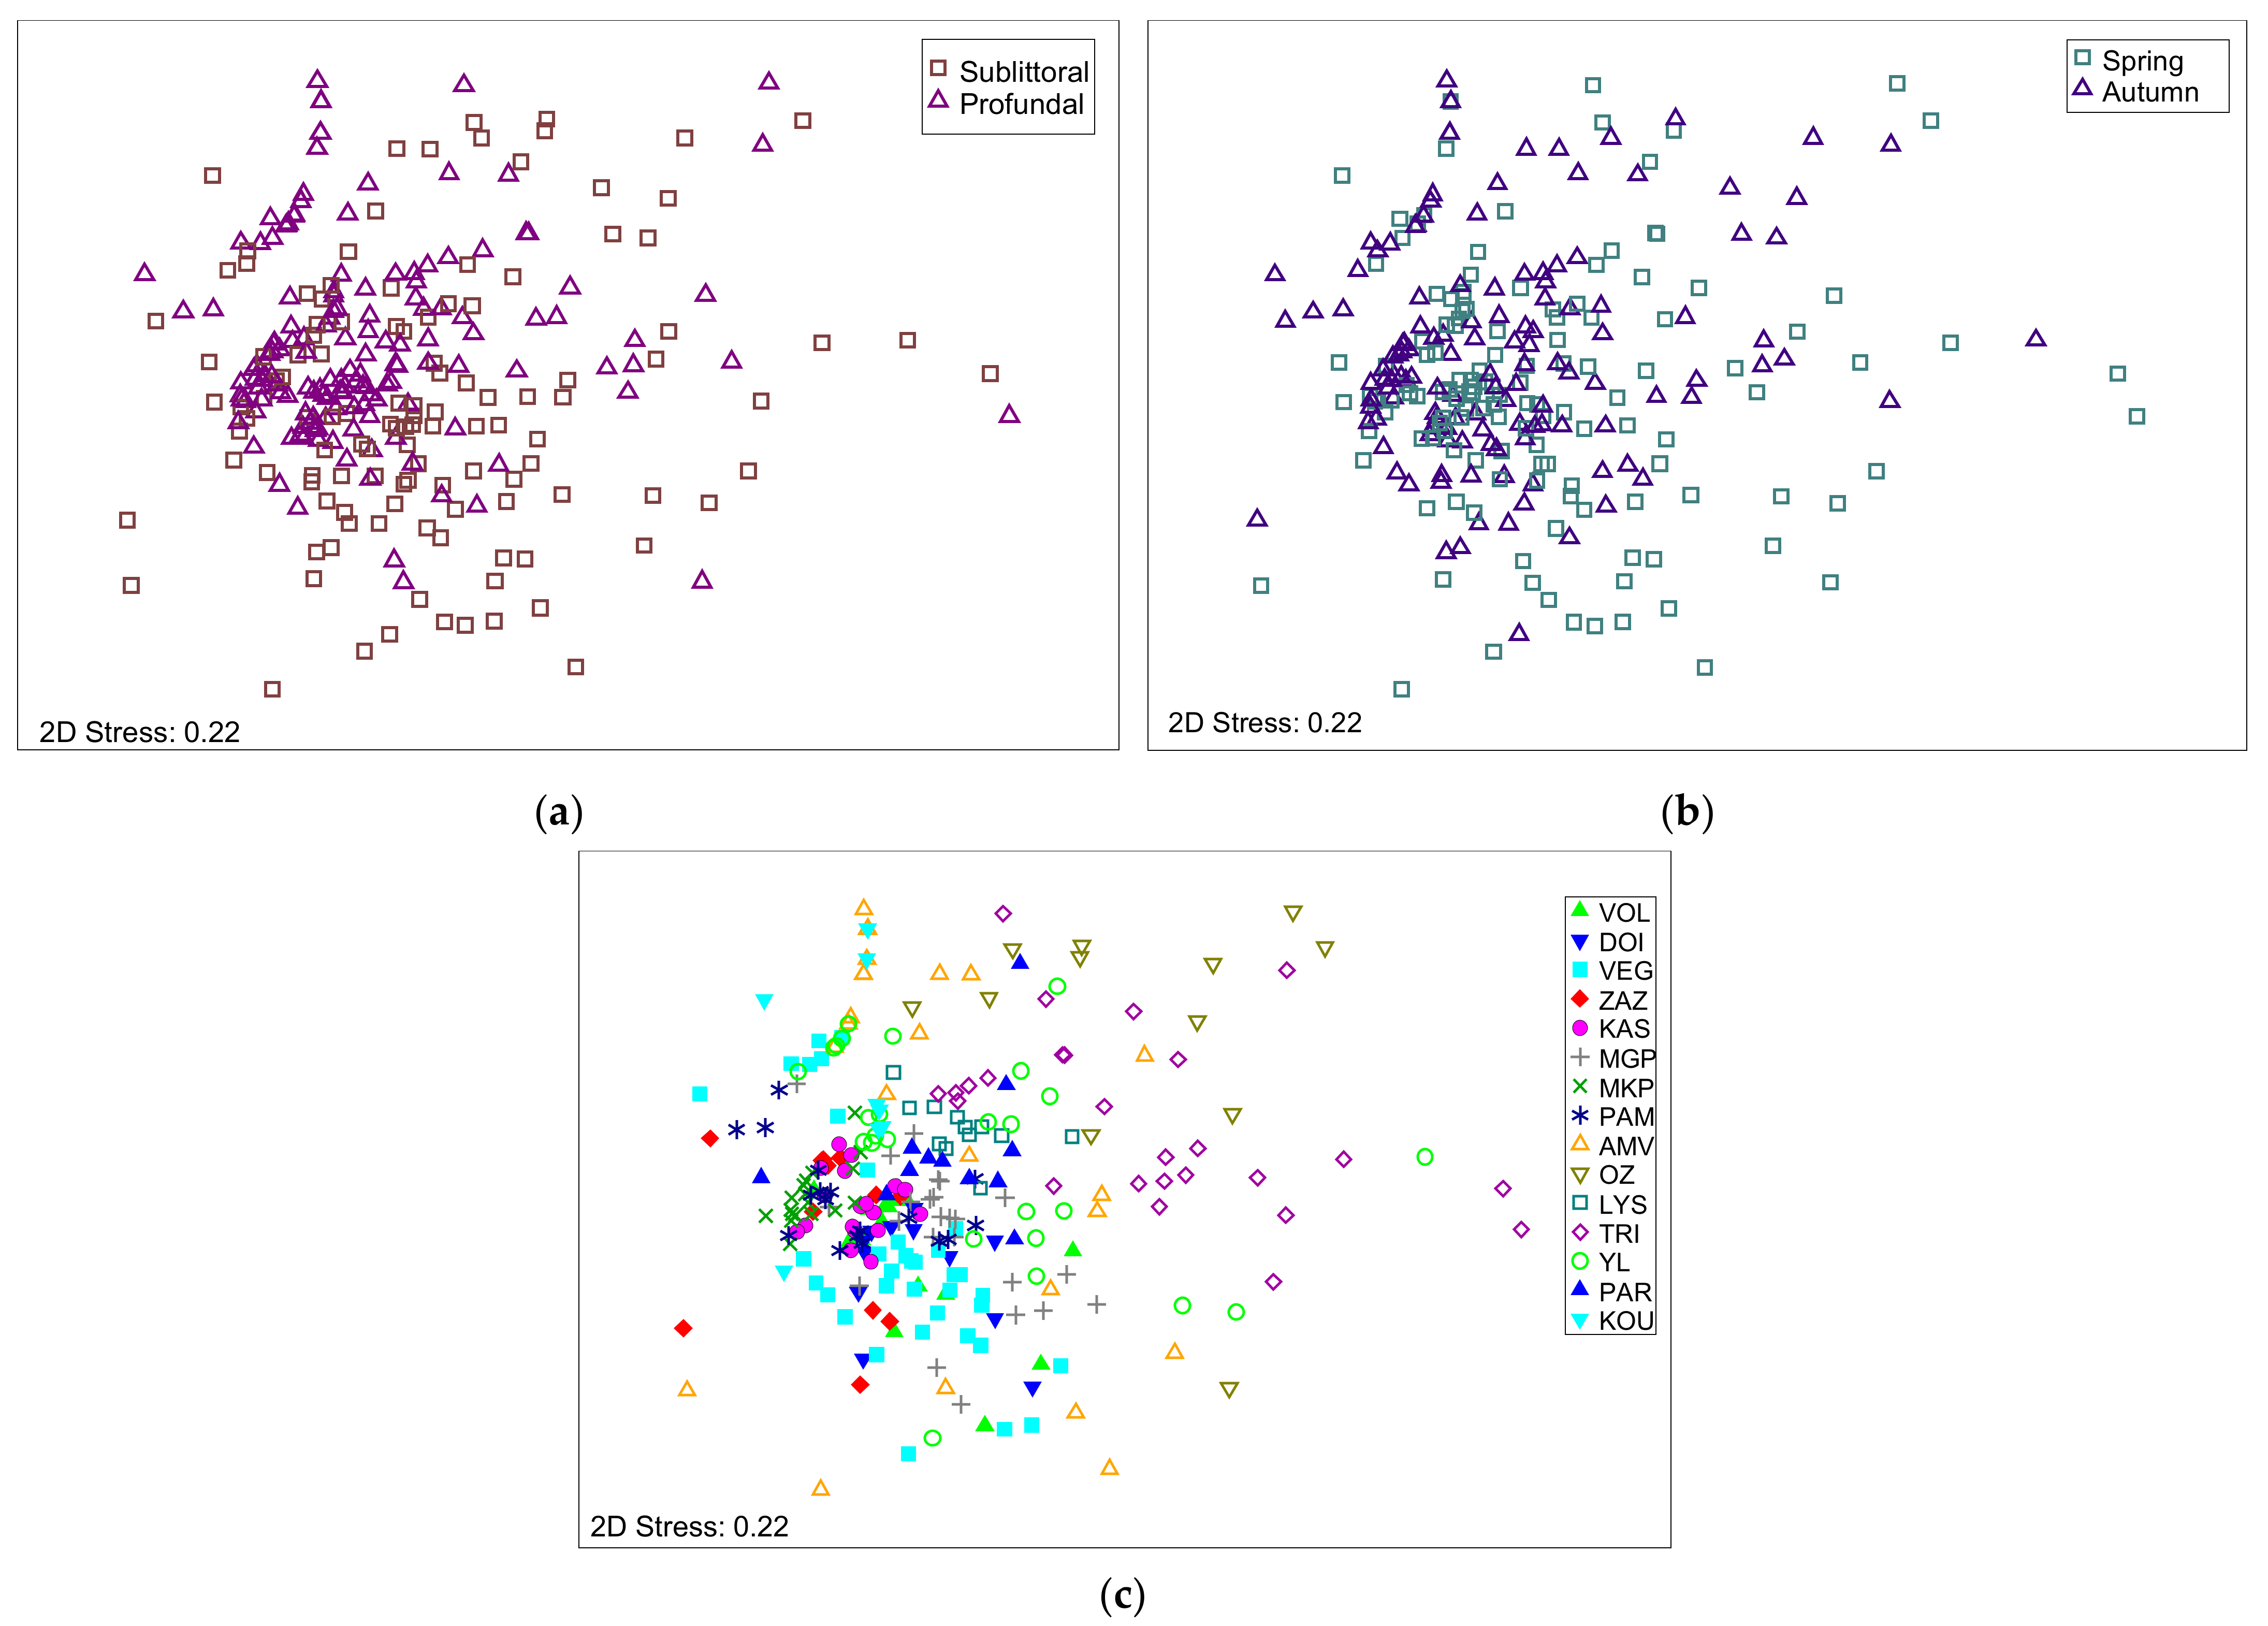
Non-metric multidimensional scaling (MDS, PRIMER, Version 6, PRIMER-E Ltd, Plymouth, UK) [42] was applied to visualize similarities in benthic macroinvertebrate community structures between lake zones (sublittoral and profundal), sampling periods (spring and autumn), and among lakes. A one-way analysis of similarities (ANOSIM, PRIMER, Version 6, PRIMER-E Ltd, Plymouth, UK) [42] was performed to identify significant differences in the macroinvertebrate community composition between lake zones, sampling periods and among lakes using 9999 permutations. In this analysis, high R values (>0.75) indicate that groups are well separated from each other, whereas low values (R < 0.25) imply little or non-existing differences between groups [43]. All of the above analyses were based on a Bray–Curtis similarity matrix of log(x + 1) transformed abundance data.
The mean abundances of benthic macroinvertebrates for each zone and sampling period were tested for normality using a Shapiro–Wilk test (SPSS version 21, IBM Corp., Armonk, USA). As this assumption was not met, the non-parametric Kruskal–Wallis test was applied to examine the differences between lake zones and sampling periods (SPSS version 21, IBM Corp., Armonk, USA). When the above statistical tests indicated no significant differences, all further analyses were performed on data from the combination of sublittoral and profundal zones, hereafter referred to as sublittoral/profundal zone.
2.4. Precision
The level of precision was estimated using the following equation [44,45]:
where se is the standard error of the abundance of benthic macroinvertebrates and mean is the mean abundance (ind/m2) of benthic macroinvertebrates.
A bootstrapping analysis was applied to assess the effect of the sampling effort on the precision (P) of benthic macroinvertebrates in the sublittoral/profundal zone. The mean values of the observed data were generated (1000 replacements) under an increasing sampling effort (ranging from two up to the maximum number of samples) using the R-studio package sciplot [46].
2.5. Adequacy of the Sampling Effort
Sample-based rarefaction curves were generated to estimate the adequacy of the sampling effort by randomly subsampling the entire community 1000 times to figure out the number of taxa as a function of the sample size [47]. Additionally, the expected total taxa richness for each lake was estimated using the first-order Jackknife estimator, as it is considered appropriate for abundance data [48]. The above analyses were performed using the statistical software EstimateS 9.1.0 (Colwell, http://purl.oclc.org/estimates, accessed on 9 May 2021) [47].
2.6. Modelling
The optimal sampling design was estimated as a function of the mean abundance of benthic macroinvertebrates and the desired precision level [44]:
where n is the number of samples, s2 is the sample variance, mean is the mean abundance of benthic macroinvertebrates per lake, and P is the precision.
The model was generated by combining Taylor’s power law [28] with a precision-based estimate of the essential number of samples. Taylor’s power law estimates the variance (s2)–mean (m) relationship, based on the equation:
Data that failed to meet the following criteria were excluded from the analysis: estimates of mean and variance based on less than 15 samples (N < 15), regression based on less than five sample pairs (M < 5), and a range of the log(mean) values less than one [49,50]. Parameters a and b were estimated after the log-transformation of Equation (3):
The b values, which represent the slope of the regression, are referred to as an index of the aggregation [29], where b > 1 represents an aggregated population, b = 1 indicates a random distribution, and b < 1 indicates a uniform distribution. Equation (4) was untransformed and corrected for bias [51]:
where MSE is the mean square error of the regression.
The number of samples required for a desired level of precision can be estimated by combining Equations (2) and (5):
3. Results
3.1. Taxa Richness
In total, 93 taxa were recorded from all lakes, with a mean (±SE) of 20.20 (±2.32) taxa per lake. The highest number of taxa (36 taxa) was observed in Lake Vegoritis and the lowest (seven taxa) in Lake Kourna (Figure 2a). In all lakes, apart from Lake Mikri Prespa, the sublittoral zone contributed to the total taxa richness with one to 22 taxa (Figure 2a). The lowest mean abundance (72 ind/m2) was recorded in the profundal zone of Lake Amvrakia and the highest (8274 ind/m2) in the profundal zone of Lake Kastoria. A detailed taxa list is given by Ntislidou et al. [10]. The most abundant family was Chironomidae (27 species), followed by Tubificidae (24 species). Potamothrix hammoniensis (Michaelsen, 1901) and Chironomus gr. plumosus (Linnaeus, 1758) were the most frequently recorded species (87% and 73.3%, respectively).
3.2. Spatial and Temporal Variability
The MDS analysis revealed no spatial or temporal differences between lake zones concerning macroinvertebrate community composition (Figure 3a,b). The ANOSIM comparing the benthic fauna of lake zones (sublittoral and profundal) and seasons (spring and autumn) showed that R values were relatively low (R = 0.15 and R = 0.02, respectively). Among lakes, benthic macroinvertebrate community composition differed (R = 0.45, Figure 3c). Beyond these analyses, the Kruskal–Wallis test showed no statistically significant differences in benthic macroinvertebrate communities between lake zones (p = 0.852) or sampling periods (p = 0.375). Such outcomes indicate that an optimal sampling effort would combine both sublittoral and profundal zones.
3.3. Precision
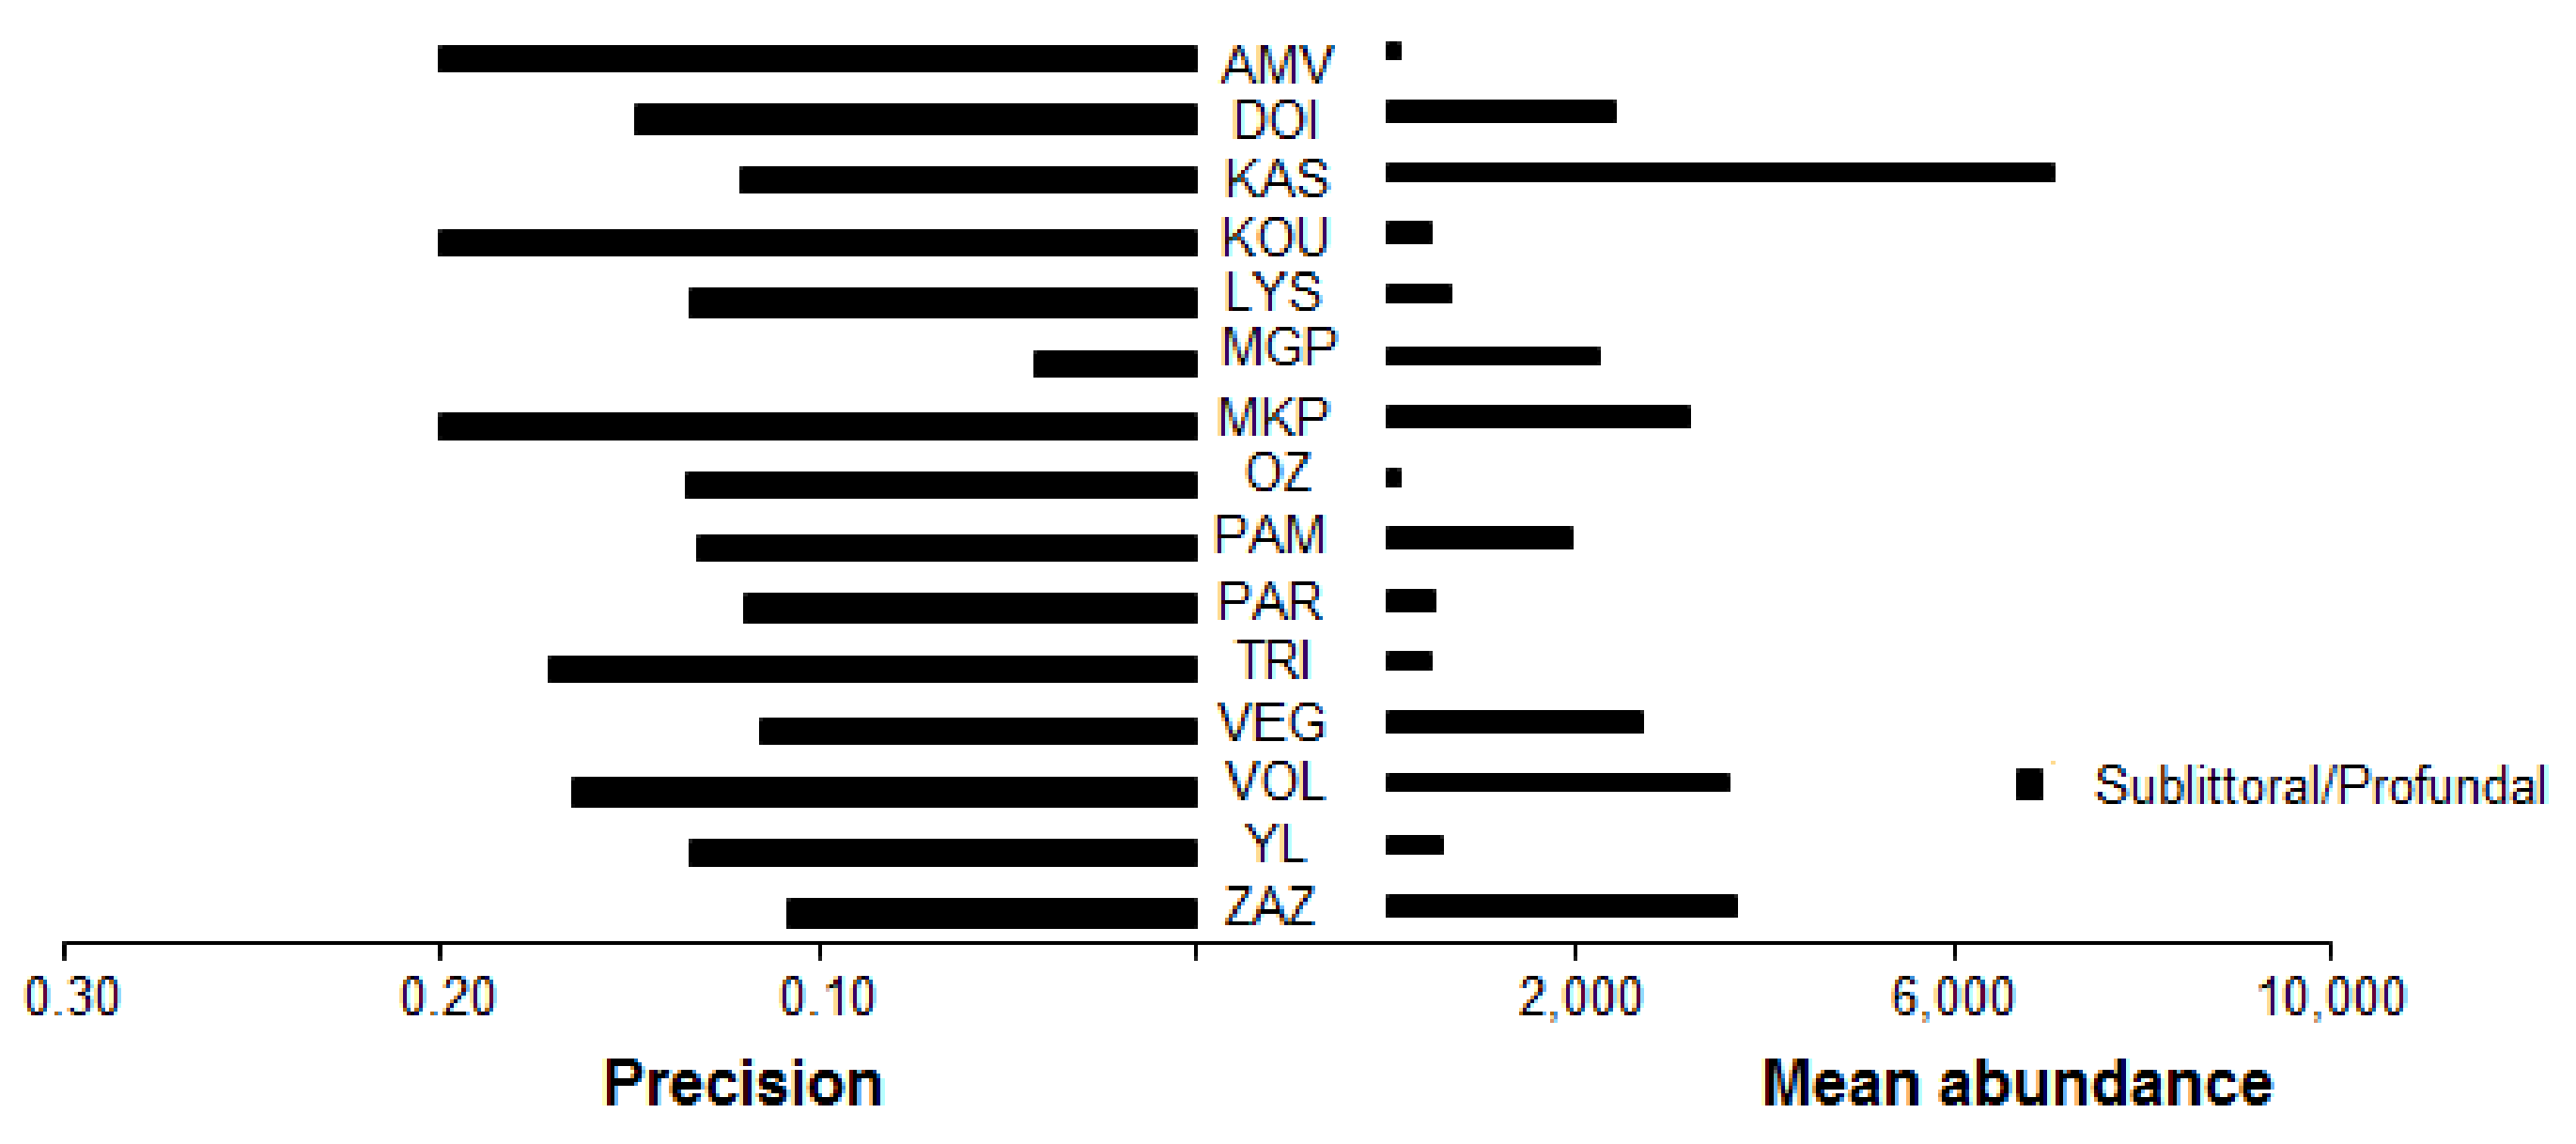
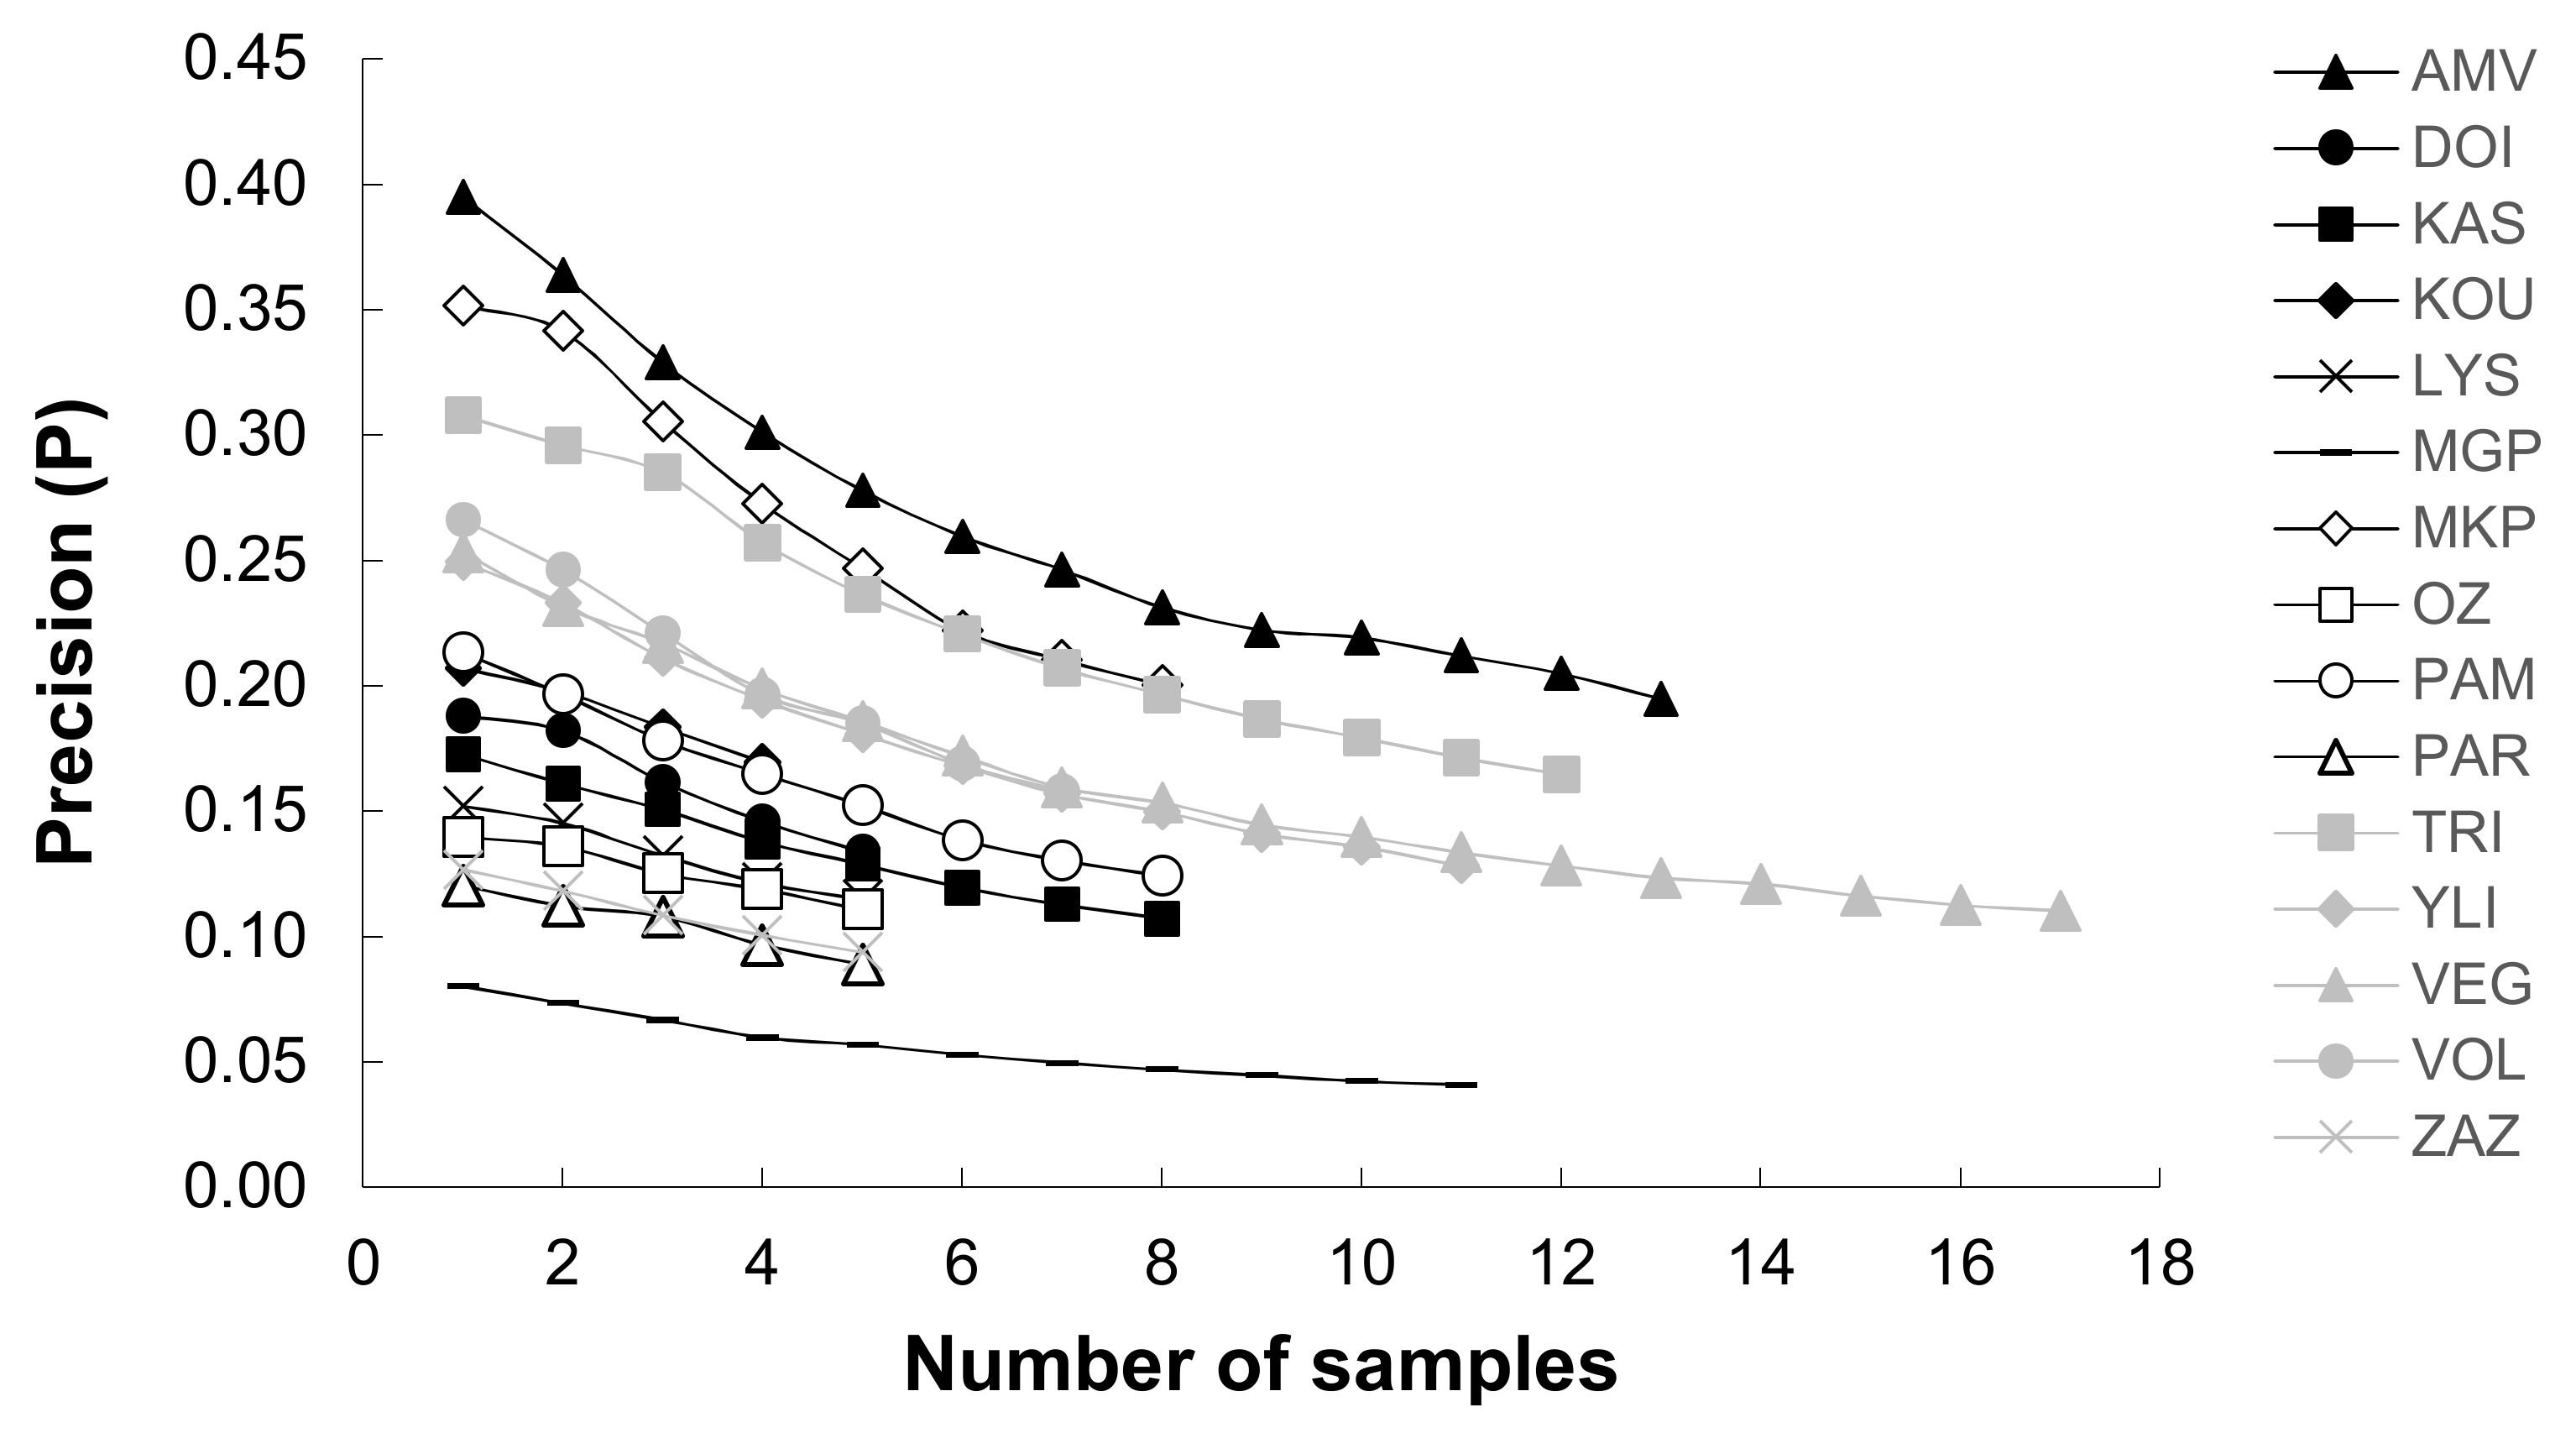
Regarding the sampling effort at the sublittoral/profundal zone, the highest mean abundance of benthic macroinvertebrates was recorded in Lake Kastoria (mean abundance (±SE) 7134.11 ± 832.4 ind/m2), while the lowest was recorded in Lake Ozeros (mean abundance (±SE) 135.67 ± 18.38 ind/m2) (Figure 4). The sampling effort was less than the threshold of 0.2 for all cases, and the mean precision value (±SE) was 0.14 (±0.01) (Figure 4). The bootstrapping analysis showed that the level of precision was increased by increasing the sampling effort (Figure 5). Additionally, in deep lakes (mean depth > 9 m), apart from Lake Megali Prespa, a greater sampling effort is required to obtain more precise estimates than in shallow ones (Figure 5).
3.4. Adequacy of Sampling Effort
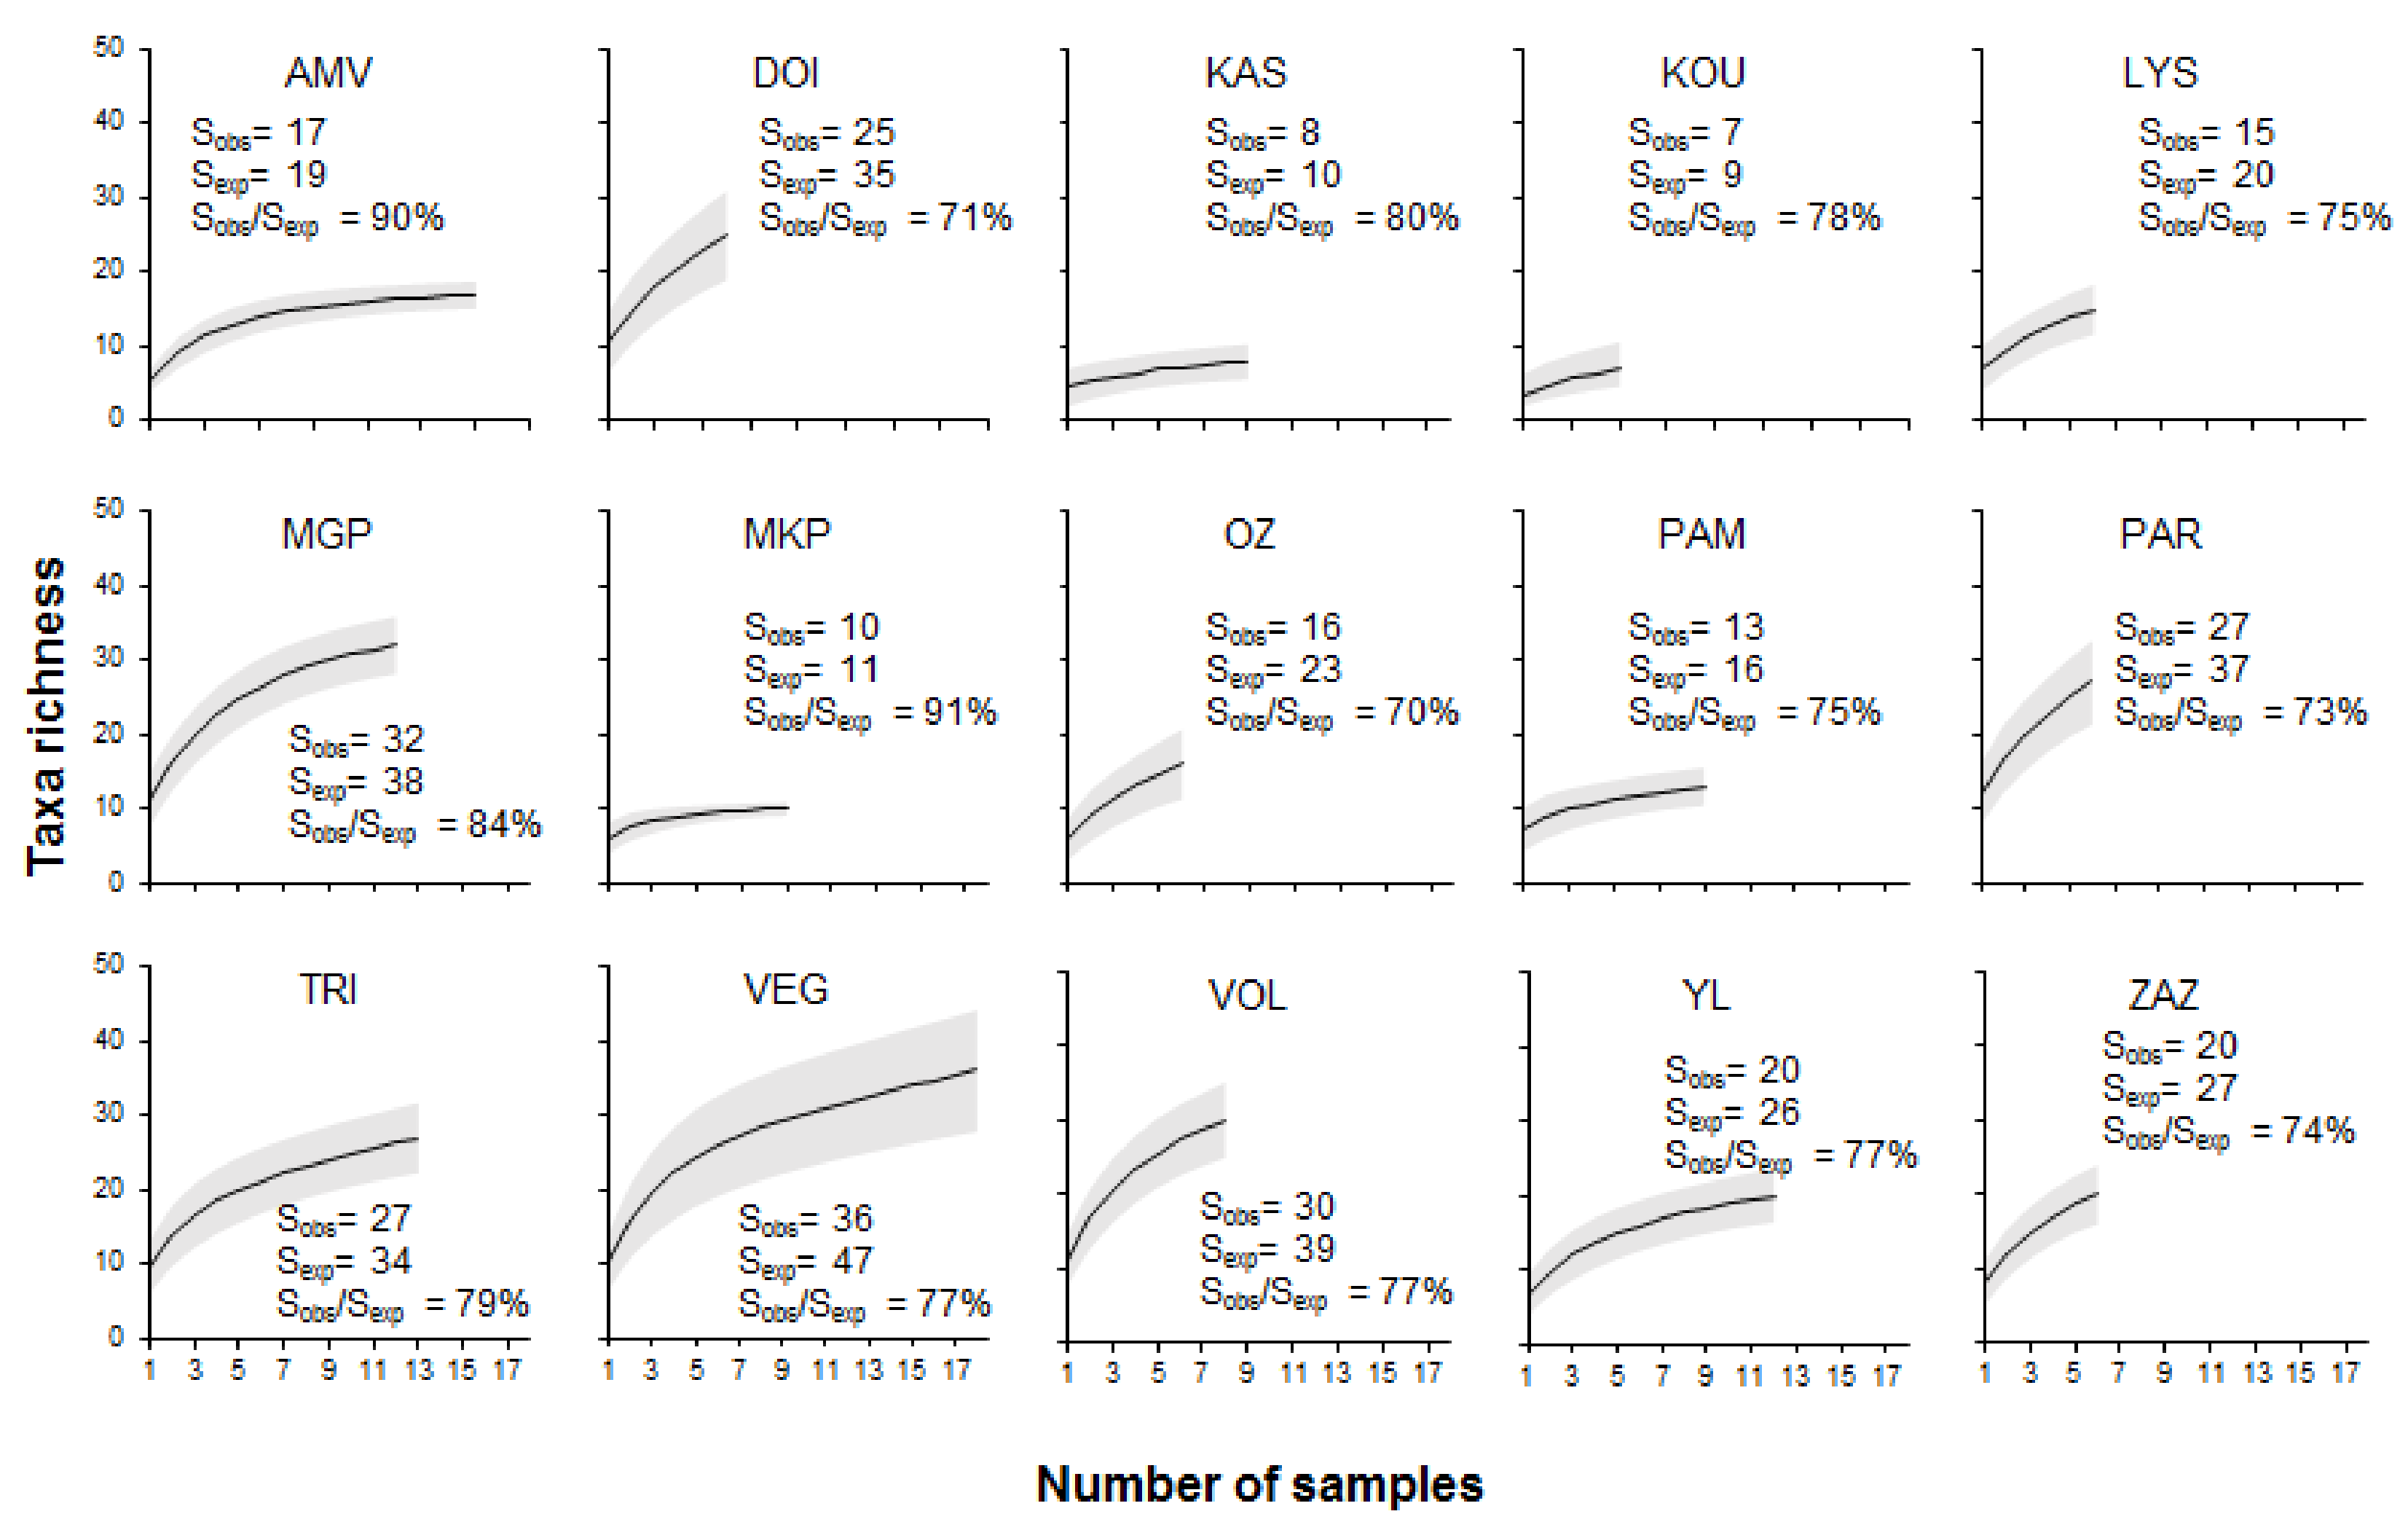
No asymptotes, except for the cases of the lakes Megali Prespa and Amvrakia, were evident in the rarefaction curves based on the total sampling effort (Figure 6). The first-order jackknife estimator showed that the observed richness represented >70% of the estimated total richness in all lakes (Figure 6). However, 90% of the species, which is approximately three taxa less than the total observed, was obtained in 73.9% of all cases.
3.5. Model Development
The model developed for optimal sampling effort, considering a given mean abundance and the desired level of precision, was based on nine pairs of variances (s2) and the mean abundance of benthic macroinvertebrates. The log(s2)−log(mean) regression analysis was statistically significant (p < 0.0001) and explained 86% of the variance (Table 3). The optimal sampling effort can be calculated using the following equation:
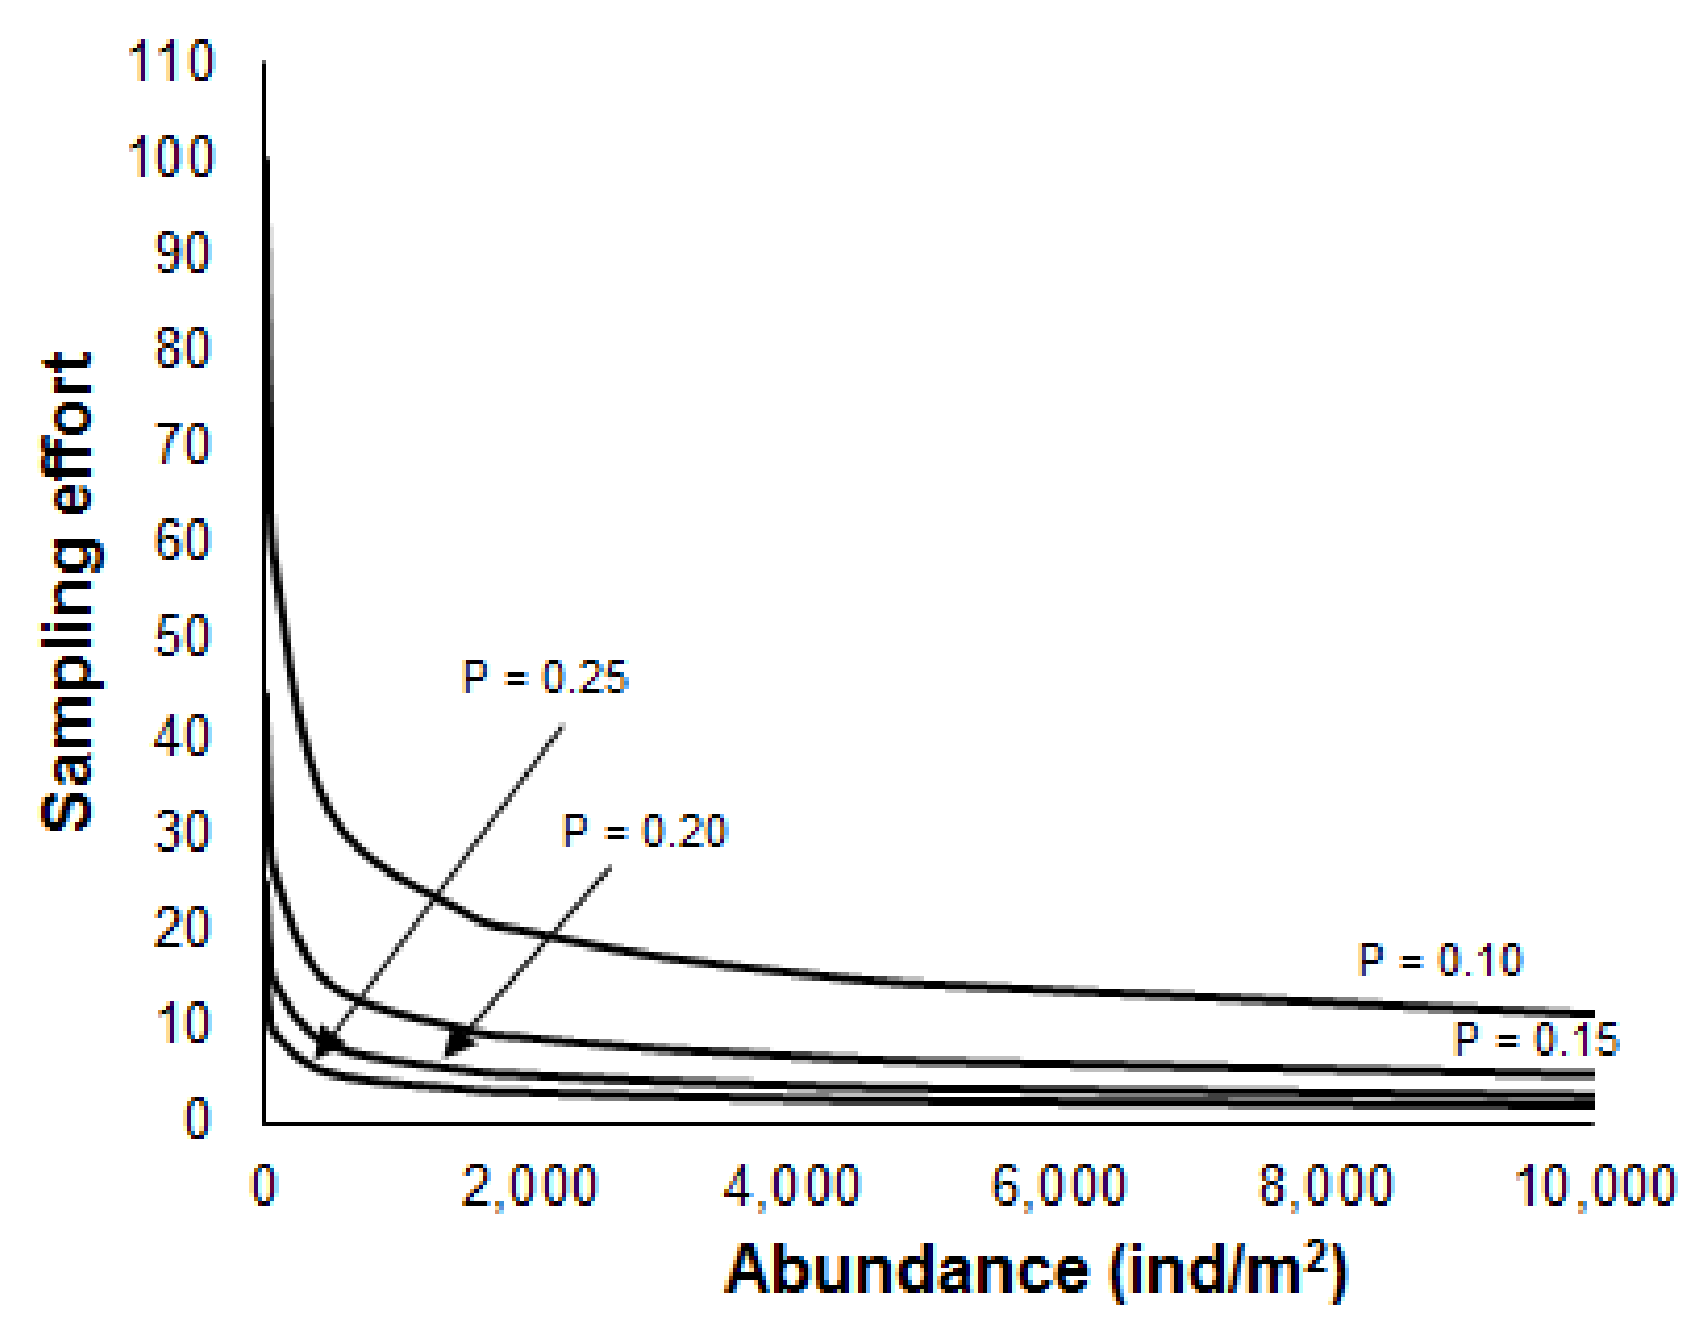
where mean is the mean abundance of benthic macroinvertebrates in the lake, and P is the level of precision. The above equation shows that the number of samples increases as precision is increasing (i.e., lower values of P) (Figure 7), and it can be used to calculate the required number of samples for different abundances and precisions (Table 4). For instance, for the mean abundance of benthic macroinvertebrates of 2000 ind/m2, five samples are required to attain a precision level of 0.2.
4. Discussion
The cost and time constraints are crucial in the design of monitoring programs for assessing the ecological water quality of surface waters under the requirements of the WFD. Frequently, it is necessary to lessen sampling effort and subsequently process samples in a laboratory while maintaining precision in the estimates. The investigation of optimal sampling designs is an essential part of the decision-making procedures for both routine monitoring and ecological studies. Unfortunately, similar studies have overlooked these factors in recent years, and so have tended to draw inaccurate conclusions [24]. The present study highlights a useful process for estimating precise routine monitoring sampling designs in lakes using benthic macroinvertebrates, as is required by the WFD.
The design of lake monitoring samplings using benthic macroinvertebrates generally follows a habitat-specific procedure to overcome natural heterogeneity, especially in the littoral zone [13,52,53]. However, it has been suggested that mesohabitats or proportional composite samples should be applied in the littoral zone as a cost and time efficient approach [15,52]. Sublittoral and profundal zones, which are considered “simple” habitats, mainly consist of soft-bottom substratum with low structural or background variability [54,55]. Our outcomes across a gradient of different morphological lakes indicate that profundal and sublittoral zones dο not differ significantly, possibly due to their similar depths in general. In other studies, the composition of benthic macroinvertebrate communities in sublittoral and profundal zones is considered as a united subsystem as they seem to respond to the same pressures [5,53,56].
Temporal variability also prevents monitoring surveys and is dependent on the time of the year at which the study is conducted (e.g., [57,58]). The changes in the compositions of benthic macroinvertebrate communities are influenced, among other things, by their life cycles, environmental conditions, and competition [14]. The present study showed that benthic fauna of sublittoral/profundal zones in shallow and deep Greek lakes was similar in spring and autumn, indicating low temporal variability. No temporal variability in the composition of lake benthic communities is also referred [59,60,61,62]. Schreiber and Brauns [13] suggested using spring samples to provide a representative view of macroinvertebrate communities due to the negligible compositional dissimilarities between spring and autumn.
The optimal number of samples is the largest achievable; in practice, this usually is constraint by cost and time factors. Thus, it is crucial to evaluate their number that will provide an acceptable level of precision a priori. In general, the precision threshold used for benthic macroinvertebrates is 0.2 [21,26], which means 95% confidence limits of the mean values are ±0.4 or more [25]. In our study, the precision values were lower than this threshold for the sublittoral/profundal zones, revealing that the precision of sampling design was feasible. The bootstrapping analysis indicated that precision is minimized when the sampling effort is reduced and a more intense effort is required in the deep lakes. Precise estimates can also be obtained by reducing the sampling effort by up to two samples in the shallow lakes.
Rarefaction curves are a useful tool for estimating the sampling effort, and thus, they may be helpful for sampling campaigns and monitoring programs. The lack of an asymptote in the rarefaction curves indicates the presence of sporadic species in the samples. The underestimation of taxa richness in lakes, as in rivers, is very common in many cases [12,13,63,64,65]. In freshwater ecosystems, benthic macroinvertebrates are typically a highly diverse group [12] and tend to be dominated by rare species [66,67]. However, it is considered sufficient to record >70% of the estimated species [68], as in the present study. In most cases, the curve slope was smooth, indicating that 90% of the total taxa richness was achieved at 50% of the sampling effort. Steeply increasing curves indicate that more taxa will be recorded with a higher number of samples. However, a larger number of samples is required for species inventories, but it is questionable whether rare species play a crucial role in assessing freshwater ecosystems [69].
Regarding the developed model, parameter α of Taylor’s law is related to sampling conditions and depends on the size of the sampling unit [44]. In this study, the α value (0.399) was lower than the values presented in other studies, i.e., 1.515 [25] and 1.300 [26] (log(x + 1) transformed data), possibly due to the larger sampling area (225 cm2 × three replicates) covered in the present study. Parameter b of Taylor’s law is a distribution factor for populations present in specific environments, following certain sampling procedures [70]. In this study, the estimated b value indicates that benthic macroinvertebrates of Greek lakes have an aggregated distribution (b > 1). Additionally, this value (1.649) was higher than those from lakes in Northern Europe (b = 1.25) [25], but it was within the range of values observed worldwide (1.18–2.38) [26]. The b value depends on the pairs’ variance-mean and the number of samples [45].
It is crucial to know the number of samples required to give an adequate level of precision [71]. In our case, 22 samples were required to collect 30 ind/m2, while other studies mentioned more (62 samples) [25] or less (13 samples) [26] samples for a precision level of 0.2. This difference may be due to the higher abundance of benthic macroinvertebrates recorded in this study (range: 178–8135 ind/m2) compared to others (range: 205–770 ind/m2) [25]. However, this difference is minimized with increasing abundance. Increasing the number of samples usually improves the level of precision, but when the abundance is low (<10 ind/m2), the maximum achieved precision is low [45]. A model of optimal size could be used for monitoring programs or pilot studies to ensure that there is a tolerable level of precision to provide cost and time efficient research.
5. Conclusions
The WFD requires the assessment of the ecological quality of lakes using distinct BQEs, among which are benthic macroinvertebrates. However, the application of this type of assessment is hindered by a lack of information on sampling protocols [72]. Additionally, extensive sampling campaigns increase the necessary cost and time effectiveness for sample collection in the field and sample processing in the laboratory. This study proposes a simple method of estimating the number of benthic macroinvertebrate samples required at four different levels of sampling precision for the sublittoral/profundal zone. Consequently, our framework for calculating the sampling effort may improve the efficiency of routine monitoring programs in other Mediterranean lakes of the same limnological characteristics.
Its applicability to other lake types, such as reservoirs or large oligotrophic lakes from other ecoregions, should be treated with caution as richness patterns may not be the same. In such lakes, the sampling effort may be higher than in the studied lakes. Additionally, considering samplings conducted for other purposes, such as the restoration or the surveying of rare or endangered species, habitat samplings are recommended.
Author Contributions
Conceptualization, C.N., D.B. and M.L.; methodology, C.N.; validation, C.N., D.B. and M.L.; formal analysis, C.N.; investigation, C.N.; data curation, C.N.; writing—original draft preparation, C.N.; writing—review and editing, C.N., D.B. and M.L.; visualization, C.N.; supervision, D.B. All authors have read and agreed to the published version of the manuscript.
Funding
This research received no external funding.
Institutional Review Board Statement
Not applicable.
Data Availability Statement
Data available on request from the authors.
Acknowledgments
We thank the four anonymous reviewers and Dionissis Latinopoulos (Democritus University of Thrace) for their constructive comments.
Conflicts of Interest
The authors declare no conflict of interest.
References
- European Commission. Directive 2000/60/EC of the European Parliament and of the Council of 23 October 2000; Official Journal of European Community: Luxembourg, 2000; pp. 1–72. [Google Scholar]
- Bonada, N.; Prat, N.; Resh, V.H.; Statzner, B. Developments in aquatic insect biomonitoring: A comparative analysis of recent approaches. Annu. Rev. Entomol. 2006, 51, 495–523. [Google Scholar] [CrossRef] [Green Version]
- Carter, J.L.; Resh, V.H. After site selection and before data analysis: Sampling, sorting, and laboratory procedures used in stream benthic macroinvertebrate monitoring programs by USA state agencies. J. N. Am. Benthol. Soc. 2001, 20, 658–682. [Google Scholar] [CrossRef] [Green Version]
- Bartsch, L.A.; Richardson, W.B.; Naimo, T.J. Sampling benthic macroinvertebrates in a large flood-plain river: Considerations of study design, sample size, and cost. Environ. Monit. Assess. 1998, 52, 425–439. [Google Scholar] [CrossRef]
- Bazzanti, M.; Mastrantuono, L.; Solimini, A.G. Selecting macroinvertebrate taxa and metrics to assess eutrophication in different depth zones of Mediterranean lakes. Fundam. Appl. Limnol. 2012, 180, 133–143. [Google Scholar] [CrossRef]
- Miler, O.; Porst, G.; McGoff, E.; Pilotto, F.; Donohue, L.; Jurca, T.; Solimini, A.; Sandin, L.; Irvine, K.; Aroviita, J.; et al. Morphological alterations of lake shores in Europe: A multimetric ecological assessment approach using benthic macroinvertebrates. Ecol. Indic. 2013, 34, 398–410. [Google Scholar] [CrossRef]
- Böhmer, J.; Arbaciauskas, K.; Benstead, R.; Gabriels, W.; Porst, G.; Reeze, B.; Timm, H. Water Framework Directive Intercalibration Technical Report. In Central Baltic Lake Benthic Invertebrate Ecological Assessment Methods; Joint Research Centre of the European Commission: Ispra, Italy, 2014; p. 77. [Google Scholar]
- Urbanič, G. A Littoral Fauna Index for assessing the impact of lakeshore alterations in Alpine lakes. Ecohydrology 2014, 7, 703–716. [Google Scholar] [CrossRef]
- Rossaro, B.; Boggero, A.; Lods-Crozet, B.; Free, G.; Lencioni, V.; Marziali, L.; Wolfram, G. A benthic quality index for European alpine lakes. Fauna Nor. 2012, 31, 95. [Google Scholar] [CrossRef] [Green Version]
- Ntislidou, C.; Lazaridou, M.; Tsiaoussi, V.; Bobori, C.D. A new multimetric macroinvertebrate index for the ecological assessment of Mediterranean lakes. Ecol. Indic. 2018, 93, 1020–1033. [Google Scholar] [CrossRef]
- Silva, D.R.; Ligeiro, R.; Hughes, R.M.; Callisto, M. The role of physical habitat and sampling effort on estimates of benthic macroinvertebrate taxonomic richness at basin and site scales. Environ. Monit Assess. 2016, 188, 340. [Google Scholar] [CrossRef]
- Ramos-Merchante, A.; Prenda, J. Macroinvertebrate taxa richness uncertainty and kick sampling in the establishment of Mediterranean rivers ecological status. Ecol. Indic. 2017, 72, 1–12. [Google Scholar] [CrossRef]
- Schreiber, J.; Brauns, M. How much is enough? Adequate sample size for littoral macroinvertebrates in lowland lakes. Hydrobiologia 2010, 649, 365–373. [Google Scholar] [CrossRef]
- Jónasson, P.M. Benthic Invertebrates. In The Lakes Handbook: Limnology and Limnetic Ecology, 1st ed.; Sullivan, P.E., Reynolds, C.S., Eds.; Wiley-Blackwell: Oxford, UK, 2004; pp. 341–416. [Google Scholar]
- Porst, G.; Miler, O.; Donohue, L.; Jurca, T.; Pilotto, F.; Brauns, M.; Solimini, A.; Pusch, M. Efficient sampling methodologies for lake littoral invertebrates in compliance with the European Water Framework Directive. Hydrobiologia 2016, 767, 207–220. [Google Scholar] [CrossRef] [Green Version]
- Cai, Y.; Zhang, Y.; Hu, Z.; Deng, J.; Qin, B.; Yin, H.; Wang, X.; Gong, Z.; Heino, J. Metacommunity ecology meets bioassessment: Assessing spatio-temporal variation in multiple facets of macroinvertebrate diversity in human-influenced large lakes. Ecol. Indic. 2019, 103, 713–721. [Google Scholar] [CrossRef]
- Solimini, A.G.; Ruggiero, A.; Bernardini, V.; Carchini, G. Temporal pattern of macroinvertebrate diversity and production in a new man made shallow lake. Hydrobiologia 2003, 506, 373–379. [Google Scholar] [CrossRef]
- Mastrantuono, L.; Solimini, A.G.; Nõges, P.; Bazzanti, M. Plant-associated invertebrates and hydrological balance in the large volcanic Lake Bracciano (Central Italy) during two years with different water levels. In European Large Lakes Ecosystem Changes and Their Ecological and Socioeconomic Impacts, 1st ed.; Nõges, T., Eckmann, R., Kangur, K., Nõges, P., Reinart, A., Roll, G., Simola, H., Viljanen, M., Eds.; Springer: Dordrecht, The Netherlands, 2007; pp. 143–152. [Google Scholar]
- Brauns, M.; Garcia, X.F.; Walz, N.; Pusch, M.T. Effects of human shoreline development on littoral macroinvertebrates in lowland lakes. J. Appl. Ecol. 2007, 44, 1138–1144. [Google Scholar] [CrossRef]
- Solimini, A.G.; Sandin, L. The importance of spatial variation of benthic invertebrates for the ecological assessment of European lakes. Fundam. Appl. Limnol. 2012, 180, 85–89. [Google Scholar] [CrossRef]
- Bros, W.E.; Cowell, B.C. A technique for optimizing sample size (replication). J. Exp. Mar. Biol. Ecol. 1987, 114, 63–71. [Google Scholar] [CrossRef]
- Tsalkitzis, E.; Yan, N.D.; McQueen, D.J.; Popiel, S.A.; Demers, E. Habitat separation among three temperate Chaoborus species. Arch. Hydrobiol. 1994, 129, 385–403. [Google Scholar]
- Evans, M.S.; Sell, D.W. Zooplankton sampling strategies for environmental studies. Hydrobiologia 1983, 99, 215–223. [Google Scholar] [CrossRef]
- Baring, R.J.; Lester, R.E.; Fairweather, P.G. Establishing precise estimates of abundance in patchy habitats of the marine nearshore. Mar. Environ. Res. 2016, 120, 68–77. [Google Scholar] [CrossRef]
- Veijola, H.; Meriläinen, J.J.; Marttila, V. Sample size in the monitoring of benthic macrofauna in the profundal of lakes: Evaluation of the precision of estimates. In Hydrobiologia, Proceedings of The First International Lake Ladoga Symposium, St. Petersburg, Russia, 22–26 November 1993, 1st ed.; Simola, H., Viljanen, M., Slepukhina, T., Murthy, R., Eds.; Springer: Dordrecht, The Netherlands, 1996; pp. 301–315. [Google Scholar]
- Downing, J.A. Aggregation, transformation, and the design of benthos sampling programs. Can. J. Fish. Aquat. 1979, 36, 1454–1463. [Google Scholar] [CrossRef]
- Canton, S.P.; Chadwick, J.W. Variability in benthic invertebrate density estimates from stream samples. J. Freshw. Ecol. 1988, 4, 291–297. [Google Scholar] [CrossRef]
- Taylor, L.R. Aggregation, variance and the mean. Nature 1961, 189, 732–735. [Google Scholar] [CrossRef]
- Monaghan, K.A. Taylor’s Law improves the accuracy of bioassessment; An example for freshwater macroinvertebrates. Hydrobiologia 2015, 760, 91–103. [Google Scholar] [CrossRef]
- Downing, J.A.; Cyr, H. Quantitative estimation of epiphytic invertebrate populations. Can. J. Fish. Aquat. 1985, 42, 1570–1579. [Google Scholar] [CrossRef]
- Morin, A. Variability of density estimates and the optimization of sampling programs for stream benthos. Can. J. Fish. Aquat. 1985, 42, 1530–1534. [Google Scholar] [CrossRef]
- Petriki, O.; Stergiou, K.I.; Bobori, D.C. Can fish sampling protocol (CEN, 2005) be amended for Mediterranean lakes? Fish. Manag. Ecol. 2017, 24, 146–155. [Google Scholar] [CrossRef]
- Mavromati, E.; Kagalou, I.; Kemitzoglou, D.; Apostolakis, A.; Seferlis, M.; Tsiaoussi, V. Relationships among land use patterns, hydromorphological features and physicochemical parameters of surface waters: WFD lake monitoring in Greece. Environ. Process. 2018, 5, 139–151. [Google Scholar] [CrossRef]
- Petriki, O.; Lazaridou, M.; Bobori, D.C. A fish-based index for the assessment of the ecological quality of temperate lakes. Ecol. Indic. 2017, 78, 556–565. [Google Scholar] [CrossRef]
- Boggero, A.; Zaupa, S.; Rossaro, B.; Lencioni, V.; Marziali, L.; Buzzi, F.; Fiorenza, A.; Cason, M.; Giacomazzi, F.; Pozzi, S. Protocollo di Campionamento e Analisi dei Macroinvertebrati Negli Ambienti Lacustri; MATTM-APAT: Roma, Italy, 2013; p. 17. [Google Scholar]
- Mavromati, E.; Kemitzoglou, D.; Tsiaoussi, V.; Lazaridou, M. Report on the Development of the National Method for the Assessment of Ecological Status of Natural Lakes in Greece, with the Use of Littoral Benthic Invertebrates; Greek Biotope/Wetland Centre and Special Secretariat for the Natural Environment and Waters, Ministry of Environment and Energy: Thermi, Greece, 2020; p. 11.
- Álvarez Cobelas, M.; Rojo, C.; Angeler, D.G. Mediterranean limnology: Current status, gaps and the future. J. Limnol. 2005, 64, 13–29. [Google Scholar] [CrossRef] [Green Version]
- Naselli-Flores, L.; Barone, R. Water-level fluctuations in Mediterranean reservoirs: Setting a dewatering threshold as a management tool to improve water quality. Hydrobiologia 2005, 548, 85–99. [Google Scholar] [CrossRef]
- Zohary, T.; Ostrovsky, I. Ecological impacts of excessive water level fluctuations in stratified freshwater lakes. Inland Waters 2011, 1, 47–59. [Google Scholar] [CrossRef]
- Gabriels, W.; Lock, K.; De Pauw, N.; Goethals, P.L. Multimetric Macroinvertebrate Index Flanders (MMIF) for biological assessment of rivers and lakes in Flanders (Belgium). Limnologica 2010, 40, 199–207. [Google Scholar] [CrossRef] [Green Version]
- ISO. Water Quality—Guidelines for the Selection of Sampling Methods and Devices for Benthic Macroinvertebrates in Fresh Waters; 10870:2012; ISO: Geneva, Switzerland, 2012; p. 34. [Google Scholar]
- Clarke, K.R.; Gorley, R.N. PRIMER v6: User Manual Tutorial, 1st ed.; PRIMER-E Ltd.: Plymouth, UK, 2006; pp. 1–193. [Google Scholar]
- Clarke, K.R.; Warwick, R.M. A further biodiversity index applicable to species lists: Variation in taxonomic distinctness. Mar. Ecol. Prog. Ser. 2001, 216, 265–278. [Google Scholar] [CrossRef]
- Elliott, J.M. Some Methods for the Statistical Analysis of Benthic Invertebrates, 2nd ed.; Freshwater Biological Association: London, UK, 1977; pp. 1–159. [Google Scholar]
- Downing, J.A. Precision of the mean and the design of benthos sampling programmes: Caution revised. Mar. Biol. 1989, 103, 231–234. [Google Scholar] [CrossRef]
- Morales, M.; Morales, M.M. Package ‘sciplot’. Available online: https://cran.r-project.org/web/packages/sciplot/index.html (accessed on 12 March 2020).
- EstimateS: Statistical Estimation of Species Richness and Shared Species from Samples. Available online: http://purl.oclc.org/estimates (accessed on 20 March 2019).
- Gotelli, N.J.; Colwell, R.K. Quantifying biodiversity: Procedures and pitfalls in the measurement and comparison of species richness. Ecol. Lett. 2001, 4, 379–391. [Google Scholar] [CrossRef] [Green Version]
- Downing, J.A. Spatial heterogeneity: Evolved behaviour or mathematical artefact? Nature 1986, 323, 255. [Google Scholar] [CrossRef]
- Taylor, L.R.; Perry, J.N.; Woiwod, I.P.; Taylor, R.A.J. Specificity of the spatial power-law exponent in ecology and agriculture. Nature 1988, 332, 721. [Google Scholar] [CrossRef]
- Newman, M.C. Regression analysis of log-transformed data: Statistical bias and its correction. Environ. Toxicol. Chem. 1993, 12, 1129–1133. [Google Scholar] [CrossRef]
- White, J.; Irvine, K. The use of littoral mesohabitats and their macroinvertebrate assemblages in the ecological assessment of lakes. Aquat. Conserv. 2003, 13, 331–351. [Google Scholar] [CrossRef]
- Brinkhurst, R.O. The Benthos of Lakes, 1st ed.; Macmillan International Higher Education: London, UK, 1975; pp. 1–195. [Google Scholar]
- Pilotto, F.; Free, G.; Cardoso, A.C.; Wolfram, G.; Solimini, A.G. Spatial variance of profundal and sublittoral invertebrate benthic communities in response to eutrophication and morphological pressures. Fundam. Appl. Limnol. 2012, 180, 101–110. [Google Scholar] [CrossRef]
- Johnson, R.K. Spatiotemporal variability of temperate lake macroinvertebrate communities: Detection of impact. Ecol. Appl. 1998, 8, 61–70. [Google Scholar] [CrossRef]
- Stendera, S.; Johnson, R.K. Habitat-specific stability and persistence of benthic invertebrate communities in boreal lakes. Fundam. Appl. Limnol. 2008, 171, 311–322. [Google Scholar] [CrossRef]
- Bazzanti, M.; Mastrantuono, L.; Pilotto, F. Depth-related response of macroinvertebrates to the reversal of eutrophication in a Mediterranean lake: Implications for ecological assessment. Sci. Total Environ. 2017, 579, 456–465. [Google Scholar] [CrossRef]
- White, J. The potential use of macroinvertebrates in the assessment of lake water quality. Int. Ver. Theor. Angew. Limnol. Verh. 2001, 27, 3527–3532. [Google Scholar] [CrossRef]
- Ntislidou, C.; Rossaro, B.; Lazaridou, M.; Bobori, D.C. What drives benthic macroinvertebrate dispersal in different lake substrata? The case of three Mediterranean lakes. Aquat. Ecol. 2021. (under review). [Google Scholar]
- Bobori, C.D.; Salvarina, I. Report of Benthic Macroinvertebrates from Soft Sediment in Lake Doirani; Aristotle University of Thessaloniki: Thessaloniki, Greece, 2007; p. 53. [Google Scholar]
- Brauns, M.; Garcia, X.-F.; Pusch, M.T.; Walz, N. Eulittoral macroinvertebrate communities of lowland lakes: Discrimination among trophic states. Freshw. Biol. 2007, 52, 1022–1032. [Google Scholar] [CrossRef]
- Brauns, M.; Garcia, X.-F.; Pusch, M.T. Potential effects of water-level fluctuations on littoral invertebrates in lowland lakes. Hydrobiologia 2008, 613, 5–12. [Google Scholar] [CrossRef]
- Ram, J.L.; Banno, F.; Gala, R.R.; Gizicki, J.P.; Kashian, D.R. Estimating sampling effort for early detection of non-indigenous benthic species in the Toledo Harbor Region of Lake Erie. Manag. Biol. Invasions 2014, 5, 209–216. [Google Scholar] [CrossRef] [Green Version]
- Árva, D.; Specziár, A.; Erős, T.; Tóth, M. Effects of habitat types and within lake environmental gradients on the diversity of chironomid assemblages. Limnologica 2015, 53, 26–34. [Google Scholar] [CrossRef] [Green Version]
- Cai, Y.; Zhang, Y.; Wu, Z.; Chen, Y.; Xu, J.; Gong, Z. Composition, diversity, and environmental correlates of benthic macroinvertebrate communities in the five largest freshwater lakes of China. Hydrobiologia 2016, 788, 85–98. [Google Scholar] [CrossRef]
- Nijboer, R.C.; Verdonschot, P.F. Rare and common macroinvertebrates: Definition of distribution classes and their boundaries. Arch. Hydrobiol. 2004, 161, 45–64. [Google Scholar] [CrossRef]
- Cucherousset, J.; Santoul, F.; Figuerola, J.; Céréghino, R. How do biodiversity patterns of river animals emerge from the distributions of common and rare species? Biol. Conserv. 2008, 141, 2984–2992. [Google Scholar] [CrossRef] [Green Version]
- Wilson, R.J.; Gutierrez, D.; Gutierrez, J.; Monserrat, V.J. An elevational shift in butterfly species richness and composition accompanying recent climate change. Glob. Chang. Biol. 2007, 13, 1873–1887. [Google Scholar] [CrossRef]
- Cao, Y.; Williams, D.D.; Williams, N.E. How important are rare species in aquatic community ecology and bioassessment? Limnol. Oceanogr. 1998, 43, 1403–1409. [Google Scholar] [CrossRef]
- Meire, P.M.; Dereu, J.P.J.; Van der Meer, J.; Develter, D.W.G. Aggregation of littoral macrobenthic species: Some theoretical and practical considerations. Hydrobiologia 1989, 175, 137–148. [Google Scholar] [CrossRef]
- Downing, J.A.; Anderson, M.R. Estimating the standing biomass of aquatic macrophytes. Can. J. Fish. Aquat. 1985, 42, 1860–1869. [Google Scholar] [CrossRef]
- Solheim, A.L.; Rekolainen, S.; Moe, S.J.; Carvalho, L.; Phillips, G.; Ptacnik, R.; Penning, W.E.; Toth, L.G.; O’Toole, C.; Schartau, A.K.L.; et al. Ecological threshold responses in European lakes and their applicability for the Water Framework Directive (WFD) implementation: Synthesis of lakes results from the REBECCA project. Aquat. Ecol. 2008, 42, 317–334. [Google Scholar] [CrossRef]
Figure 1.
Studied lakes. Abbreviations as in Table 1.
Figure 1.
Studied lakes. Abbreviations as in Table 1.

Figure 2.
(a) Taxa richness and (b) abundance of benthic macroinvertebrates per lake zone (sublittoral and profundal) and in the combined sublittoral/profundal zone.
Figure 2.
(a) Taxa richness and (b) abundance of benthic macroinvertebrates per lake zone (sublittoral and profundal) and in the combined sublittoral/profundal zone.

Figure 3.
Non-metric multidimensional scaling (MDS) plot of the benthic macroinvertebrate community composition between (a) lake zones (sublittoral and profundal); (b) seasons (spring and autumn); and (c) among lakes in the studied lakes.
Figure 3.
Non-metric multidimensional scaling (MDS) plot of the benthic macroinvertebrate community composition between (a) lake zones (sublittoral and profundal); (b) seasons (spring and autumn); and (c) among lakes in the studied lakes.

Figure 4.
Mean abundance of benthic macroinvertebrates and precision (P) for the sublittoral/profundal zone.
Figure 4.
Mean abundance of benthic macroinvertebrates and precision (P) for the sublittoral/profundal zone.

Figure 5.
Average coefficient of precision estimated by bootstrapping at the sublittoral/profundal zone in accordance with the sampling effort.
Figure 5.
Average coefficient of precision estimated by bootstrapping at the sublittoral/profundal zone in accordance with the sampling effort.

Figure 6.
Taxa rarefaction curves at the sublittoral/profundal zone. Observed (Sobs) and estimated (Sexp) taxa richness based on the first-order Jackknife estimator. The gray section represents the ±95% confidence interval.
Figure 6.
Taxa rarefaction curves at the sublittoral/profundal zone. Observed (Sobs) and estimated (Sexp) taxa richness based on the first-order Jackknife estimator. The gray section represents the ±95% confidence interval.

Figure 7.
Estimation of the sampling effort (number of samples) in relation to the desired level of precision (p values are given aside of each curve) and the expected mean abundance of benthic macroinvertebrates (ind/m2).
Figure 7.
Estimation of the sampling effort (number of samples) in relation to the desired level of precision (p values are given aside of each curve) and the expected mean abundance of benthic macroinvertebrates (ind/m2).


Table 1.
Limnological characteristics of the studied lakes. Alt: Altitude, Dm: mean depth, Dmax: maximum depth, La: lake area, TP: Total Phosphorus, OL: oligotrophic, MT: mesotrophic, ET: eutrophic, HY: hypertrophic, WMM: warm monomictic, PM: polymictic.
Table 1.
Limnological characteristics of the studied lakes. Alt: Altitude, Dm: mean depth, Dmax: maximum depth, La: lake area, TP: Total Phosphorus, OL: oligotrophic, MT: mesotrophic, ET: eutrophic, HY: hypertrophic, WMM: warm monomictic, PM: polymictic.
| Lake | Abbreviation | Alt (m.a.s.l.) | Dm (m) a | Dmax (m) a | La (km2) a | Trophic Status b | Lake Type a | TP (μg/L) a | Artificial Surfaces (%) | Agricultural Areas (%) |
|---|---|---|---|---|---|---|---|---|---|---|
| Amvrakia | AMV | 16 | 23.7 | 55.5 | 12.7 | MT | MM | 13.97 | 4.1 | 28.8 |
| Doirani | DOI | 142 | 4.5 | 5.5 | 32.4 * | ET | PM | 31.20 | 2.6 | 33.7 |
| Kastorias | KAS | 630 | 3.7 | 9.1 | 31.0 | ET | PM | 32.00 | 2.4 | 33.8 |
| Kourna | KOU | 16 | 15.0 | 22.5 | 0.6 | OL | MM | 7.00 | 0.0 | 5.5 |
| Lysimachia | LYS | 16 | 3.5 | 7.7 | 13.0 | ET | PM | 133.65 | 6.1 | 54.8 |
| Megali Prespa | MGP | 852 | 17.0 | 55.0 | 274.0 * | MT | MM | 25.56 | 0.5 | 14.4 |
| Mikri Prespa | MKP | 853 | 3.9 | 8.4 | 46.6 * | ET | PM | 34.63 | 0.0 | 13.4 |
| Ozeros | OZ | 22 | 3.8 | 6.1 | 10.4 | ET | PM | 29.07 | 1.8 | 52.7 |
| Pamvotis | PAM | 470 | 5.5 | 9.1 | 22.8 | ET-HP | PM | 157.47 | 12.1 | 37.6 |
| Paralimni | PAR | 31 | 4.9 | 12.5 | 10.5 | OL-MT | PM | 13.24 | 1.0 | 20.9 |
| Trichonis | TRI | 18 | 29.5 | 57.0 | 93.3 | OL-MT | MM | 13.43 | 2.0 | 39.0 |
| Vegoritis | VEG | 510 | 26.1 | 52.4 | 47.4 | MT-ET | MM | 30.38 | 7.9 | 35.6 |
| Volvi | VOL | 37 | 12.5 | 27.3 | 72.9 | ET | MM | 64.95 | 1.5 | 43.4 |
| Yliki | YL | 80 | 20.9 | 38.5 | 21.6 | OL-MT | MM | 15.00 | 5.1 | 56.7 |
| Zazari | ZAZ | 602 | 2.7 | 8.1 | 1.7 | ET | PM | 670.33 | 2.3 | 33.7 |
Table 2.
Sampling effort (number of sites) conducted in each lake.
| Lake | Lake Zones | |
|---|---|---|
| Sublittoral | Profundal | |
| AMV | 5 | 8 |
| DOI | 3 | 3 |
| KAS | 3 | 6 |
| KOU | 2 | 3 |
| LYS | 3 | 3 |
| MGP | 6 | 6 |
| MKP | 3 | 6 |
| OZ | 3 | 3 |
| PAM | 3 | 6 |
| PAR | 3 | 3 |
| TRI | 4 | 9 |
| VEG | 9 | 9 |
| VOL | 3 | 5 |
| YL | 7 | 5 |
| ZAZ | 3 | 3 |
Table 3.
Parameters of the linear regressions between the sample variance (log(s2)) and the mean abundance of benthic macroinvertebrates (log(mean)).
Table 3.
Parameters of the linear regressions between the sample variance (log(s2)) and the mean abundance of benthic macroinvertebrates (log(mean)).
| Regression | n | a | b | R2 | MSE | p |
|---|---|---|---|---|---|---|
| Log(s2) − log (mean) | 9 | 0.399 | 1.649 | 0.86 | 0.06 | 0.0001 |
Table 4.
Number of samples required for a given abundance of benthic macroinvertebrates (ind/m2) to attain the desired level of precision (P).
Table 4.
Number of samples required for a given abundance of benthic macroinvertebrates (ind/m2) to attain the desired level of precision (P).
| Abundance (ind/m2) | Number of Samples | |||
|---|---|---|---|---|
| P = 0.10 | P = 0.15 | P = 0.20 | P = 0.25 | |
| 30 | 87 | 38 | 22 | 14 |
| 50 | 72 | 32 | 18 | 12 |
| 100 | 57 | 25 | 14 | 9 |
| 300 | 39 | 17 | 10 | 6 |
| 500 | 32 | 14 | 8 | 5 |
| 1000 | 25 | 11 | 6 | 4 |
| 5000 | 14 | 6 | 4 | 2 |
| 10,000 | 11 | 5 | 3 | 2 |
Publisher’s Note: MDPI stays neutral with regard to jurisdictional claims in published maps and institutional affiliations. |
© 2021 by the authors. Licensee MDPI, Basel, Switzerland. This article is an open access article distributed under the terms and conditions of the Creative Commons Attribution (CC BY) license (https://creativecommons.org/licenses/by/4.0/).
Share and Cite
MDPI and ACS Style
Ntislidou, C.; Bobori, D.; Lazaridou, M. Suggested Sampling Methodology for Lake Benthic Macroinvertebrates under the Requirements of the European Water Framework Directive. Water 2021, 13, 1353. https://doi.org/10.3390/w13101353
AMA Style
Ntislidou C, Bobori D, Lazaridou M. Suggested Sampling Methodology for Lake Benthic Macroinvertebrates under the Requirements of the European Water Framework Directive. Water. 2021; 13(10):1353. https://doi.org/10.3390/w13101353
Chicago/Turabian StyleNtislidou, Chrysoula, Dimitra Bobori, and Maria Lazaridou. 2021. "Suggested Sampling Methodology for Lake Benthic Macroinvertebrates under the Requirements of the European Water Framework Directive" Water 13, no. 10: 1353. https://doi.org/10.3390/w13101353
Note that from the first issue of 2016, this journal uses article numbers instead of page numbers. See further details here.